-
气溶胶颗粒物作为大气的重要组分,对气候演化和环境变化等方面有着重要影响. 大气颗粒物的散射效应使到达地球表面的太阳辐射减少,其降温效应可以部分抵消人类排放的温室气体所导致的全球变暖[1]. 气溶胶颗粒物可以成为云凝结核,进而影响到云和降水的物理过程[2]. 研究表明,三极地区对大气气溶胶的变化更为敏感[3]. 大气颗粒物沉降在青藏高原冰雪表面,促进冰雪的消融[4-5]. 青藏高原上黑碳(BC)和沙尘导致反射率降低约38%,造成的总辐射强迫约为18—32 W·m-2[6]. 高原南部扎当冰川上,BC和沙尘对老雪融化的贡献约为9%[7]. 藏东南冰川变化的研究表明,吸光性颗粒物对冰川融化的贡献为15%[8]. 数值模拟实验表明季风前期青藏高原南坡堆积的吸收性气溶胶加热大气形成热泵效应,导致雨季的提前和南亚夏季风的加剧[9]. Cong等发现珠峰北坡气溶胶中二羧酸与生物质燃烧指示物左旋葡聚糖和K+存在明显正相关关系,表明南亚的碳质气溶胶可以通过大尺度环流和局地山谷环流传输到青藏高原[10],大气观测、冰雪冰芯样品和模式模拟显示BC、重金属如汞、有机污染物POPs和微塑料能够跨境传输到青藏高原内部并对环境产生影响[11-14]. 南亚大气棕色云使低层大气变暖的程度和大气气溶胶相同,两者可以使气温在10年内增加0.25 K[15].
青藏高原北邻塔克拉玛干沙漠,西南部是塔尔沙漠,这些地区是青藏高原粉尘的潜在源区. 青藏高原东邻我国人口集中的地区,南邻南亚发展中国家,人为气溶胶也对青藏高原造成了影响. 目前对青藏高原大气颗粒物的研究主要有以下几种手段:1)对冰川区的冰雪及冰芯进行采样,分析微粒物化特征[16-18];2)利用卫星遥感等手段对大气气溶胶光学特征进行监测[19-20];3)直接采集大气气溶胶样品和定点监测[21-22]. 不同的研究手段有不同的利弊,冰芯记录侧重于过去大气粉尘的研究,通常为长期变化趋势;卫星监测和数据模拟可以在长时间和大尺度获取大气气溶胶浓度、光学性质等的信息,成为区域研究的重要工具[23]. 由于青藏高原复杂的地形和地表非均质反射,使得模拟结果和实地监测结果或多或少有偏差[24-25]. 研究表明MODIS AOD数据在拉萨不具有适用性,在高原东部的应用表明数据精度相对较低[26-27]. Sharma等对喜马拉雅地区气溶胶的模拟数值普遍低于实测值[5].
因此,急需地面观测气溶胶颗粒物数据对卫星监测和数值模拟数据来进行验证和校正. 高原西部大气颗粒物的监测数据较少,阿里地区地面实测数据的增加,给高原大气气溶胶的卫星监测和数据模拟研究提供了支撑和验证数据. 本文在大气颗粒物在线观测数据的基础上,获得阿里站大气颗粒物的浓度水平,进而分析其季节变化的基本特征,并综合运用HYSPLIT模型的聚类分析、潜在源贡献因子分析(PSCF)和浓度权重轨迹分析(CWT)方法,分析各个季节阿里站大气气溶胶的输送路径和可能来源,为青藏高原尤其是其西部地区的大气颗粒物研究提供数据支撑.
-
监测地点位于西藏自治区阿里地区日土县的中国科学院阿里荒漠环境综合观测研究站,地理位置为东经79.70°,北纬33.39°,海拔高度4270 m. 位于班公湖南部盆地. 整体自然环境为高寒荒漠. 研究期间,阿里站的平均气温为1.38 ℃,相对湿度为32%. 年降水量为161.24 mm,83%集中在7、8月份. 植被稀疏,归一化植被指数(NDVI)小于0.2.
-
监测仪器为德国GRIMM公司生产的EDM365颗粒物在线监测仪,该仪器提供31个粒径通道的颗粒物数浓度,同时给出PM10、PM2.5、PM1(空气动力学粒径)的质量浓度. 样气通过Nafion管自动启动除湿功能. 原始数据的时间分辨率设定为5 min,在剔除异常值的基础上,将质量浓度数据依次合并成逐时算术平均值、逐日算术平均值和逐月算术平均值.
-
由于阿里站气象数据缺失较多,再分析数据和气象数据的拟合较好,因此除了湿度和降水数据来自阿里站气象数据,其他气象数据来自ERA5再分析结果,下载地址为(https://cds.climate.copernicus.eu/cdsapp#!/search?type=dataset). 归一化植被指数(NDVI)数据来自MODIS的MOD13Q1影像(时间分辨率为16 d,空间分辨率为250 m). 气溶胶光学厚度(AOD)数据来自MODIS的MCD19A2影像(时间分辨率为1 d,空间分辨率为1 km). 对数据的处理和分析主要用到Excel、Spss、ArcGis和Matlab等软件,对数据的绘图用的是Origin软件. 后向轨迹分析、PSCF分析、CWT分析用的数据为美国国家环境预报中心(NCEP) 的全球资料同化系统(GDAS) 数据,使用的软件为TrajStat. 根据青藏高原地区的大气环流特征将研究时段划分为四个季节:冬季(2018-12-01至2019-02-28),季风前期(2019-03-01至2019-05-31),季风期(2019-06-01至2019-09-30),以及季风后期(2019-10-01至2019-11-30).
-
仪器监测数据的时段为2018-12-01至2019-11-30. 在监测期间,阿里站PM10的日均质量浓度为(10.51±8.62) μg·m−3(0.47—78.91 μg·m−3),PM2.5的日均质量浓度为(4.05±2.36) μg·m−3(0.31—12.91 μg·m−3),PM1的日均质量浓度为(2.47±1.56) μg·m−3(0.13—10.64 μg·m−3),与高原城市地区如西宁[28]、拉萨[29]相比,浓度较低. PM2.5、PM10远低于国家规定的颗粒物年平均一级浓度限值(GB 3095—2012),说明阿里站颗粒物浓度可以作为高原大气颗粒物浓度的本底值. Chen等统计分析了2016年6月至2017年5月阿里地区的PM2.5和PM10浓度值,分别为33.1 μg·m−3和87.3 μg·m-3[30],PM10和PM2.5约是本研究的8倍. 这是因为Chen的数据来自阿里噶尔县狮泉河镇,本研究的数据来自阿里日土县野外站点,研究地点受人为排放的影响不同. 阿里地区属于高寒荒漠环境,对阿里站周边植被覆盖率的统计结果表明,NDVI<0.2,裸地沙土对颗粒物浓度的贡献大. 这里用PM2.5/PM10的比值来表征粗细颗粒的相对贡献. PM2.5/PM10平均比值为0.39,小于狮泉河镇的0.42[30],说明阿里地区粗颗粒物(空气动力学粒径>2.5 μm 的颗粒物)在PM10中占比较高,颗粒物浓度受人为影响较小.
将北京、拉萨、阿里、珠峰、Hyytiala、JGM站的大气颗粒物质量浓度进行比较(表1),意在对比中国大城市、高原城市、高原野外站点、极地区颗粒物的不同特征. PM2.5的比较为北京>拉萨>珠峰>Hyytiala>阿里>JGM站. PM2.5来源主要为燃烧源、大气二次转化形成的颗粒物,城市PM2.5显著高于背景站点. 2019年,北京市PM2.5为42 μg·m−3,比PM2.5年均值二级浓度限值(35 μg·m−3)高20%,但显著小于2013年PM2.5值,是其的1/2. 2013年国家发布了《大气污染防治行动计划》,为了达到计划目标,北京市先后实行了《北京市2013—2017年清洁空气行动计划》、《京津冀及周边地区2017—2018年秋冬季大气污染综合治理攻坚行动方案》,煤炭使用减少和能源结构优化使北京市大气污染状况好转,颗粒物浓度逐渐降低[31];拉萨污染物排放(工业污染、交通污染)相对较少,PM2.5略低于北京,比背景站高;阿里、珠峰、Hyytiala、JGM站为大气本底站,受到人为干扰少,PM2.5浓度均小于10 μg·m−3. 将不同站点PM2.5/PM10进行比较,发现Hyytiala>北京>JGM>珠峰>阿里>拉萨. Hyytiala站是芬兰南部靠近北极圈的背景站点,位于北方针叶林带,颗粒物来源主要为自然来源. 森林植被排放的挥发性有机物形成有机气溶胶是颗粒物的主要来源,PM2.5中有机物占比为73%. 颗粒物以细颗粒(空气动力学粒径<2.5 μm的颗粒物)为主,PM2.5/PM10高达0.85[32];北京市人为污染物形成的细颗粒物使颗粒物浓度比值PM2.5/PM10较高;JGM站位于南极最大的无冰区James Ross岛,裸露的沉积物和大风天气易产生沙尘天气,使JGM站粗颗粒物占比较高[33];珠峰站和阿里站处于高寒荒漠或草原环境,裸地为粗颗粒的供给提供了有利条件,PM2.5/PM10比值较低;对单颗粒化学元素的研究表明,拉萨市颗粒物的主要元素为硅、铝和钙,主要来自矿物粉尘(沙尘天气、建筑用材),拉萨市颗粒物以粗颗粒物为主,PM2.5/PM10为0.38[34].
-
图1为阿里站颗粒物质量浓度和气象因子的时间序列图,可以看出,颗粒物质量浓度有着明显的季节变化特征,冬季和季风前期明显大于季风期和季风后期. PM10的季节变化规律为:冬季(15.4 μg·m−3)>季风前期(14.06 μg·m−3)>季风后期(6.14 μg·m−3)≈季风期(5.92 μg·m−3);PM2.5的变化规律为:季风前期(5.4 μg·m−3)≈冬季(5.12 μg·m−3)>季风后期(2.91 μg·m−3)≈季风期(2.64 μg·m−3);PM1的变化规律为:冬季(3.16 μg·m−3)≈季风前期(3.15 μg·m−3)>季风后期(2.0 μg·m−3)≈季风期(1.59 μg·m−3). PM2.5和PM1在冬季的浓度值约等于季风前期的值,PM10和PM2.5在季风期的值与季风后期相当. 虽然PM10在冬季大于季风前期,但冬季的值仅比季风前期高9.5%. 因此,PM10、PM2.5、PM1具有一致的季节变化规律.
由于阿里地区污染物排放源少,因此主要从气象方面分析颗粒物质量浓度的变化原因. 据图1分析,冬季,阿里地区处于干寒的状态,相对湿度低,植被覆盖率极低,归一化植被指数(NDVI)小于0.1,表土疏松,易产生浮尘现象. 冬季阿里站的平均边界层高度低于400 m,风速较小,加上逆温层的阻挡作用,大气的容积变小,扩散能力弱. 稳定的大气条件使颗粒物不断积累,浓度变高[37]. 季风前期,阿里站的NDVI和相对湿度依旧较低,地面沙尘易被扬起,颗粒物浓度水平较高. 边界层高度和风速不断变高,使大气扩散能力变强的同时受远程气团影响变大. 3—5月颗粒物浓度呈现变低的趋势,但季风前期PM平均值依旧较高季风期间尤其是7、8月份,阿里站受到西南季风的影响,气象因素发生显著变化. 湿度的变高使加热大气的感热变少,限制了对流混合的发展,边界层高度和风速相应变低[38]. NDVI的增加和风速的减小,使风对地面尘土的搬运能力变低. 颗粒物的湿沉降作用和降水的清除作用使颗粒物尤其是粗颗粒物显著减少,质量浓度在一年之内最低[39]. 季风后期,随着湿度和NDVI变低,颗粒物质量浓度开始回升. 由于季风后期温度和边界层高度比冬春高,扩散条件较之好,颗粒物浓度相对冬季和季风前期较低.
由于阿里站颗粒物质量浓度存在着明显的季节变化,为了探究不同季节影响阿里地区颗粒物浓度的气团来源,综合运用轨迹聚类分析、PSCF分析和CWT分析进行研究. 图2为阿里站不同季节的气团轨迹聚类分析,可以看出阿里站主要受偏西气团影响,轨迹主要来自中亚和南亚地区.
冬季和季风前期受西风急流增强的影响,部分气团来自阿富汗等远源地区(~10%),而季风期和季风后期西风急流减弱,远源地区的贡献消失,主要表现为印度和巴基斯坦北部的近源贡献. 与其他季节不同,季风期有28.8%的气团来自新疆南部,这与Duo等在拉萨的研究一致[40]. 将阿里站气团后向轨迹经过的地区划成0.25°×0.25°的网格,每个网格污染轨迹端点的个数与经过网格的所有轨迹端点的比值即为该网格PSCF值,高值区代表着可能的潜在源区[41]. 污染轨迹通常由标准限值、平均值界定. 阿里地区为生态脆弱区,属于一类区,于是使用环境空气质量标准(GB 3095—2012)颗粒物浓度年均值一级浓度限值(PM10=40 μg·m−3;PM2.5=15 μg·m−3)区分污染轨迹. 由于阿里地区PM2.5浓度过小,污染轨迹过少,PSCF分析结果不理想,于是在这里不予讨论PM2.5的PSCF分析结果. PSCF分析表明(图3),PM10的主要潜在源区分布在印度北部、克什米尔地区、巴基斯坦北部和阿里西部地区. 季风前期和季风后期PM10的潜在源区范围较广. 冬季,由于边界层低,受到远程传输气团的影响较小,PM10潜在源区范围较小. 季风期,暖湿气团使颗粒物产生沉降,受远程传输的影响不明显. 在后向轨迹的基础上,CWT分析可以求出潜在源区贡献给阿里站颗粒物浓度的权重浓度,得出对阿里地区颗粒物浓度影响较大的潜在源区[42]. 由于不用界定污染轨迹,CWT分析得出的潜在源区范围明显大于PSCF分析(图4). 如图4、图5和图6所示,PM10、PM2.5和PM1的潜在源区范围和颗粒物主要源区相似. 对阿里地区颗粒物质量浓度贡献最大的地区是印度西北部和克什米尔,其次巴基斯坦北部,我国和田地区和阿里地区也有一定程度的贡献.
-
当前遥感获取的主要气溶胶参数为光学厚度(AOD),表征大气颗粒物对入射的辐射产生的消光性质. 将AOD数据和地面监测数据联系起来,可增进人们对气溶胶辐射效应的机制研究. 图7为大气颗粒物质量浓度与AOD的月变化图. 图7可以看出,12月、7月和8月AOD的变化与颗粒物浓度变化相差较大. 除去12月、7月和8月,颗粒物浓度与AOD呈现相同的月变化特征,颗粒物质量浓度高的时期(1—6月),所对应的AOD较高,颗粒物质量浓度低的时期(9—11月),AOD较低. 7、8月份,西南季风带来了暖湿气团,使阿里地区湿度变高,相对湿度超过50%. 研究表明每增加3—6 mm,水汽对太阳短波辐射的吸收增加1%[43]. 太阳短波辐射的减少也就是水汽的增加使AOD变高. 颗粒物监测仪器GRIMM EDM 365自带除湿系统,数据是相对湿度较低状态下的质量浓度,而卫星影像是在环境湿度下的监测,两者的湿度条件不同[44]. 加之AOD和颗粒物质量浓度监测高度不同等原因,使7、8月份AOD值高而颗粒物质量浓度低的不匹配现象. MCD19A2 AOD数据使用的MAIAC算法改进了亮表面的反演,但仍存在一定偏差. 12月份,阿里站NDVI小于0.1,地表覆盖类型为裸地,较高的反照率影响卫星对颗粒物监测的敏感性[45]. AOD指介质的消光系数在垂直方向上的积分,而颗粒物浓度数据是对近地面站点的监测. 冬季,较低的边界层和逆温层阻止了颗粒物的扩散,使近地面浓度变高. 因此,监测原理的不同使AOD、颗粒物浓度的变化趋势出现不一致现象. 需要对高原颗粒物浓度数据和AOD数据进行混合层高度和相对湿度等影响因素的订正,以提高数据的相关系数[46].
-
通过对阿里站大气颗粒物浓度的实测和传输气团轨迹的聚类分析,得出以下主要结论:
(1) 阿里站PM10、PM2.5和PM1浓度均较低,分别为(10.51±8.62) μg·m−3、(4.05±2.36) μg·m−3和(2.47±1.56) μg·m−3,PM10、PM2.5远小于PM10(40 μg·m−3)、PM2.5(15 μg·m−3)年平均颗粒物浓度一级标准,表明了阿里站洁净的大气本底特征.
(2)阿里站大气颗粒物浓度存在着明显的季节变化,冬季和季风前期显著大于季风期和季风后期. 冬春季节温度低、大气边界层低,污染物容积能力小. 且冬春季植被覆盖率极低,沙尘频繁,颗粒物浓度高于其他季节. 季风期风速小,颗粒物携带能力弱,降水较多、湿度高、植被覆盖率高,大气颗粒物浓度最低. 聚类分析、PSCF和CWT分析结果表明,印度北部是阿里站颗粒物浓度的主要潜在源区,贡献值较高.
(3)由于盛行风的改变和边界层高度变化等原因,12月、7月和8月AOD与颗粒物浓度的差异较大,遥感数据和地面监测数据需要进行订正,为高原遥感反演颗粒物浓度提供数据支撑.
青藏高原阿里地区大气颗粒物质量浓度的季节变化特征
Seasonal mass concentration variation and potential source regions of atmospheric particulate matter in Ngari area, Tibet Plateau
-
摘要: 基于2018-12-01至2019-11-30在中国科学院阿里荒漠环境综合观测研究站颗粒物监测仪的数据,获得了大气颗粒物质量浓度及其季节变化特征. 研究结果表明,PM10、PM2.5、PM1在观测期间的日均质量浓度分别为(10.51±8.62) μg·m−3、(4.05±2.36) μg·m−3和(2.47±1.56) μg·m−3,低于青藏高原城市地区. PM2.5、PM10远低于国家规定的颗粒物年平均一级浓度限值(GB 3095—2012),表明阿里地区洁净的大气本底特征. 阿里地区污染源稀少,气象因子成为影响颗粒物浓度变化的重要因素. 尽管阿里地处西风和印度季风的过渡带,西南季风显著影响了阿里站颗粒物浓度变化,季风带来的暖湿气团使季风期颗粒物浓度显著降低;加之边界层高度等气象因素的季节变化,使大气颗粒物浓度呈现明显的季节变化规律,冬季和季风前大于季风期和季风后期. 阿里站处于高寒荒漠环境,大气颗粒物以粗颗粒为主,PM2.5/PM10的平均比值为0.39,与其他地点对比,比值偏低. 聚类分析表明,阿里站主要受偏西气团影响. 潜在源贡献因子分析(PSCF)和浓度权重轨迹分析(CWT)分析结果表明,PM10、PM2.5、PM1主要潜在源区均分布在印度西北部、巴基斯坦北部. 由于监测原理的不同和气象因子的影响,MODIS AOD数据与颗粒物浓度数据在12月、7月和8月差异较大,遥感获取的气溶胶参数需要进一步订正提高在高原的适用性.Abstract: Using a GRIMM Environmental Dust Monitor EDM 365, the temporal variation and PM2.5/PM10 ratio of atmospheric particulate matter concentration at Ngari Station from December 1, 2018 to November 30, 2019 were analyzed . The results showed that during the monitoring period, the average daily concentrations of PM10, PM2.5 and PM1 were (10.51±8.62) μg·m−3, (4.05±2.36) μg·m−3, (2.47±1.56) μg·m−3, respectively, which were lower than those in the urban areas of the Qinghai-Tibet Plateau. PM2.5 and PM10 are much lower than the annual average threshold value of class Ⅰ standard of the ambient air quality standard(GB 3095—2012), indicating the clean atmospheric background characteristics in Ngari. Ngari is located in the transitional zone between westerly winds and Indian monsoon. The southwest monsoon significantly affects the change of particulate matter concentration at Ngari station, and the warm and humid air mass brought by monsoon significantly reduces the particulate matter mass concentration during monsoon. In addition, the seasonal variation of meteorological factors such as boundary layer height makes the mass concentration of PM show obvious seasonal variation, which is higher in winter and pre-monsoon than in monsoon and post-monsoon. Ngari Station is located in alpine desert environment, and atmospheric particles are mainly coarse particles. The average ratio of PM2.5/PM10 is 0.39, which is lower than other sites. The cluster analysis shows that Ngari station is mainly affected by the westerly winds. The results of potential source contribution function (PSCF) and concentration-weight trajectory (CWT) showed that the main potential source regions of PM10、PM2.5、PM1 were located in north-western India and northern Pakistan. Due to the different monitoring principles and the influence of meteorological factors, the MODIS AOD data and in-situ PM data are quite different in December, July and August, and the aerosol parameters obtained by remote sensing need to be further revised to improve their applicability in the plateau.
-
气溶胶颗粒物作为大气的重要组分,对气候演化和环境变化等方面有着重要影响. 大气颗粒物的散射效应使到达地球表面的太阳辐射减少,其降温效应可以部分抵消人类排放的温室气体所导致的全球变暖[1]. 气溶胶颗粒物可以成为云凝结核,进而影响到云和降水的物理过程[2]. 研究表明,三极地区对大气气溶胶的变化更为敏感[3]. 大气颗粒物沉降在青藏高原冰雪表面,促进冰雪的消融[4-5]. 青藏高原上黑碳(BC)和沙尘导致反射率降低约38%,造成的总辐射强迫约为18—32 W·m-2[6]. 高原南部扎当冰川上,BC和沙尘对老雪融化的贡献约为9%[7]. 藏东南冰川变化的研究表明,吸光性颗粒物对冰川融化的贡献为15%[8]. 数值模拟实验表明季风前期青藏高原南坡堆积的吸收性气溶胶加热大气形成热泵效应,导致雨季的提前和南亚夏季风的加剧[9]. Cong等发现珠峰北坡气溶胶中二羧酸与生物质燃烧指示物左旋葡聚糖和K+存在明显正相关关系,表明南亚的碳质气溶胶可以通过大尺度环流和局地山谷环流传输到青藏高原[10],大气观测、冰雪冰芯样品和模式模拟显示BC、重金属如汞、有机污染物POPs和微塑料能够跨境传输到青藏高原内部并对环境产生影响[11-14]. 南亚大气棕色云使低层大气变暖的程度和大气气溶胶相同,两者可以使气温在10年内增加0.25 K[15].
青藏高原北邻塔克拉玛干沙漠,西南部是塔尔沙漠,这些地区是青藏高原粉尘的潜在源区. 青藏高原东邻我国人口集中的地区,南邻南亚发展中国家,人为气溶胶也对青藏高原造成了影响. 目前对青藏高原大气颗粒物的研究主要有以下几种手段:1)对冰川区的冰雪及冰芯进行采样,分析微粒物化特征[16-18];2)利用卫星遥感等手段对大气气溶胶光学特征进行监测[19-20];3)直接采集大气气溶胶样品和定点监测[21-22]. 不同的研究手段有不同的利弊,冰芯记录侧重于过去大气粉尘的研究,通常为长期变化趋势;卫星监测和数据模拟可以在长时间和大尺度获取大气气溶胶浓度、光学性质等的信息,成为区域研究的重要工具[23]. 由于青藏高原复杂的地形和地表非均质反射,使得模拟结果和实地监测结果或多或少有偏差[24-25]. 研究表明MODIS AOD数据在拉萨不具有适用性,在高原东部的应用表明数据精度相对较低[26-27]. Sharma等对喜马拉雅地区气溶胶的模拟数值普遍低于实测值[5].
因此,急需地面观测气溶胶颗粒物数据对卫星监测和数值模拟数据来进行验证和校正. 高原西部大气颗粒物的监测数据较少,阿里地区地面实测数据的增加,给高原大气气溶胶的卫星监测和数据模拟研究提供了支撑和验证数据. 本文在大气颗粒物在线观测数据的基础上,获得阿里站大气颗粒物的浓度水平,进而分析其季节变化的基本特征,并综合运用HYSPLIT模型的聚类分析、潜在源贡献因子分析(PSCF)和浓度权重轨迹分析(CWT)方法,分析各个季节阿里站大气气溶胶的输送路径和可能来源,为青藏高原尤其是其西部地区的大气颗粒物研究提供数据支撑.
1. 材料与方法(Materials and methods)
1.1 监测地点
监测地点位于西藏自治区阿里地区日土县的中国科学院阿里荒漠环境综合观测研究站,地理位置为东经79.70°,北纬33.39°,海拔高度4270 m. 位于班公湖南部盆地. 整体自然环境为高寒荒漠. 研究期间,阿里站的平均气温为1.38 ℃,相对湿度为32%. 年降水量为161.24 mm,83%集中在7、8月份. 植被稀疏,归一化植被指数(NDVI)小于0.2.
1.2 监测仪器
监测仪器为德国GRIMM公司生产的EDM365颗粒物在线监测仪,该仪器提供31个粒径通道的颗粒物数浓度,同时给出PM10、PM2.5、PM1(空气动力学粒径)的质量浓度. 样气通过Nafion管自动启动除湿功能. 原始数据的时间分辨率设定为5 min,在剔除异常值的基础上,将质量浓度数据依次合并成逐时算术平均值、逐日算术平均值和逐月算术平均值.
1.3 数据分析
由于阿里站气象数据缺失较多,再分析数据和气象数据的拟合较好,因此除了湿度和降水数据来自阿里站气象数据,其他气象数据来自ERA5再分析结果,下载地址为(https://cds.climate.copernicus.eu/cdsapp#!/search?type=dataset). 归一化植被指数(NDVI)数据来自MODIS的MOD13Q1影像(时间分辨率为16 d,空间分辨率为250 m). 气溶胶光学厚度(AOD)数据来自MODIS的MCD19A2影像(时间分辨率为1 d,空间分辨率为1 km). 对数据的处理和分析主要用到Excel、Spss、ArcGis和Matlab等软件,对数据的绘图用的是Origin软件. 后向轨迹分析、PSCF分析、CWT分析用的数据为美国国家环境预报中心(NCEP) 的全球资料同化系统(GDAS) 数据,使用的软件为TrajStat. 根据青藏高原地区的大气环流特征将研究时段划分为四个季节:冬季(2018-12-01至2019-02-28),季风前期(2019-03-01至2019-05-31),季风期(2019-06-01至2019-09-30),以及季风后期(2019-10-01至2019-11-30).
2. 结果与讨论(Results and discussion)
2.1 阿里站大气颗粒物质量浓度基本特征
仪器监测数据的时段为2018-12-01至2019-11-30. 在监测期间,阿里站PM10的日均质量浓度为(10.51±8.62) μg·m−3(0.47—78.91 μg·m−3),PM2.5的日均质量浓度为(4.05±2.36) μg·m−3(0.31—12.91 μg·m−3),PM1的日均质量浓度为(2.47±1.56) μg·m−3(0.13—10.64 μg·m−3),与高原城市地区如西宁[28]、拉萨[29]相比,浓度较低. PM2.5、PM10远低于国家规定的颗粒物年平均一级浓度限值(GB 3095—2012),说明阿里站颗粒物浓度可以作为高原大气颗粒物浓度的本底值. Chen等统计分析了2016年6月至2017年5月阿里地区的PM2.5和PM10浓度值,分别为33.1 μg·m−3和87.3 μg·m-3[30],PM10和PM2.5约是本研究的8倍. 这是因为Chen的数据来自阿里噶尔县狮泉河镇,本研究的数据来自阿里日土县野外站点,研究地点受人为排放的影响不同. 阿里地区属于高寒荒漠环境,对阿里站周边植被覆盖率的统计结果表明,NDVI<0.2,裸地沙土对颗粒物浓度的贡献大. 这里用PM2.5/PM10的比值来表征粗细颗粒的相对贡献. PM2.5/PM10平均比值为0.39,小于狮泉河镇的0.42[30],说明阿里地区粗颗粒物(空气动力学粒径>2.5 μm 的颗粒物)在PM10中占比较高,颗粒物浓度受人为影响较小.
将北京、拉萨、阿里、珠峰、Hyytiala、JGM站的大气颗粒物质量浓度进行比较(表1),意在对比中国大城市、高原城市、高原野外站点、极地区颗粒物的不同特征. PM2.5的比较为北京>拉萨>珠峰>Hyytiala>阿里>JGM站. PM2.5来源主要为燃烧源、大气二次转化形成的颗粒物,城市PM2.5显著高于背景站点. 2019年,北京市PM2.5为42 μg·m−3,比PM2.5年均值二级浓度限值(35 μg·m−3)高20%,但显著小于2013年PM2.5值,是其的1/2. 2013年国家发布了《大气污染防治行动计划》,为了达到计划目标,北京市先后实行了《北京市2013—2017年清洁空气行动计划》、《京津冀及周边地区2017—2018年秋冬季大气污染综合治理攻坚行动方案》,煤炭使用减少和能源结构优化使北京市大气污染状况好转,颗粒物浓度逐渐降低[31];拉萨污染物排放(工业污染、交通污染)相对较少,PM2.5略低于北京,比背景站高;阿里、珠峰、Hyytiala、JGM站为大气本底站,受到人为干扰少,PM2.5浓度均小于10 μg·m−3. 将不同站点PM2.5/PM10进行比较,发现Hyytiala>北京>JGM>珠峰>阿里>拉萨. Hyytiala站是芬兰南部靠近北极圈的背景站点,位于北方针叶林带,颗粒物来源主要为自然来源. 森林植被排放的挥发性有机物形成有机气溶胶是颗粒物的主要来源,PM2.5中有机物占比为73%. 颗粒物以细颗粒(空气动力学粒径<2.5 μm的颗粒物)为主,PM2.5/PM10高达0.85[32];北京市人为污染物形成的细颗粒物使颗粒物浓度比值PM2.5/PM10较高;JGM站位于南极最大的无冰区James Ross岛,裸露的沉积物和大风天气易产生沙尘天气,使JGM站粗颗粒物占比较高[33];珠峰站和阿里站处于高寒荒漠或草原环境,裸地为粗颗粒的供给提供了有利条件,PM2.5/PM10比值较低;对单颗粒化学元素的研究表明,拉萨市颗粒物的主要元素为硅、铝和钙,主要来自矿物粉尘(沙尘天气、建筑用材),拉萨市颗粒物以粗颗粒物为主,PM2.5/PM10为0.38[34].
表 1 不同站点颗粒物水平的比较(顺序为北京、拉萨、阿里站、珠峰站、Hyytiala站、JGM站)Table 1. Comparison of atmospheric particulate mass concentration at different stations2.2 阿里站颗粒物质量浓度季节变化特征
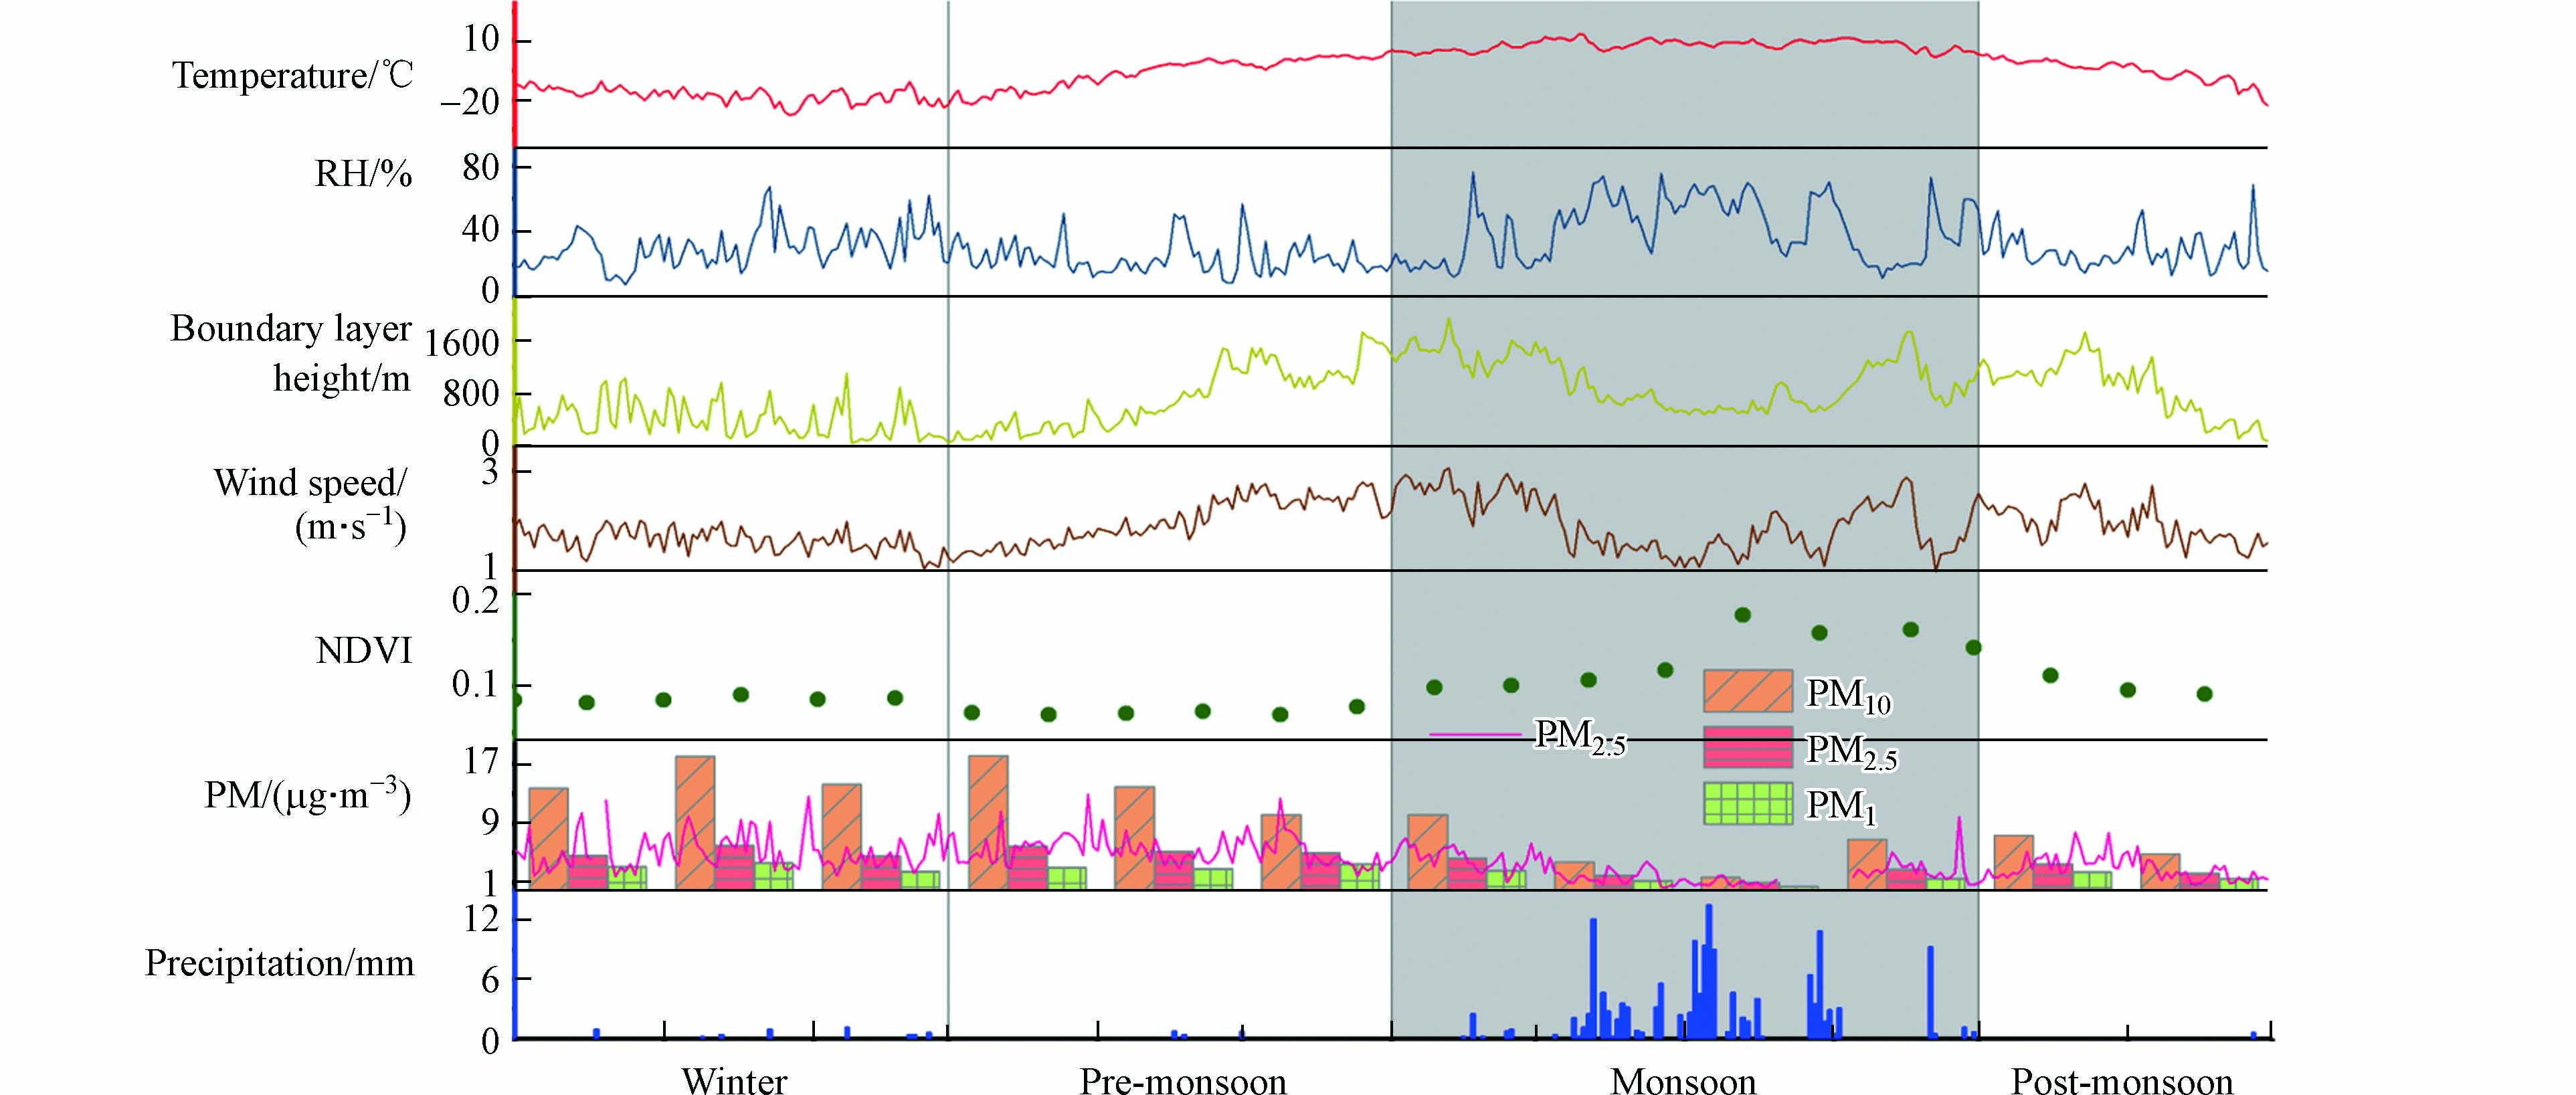
图1为阿里站颗粒物质量浓度和气象因子的时间序列图,可以看出,颗粒物质量浓度有着明显的季节变化特征,冬季和季风前期明显大于季风期和季风后期. PM10的季节变化规律为:冬季(15.4 μg·m−3)>季风前期(14.06 μg·m−3)>季风后期(6.14 μg·m−3)≈季风期(5.92 μg·m−3);PM2.5的变化规律为:季风前期(5.4 μg·m−3)≈冬季(5.12 μg·m−3)>季风后期(2.91 μg·m−3)≈季风期(2.64 μg·m−3);PM1的变化规律为:冬季(3.16 μg·m−3)≈季风前期(3.15 μg·m−3)>季风后期(2.0 μg·m−3)≈季风期(1.59 μg·m−3). PM2.5和PM1在冬季的浓度值约等于季风前期的值,PM10和PM2.5在季风期的值与季风后期相当. 虽然PM10在冬季大于季风前期,但冬季的值仅比季风前期高9.5%. 因此,PM10、PM2.5、PM1具有一致的季节变化规律.
由于阿里地区污染物排放源少,因此主要从气象方面分析颗粒物质量浓度的变化原因. 据图1分析,冬季,阿里地区处于干寒的状态,相对湿度低,植被覆盖率极低,归一化植被指数(NDVI)小于0.1,表土疏松,易产生浮尘现象. 冬季阿里站的平均边界层高度低于400 m,风速较小,加上逆温层的阻挡作用,大气的容积变小,扩散能力弱. 稳定的大气条件使颗粒物不断积累,浓度变高[37]. 季风前期,阿里站的NDVI和相对湿度依旧较低,地面沙尘易被扬起,颗粒物浓度水平较高. 边界层高度和风速不断变高,使大气扩散能力变强的同时受远程气团影响变大. 3—5月颗粒物浓度呈现变低的趋势,但季风前期PM平均值依旧较高季风期间尤其是7、8月份,阿里站受到西南季风的影响,气象因素发生显著变化. 湿度的变高使加热大气的感热变少,限制了对流混合的发展,边界层高度和风速相应变低[38]. NDVI的增加和风速的减小,使风对地面尘土的搬运能力变低. 颗粒物的湿沉降作用和降水的清除作用使颗粒物尤其是粗颗粒物显著减少,质量浓度在一年之内最低[39]. 季风后期,随着湿度和NDVI变低,颗粒物质量浓度开始回升. 由于季风后期温度和边界层高度比冬春高,扩散条件较之好,颗粒物浓度相对冬季和季风前期较低.
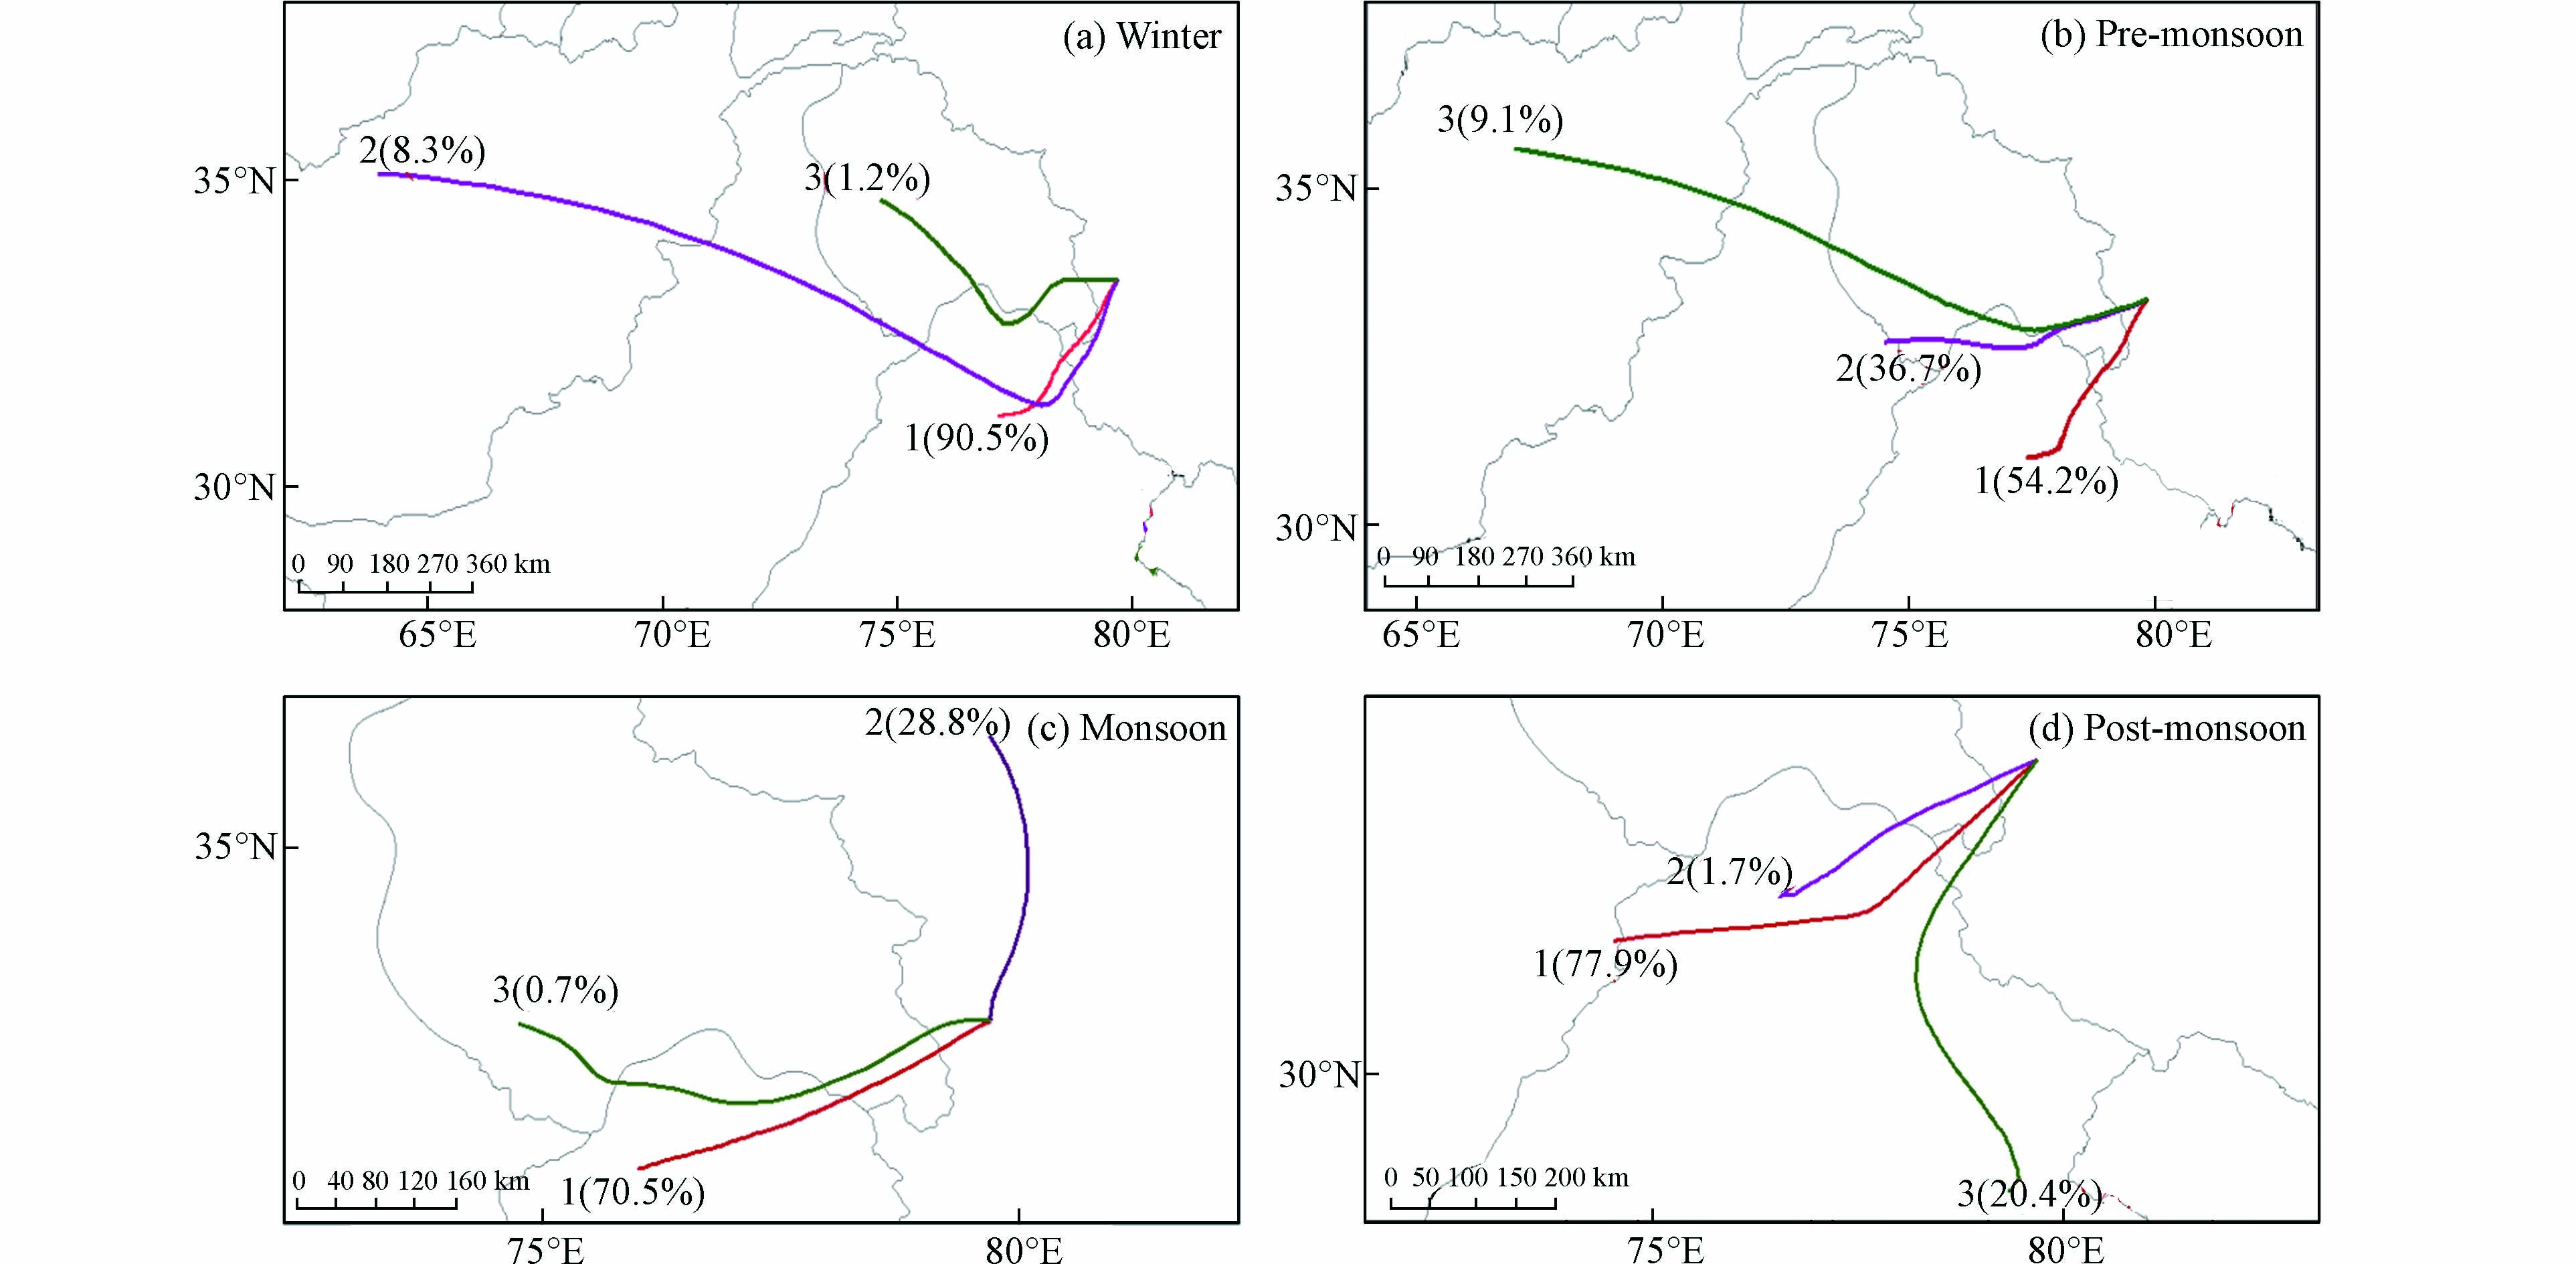
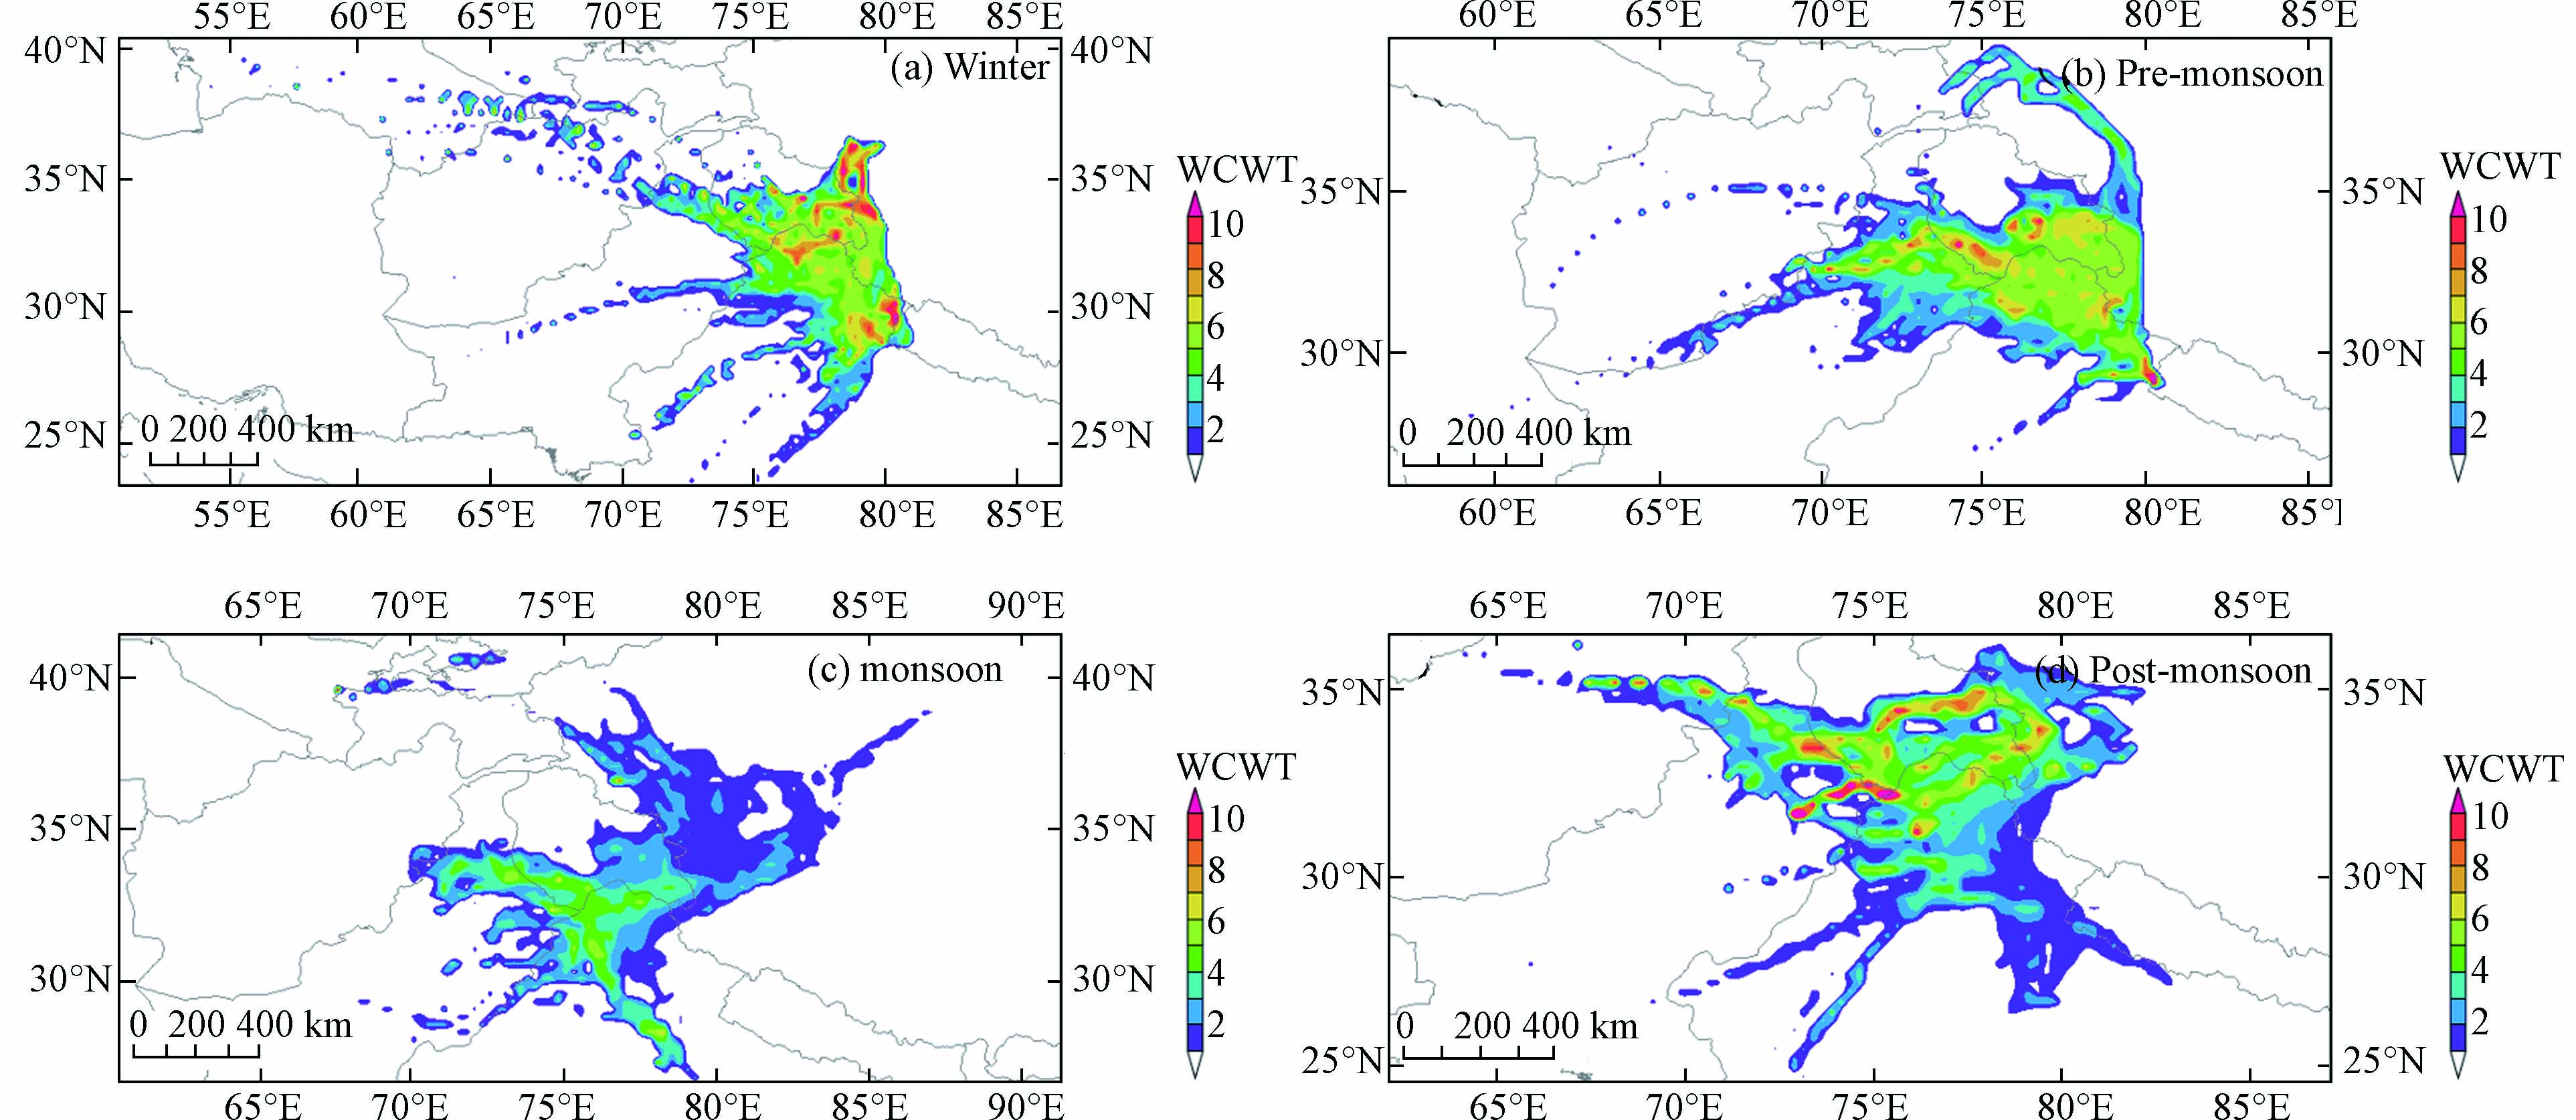
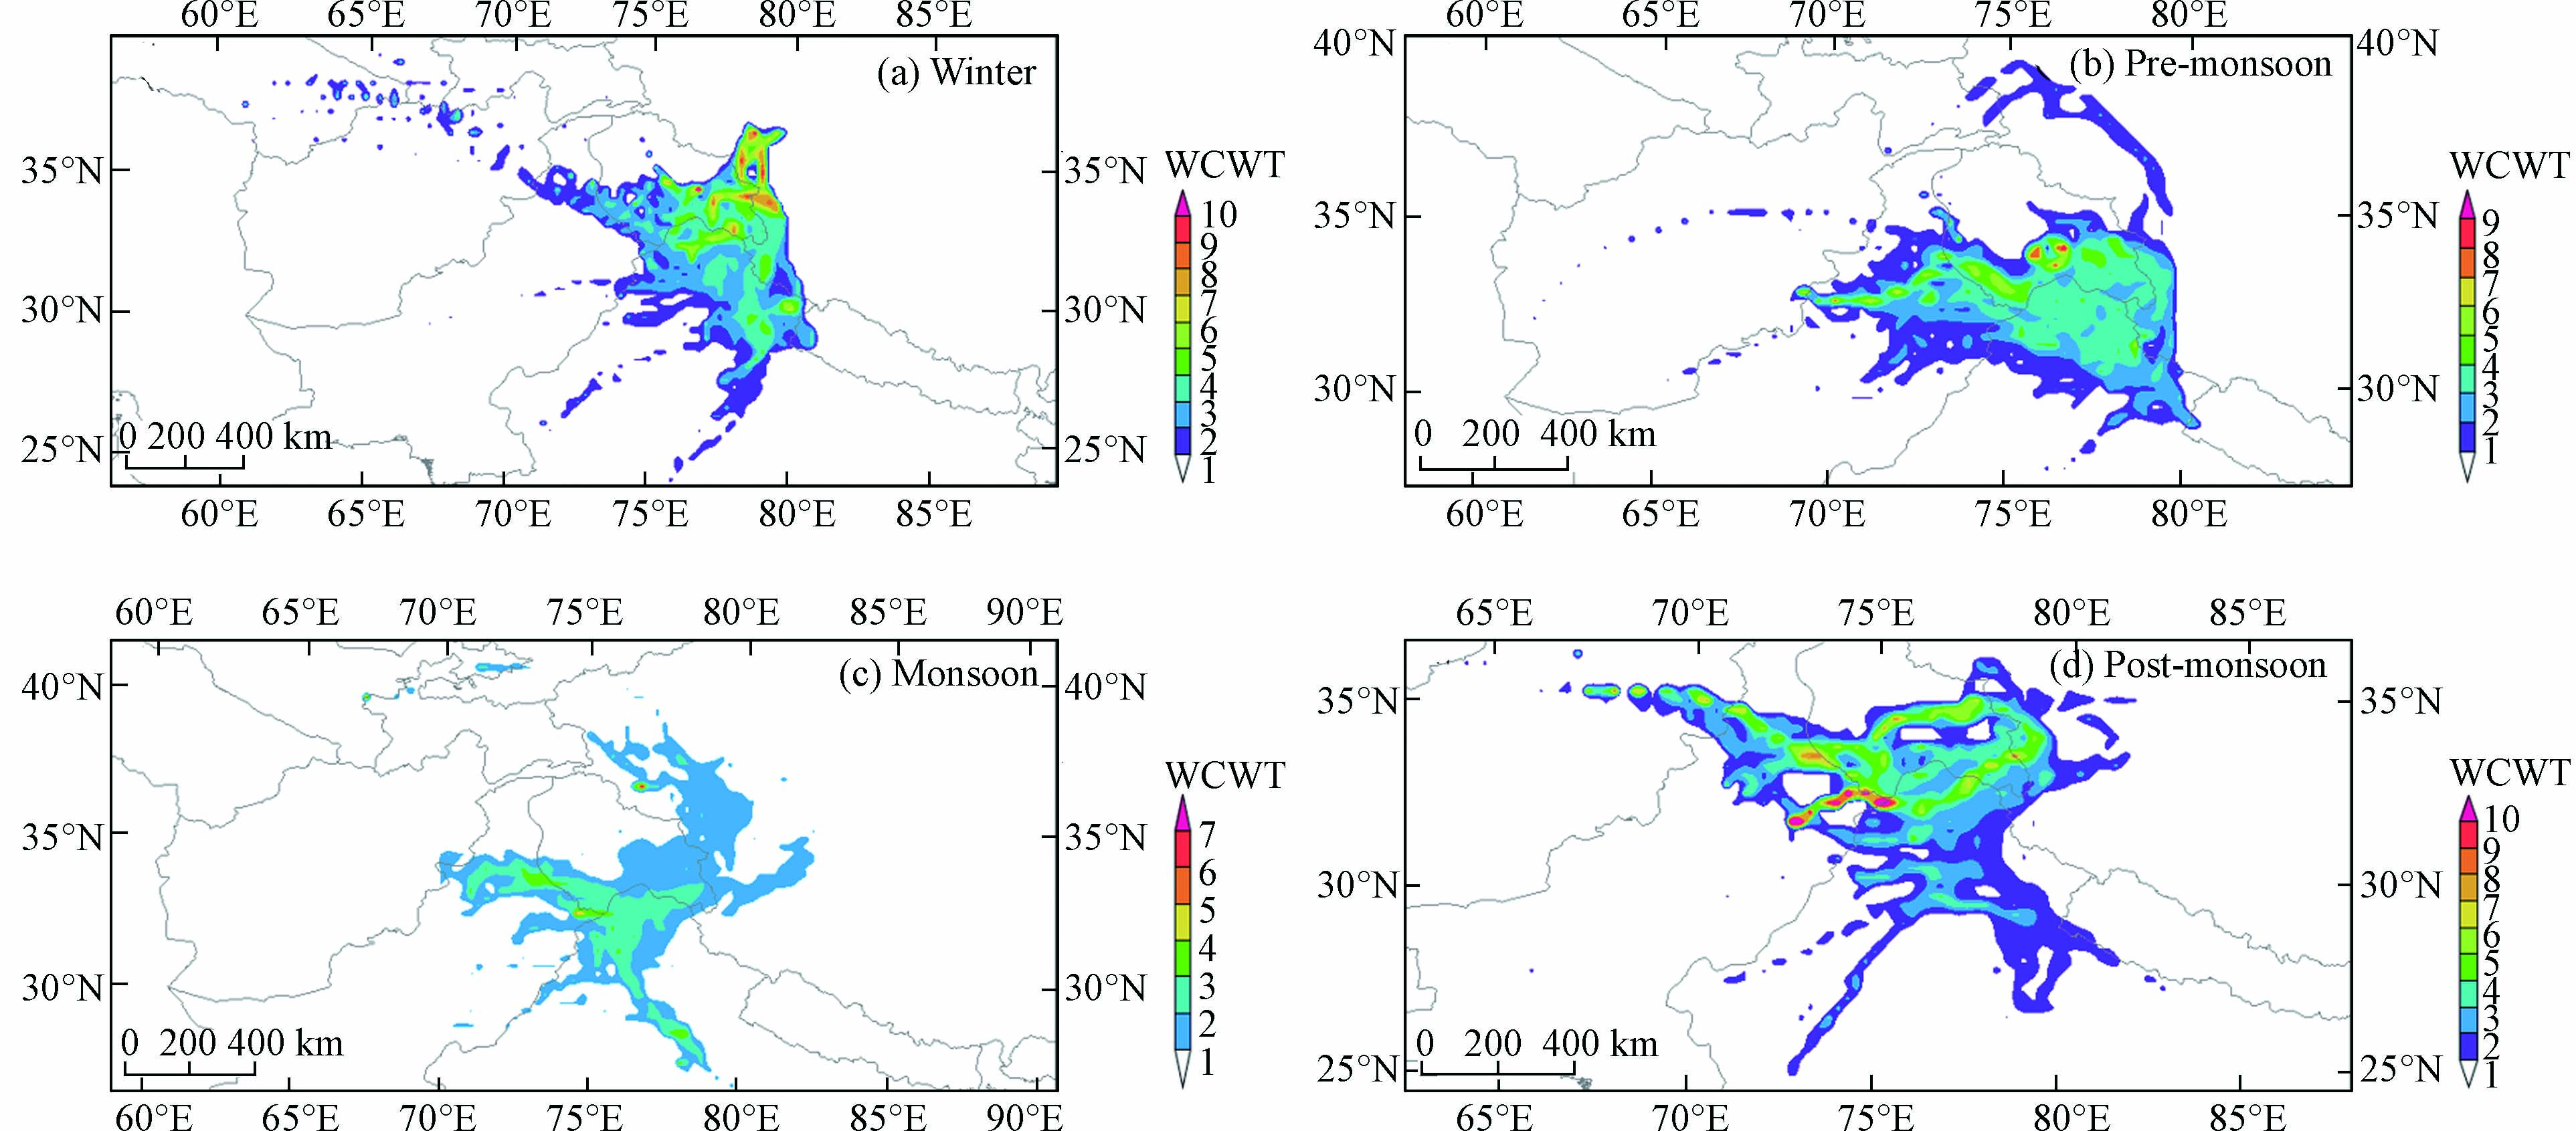
由于阿里站颗粒物质量浓度存在着明显的季节变化,为了探究不同季节影响阿里地区颗粒物浓度的气团来源,综合运用轨迹聚类分析、PSCF分析和CWT分析进行研究. 图2为阿里站不同季节的气团轨迹聚类分析,可以看出阿里站主要受偏西气团影响,轨迹主要来自中亚和南亚地区.
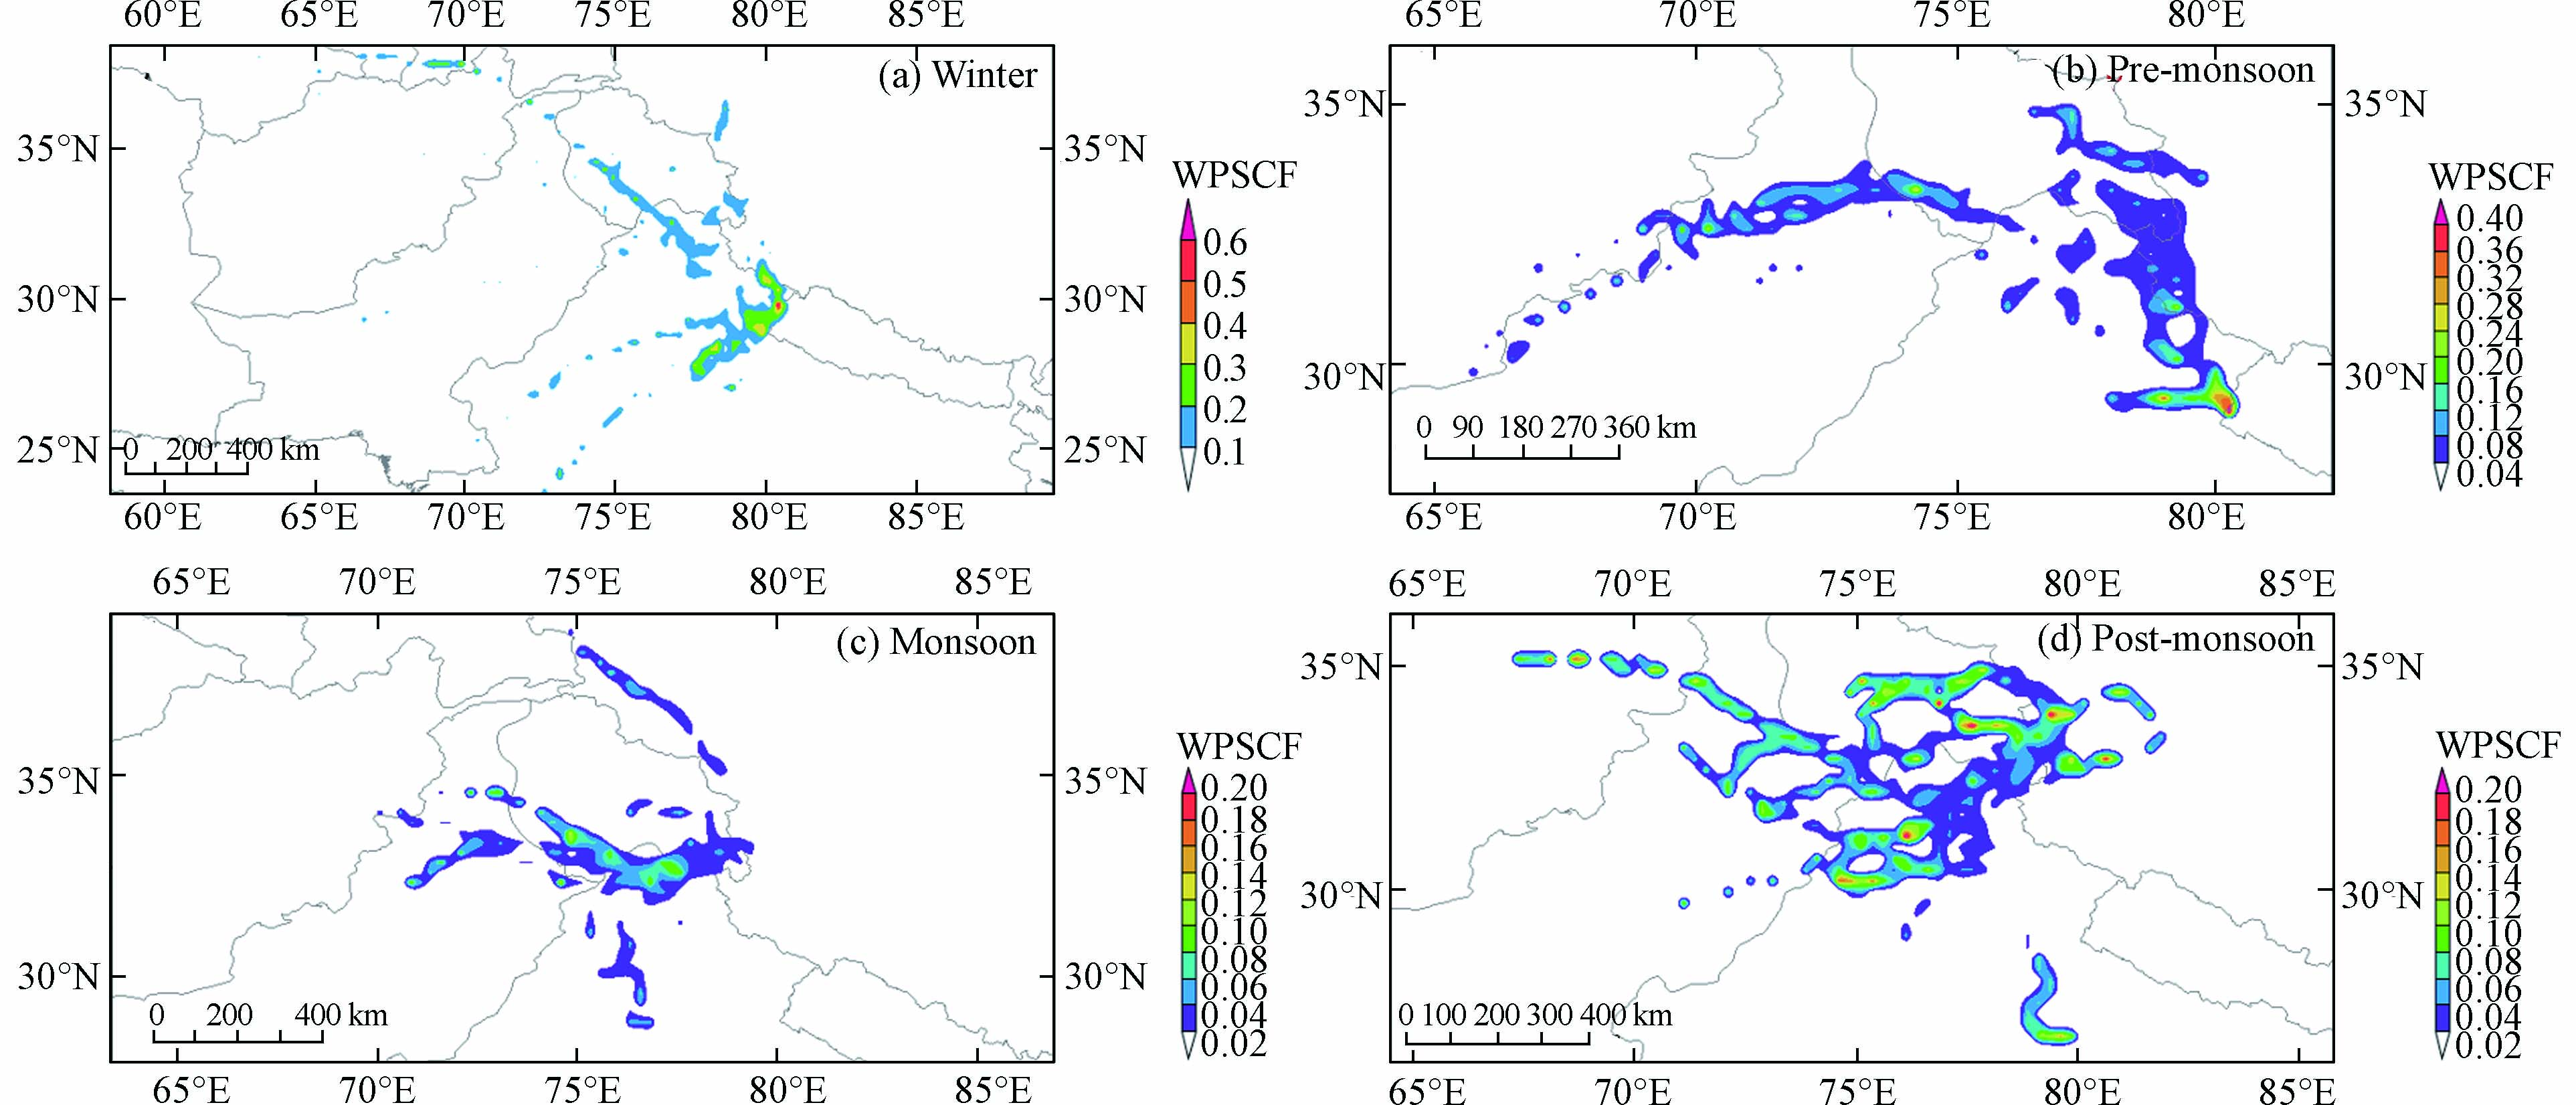
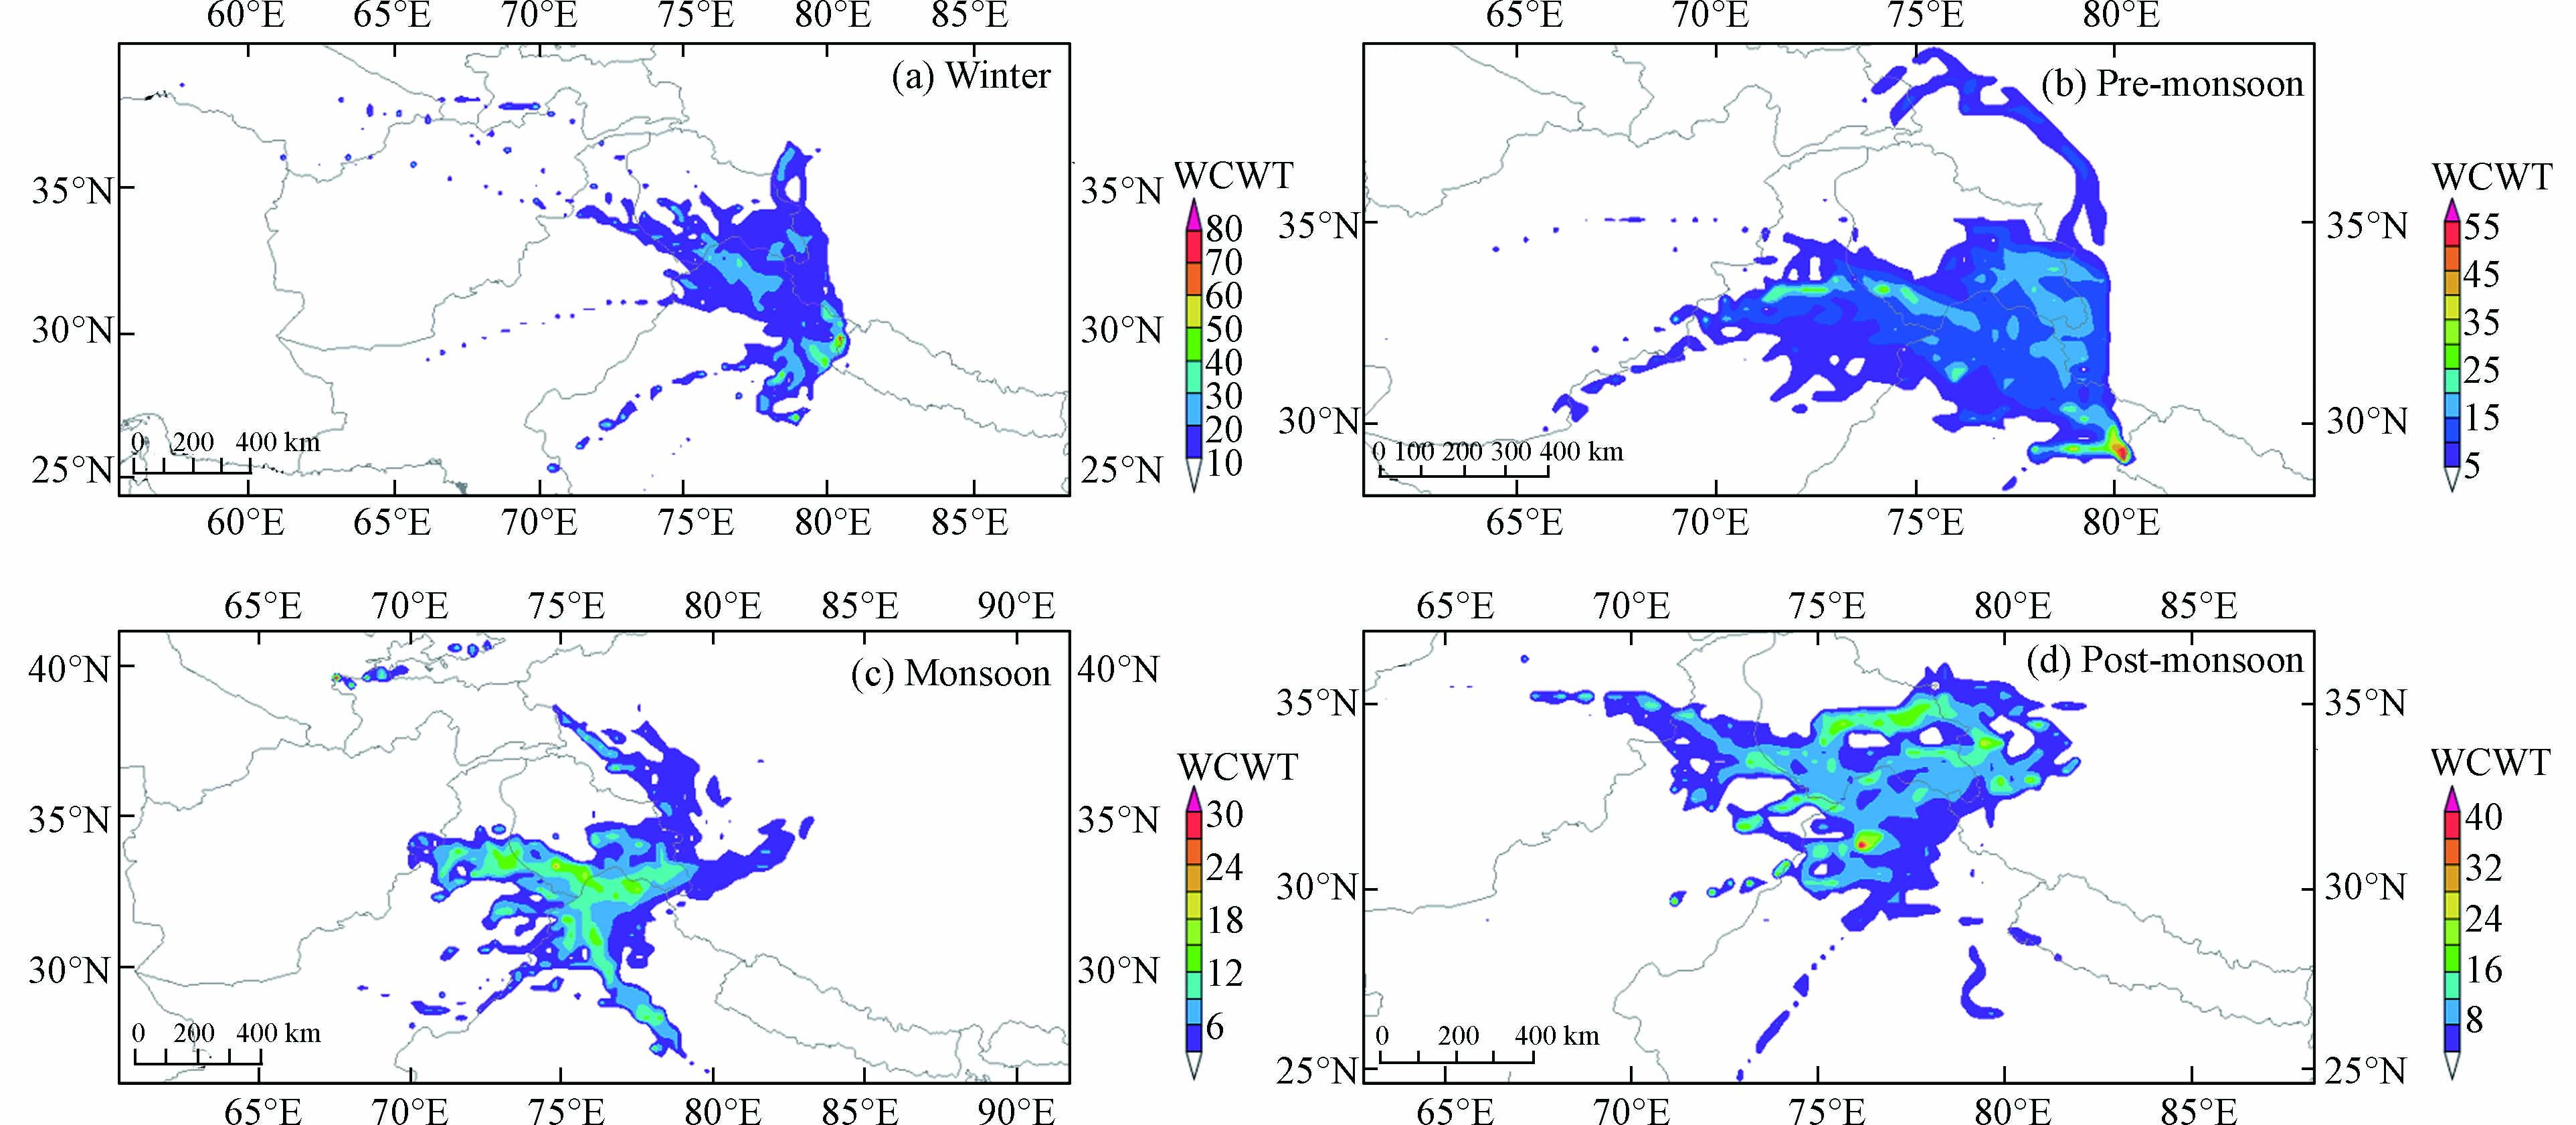
冬季和季风前期受西风急流增强的影响,部分气团来自阿富汗等远源地区(~10%),而季风期和季风后期西风急流减弱,远源地区的贡献消失,主要表现为印度和巴基斯坦北部的近源贡献. 与其他季节不同,季风期有28.8%的气团来自新疆南部,这与Duo等在拉萨的研究一致[40]. 将阿里站气团后向轨迹经过的地区划成0.25°×0.25°的网格,每个网格污染轨迹端点的个数与经过网格的所有轨迹端点的比值即为该网格PSCF值,高值区代表着可能的潜在源区[41]. 污染轨迹通常由标准限值、平均值界定. 阿里地区为生态脆弱区,属于一类区,于是使用环境空气质量标准(GB 3095—2012)颗粒物浓度年均值一级浓度限值(PM10=40 μg·m−3;PM2.5=15 μg·m−3)区分污染轨迹. 由于阿里地区PM2.5浓度过小,污染轨迹过少,PSCF分析结果不理想,于是在这里不予讨论PM2.5的PSCF分析结果. PSCF分析表明(图3),PM10的主要潜在源区分布在印度北部、克什米尔地区、巴基斯坦北部和阿里西部地区. 季风前期和季风后期PM10的潜在源区范围较广. 冬季,由于边界层低,受到远程传输气团的影响较小,PM10潜在源区范围较小. 季风期,暖湿气团使颗粒物产生沉降,受远程传输的影响不明显. 在后向轨迹的基础上,CWT分析可以求出潜在源区贡献给阿里站颗粒物浓度的权重浓度,得出对阿里地区颗粒物浓度影响较大的潜在源区[42]. 由于不用界定污染轨迹,CWT分析得出的潜在源区范围明显大于PSCF分析(图4). 如图4、图5和图6所示,PM10、PM2.5和PM1的潜在源区范围和颗粒物主要源区相似. 对阿里地区颗粒物质量浓度贡献最大的地区是印度西北部和克什米尔,其次巴基斯坦北部,我国和田地区和阿里地区也有一定程度的贡献.
2.3 MODIS AOD 与实测颗粒物质量浓度的比较
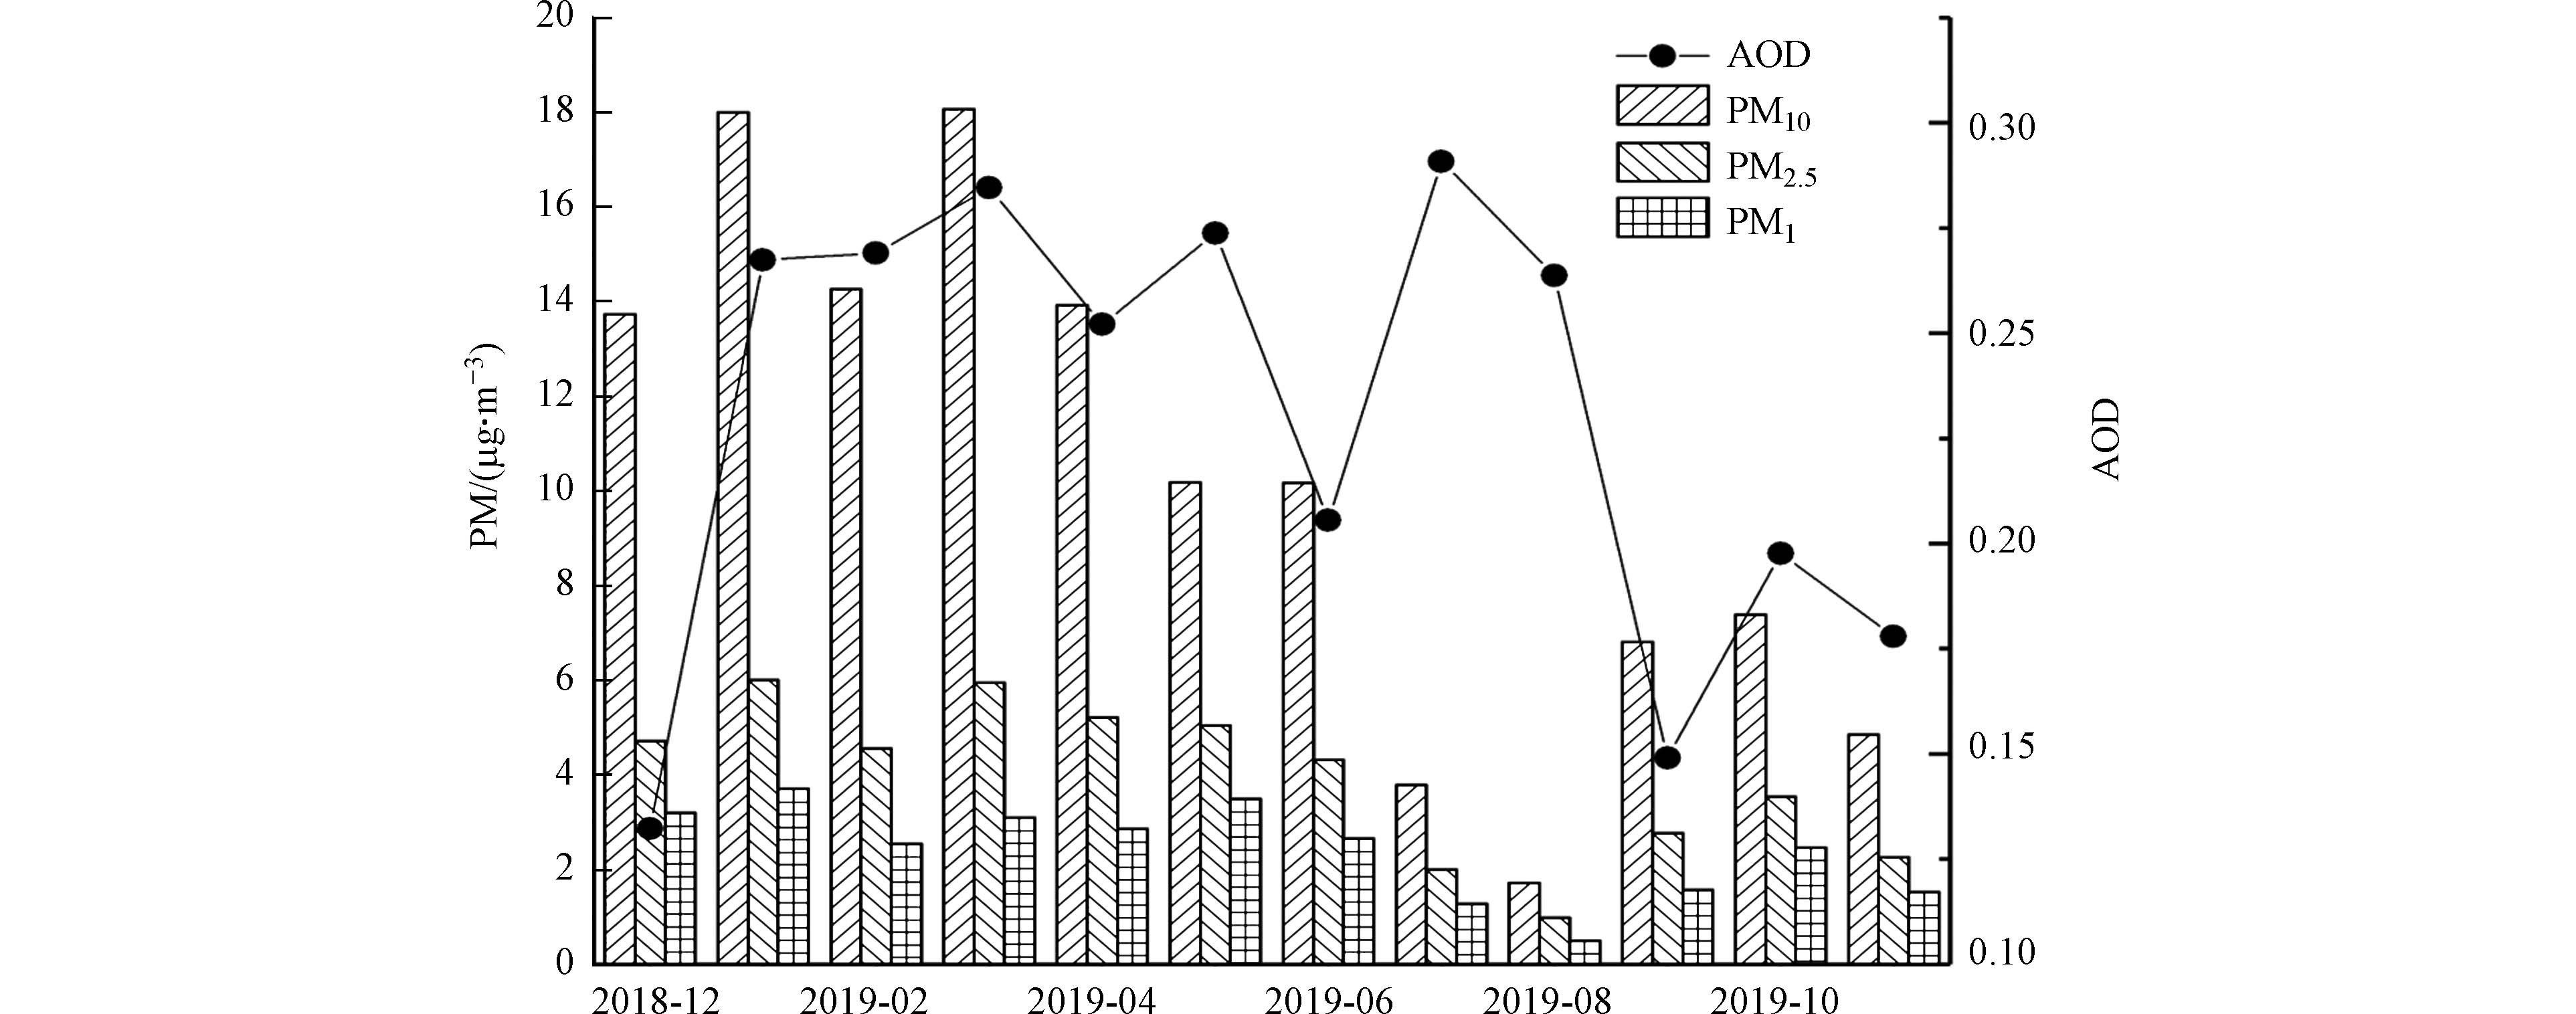
当前遥感获取的主要气溶胶参数为光学厚度(AOD),表征大气颗粒物对入射的辐射产生的消光性质. 将AOD数据和地面监测数据联系起来,可增进人们对气溶胶辐射效应的机制研究. 图7为大气颗粒物质量浓度与AOD的月变化图. 图7可以看出,12月、7月和8月AOD的变化与颗粒物浓度变化相差较大. 除去12月、7月和8月,颗粒物浓度与AOD呈现相同的月变化特征,颗粒物质量浓度高的时期(1—6月),所对应的AOD较高,颗粒物质量浓度低的时期(9—11月),AOD较低. 7、8月份,西南季风带来了暖湿气团,使阿里地区湿度变高,相对湿度超过50%. 研究表明每增加3—6 mm,水汽对太阳短波辐射的吸收增加1%[43]. 太阳短波辐射的减少也就是水汽的增加使AOD变高. 颗粒物监测仪器GRIMM EDM 365自带除湿系统,数据是相对湿度较低状态下的质量浓度,而卫星影像是在环境湿度下的监测,两者的湿度条件不同[44]. 加之AOD和颗粒物质量浓度监测高度不同等原因,使7、8月份AOD值高而颗粒物质量浓度低的不匹配现象. MCD19A2 AOD数据使用的MAIAC算法改进了亮表面的反演,但仍存在一定偏差. 12月份,阿里站NDVI小于0.1,地表覆盖类型为裸地,较高的反照率影响卫星对颗粒物监测的敏感性[45]. AOD指介质的消光系数在垂直方向上的积分,而颗粒物浓度数据是对近地面站点的监测. 冬季,较低的边界层和逆温层阻止了颗粒物的扩散,使近地面浓度变高. 因此,监测原理的不同使AOD、颗粒物浓度的变化趋势出现不一致现象. 需要对高原颗粒物浓度数据和AOD数据进行混合层高度和相对湿度等影响因素的订正,以提高数据的相关系数[46].
3. 结论(Conclusion)
通过对阿里站大气颗粒物浓度的实测和传输气团轨迹的聚类分析,得出以下主要结论:
(1) 阿里站PM10、PM2.5和PM1浓度均较低,分别为(10.51±8.62) μg·m−3、(4.05±2.36) μg·m−3和(2.47±1.56) μg·m−3,PM10、PM2.5远小于PM10(40 μg·m−3)、PM2.5(15 μg·m−3)年平均颗粒物浓度一级标准,表明了阿里站洁净的大气本底特征.
(2)阿里站大气颗粒物浓度存在着明显的季节变化,冬季和季风前期显著大于季风期和季风后期. 冬春季节温度低、大气边界层低,污染物容积能力小. 且冬春季植被覆盖率极低,沙尘频繁,颗粒物浓度高于其他季节. 季风期风速小,颗粒物携带能力弱,降水较多、湿度高、植被覆盖率高,大气颗粒物浓度最低. 聚类分析、PSCF和CWT分析结果表明,印度北部是阿里站颗粒物浓度的主要潜在源区,贡献值较高.
(3)由于盛行风的改变和边界层高度变化等原因,12月、7月和8月AOD与颗粒物浓度的差异较大,遥感数据和地面监测数据需要进行订正,为高原遥感反演颗粒物浓度提供数据支撑.
-
表 1 不同站点颗粒物水平的比较(顺序为北京、拉萨、阿里站、珠峰站、Hyytiala站、JGM站)
Table 1. Comparison of atmospheric particulate mass concentration at different stations
-
[1] IPCC. Climate change 2021: the physical science basis[M]. UK: Cambridge University Press, 2021. [2] TAO W K, CHEN J P, LI Z Q, et al. Impact of aerosols on convective clouds and precipitation [J]. Reviews of Geophysics, 2012, 50(2): RG2001. [3] GARRETT T J, ZHAO C F. Increased Arctic cloud longwave emissivity associated with pollution from mid-latitudes [J]. Nature, 2006, 440(7085): 787-789. doi: 10.1038/nature04636 [4] XU B Q, CAO J J, HANSEN J, et al. Black soot and the survival of Tibetan glaciers [J]. Proceedings of the National Academy of Sciences of the United States of America, 2009, 106(52): 22114-22118. doi: 10.1073/pnas.0910444106 [5] SHARMA A, BHATTACHARYA A, VENKATARAMAN C. Influence of aerosol radiative effects on surface temperature and snow melt in the Himalayan region [J]. The Science of the Total Environment, 2022, 810: 151299. doi: 10.1016/j.scitotenv.2021.151299 [6] ZHANG Y L, KANG S C, SPRENGER M, et al. Black carbon and mineral dust in snow cover on the Tibetan Plateau [J]. The Cryosphere, 2018, 12(2): 413-431. doi: 10.5194/tc-12-413-2018 [7] LI X F, KANG S C, ZHANG G S, et al. Light-absorbing impurities in a southern Tibetan Plateau glacier: Variations and potential impact on snow albedo and radiative forcing [J]. Atmospheric Research, 2018, 200: 77-87. doi: 10.1016/j.atmosres.2017.10.002 [8] ZHANG Y L, KANG S C, CONG Z Y, et al. Light-absorbing impurities enhance glacier albedo reduction in the southeastern Tibetan Plateau [J]. Journal of Geophysical Research:Atmospheres, 2017, 122(13): 6915-6933. doi: 10.1002/2016JD026397 [9] LAU K M, KIM M K, KIM K M. Asian summer monsoon anomalies induced by aerosol direct forcing: The role of the Tibetan Plateau [J]. Climate Dynamics, 2006, 26(7/8): 855-864. [10] CONG Z Y, KAWAMURA K, KANG S C, et al. Penetration of biomass-burning emissions from South Asia through the Himalayas: New insights from atmospheric organic acids [J]. Scientific Reports, 2015, 5: 9580. doi: 10.1038/srep09580 [11] KANG S C, CHEN P F, LI C L, et al. Atmospheric aerosol elements over the inland Tibetan Plateau: Concentration, seasonality, and transport [J]. Aerosol and Air Quality Research, 2016, 16(3): 789-800. doi: 10.4209/aaqr.2015.05.0307 [12] 康世昌, 丛志远, 王小萍, 等. 大气污染物跨境传输及其对青藏高原环境影响 [J]. 科学通报, 2019, 64(27): 2876-2884. doi: 10.1360/TB-2019-0135 KANG S C, CONG Z Y, WANG X P, et al. The transboundary transport of air pollutants and their environmental impacts on Tibetan Plateau [J]. Chinese Science Bulletin, 2019, 64(27): 2876-2884(in Chinese). doi: 10.1360/TB-2019-0135
[13] RAMANATHAN V, RAMANA M V, ROBERTS G, et al. Warming trends in Asia amplified by brown cloud solar absorption [J]. Nature, 2007, 448(7153): 575-578. doi: 10.1038/nature06019 [14] ZHANG Y L, GAO T G, KANG S C, et al. Microplastics in glaciers of the Tibetan Plateau: Evidence for the long-range transport of microplastics [J]. Science of the Total Environment, 2021, 758: 143634. doi: 10.1016/j.scitotenv.2020.143634 [15] 柴磊, 王小萍. 青藏高原持久性有机污染物研究现状与展望 [J]. 地球科学进展, 2022, 37(2): 187-201. doi: 10.11867/j.issn.1001-8166.2021.123 CHAI L, WANG X P. Current knowledge and future prospects regarding persistent organic pollutants over the Tibetan Plateau [J]. Advances in Earth Science, 2022, 37(2): 187-201(in Chinese). doi: 10.11867/j.issn.1001-8166.2021.123
[16] WAKE C P, DIBB J E, MAYEWSKI P A, et al. The chemical composition of aerosols over the Eastern Himalayas and Tibetan Plateau during low dust periods [J]. Atmospheric Environment, 1994, 28(4): 695-704. doi: 10.1016/1352-2310(94)90046-9 [17] SHRESTHA A B, WAKE C P, DIBB J E. Chemical composition of aerosol and snow in the high Himalaya during the summer monsoon season [J]. Atmospheric Environment, 1997, 31(17): 2815-2826. doi: 10.1016/S1352-2310(97)00047-2 [18] WU G J, ZHANG X L, ZHANG C L, et al. Concentration and composition of dust particles in surface snow at Urumqi Glacier No. 1, Eastern Tien Shan [J]. Global and Planetary Change, 2010, 74(1): 34-42. doi: 10.1016/j.gloplacha.2010.07.008 [19] FENG X Y, MAO R, GONG D Y, et al. Increased dust aerosols in the high troposphere over the Tibetan Plateau from 1990s to 2000s [J]. Journal of Geophysical Research:Atmospheres, 2020, 125(13): e2020JD032807. [20] 吴浩, 许潇锋, 杨晓玥, 等. 青藏高原及周边区域沙尘气溶胶三维分布和传输特征 [J]. 环境科学学报, 2020, 40(11): 4081-4091. doi: 10.13671/j.hjkxxb.2020.0139 WU H, XU X F, YANG X Y, et al. Three-dimensional distribution and transport characteristics of dust over Tibetan Plateau and surrounding areas [J]. Acta Scientiae Circumstantiae, 2020, 40(11): 4081-4091(in Chinese). doi: 10.13671/j.hjkxxb.2020.0139
[21] MENG Y, LI R, ZHAO Y L, et al. Chemical characterization and sources of PM2.5 at a high-alpine ecosystem in the Southeast Tibetan Plateau, China [J]. Atmospheric Environment, 2020, 235: 117645. doi: 10.1016/j.atmosenv.2020.117645 [22] 李汉林, 何清, 刘新春, 等. 帕米尔高原东部PM10输送路径及潜在源分析 [J]. 中国环境科学, 2020, 40(11): 4660-4668. doi: 10.3969/j.issn.1000-6923.2020.11.003 LI H L, HE Q, LIU X C, et al. Analysis of transport pathways and potential source regions of PM10 in the eastern Pamirs [J]. China Environmental Science, 2020, 40(11): 4660-4668(in Chinese). doi: 10.3969/j.issn.1000-6923.2020.11.003
[23] CHEN B J, YOU S X, YE Y, et al. An interpretable self-adaptive deep neural network for estimating daily spatially-continuous PM2.5 concentrations across China [J]. Science of the Total Environment, 2021, 768: 144724. doi: 10.1016/j.scitotenv.2020.144724 [24] JI Z M, KANG S C, CONG Z Y, et al. Simulation of carbonaceous aerosols over the Third Pole and adjacent regions: Distribution, transportation, deposition, and climatic effects [J]. Climate Dynamics, 2015, 45(9): 2831-2846. [25] ZHAO C F, YANG Y K, FAN H, et al. Aerosol characteristics and impacts on weather and climate over the Tibetan Plateau [J]. National Science Review, 2020, 7(3): 492-495. doi: 10.1093/nsr/nwz184 [26] YOU Y C, ZHAO T L, XIE Y, et al. Variation of the aerosol optical properties and validation of MODIS AOD products over the eastern edge of the Tibetan Plateau based on ground-based remote sensing in 2017 [J]. Atmospheric Environment, 2020, 223: 117257. doi: 10.1016/j.atmosenv.2019.117257 [27] 陈涛, 罗布, 洛桑曲珍, 等. 拉萨市气溶胶光学厚度研究及MODIS产品检验 [J]. 高原山地气象研究, 2017, 37(4): 53-58. doi: 10.3969/j.issn.1674-2184.2017.04.009 CHEN T, LUOBU, LUOSANGQUZHEN, et al. Analysis of the aerosol optical depth in Lhasa and evaluation of MODIS aerosol product [J]. Plateau and Mountain Meteorology Research, 2017, 37(4): 53-58(in Chinese). doi: 10.3969/j.issn.1674-2184.2017.04.009
[28] XIN Y J, WANG G C, CHEN L. Identification of long-range transport pathways and potential sources of PM10 in Tibetan Plateau uplift area: Case study of Xining, China in 2014 [J]. Aerosol and Air Quality Research, 2016, 16(4): 1044-1054. doi: 10.4209/aaqr.2015.05.0296 [29] WANG Y Q, ZHANG X Y, SUN J Y, et al. Spatial and temporal variations of the concentrations of PM10, PM2.5 and PM1 in China [J]. Atmospheric Chemistry and Physics, 2015, 15(23): 13585-13598. doi: 10.5194/acp-15-13585-2015 [30] CHEN P F, YANG J H, PU T, et al. Spatial and temporal variations of gaseous and particulate pollutants in six sites in Tibet, China, during 2016-2017 [J]. Aerosol and Air Quality Research, 2019, 19(3): 516-527. doi: 10.4209/aaqr.2018.10.0360 [31] LI W J, SHAO L Y, WANG W H, et al. Air quality improvement in response to intensified control strategies in Beijing during 2013-2019 [J]. Science of the Total Environment, 2020, 744: 140776. doi: 10.1016/j.scitotenv.2020.140776 [32] MAENHAUT W, NAVA S, LUCARELLI F, et al. Chemical composition, impact from biomass burning, and mass closure for PM2.5 and PM10 aerosols at Hyytiälä, Finland, in summer 2007 [J]. X-Ray Spectrometry, 2011, 40(3): 168-171. doi: 10.1002/xrs.1302 [33] KAVAN J, DAGSSON-WALDHAUSEROVA P, RENARD J B, et al. Aerosol concentrations in relationship to local atmospheric conditions on James ross island, Antarctica [J]. Frontiers in Earth Science, 2018, 6: 207. doi: 10.3389/feart.2018.00207 [34] DUO B, ZHANG Y C, KONG L D, et al. Individual particle analysis of aerosols collected at Lhasa City in the Tibetan Plateau [J]. Journal of Environmental Sciences, 2015, 29: 165-177. doi: 10.1016/j.jes.2014.07.032 [35] 石洪发. 青藏高原珠峰地区大气颗粒物浓度与粒径分布特征研究[D]. 北京: 中国科学院大学, 2021. SHI H F. Study on the concentration and size distribution characteristics of atmospheric particulate matter in Everest region of Qinghai-Tibet Plateau[D]. Beijing: University of Chinese Academy of Sciences, 2021 (in Chinese).
[36] KESKINEN H M, YLIVINKKA I, HEIKKINEN L, et al. Long-term aerosol mass concentrations in southern Finland: Instrument validation, seasonal variation and trends [J]. Atmospheric Measurement Techniques Discussions, 2020: 1-27. [37] 陈思宇, 王晨, 谢亭亭, 等. 2014年中国大陆地区冷、暖季大气颗粒物的分布特征 [J]. 兰州大学学报(自然科学版), 2018, 54(2): 167-174,183. doi: 10.13885/j.issn.0455-2059.2018.02.005 CHEN S Y, WANG C, XIE T T, et al. Spatial distribution of particulate matter in China’s mainland during cold and warm seasons in 2014 [J]. Journal of Lanzhou University (Natural Sciences), 2018, 54(2): 167-174,183(in Chinese). doi: 10.13885/j.issn.0455-2059.2018.02.005
[38] 李岩瑛, 张红丽, 张强, 等. 西北地区东部季风摆动区大气边界层高度对夏季风活动和季风降水的响应特征 [J]. 干旱区地理, 2020, 43(5): 1169-1178. LI Y Y, ZHANG H L, ZHANG Q, et al. Response characteristics of atmospheric boundary layer height to summer monsoon activity and monsoon precipitation of monsoon swing region in the eastern part of northwest China [J]. Arid Land Geography, 2020, 43(5): 1169-1178(in Chinese).
[39] 耿天召, 童欢欢, 赵旭辉, 等. 江淮地区湿沉降对颗粒物清除能力的影响 [J]. 环境科学研究, 2019, 32(2): 273-283. doi: 10.13198/j.issn.1001-6929.2018.11.04 GENG T Z, TONG H H, ZHAO X H, et al. Effect of wet deposition on the removal efficiency of particulate matter in the Yangtze-Huaihe region [J]. Research of Environmental Sciences, 2019, 32(2): 273-283(in Chinese). doi: 10.13198/j.issn.1001-6929.2018.11.04
[40] DUO B, CUI L L, WANG Z Z, et al. Observations of atmospheric pollutants at Lhasa during 2014-2015: Pollution status and the influence of meteorological factors [J]. Journal of Environmental Sciences, 2018, 63: 28-42. doi: 10.1016/j.jes.2017.03.010 [41] ASHBAUGH L L, MALM W C, SADEH W Z. A residence time probability analysis of sulfur concentrations at grand Canyon National Park [J]. Atmospheric Environment (1967), 1985, 19(8): 1263-1270. doi: 10.1016/0004-6981(85)90256-2 [42] HSU Y K, HOLSEN T M, HOPKE P K. Comparison of hybrid receptor models to locate PCB sources in Chicago [J]. Atmospheric Environment, 2003, 37(4): 545-562. doi: 10.1016/S1352-2310(02)00886-5 [43] 彭艳, 王钊, 李星敏, 等. 近50a西安太阳辐射变化特征及相关影响因子分析 [J]. 干旱区地理, 2012, 35(5): 738-745. PENG Y, WANG Z, LI X M, et al. Variation of surface solar radiation and its impact factors of Xi’an in recent 50 years [J]. Arid Land Geography, 2012, 35(5): 738-745(in Chinese).
[44] 何秀, 邓兆泽, 李成才, 等. MODIS气溶胶光学厚度产品在地面PM10监测方面的应用研究 [J]. 北京大学学报(自然科学版)网络版(预印本), 2009(2): 26-32. HE X, DENG Z Z, LI C C, et al. Application of MODIS AOD in surface PM10 evaluation [J]. Acta Scientiarum Naturalium Universitatis Pekinensis, 2009(2): 26-32(in Chinese).
[45] QIN W M, FANG H J, WANG L C, et al. MODIS high-resolution MAIAC aerosol product: Global validation and analysis [J]. Atmospheric Environment, 2021, 264: 118684. doi: 10.1016/j.atmosenv.2021.118684 [46] 林海峰, 辛金元, 张文煜, 等. 北京市近地层颗粒物浓度与气溶胶光学厚度相关性分析研究 [J]. 环境科学, 2013, 34(3): 826-834. doi: 10.13227/j.hjkx.2013.03.025 LIN H F, XIN J Y, ZHANG W Y, et al. Comparison of atmospheric particulate matter and aerosol optical depth in Beijing city [J]. Environmental Science, 2013, 34(3): 826-834(in Chinese). doi: 10.13227/j.hjkx.2013.03.025
-


 DownLoad:
