-
长三角是中国经济发展最活跃和城市化程度最高的地区之一,同时也是全国最早成立化工园区的地区之一[1]。随着长三角地区近年来城市经济的快速发展,城市工业化水平不断提高,而化工园区作为各项产业的集聚地,在工业生产过程中会产生大量的大气污染物,是城市空气污染的重要污染源[2]。颗粒物(particulate matter,PM)作为其排放的主要大气污染物导致雾霾事件在秋冬季节频繁发生[3]。PM具有粒径小、比表面积大、活性强、易富集有毒、有害物质等特点[4]。PM2.5和PM10(空气动力学当量直径分别≤2.5 μm和≤10 μm的PM[5])是当前长三角地区的首要污染物[6],并与近年来频发的雾霾天气有着密切的关系[4]。PM1.0被称为可入肺PM[7],容易渗透到呼吸道并沉积在肺部,对人体健康的影响极大[8]。研究表明,短期或长期暴露于雾霾天气中,会引发一系列健康危害,包括皮肤、心血管和呼吸道疾病等[9]。目前国内外对化工园区污染研究以VOCs(volatile organic compounds,VOCs)为主,如王红丽等[10]通过走航监测研究了化工园区VOCs的污染水平,发现园区周边的VOCs是城市环境大气浓度的3倍左右。Huang等[11]利用气相色谱-氢火焰/质谱对化工园区VOCs进行了监测分析并检测到了12种有害物质,主要以芳烃为主。Chen等[12]调查研究了大型化工园区中卤代烃的来源,发现工业溶剂使用、工业过程和车辆废气排放是环境空气中卤代烃的主要来源。垂直廓线代表了区域输送、垂直混合、与大气边界层的积累以及卷吸等多种因素的综合效应[13]。Liu等[14]利用无人机对中国澳门的细PM和黑炭进行了垂直分布分析,发现了平流和对流输送对PM污染物的垂直廓线有显著影响。Strbova等[15]研究了欧洲一个工业区内PM的垂直分布,发现垂直分布中PM浓度春季明显高于夏季,并在地面120—135 m观察到了逆温层的存在。我国化工园区对于PM垂直分布研究较少,对于大气PM的时空变化特征缺乏深度的研究分析,因此对于化工园区的PM垂直分布研究具有重要意义。
PM的垂直分布研究通常通过气象塔[16]、系留气球[17]、遥感[18]、多轴差分吸收光谱仪结合激光雷达[19]和载人飞行器[20]进行调查。气象塔是传统的监测方式,但其具有监测范围和高度有限等局限性。系留气球则是搭载不同仪器对垂直高空的污染物进行了监测,但其价格昂贵,并且只能用于垂直方向的观测。遥感虽然探测范围大、能在不同时空尺度上反映污染物的宏观分布情况,但是其监测高度位于300 m以上,监测的时间受卫星轨道限制,难以进行日常的实时监测。载人飞行器也可以进行大范围的监测,但其成本相对较高,一般不用于实验研究。无人飞机(unmanned aerial vehicle,UAV)是载人飞行器的良好替代品,针对PM污染物的垂直廓线测量,具有高效率[21]、灵活性和机动性[22]。
综上,化工园区是重要的大气污染源,而我国针对化工园区的PM垂直分布研究较少,对于化工园区大气PM的时空分布特征尚不清晰。本研究拟通过对长三角典型化工园区PM的时空分布特征进行调查分析,为我国化工园区的大气环境颗粒污染物监测及治理提供理论支持,有利于为相关部门制定相关大气污染治理的政策和标准提供科学依据[23]。
-
杭州湾上虞经济技术开发区(以下简称为上虞园区)创建于1998年,地处杭州湾南岸,位于上海、杭州、宁波三大城市圈中心位置,紧邻嘉绍跨江大桥。具体位置位于上虞园区的水处理发展有限公司(30°9′45″N,120°54′16″E)(图1)。采样点位于整个化工园区的中心地带,并且较为空旷,没有高大的建筑物,能够很好地采集化工园区扩散出的大气污染物,以便较为全面的反映上虞化工园区的PM污染情况。
-
UAV平台搭载的检测装置为自主研制的低成本微型大气检测仪,其内置有OPC-N2传感器(OPC-N2,Alphasense,英国)(图2)。该传感器的质量仅为0.1 kg,检测原理为激光散射,粒径检测范围为0.38—17 μm,0—10000 μg·m−3,检测流量为1 L·min−1。传感器与微型电脑集成,每1 s输出一个PM数据。UAV平台是一款搭载DJI-A3飞控的六旋翼UAV,它的最大起飞重量为35 kg,载荷能力≤6 kg,本研究最高飞行高度为500 m[14]。
-
实验在2020年8月19—21日,2020年10月20、21、24、25日,2020年12月2—8日、2021年1月25—30日、以及2021年3月23—25日开展,共计23d,累计进行了151次飞行。飞行时间为上午9时至下午5时。实验开始前,记录相关气象数据,设置相应软件参数,实验中UAV以2 m·s−1速度匀速上升至500 m,并悬停2 min。然后以1.5 m·s−1的速度匀速下降,在至400、300 、200 、100、50 、0 m处均悬停2 min对PM(PM1.0、PM2.5和PM10)进行检测,并记录抵达各高度时刻,检查软件运行情况。
气象条件对于PM浓度的影响十分明显,温度和相对湿度(relative humidity,RH)是影响PM浓度变化的主要因素[24]。实验当天所记录的相应气象参数如表1所示,数据来源于中国气象数据网站。
-
将3月、8月、10月和1月作为春季、夏季、秋季、和冬季的代表月份进行PM垂直观测,选取化工园区的PM1.0、PM2.5、PM10为典型PM,对其在不同季节的浓度变化进行分析(每次取不同垂直高度监测数据的平均值),结果如图3所示。
由图3可知,PM1.0、PM2.5、PM10的浓度最大值、中位数和平均值均呈现为冬季>秋季>春季>夏季,不同粒径PM的季节浓度变化特征一致,相关性较好。由于箱线图中出现了较多异常值(当最大值超出箱线图合理上限时定义为异常值),导致平均值受到较大影响,本文取PM的中位数进行比较。PM10的中位数67.82(冬季)>60.21(秋季)>26.01(春季)>24.95 μg·m−3(夏季);PM2.5的中位数52.15(冬季)>47.98(秋季)>20.24(春季)>14.61 μg·m−3(夏季);PM1.0的中位数41.59(冬季)>32.12(秋季)>16.93(春季)>12.65 μg·m−3(夏季)。由此可见,季节变化对PM浓度影响十分明显。这可能是由于春夏季温度较高,污染扩散较快,而秋冬季节较为寒冷,污染扩散比较缓慢造成PM的累积。此外,秋冬季燃煤等需求增加[25],致使PM污染物排放增加,这也是导致PM污染在秋冬季更加严重的重要原因。PM2.5与PM10的比值可以反映区域内大气细PM与粗PM的占比[26],园区PM2.5/PM10的季节中位数变化特征为:秋季(0.80)>春季(0.78)>冬季(0.77)>夏季(0.58),说明园区内春秋冬季节排放的PM以细PM为主,夏季排放的粗PM占比显著提高,其浓度值接近细PM,造成夏季粗PM比例最高的原因可能有自然源和人为源两方面影响,PM10受自然源和人为源双重影响,而PM2.5主要受人为源影响,夏季由于温度较高,大气湍流增强,PM整体较低,而夏季为东南风主导,来自海上的气团中多携带着PM较大的海盐粒子,这可能造成夏季粗PM比例最高。
-
上虞园区在不同季节高度每上升百米PM1.0、PM2.5和PM10平均浓度变化情况(监测高度为0—500 m)如表2所示。由表2可知,春季和夏季的PM浓度随高度升高而降低,最大幅度为每百米降低了11.70 μg·m−3。在秋季,PM浓度每升高百米增加的范围为0.60—0.98 μg·m−3。在冬季,随着高度的升高,PM2.5和PM10浓度均增大,PM10浓度每百米上升高达40.08 μg·m−3。
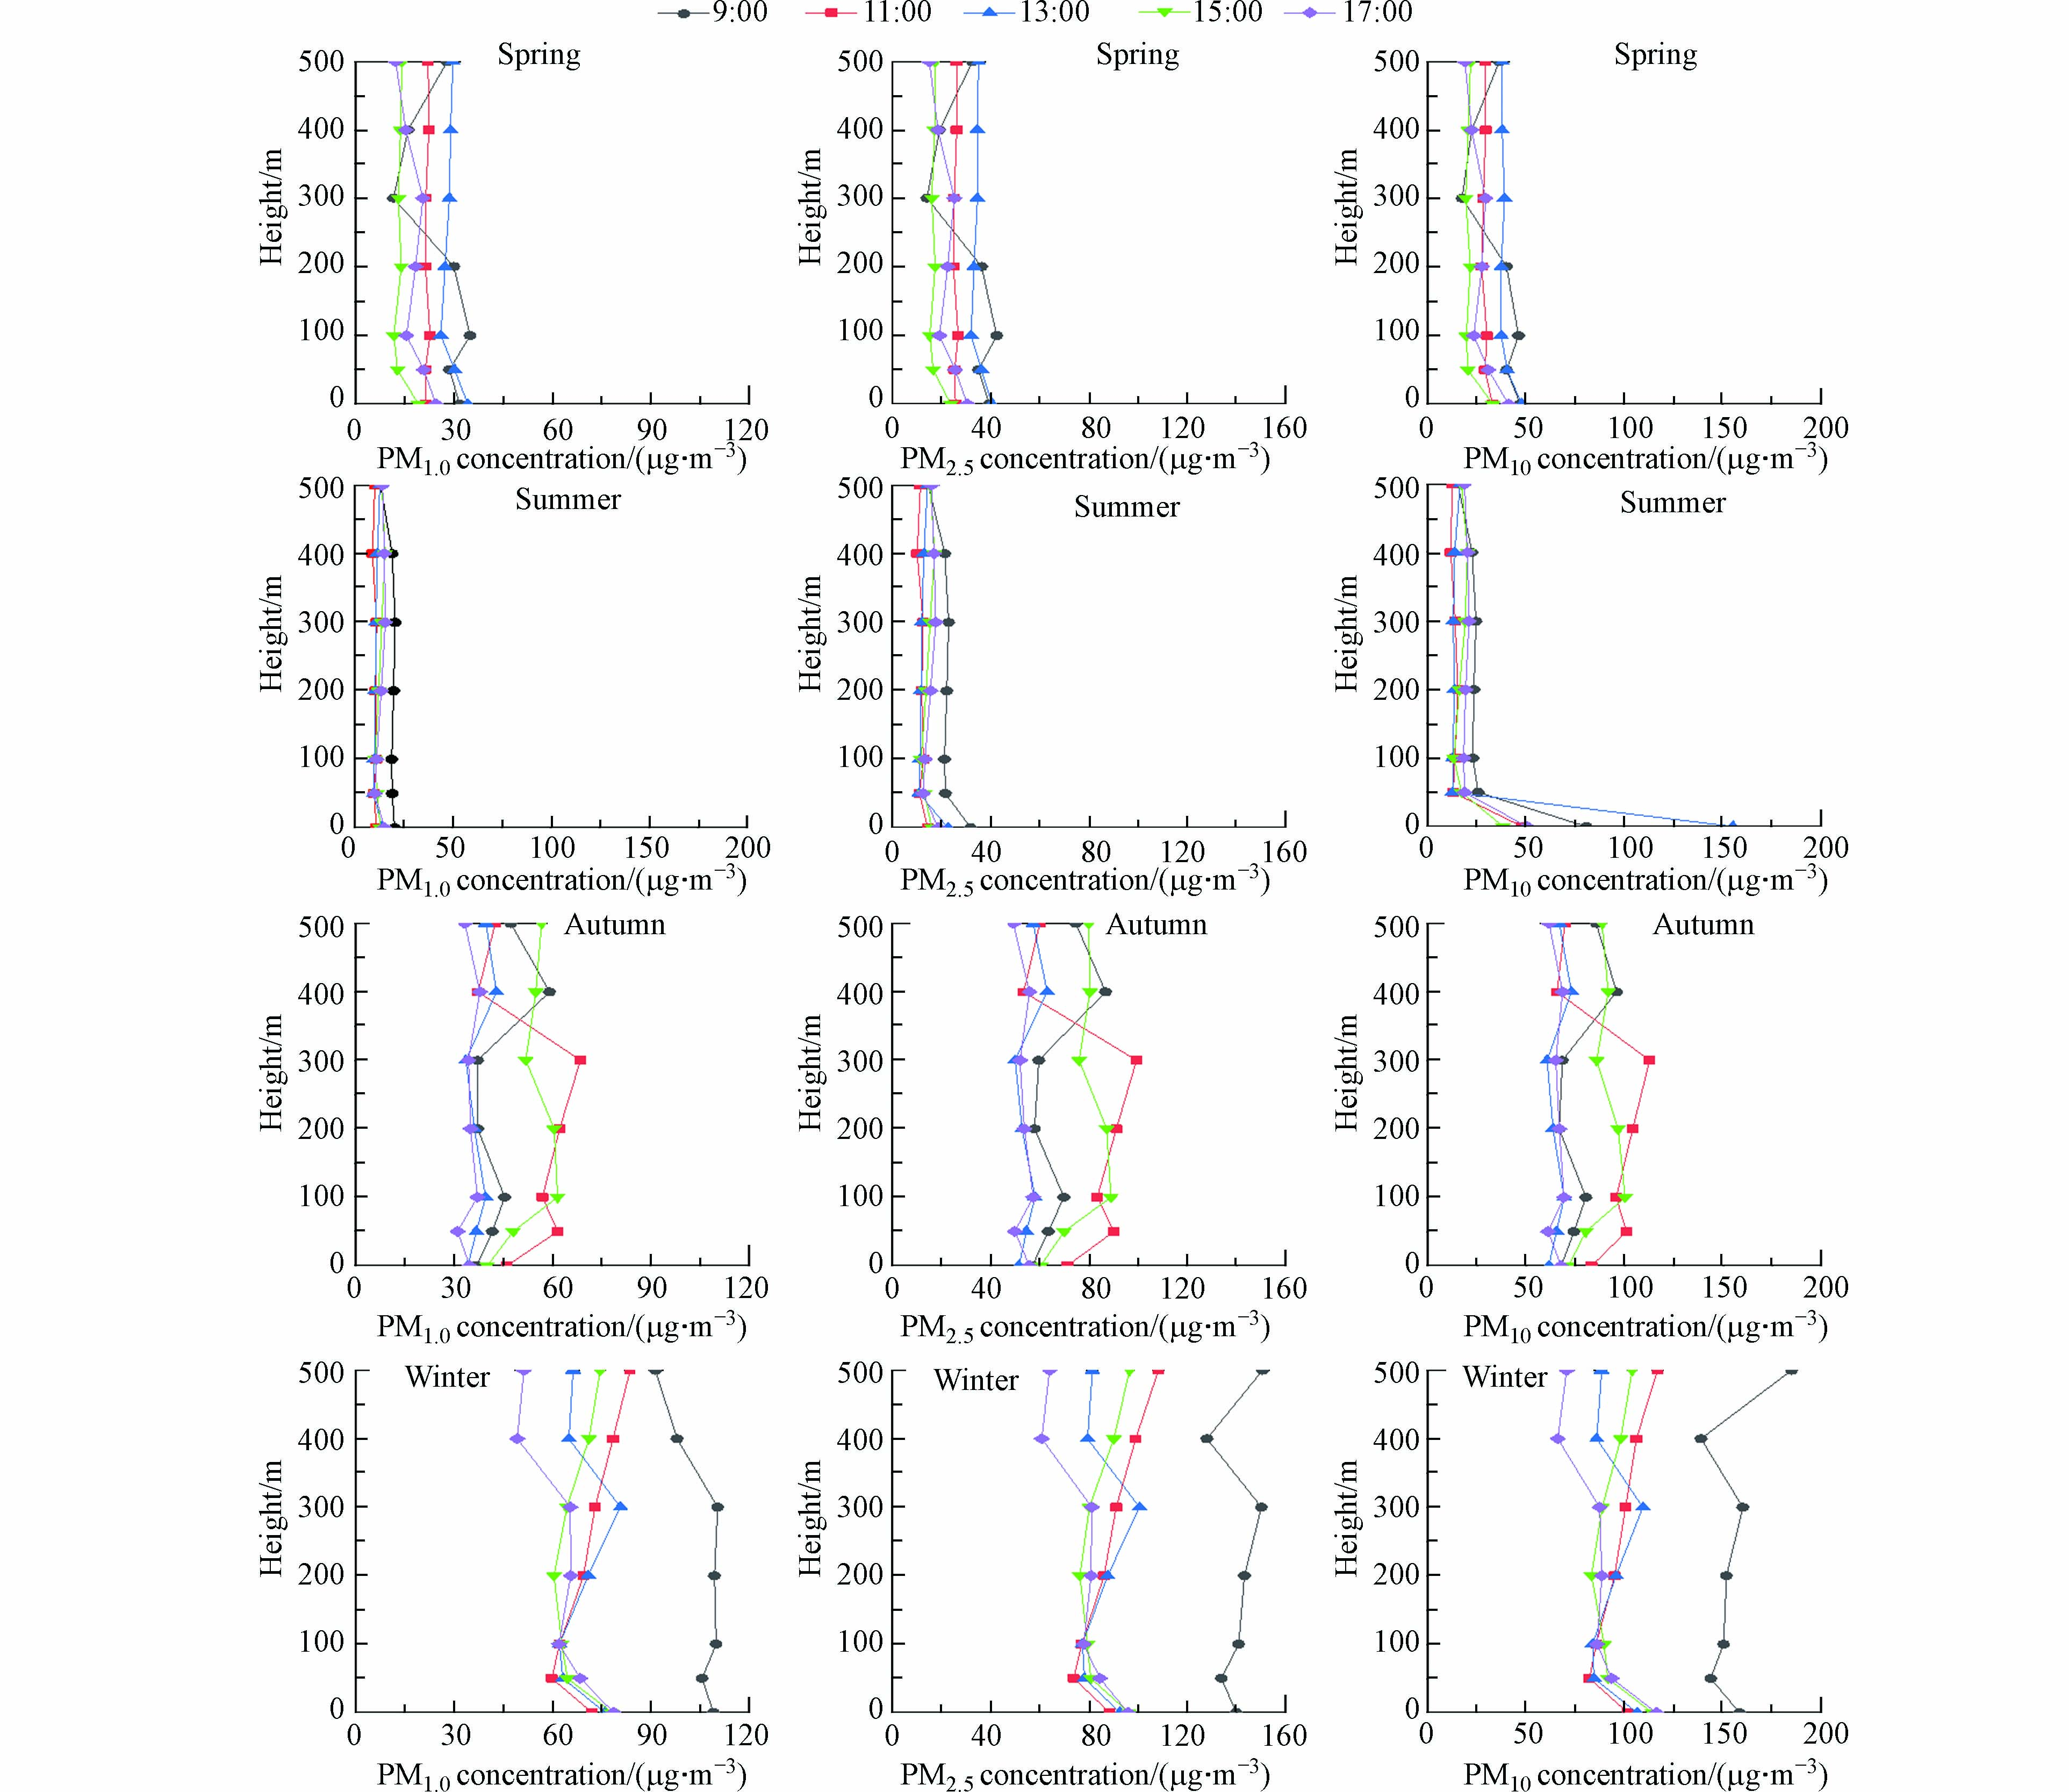
为了了解该化工园区在四季不同高度及一天中不同时间点(9、11、13、15、17时)PM的浓度及变化情况,对0、50、100、200、300、400、500 m处的PM1.0、PM2.5和PM10浓度进行了分析,结果见图4。
利用相关分析来研究PM1.0、PM2.5以及PM10之间的相关关系,使用Pearson相关系数来表示相关关系的强弱情况,结果如表3。由表3可知,PM1.0和PM2.5之间的相关系数值为0.99,并且呈现出0.05水平的显著性,因而说明PM1.0和PM2.5之间有着显著的正相关关系。PM1.0和PM10之间的相关系数值为0.96,并且呈现出0.05水平的显著性,说明PM1.0和PM10之间也有着显著的正相关关系。PM2.5与PM10的相关系数值也为0.99,同样呈现出0.05水平的显著性。因此PM1.0、PM2.5以及PM10三者均存在着显著的正相关关系。
以PM10为例,对PM在垂直廓线的浓度变化进行探讨(图4)。在春、夏、冬季,PM(PM10)浓度在0—50 m随高度升高而降低,春季从40.63 μg·m−3降低到32.41 μg·m−3,夏季从74.76 μg·m−3降低到17.64 μg·m−3,冬季从119.64 μg·m−3降低到99.41 μg·m−3。在秋季,PM(PM10)浓度从70.34 μg·m−3升高到76.38 μg·m−3,这可能是由于秋季50 m高度出现了逆温(气温随着高度增加而升高的反常现象),使污染物无法向上扩散。从50—500 m,春夏季PM浓度也随着高度上升而下降,春季从32.41 μg·m−3降低至29.11 μg·m−3,夏季从17.64 μg·m−3降低到16.28 μg·m−3,浓度变化均较小。这可能是因为在日间对流条件下,由于产生浮力湍流和剪切产生湍流的强烈湍流运动,在大气边界层内可以很好地垂直混合[27]。秋冬季的PM浓度则随高度升高,在50—500 m的不同高度层,浓度有不同的变化。其中,浓度变化最剧烈的是在秋季的300 m到400 m,在这个范围内PM浓度从112.67 μg·m−3降低到65.65 μg·m−3。而在冬季的400 m到500 m范围内,PM浓度从139.11 μg·m−3增大到185.14 μg·m−3,这可能是由于实验地点西北部有大型烟囱排放污染,而冬季由西北风主导,排放的污染物通过区域水平输送引起[28],值得注意的是,细颗粒物相比粗颗粒物更易扩散,而从垂直分布图中发现PM1.0反而有所降低,本研究现有数据尚不能合理的解释这一现象,也无法排除偶尔误差的存在,这为后续的研究提供了一个新的关注点。
从不同粒径PM来看,春季PM1.0浓度为15—30 μg·m−3,PM2.5浓度为20—40 μg·m−3,PM10浓度在25—50 μg·m−3。夏季PM浓度整体最低,但地面的PM10浓度却非常高,达到150 μg·m−3,并且在高度50 m显著降低,降低至20 μg·m−3以下,然后随着高度升高,没有明显变化,表明大气混合均匀。秋季PM1.0浓度在30—60 μg·m−3,PM2.5浓度在50—100 μg·m−3,PM10浓度在60—110 μg·m−3,但不够稳定,浓度变化较大。冬季是PM污染最严重的一个月份,PM1.0浓度在地面最高可达110 μg·m−3,高空则有所下降,大概在90 μg·m−3,而PM2.5和PM10的高空浓度反而要高于地面浓度,PM2.5高空浓度最高接近160 μg·m−3,PM10高空浓度最高接近了200 μg·m−3。从一天的各时间点看可以发现,春季PM浓度在9时和13时较高,在15时较低,同时我们注意到9时的300 m高度,PM浓度突然降低,这一情况也出现在秋季11时的400 m高度层,可能是由于这两个高度层当时有强风吹过,大气流动加强,导致污染物浓度下降。夏季的最高污染浓度出现在9时,最低污染浓度则是出现在靠近中午的11时,这可能是由于早晨9时汽车尾气排放增加[29],而中午时刻温度升高,边界层高度升高[30],PM扩散更加活跃所致。秋季的最高污染浓度出现在11时,秋季的9时污染浓度比较低,这可能是由于秋季实验部分时间为周末,上班来往车辆骤减,导致9时的污染浓度显著降低,而当有光化学烟雾的情况下,PM浓度容易从早晨开始一直上升到中午达到极大值。冬季PM浓度整体都较高,最高污染浓度还是出现在9时,并且污染浓度明显高于其他时刻,最高接近200 μg·m−3,污染非常严重。从一天的时间段来看,秋季的11时和15时,冬季的9时PM浓度远大于其他时刻秋季的11时对PM浓度的贡献为23.36%,15时贡献了22.72%,冬季的9时贡献了PM浓度的29.33%,这造成了秋冬季PM浓度整体较高。同样计算出其他季节在9时的贡献率,分别是春季22.99%,夏季24.16%,秋季20.35%,表明9时是一天中污染较为严重的时刻,值得关注。
-
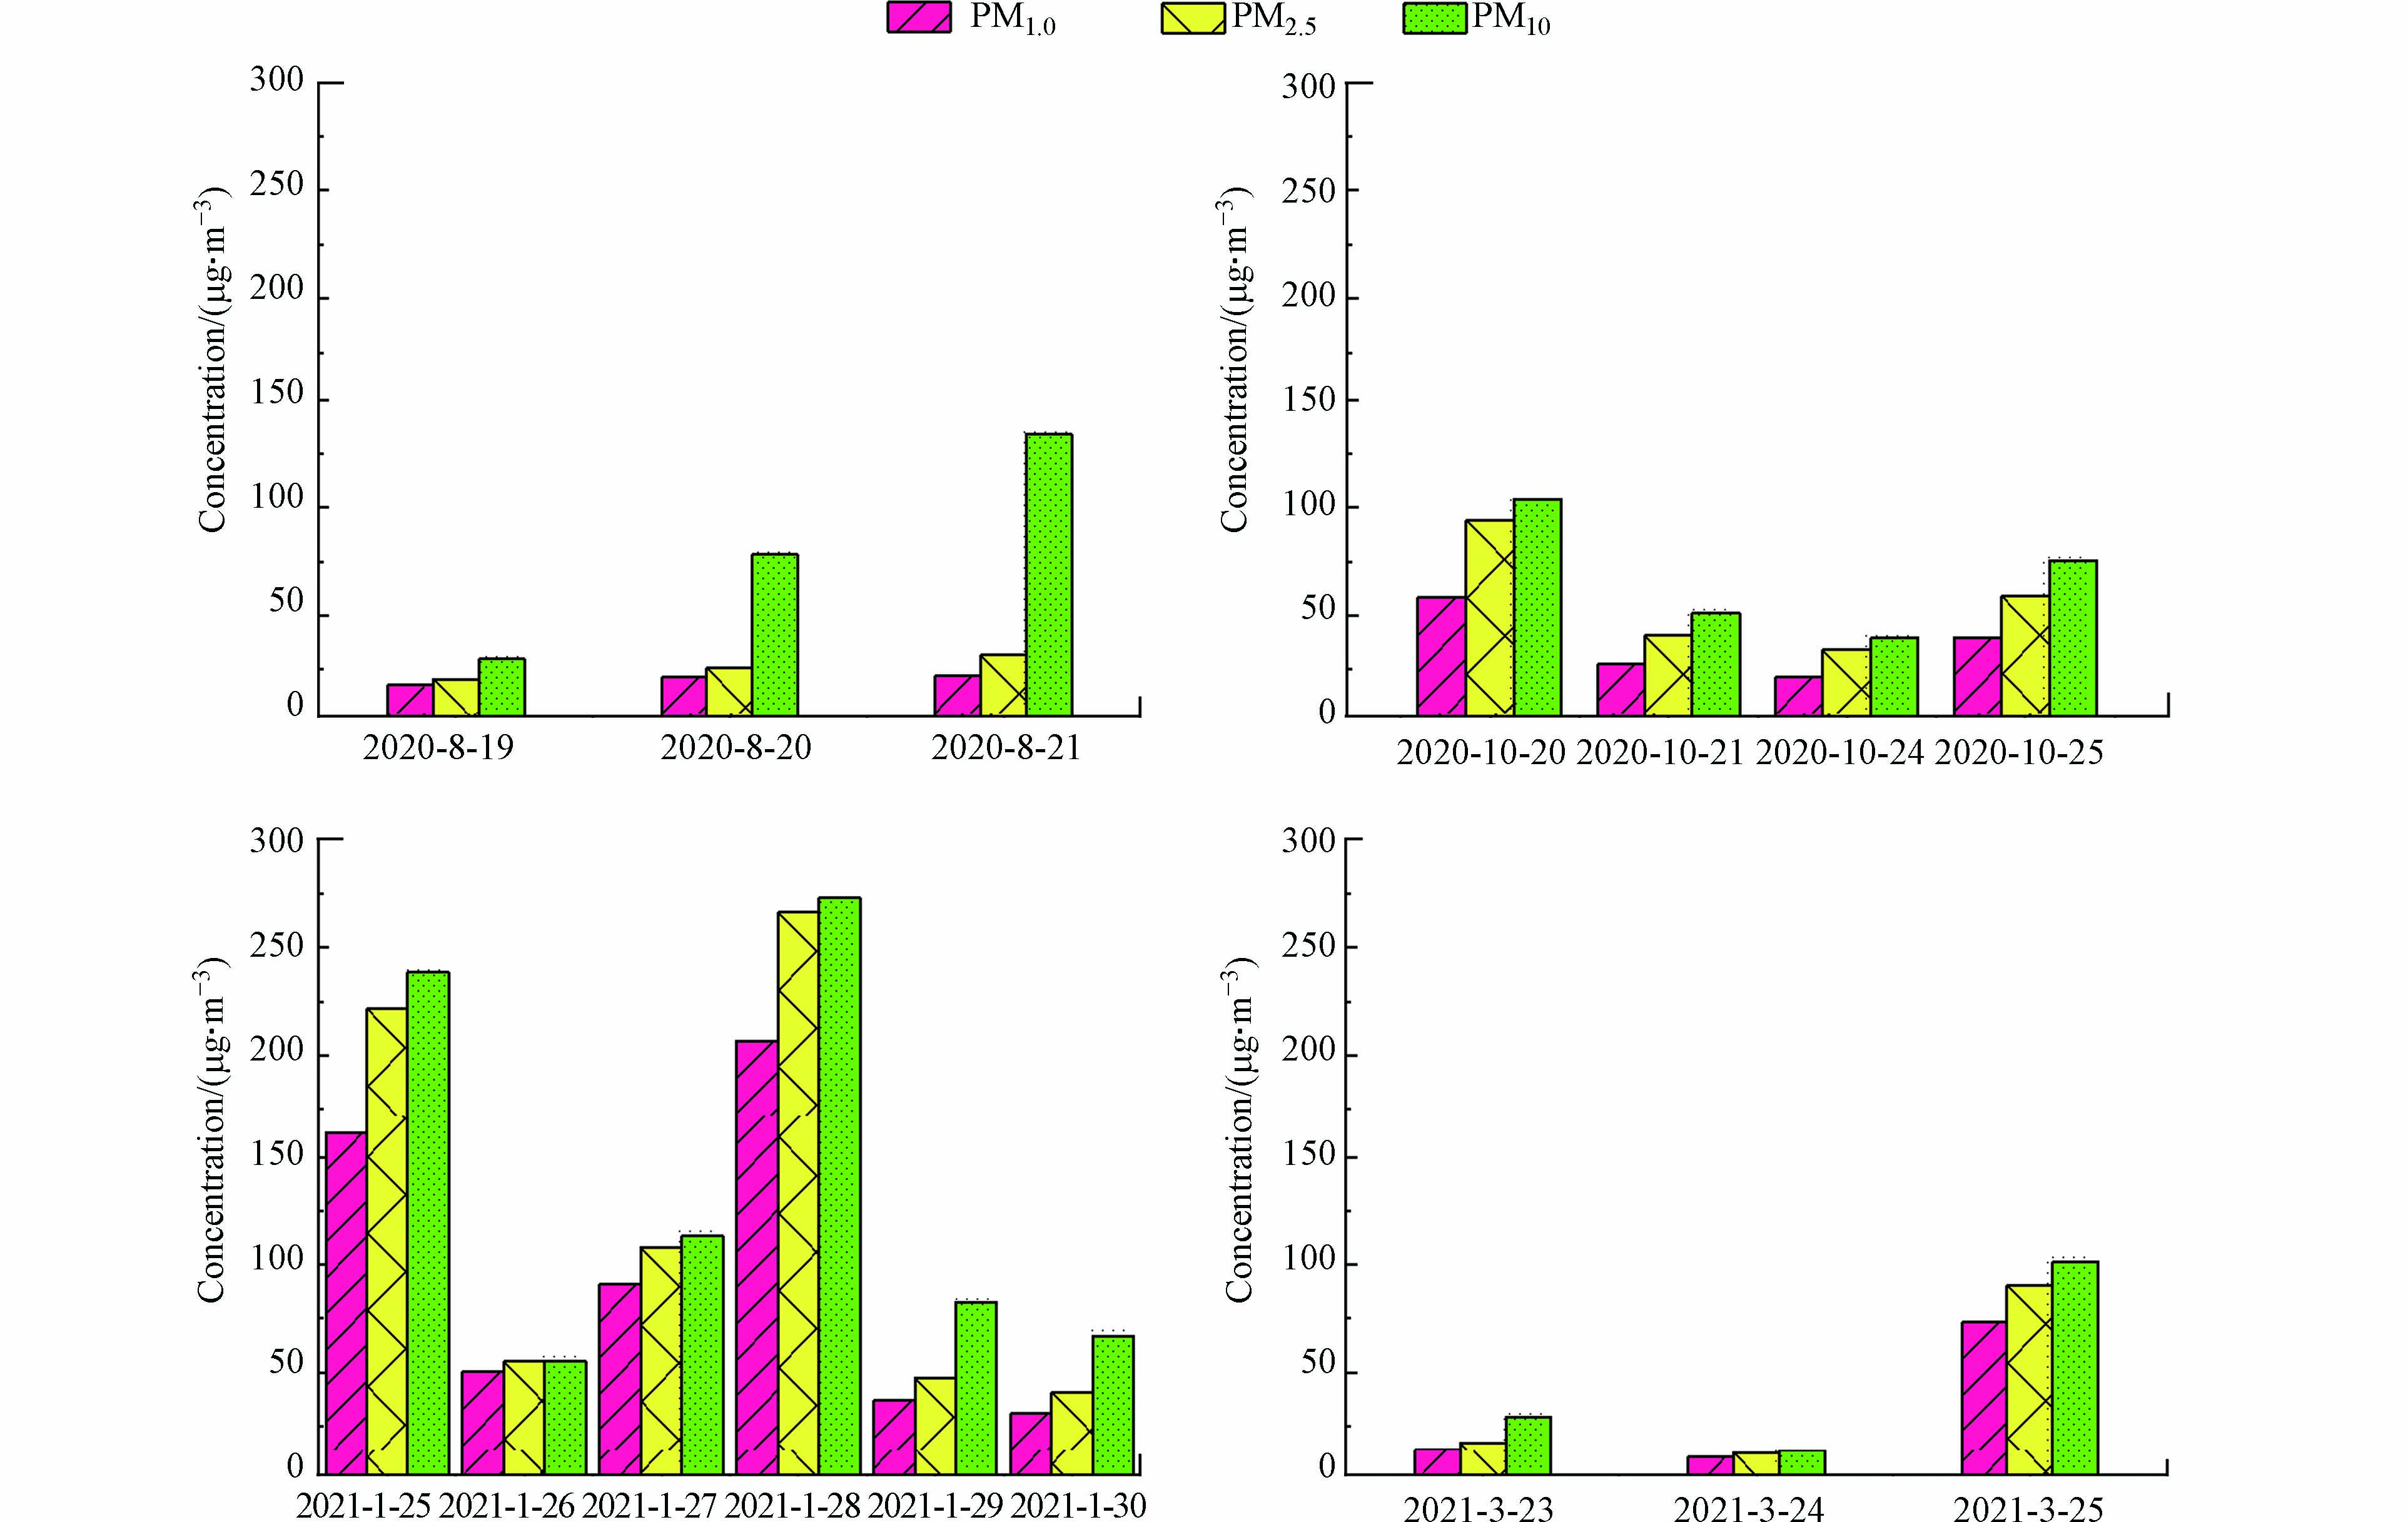
由于9时的污染情况最为严重,并且地面污染对人体有着直接的侵害,更加需要引起重视,所以选取了地面9时这一方向来展开研究。图5是2020年8月和10月,2021年1月和3月上虞园区在夏、秋、冬和春9时的地面PM浓度的日变化情况。
从图5能直观的看出冬季的地面PM浓度整体较高,其次是秋季。由表1可知,秋季和冬季的气温较低和RH较高导致地面PM浓度较高。这一情况与高空PM浓度整体变化情况一致,说明当高空污染较为严重的时候,地面污染程度也会相应的提高。不同粒径之间的地面PM浓度在夏季表现出较大差异,尤其是PM10在8月21日的浓度较高,接近了150 μg·m−3,远超过PM1.0浓度22.08 μg·m−3和PM2.5浓度31.89 μg·m−3。夏季,冬季和春季的地面不同粒径PM浓度变化大致呈相同的趋势,相关性较好,但是逐日变化均具有较大的波动,尤其是在冬季,地面PM浓度在1月28日最高,达到了275 μg·m−3,1月25日也达到了250 μg·m−3,而冬季其余实验日的地面PM浓度均在120 μg·m−3以下,实验期间地面PM最低浓度出现在3月24日,在25 μg·m−3以下,而在3月25日的地面PM浓度则突然升高,达到了100 μg·m−3,这可能与3月25日的气温较低并且RH较高有关,秋季的地面PM浓度在10月20日最高,也达到了100 μg·m−3,之后几天浓度降低,整体在50—75 μg·m−3之间,而2020年10月24日和10月25日虽然是周末,但PM污染并没有减轻太多,并且当天的气温较低,RH较高,地面PM容易积累,说明地面PM污染持续时间也较长,并没有得到很好的扩散。在这16d内,PM2.5浓度共有7d超过了国家二级标准(日均50 μg·m−3),超标倍数范围为1.10—5.32,PM10则有2d超过了国家二级标准(日均150 μg·m−3),分别是PM10国家二级标准的1.58倍和1.82倍,表明实验期间地面PM污染非常严重。
-
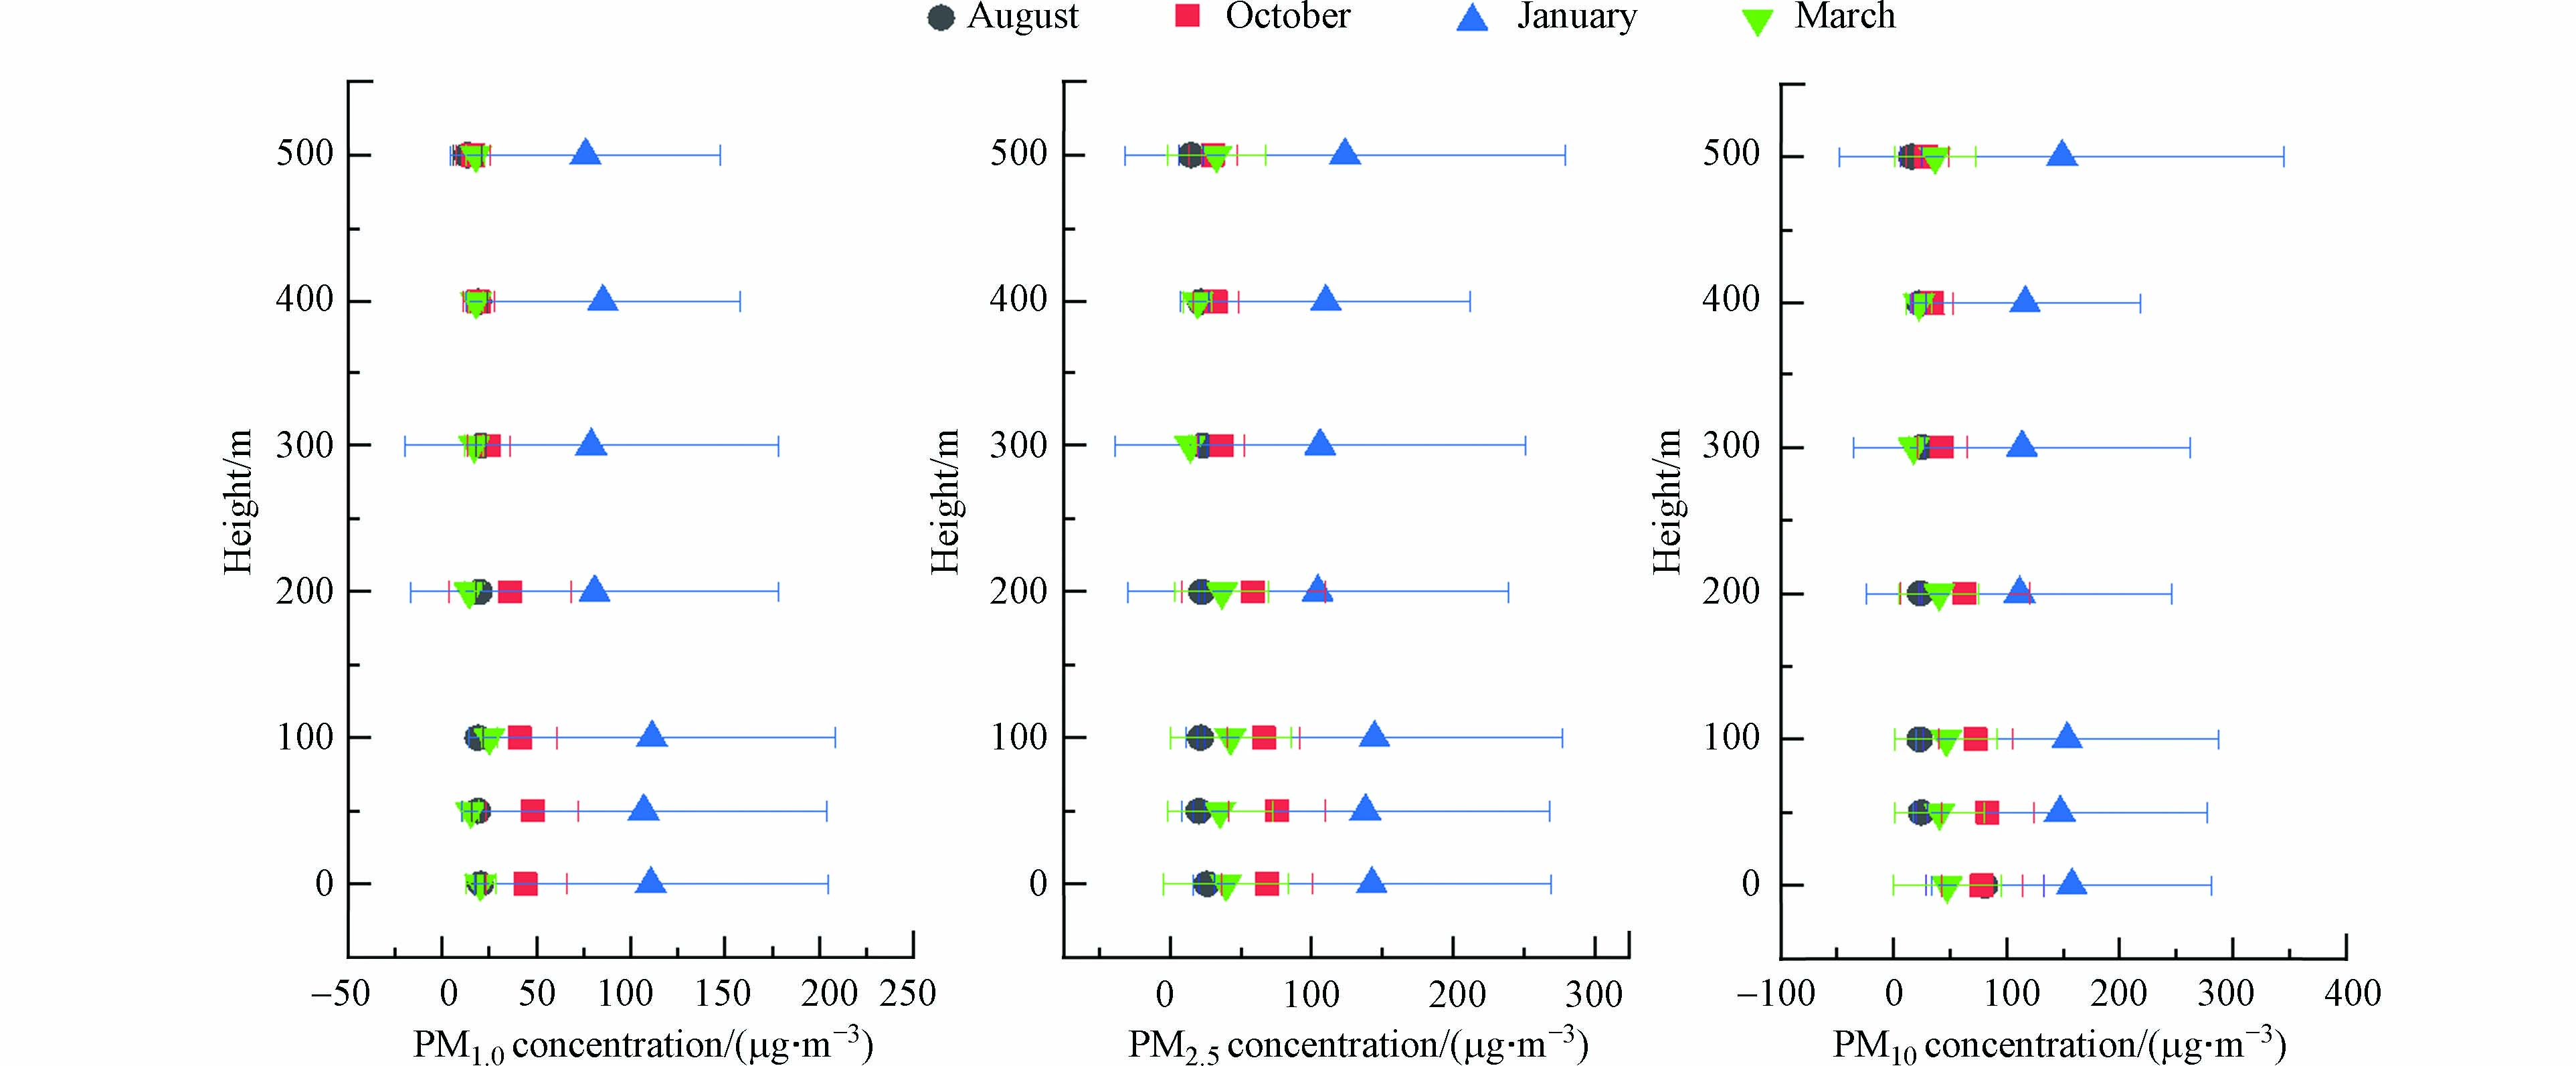
图6是PM在9时的月平均浓度垂直布情况。图中各点代表了各月不同高度层的平均浓度以及相应的误差棒,误差棒表示的是一个月内不同实验日PM浓度之间的离散程度。
由图6可知,PM9时的月平均浓度整体呈现出冬季(1月)>秋季(10月)>春季(3月)>夏季(8月)的趋势。在不同的高度层,冬季9时的PM平均浓度均最大,是其他季节的2.29—4.29倍。春、夏、秋季9时PM浓度随高度升高而降低,浓度分别从47.29 μg·m−3降低到36.62 μg·m−3、80.84 μg·m−3降低到15.59 μg·m−3、83.15 μg·m−3降低到29.32 μg·m−3,而冬季9时PM浓度则在200 m处出现一个拐点,从0到500 m,浓度先从141.43μg·m−3降低到130.50 μg·m−3,200 m后从130.50 μg·m−3升高到148.82 μg·m−3,在500 m高度层出现了较高于地面的浓度。由误差棒可知,3月,8月和10月的平均浓度较为稳定,而1月整体偏差较大,并在500 m高度层达到最大,这可能是由于1月9时的个别实验期间出现了重污染,并发生在高空500 m处,导致1月PM平均浓度整体偏高,PM浓度随着高度升高无明显降低。
-
从PM浓度逐日变化图中(图5)可知, 2021年1月28日的污染最严重。为了解当天污染由何种粒径的PM主导,对其进行了粒径分布分析。在计算PM数浓度时,发现粒径>1.59 μm的PM数量极少,可忽略不计,因此将粒径范围分为5个粒度级,分别是0.38—0.54 μm、0.54—0.78 μm、0.78—1.05 μm、1.05—1.34 μm和1.34—1.59 μm,不同粒径PM在不同时间点每升颗粒数随高度变化情况如图7所示。
由图7可知,1月28日的PM数浓度整体在9时最高,最高达到2.7×10⁵个·L−1,在17时整体最低,低于1.0×10⁵ 个·L−1。同一时段的PM数浓度在地面达到最高,这可能是由于前一晚的PM向地面输送,增加了在地面的累积。所有时间段中,在0.38—0.54 μm粒径范围的PM数浓度最高,数浓度大小排序为0.38—0.54 μm>0.54—0.78 μm>0.78—1.05 μm>1.05—1.34 μm>1.34—1.59 μm,随着粒径增大,PM数浓度明显下降,0.38—0.54 μm的数浓度是0.54—0.78 μm数浓度的2.80倍,说明化工园区的PM主要以细粒子为主,特别是由0.54 μm以下的细粒子贡献。
-
PM浓度在秋冬季显著高于春夏季,PM浓度的中位数为67.82 μg·m−3(冬季)>60.21 μg·m−3(秋季)>26.01 μg·m−3(春季)>24.95 μg·m−3(夏季)。长三角化工园区的PM浓度在0—500 m范围,总体随高度的升高而下降,但2021年1月出现了PM浓度随高度升高而上升的现象,这可能是由于逆温影响或者发生了高空污染事件。最高或者最低PM污染浓度主要出现在300 m和400 m高度层,这可能是由于本化工园区的污染排放加上季节风向将众多污染聚集或吹散至这两个高度。在一天中,PM污染浓度往往在9时达到最高,13时达到最低,这可能是由于9时汽车尾气排放增加,而中午边界层升高,PM扩散更加活跃。由9时地面PM的逐日变化可知,在16 d内,PM2.5浓度共有7 d超过国家二级标准(日均50 μg·m−3),超标倍数范围为1.10—5.32,PM10则有2 d超过了国家二级标准(日均150 μg·m−3),分别是PM10国家二级标准的1.58倍和1.82倍。由粒径分析可知,在污染最为严重的当天,细PM(0.38—0.54 μm)在垂直剖面上的贡献最大,并且随高度升高而减少,粒径越大,颗粒数也越少。通过相关分析可知,PM1.0、PM2.5和PM10三者存在显著的正相关关系,大气PM的浓度分别与气温、RH呈正相关、与风速呈负相关的关系。本文研究将有利于相关学者更好的了解长三角典型化工园区大气PM的时空分布特征,为化工园区的大气环境颗粒污染物监测及治理提供理论支持,有利于为相关部门制定相关大气污染治理的政策和标准提供科学依据。
基于无人机研究长三角化工园区颗粒物垂直廓线
Vertical profiles of particulate matter in a chemical industrial park of Yangtze River Delta studied by a sensor on an unmanned aerial vehicle
-
摘要: 化工园区的颗粒物污染非常严重,但目前对化工园区的颗粒物垂直廓线研究甚少,导致无法科学地评估化工园区的颗粒物排放对周边地区的影响。在2020年8月—2021年3月期间于杭州湾上虞经济技术开发区开展了23d,共计151次的颗粒物(PM1.0、PM2.5、PM10)垂直观测实验。利用无人机搭载微型检测仪研究化工园区0—500 m高度内颗粒物在不同季节及一天中的不同时间点(9、11、13、15、17时)的分布特征。结果表明,颗粒物平均浓度大小为冬季>秋季>春季>夏季,且秋冬季颗粒物浓度远大于春夏季,最高可达152.00 μg·m−3。由相关性分析可知,颗粒物分别与大气温度和相对湿度呈正相关,与风速呈负相关关系。颗粒物浓度总体随高度的升高而降低,由于粒径和质量影响,下降速率呈现为PM10>PM2.5>PM1.0。由粒径分析可知,在颗粒物浓度最高的当天,颗粒物数浓度主要由0.38—0.54 μm细粒子组成。由日变化可知,颗粒物浓度一般在9时达到最高,在13时达到最低。Abstract: The particle pollutions in chemical parks are quite serious, but there is little research on vertical profile of particulate matters (PM) in chemical parks recently, which makes it impossible to scientifically evaluate the impact of PM emissions from chemical parks on surrounding areas. From August 2020 to March 2021, a total of 151 vertical flights to observe of the vertical profiles of particulate matter (PM1.0, PM2.5, PM10) had been conducted in Shangyu Economic and Technological Development Zone of Hangzhou Bay during 23 d. The seasonal and diurnal variations of PM vertical profile in the range of 0—500 m height were studied by a micro-detector on an UAV. The seasonal concentration of PM is the highest in winter followed by autumn, spring, and summer, respectively. The PM concentrations in autumn and winter with peak value of 152.00 μg·m−3 were much higher than those in spring and summer. Correlation analysis shows that PM concentration is positively correlated with atmospheric temperature and relative humidity, and negatively correlated with wind speed. PM concentration generally was found to decrease with the increase of height in this study with their rates highest in PM10 followed by PM2.5, PM1.0 in order is due to particulate size and mass. Particle size analysis showed that the PM with their diameters in the range of 0.38—0.54 μm are the dominant on the day with the highest PM concentration. In the diurnal variation, the PM concentration generally reached its peaks at 9 o 'clock and the lowest at 13 o 'clock.
-
Key words:
- vertical observation /
- particulate matter /
- chemical industrial park /
- seasonal variation
-
我国城市生活污水普遍存在碳氮比偏低的问题,难以实现深度的脱氮除磷。污水处理厂每天会排放大量的剩余污泥,处置起来比较困难[1]。针对此现象,将剩余污泥在碱性条件下发酵,不仅能解决污泥处置问题,而且发酵产生的挥发性脂肪酸(VFAS)能够提供微生物生长所需的优质碳源[2-3]。但是将剩余污泥在碱性条件下发酵所产生的发酵液脱水性能较差,含有大量黏度极高的有机物质[4],以其作为外加碳源,可以很好地解决生活污水中碳氮比偏低的问题,但往往会使活性污泥絮凝沉降性能恶化,发生黏性污泥膨胀。黏性污泥膨胀是一种由于菌胶团细菌大量累积高黏性物质,或过量繁殖引起的无丝状菌过量生长的污泥沉降性能变差的现象,其发生的主要原因包括含大量黏性物质的污水水质、低温或温度波动较大、某些营养物质的缺乏以及过高或过低的污泥负荷[5-6]。
活性污泥絮凝、沉降性能的好坏与其絮体表面特性、胞外聚合物(EPS)等有关[7-8]。已有研究[9-11]认为活性污泥表面电荷量与其絮凝、沉降性能密切相关,而相对疏水性在活性污泥絮凝沉淀过程的作用目前还没有明确的定论。JIN等[12]认为疏水性的增高会导致沉降性能变差。但是也有与此矛盾的结果,龙向宇等[13]和SPONZA[14]得出污泥絮体疏水性的提高有助于污泥絮体凝聚。EPS在活性污泥絮凝沉降过程中会起到十分重要的作用,其含量和组成会对污泥表面物化性质产生影响[15-16]。EPS可分为松散结合的胞外聚合物(LB-EPS)和紧密结合的胞外聚合物(TB-EPS)[17],LB-EPS位于外层且结构松散,是无明显界限的黏液层;TB-EPS位于内层且具有一定的形状,与细胞表面结合的较为紧密,不易提取。关于EPS含量与污泥絮凝沉降之间的关系还存在许多分歧[18-19]。
目前,实验室和污水厂都有关于黏性膨胀的报道,但以剩余污泥碱性发酵液为碳源引发的黏性污泥膨胀的机理和对黏性膨胀污泥特性的研究[20]还较少。基于此,本研究针对SBR中以剩余污泥碱性发酵液为碳源发生的黏性膨胀现象,分析黏性膨胀产生的原因,考察黏性膨胀污泥絮凝沉降性能与活性污泥表面性质、胞外聚合物之间的相关性,为实际工程中以发酵液为碳源的污泥黏性膨胀问题提供参考。
1. 材料与方法
1.1 实验装置与运行方式
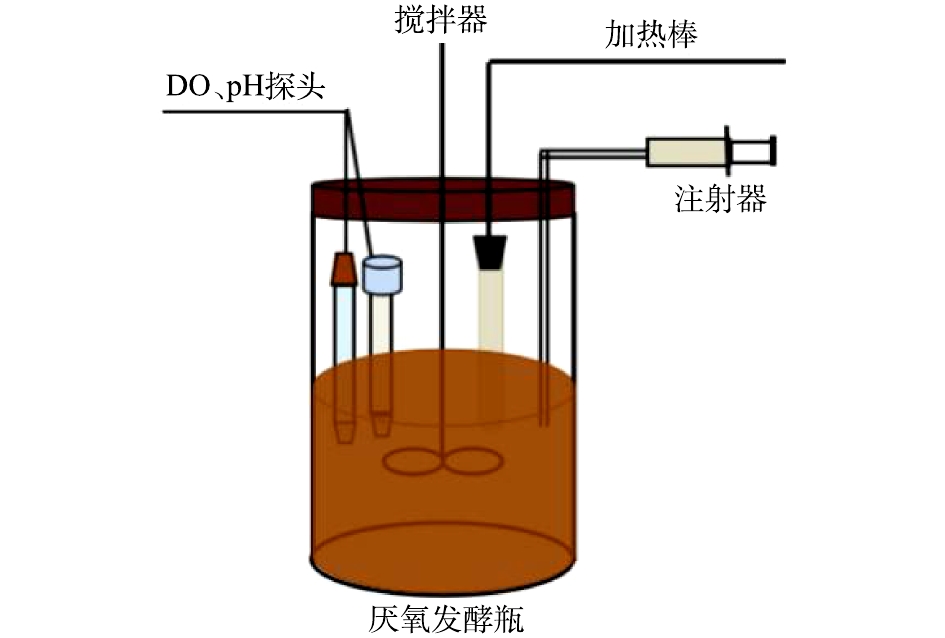
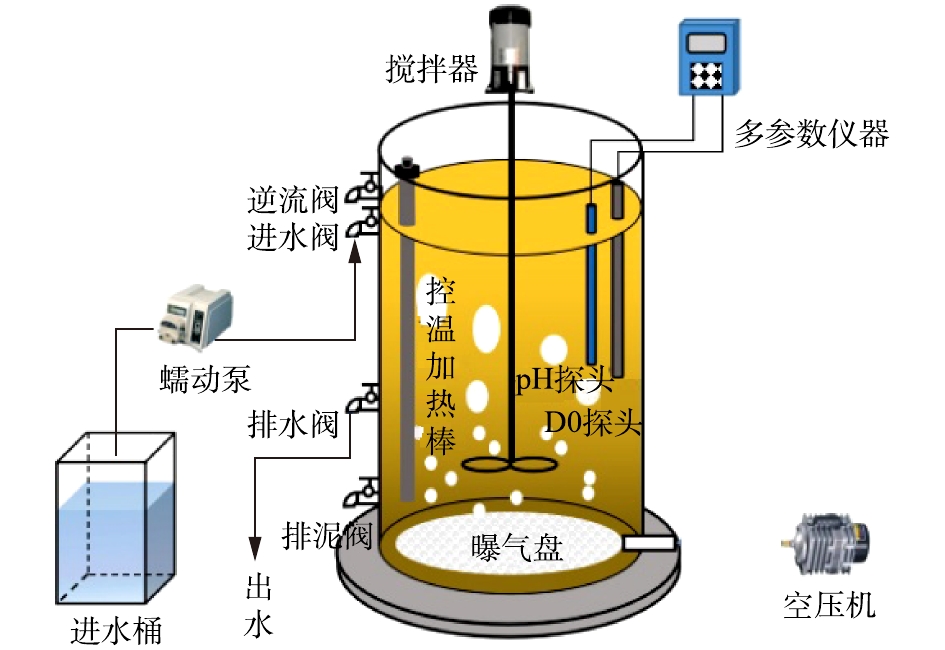
实验期间所用的实验装置主要包括SBR和厌氧发酵装置。如图1所示,SBR有效容积为8 L。4 L的位置设出水口,使得排水比为50%,顶部外侧设进水口,连接蠕动泵控制每周期的进水量。SBR内壁上具有固定DO、pH探头的孔位,在其底部固定曝气盘,由鼓风机压缩空气进入曝气盘,在其顶部安装电动搅拌桨,使液体混合均匀。如图2所示,厌氧发酵装置由有机玻璃制成,总有效容积为3 L,顶部密封,留有进泥口,pH、DO探头,加热棒孔位。厌氧发酵装置上部连接电动搅拌桨,使污泥充分搅拌。用加热棒维持发酵液温度为35 ℃。pH、DO探头实时监测发酵液的pH和DO浓度。每天加入NaOH溶液,维持发酵液的pH为10。发酵装置中投加的污泥浓度为(10 000±500) mg·L−1,控制污泥龄为8 d。
SBR按照缺/好氧的方式运行(图3),每天运行3个周期,每周期8 h。好氧阶段溶解氧浓度维持在(2.0±0.1) mg·L−1,整个反应过程温度控制在(25±0.1) ℃。
1.2 实验水质与接种污泥
实验分为2个阶段:驯化阶段以某高校家属区实际生活污水为实验用水,水质参数如下:COD为111.5~405.5 mg·L−1、
NH+4 -N为28.56~79.24 mg·L−1、NO−2 -N为0~0.27 mg·L−1、NO−3 -N为0.01~0.27 mg·L−1、PO3−4 -P为2.3~7.2 mg·L−1;驯化结束后,投加以污泥碱性发酵液为碳源的配水,投加氯化铵和磷酸二氢钾补充氮源和磷源,同时投加氯化钙和硫酸镁作为营养液以及添加微量元素,配水水质如下:COD为300~350 mg·L−1,NH+4 -N为40 mg·L−1,PO3−4 -P为8 mg·L−1,CaCl2为11.10 mg·L−1,MgSO4·7H2O为91.20 mg·L−1,微量元素浓度为100 mL·L−1。微量元素配制方法如下:EDTA 10 mg·L−1、KI 0.18 mg·L−1、CoCl2·6H2O 0.15 mg·L−1、Na2CoO4·2H2O 0.06 mg·L−1、MnCl2·4H2O 0.12 mg·L−1、CuSO4·5H2O 0.03 mg·L−1、H3BO3 0.15 mg·L−1、FeCl3·6H2O 1.5 mg·L−1。
接种污泥取自北京某污水处理厂二沉池回流污泥,该污泥呈黄褐色,浓度为10 000 mg·L−1,经过稀释后接种。污泥中几乎无丝状菌,污泥絮体之间结合紧密,压缩、沉降性能和活性较好,SVI为70~90 mL·g−1。
1.3 分析方法
在分析过程中,对污泥形态进行了染色镜检观察,对污泥沉降性能(SVI)、污泥粒径、污泥表面电荷(Zeta电位)、污泥相对疏水性(RH)和污泥胞外聚合物(EPS)等内容进行了测定。污泥SVI采用静沉法[6]测定;Zeta电位采用Microtrac Zetatrac电位仪测定;污泥粒径采用Microtrac S3500型激光粒度仪测定。污泥相对疏水性(RH)的测定方法[21]:泥水混合液离心后,用蒸馏水清洗3次;使用玻璃棒研碎颗粒,用蒸馏水稀释至原体积。超声波处理后,静止5~8 min,取上清液在600 nm波长处测定吸光度(A)。取上述步骤中的水样,向其中加入正辛烷或十六烷,振荡;静沉5~8 min后取水相,在600 nm波长处测吸光度(B);根据式(1)计算RH。
P=(1−BA)×100% (1) 式中:P为污泥的相对疏水性;A为超声波处理后水样在600 nm波长处的吸光度;B为加入正辛烷或十六烷后水样在600 nm波长处的吸光度。
胞外聚合物(EPS)的提取方法[22]:取泥样(混合态),离心10 min后,上清液倒掉;将0.05%氯化钠溶液水浴加热70 ℃,将该溶液倒入离心之后的泥样中,定容至原体积,用涡旋混合器混合;泥样离心后,上清液过0.45 μm的膜即为LB-EPS;向泥样中加入氯化钠并定容至原体积,放入65 ℃水浴中,消解30 min,中间每5 min振荡一次;泥样离心后,上清液过膜即为TB-EPS;采用革兰氏和纳氏染色法,通过OLYMPUS-BX61显微镜观察污泥形态。
2. 结果与讨论
2.1 污泥形态特征及沉降性能分析
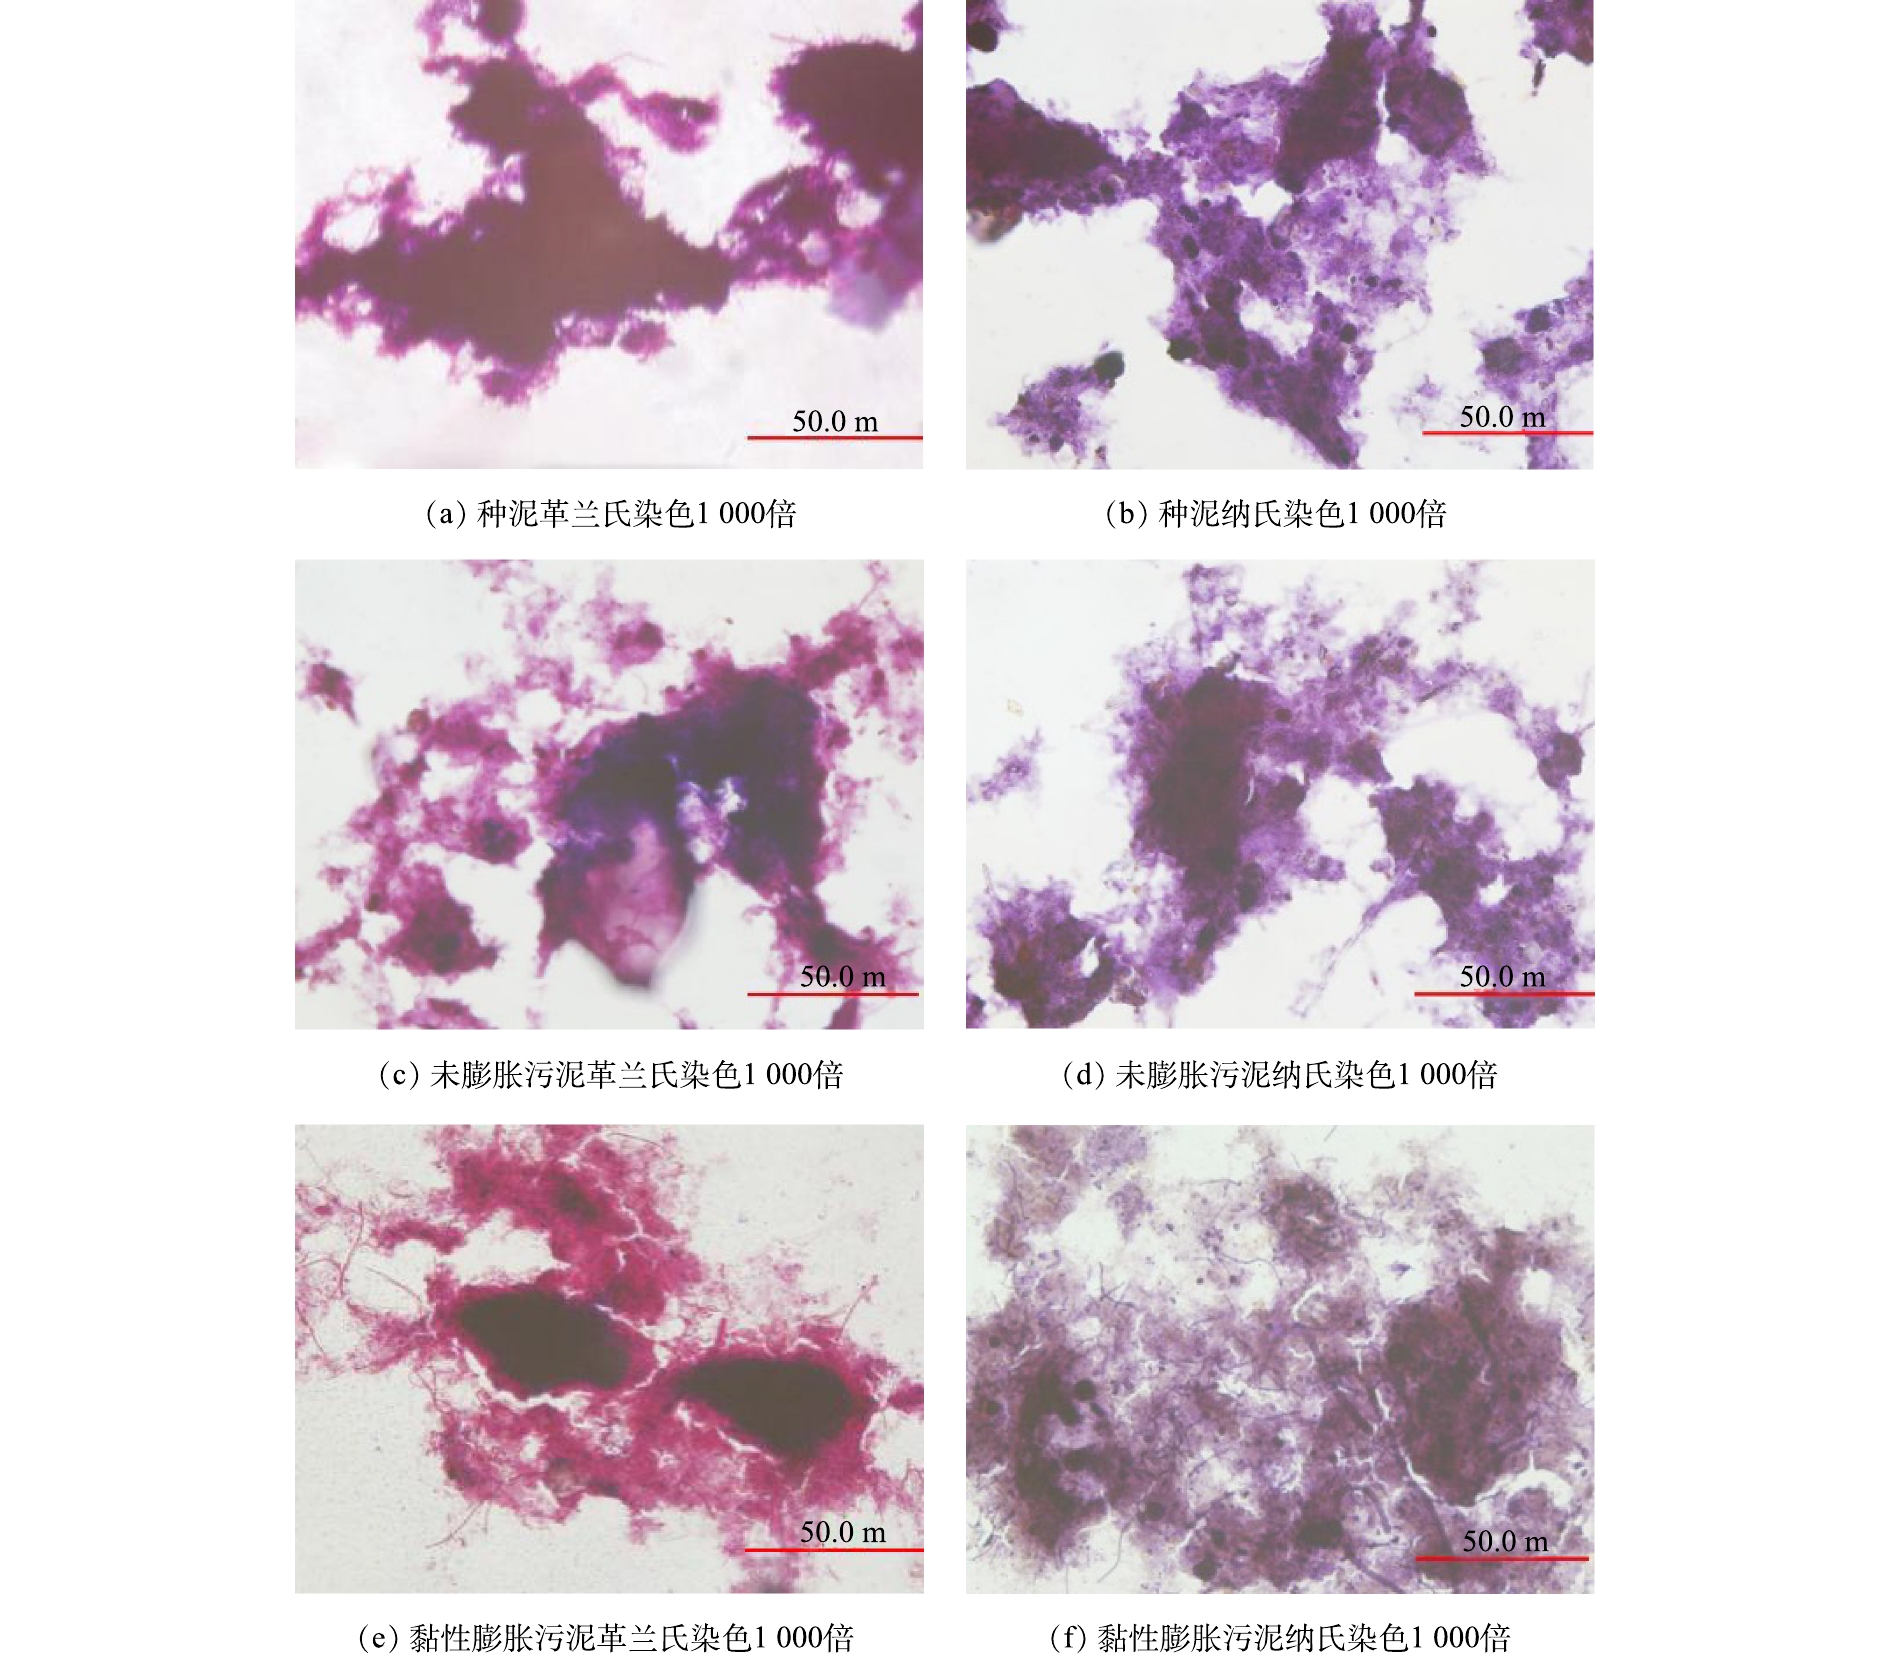
分别对种泥、未膨胀污泥和黏性膨胀污泥进行革兰氏染色和纳氏染色,随后在显微镜下观察污泥形态特征。如图4(a)和图4(b)所示,种泥中几乎没有丝状菌伸出菌胶团之外,污泥絮体之间结合紧密,絮凝沉降压缩性能较好。如图4(c)和图4(d)所示,目测未膨胀污泥絮体丝状菌丰度值约为1,较种泥中有所增加,但是总量远低于菌胶团细菌,污泥絮体结构较种泥稍开放、松散,沉降压缩性能良好。如图4(e)和图4(f)所示,恶性膨胀污泥SVI达到540 mL·g−1,但仅观察到少量的丝状菌从菌胶团中伸出,丝状菌丰度值约为2,污泥从正常的紧凑絮凝物变成更为开放、松散的不规则絮状物,并且有许多游离细菌,表明SBR中SVI的上升不是因为丝状菌的过度增殖,而是由于发生了黏性污泥膨胀。
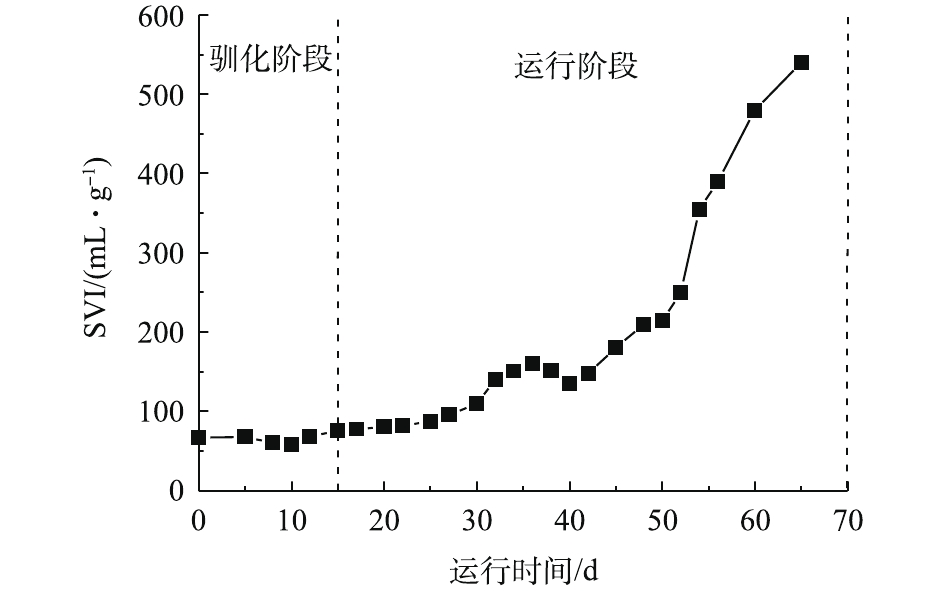
如图5所示,前15 d为驯化阶段,此阶段每天投加生活污水,SVI维持在70 mL·g−1左右,污泥沉降性能良好。驯化结束后,每天加入以发酵液为碳源的配水,进水COD为300~350 mg·L−1,经过30 d左右的运行,SBR的SVI由最初的70 mL·g−1升高至150 mL·g−1左右,此时未发生污泥膨胀。随着运行时间的推移,SVI逐渐升高,最终达到540 mL·g−1,泥水难以分离,发生严重的黏性膨胀。剩余污泥在碱性发酵时会产生大量有机物,这些有机物主要是强碱条件下剩余污泥中微生物细胞壁破裂,细胞中流出的物质发酵产生的挥发性脂肪酸(VFA),在生物脱氮除磷过程中,VFA是微生物容易利用的有机物。短时进水的运行模式也保障了SBR内具有较高的底物浓度梯度,同时在好氧阶段反应器内溶解氧充足。根据动力学选择理论,在底物含量充足的条件下,绝大多数的菌胶团细菌比丝状菌的KS和Umax值要高,因此,丝状菌生长受到限制,菌胶团细菌生长占优势。与其他强碱相比,用NaOH调节pH时,污泥发酵混合液的脱水性能较差;同种强碱条件下,温度为35 ℃的发酵混合液脱水性能比25 ℃差,虽然产生的有机物含量较高,但是增加了发酵混合液黏性[23-24]。本研究剩余污泥在35 ℃条件下发酵且用NaOH调节pH,故产生的发酵混合液脱水性能差、黏度高。因此,将其作为碳源加入SBR内,会造成泥水分离困难、沉降性能逐渐恶化,最终导致反应器内发生黏性膨胀。
2.2 污泥胞外聚合物分析
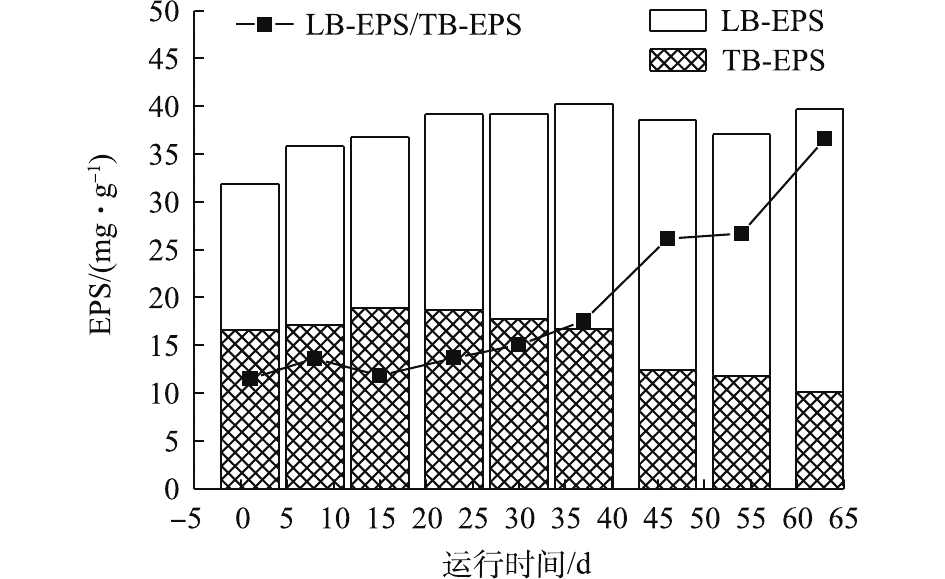
如图6所示,在黏性膨胀的过程中,EPS总量变化不大,但LB-EPS含量逐渐增加,TB-EPS含量逐渐降低,且LB-EPS含量变化幅度大于TB-EPS。以上研究结果表明,EPS总量与污泥沉降性能之间没有显著的相关性,应进一步研究LB-EPS和TB-EPS对污泥沉降性能的影响。
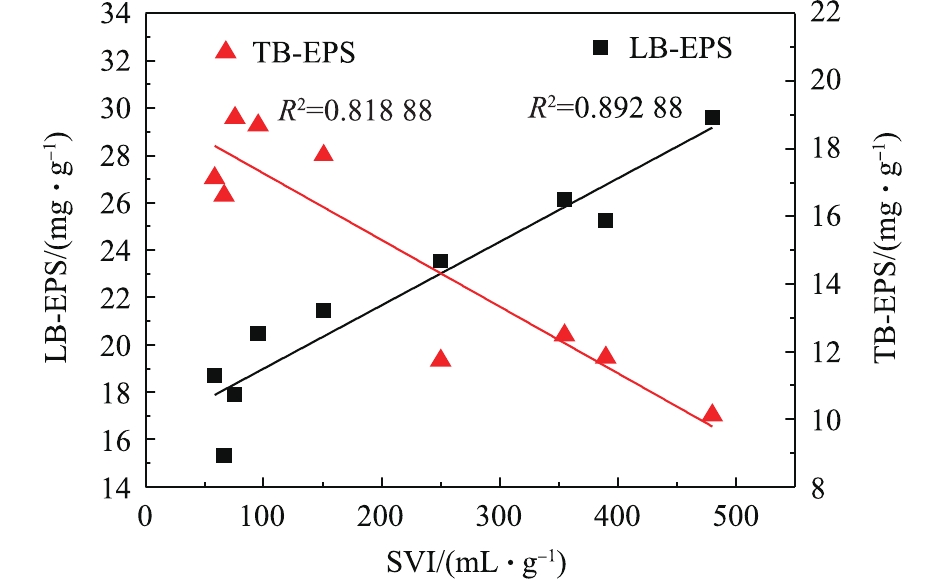
如图7所示,SVI与LB-EPS之间呈现出相对较强的相关性(R2=0.892 88),这表明LB-EPS的大量存在会对污泥絮凝沉降产生不利影响。随着发酵液的不断投加,泥水混合液脱水性能变差,泥水分离困难,导致污泥絮体结构松散,产生具有较低密度且高度多孔的污泥絮凝物。LB-EPS位于胞外聚合物的外层,是可以向周围环境扩展的黏液层,此时大量的结合水会进入污泥絮体中,因此,污泥絮体含水率不断增大,LB-EPS含量也会逐渐增高。然而TB-EPS位于胞外聚合物的内层,流变性较小,与细胞之间的结合较为紧密,能稳定地附着在细胞壁上。但是在污泥絮体外层结构逐渐开放、脆弱的过程中,TB-EPS也会受到一定外部水力作用的冲击,造成含量下降。但与LB-EPS相比,其含量的变化相对较小而且对污泥沉降性能的影响不显著。
2.3 污泥表面物理特性分析
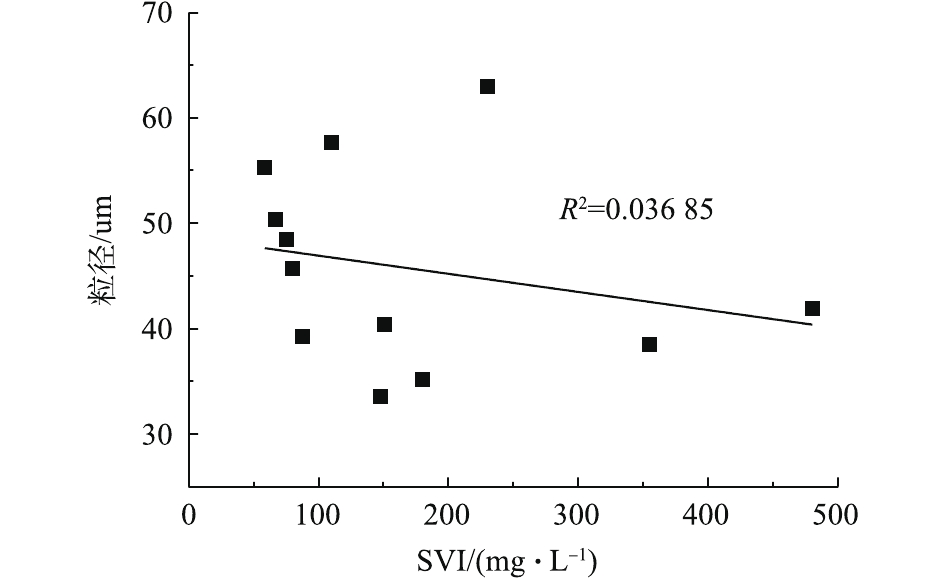
如图8所示,在污泥黏性膨胀的过程中,污泥沉降性能(SVI)与污泥絮体的粒径大小之间没有相关性(R2=0.036 85),这表明在本研究中污泥沉降性能的好坏对粒径大小没有影响。这可能是因为活性污泥絮体的结构、组成成分较为复杂,粒径只是对其表观尺寸的测量,并不能反映其复杂的内部结构[25]。
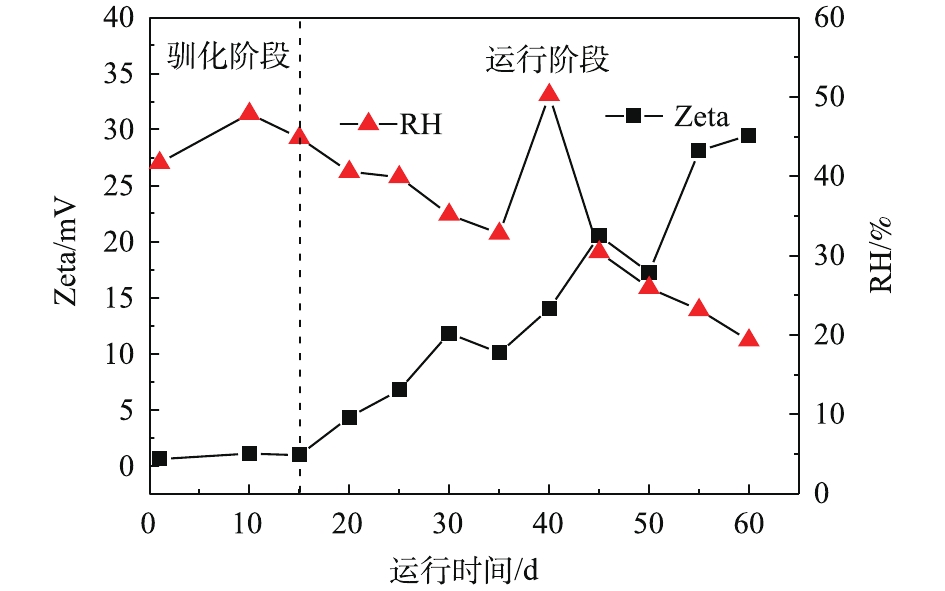
图9为SBR不同阶段中Zeta电位绝对值的变化情况,在污泥膨胀的过程中污泥絮体具有净负表面电荷,且Zeta电位的绝对值呈现上升的趋势。
图10为SVI数值与Zeta电位绝对值的比较结果。可以看出,两者呈正相关性(R2=0.837 71),即Zeta电位绝对值越高,污泥絮体表面负电荷越多,絮凝沉降性能越差。在厌氧发酵的过程中,剩余污泥自身的EPS会由细胞相转化为溶解态,溶解态的EPS会携带负电荷,随着发酵液的不断投加,负电荷逐渐积累。本研究以NaOH调节pH,Na+作为一价阳离子,不能中和大量的负电荷,不能压缩污泥絮体表面的双电层,因此,导致污泥表面的负电荷逐渐积累,进一步使颗粒间的静电斥力增加,从而打破静电斥力与范德华引力之间平衡,进而使系统中的细菌和絮状物难以相互吸附,污泥絮体处于扩张的状态,造成沉降性能的恶化。然而经典的DLVO理论[18]是基于粒子表面光滑、形状均匀的这个假设,但实际上,由于EPS的存在,活性污泥絮体表面极其复杂,因此,还应该研究EPS对Zeta电位的影响。
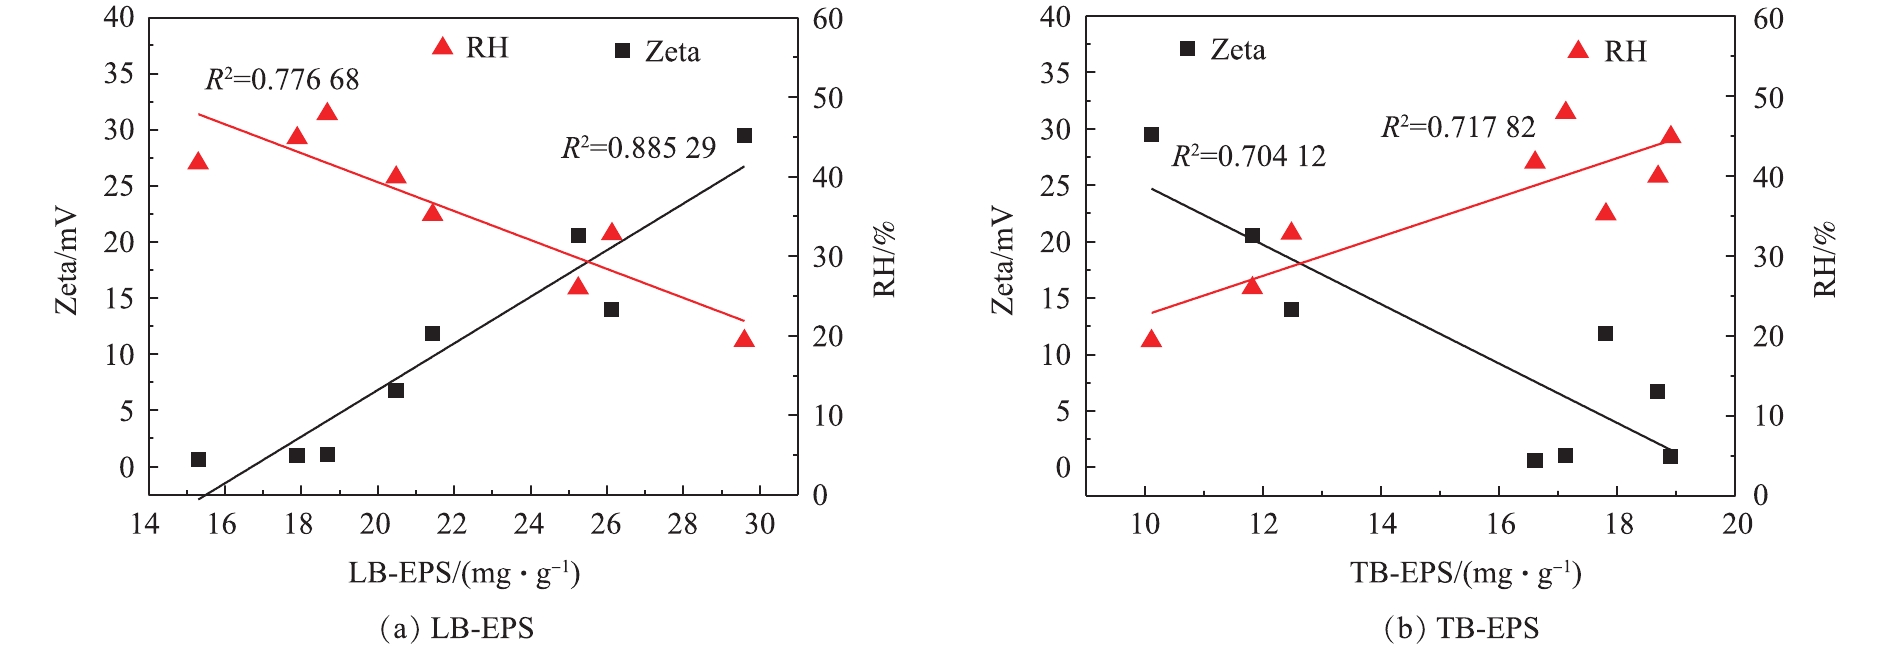
如图11所示,LB-EPS浓度与Zeta电位绝对值有显著相关性(R2=0.885 29),TB-EPS浓度与Zeta电位绝对值相关性较低(R2=0.678 54)。污泥絮体表面电荷的数量取决于离子化基团的数量,LB-EPS位于外层,含有的离子化基团数量较多,直接影响污泥絮体表面电荷的数量,其含量的变化对污泥表面电荷的影响较大。TB-EPS位于内层,其内部各种大分子排列紧密,与污泥絮体表面电荷关联较小,所以其含量变化对Zeta电位影响有限。
图9为SBR系统内相对疏水性(RH)的变化情况。可以看出,随着污泥的SVI不断提高,污泥的RH逐渐降低。通过比较SVI值与RH(图10)可以发现,两者有一定的负相关性(R2= 0.678 54),这表明RH降低会导致沉降性能变差。当疏水作用克服污泥表面负电荷之间的静电斥力后,污泥中菌胶团或单个细胞才能够相互靠近,絮体才能通过阳离子结合,最终通过氢键稳固絮体结构。以上结果表明,活性污泥的絮凝沉降性能与污泥表面负电荷和污泥絮体的RH三者紧密相关,污泥表面负电荷的积累会对污泥的疏水能力产生不利影响,进而导致污泥沉降性能变差。
由图11可见,与TB-EPS(R2=0.717 82)相比较,LB-EPS(R2=0.776 68)与相对疏水性的相关性稍强。LB-EPS中含有带电或极性官能团数量较多,在氢键的作用下,这些官能团易于与水分子相结合,形成一个含水率较高的黏液层,且会削弱絮凝物之间的结合作用,使污泥絮体处于扩张的状态,此时污泥具有更大的比表面积,疏水能力下降,含水率增加。而TB-EPS在内层,体积小且密度大,与细菌之间结合的较为紧密,而且含有较少量的带电官能团和极性基团,内部含有的结合水较少,其含量的较小变化不足以对污泥的相对疏水性能产生较大的影响[26-27]。
3. 结论
1)采用SBR,以剩余污泥碱性发酵液作为进水碳源,经过55 d的运行后,SVI逐渐升高至540 mL·g−1,最终发生黏性污泥膨胀。
2)在发生黏性膨胀的过程中,EPS总量变化并不大且与污泥沉降性能无显著相关性,但其结构发生显著变化,LB-EPS/TB-EPS比例由0.92增加至2.92,位于外层且结构松散的LB-EPS含量显著增大,位于内层且结构紧密的TB-EPS含量降低,这是导致污泥絮体呈现松散状态的主要原因。与TB-EPS相比较,LB-EPS对污泥沉降性能、表面电荷累积、疏水能力的影响更显著。
3)在黏性膨胀的过程中,污泥的表面性质对污泥沉降性能也会产生较大的影响,Zeta电位绝对值越大,RH越小,活性污泥的沉降性能越差。黏性膨胀污泥粒径与沉降性能之间并无直接相关性。
-
表 1 实验期间气象参数记录情况
Table 1. Meteorological parameter record table during the experiment
日期Date 最低—最高温度/℃Minimum - maximum temperature RH/% 风速风向 2020.08.19 27—36 55 东南风2级 2020.08.20 27—37 57 东南风2级 2020.08.21 27—35 60 东南风2级 2020.10.20 15—22 83 东北风2级 2020.10.21 16—19 86 西北风2级 2020.10.24 12—19 69 东北风2级 2020.10.25 10-—18 80 东南风1级 2021.01.25 8—15 90 西北风1级 2021.01.26 9—10 91 西北风2级 2021.01.27 8—9 90 东北风2级 2021.01.28 7—12 70 西北风3级 2021.01.29 5—10 62 东北风2级 2021.01.30 5—15 64 东南风1级 2021.03.23 12—29 53 东南风2级 2021.03.24 13—29 67 东南风2级 2021.03.25 12—29 75 东北风1级 注:风速0.3—1.5 m·s−1为1级风,1.6—3.3m/s为2级风,3.4—5.4m/s为3级风 Note: Wind speeds of 0.3—1.5 m·s−1 are force 1, 1.6—3.3 m·s−1 are Force 2, and 3.4—5.4 m·s−1 are force 表 2 PM浓度在不同季节每上升百米的变化情况
Table 2. Variation of particulate matters concentration in different seasons for each rising by 100m
PM1.0/(μg·m−3) PM2.5/(μg·m−3) PM10/(μg·m−3) 夏(2020年8月)Summer −0.37 −1.04 −11.70 秋(2020年10月)Autumn 0.98 0.86 0.60 冬(2021年1月)Winter −4.85 2.67 40.08 春(2021年3月)Spring −0.74 −1.02 −1.96 注:负值代表PM浓度随着高度升高而减小. Note: Negative values indicate that the concentration of particles decreases with the increase of height. 表 3 不同粒径PM相关性分析
Table 3. Correlation analysis of particles of different sizes
平均值Average value 标准差Standard deviation PM1.0 PM2.5 PM10 PM1.0 55.09 33.62 1.00 PM2.5 72.74 44.48 0.99* 1.00 PM10 87.71 53.16 0.96* 0.99* 1.00 * P<0.05. -
[1] WANG D F, HUO J T, DUAN Y S, et al. Vertical distribution and transport of air pollutants during a regional haze event in Eastern China: A tethered mega-balloon observation study [J]. Atmospheric Environment, 2021, 246: 118039. doi: 10.1016/j.atmosenv.2020.118039 [2] HAN B, LIU Y T, WU J H, et al. Characterization of industrial odor sources in Binhai New Area of Tianjin, China [J]. Environmental Science and Pollution Research, 2018, 25(14): 14006-14017. doi: 10.1007/s11356-018-1596-z [3] DING A J, HUANG X, NIE W, et al. Significant reduction of PM2.5 in Eastern China due to regional-scale emission control: Evidence from SORPES in 2011–2018 [J]. Atmospheric Chemistry and Physics, 2019, 19(18): 11791-11801. doi: 10.5194/acp-19-11791-2019 [4] 王彤华. 基于无人机的颗粒物监测系统开发及应用研究[D]. 杨凌: 西北农林科技大学, 2020. WANG T H. Development and application of UAV particle monitoring system[D]. Yangling: Northwest A & F University, 2020(in Chinese).
[5] 曹云擎, 王体健, 高丽波, 等. 基于无人机垂直观测的南京PM2.5污染个例研究 [J]. 气候与环境研究, 2020, 25(3): 292-304. CAO Y Q, WANG T J, GAO L B, et al. A case study of PM2.5 pollution in Nanjing based on unmanned aerial vehicle vertical observations [J]. Climatic and Environmental Research, 2020, 25(3): 292-304(in Chinese).
[6] CHAN C K, YAO X H. Air pollution in mega cities in China [J]. Atmospheric Environment, 2008, 42(1): 1-42. doi: 10.1016/j.atmosenv.2007.09.003 [7] 常毅, 刘得守, 刘文君. 兰州城市大气中PM1.0污染特征研究 [J]. 中国环境监测, 2020, 36(4): 45-52. CHANG Y, LIU D S, LIU W J. Study on the pollution characteristics of PM1.0 in Lanzhou City [J]. Environmental Monitoring in China, 2020, 36(4): 45-52(in Chinese).
[8] 林瑜, 叶芝祥, 杨怀金, 等. 成都市中心城区大气PM1的污染特征及来源解析 [J]. 中国环境科学, 2017, 37(9): 3220-3226. doi: 10.3969/j.issn.1000-6923.2017.09.003 LIN Y, YE Z X, YANG H J, et al. Pollution level and source apportionment of atmospheric particles PM1 in downtown area of Chengdu [J]. China Environmental Science, 2017, 37(9): 3220-3226(in Chinese). doi: 10.3969/j.issn.1000-6923.2017.09.003
[9] 王东生, 彭仲仁, 李白, 等. 基于多旋翼无人机平台的大气PM2.5垂直结构观测技术 [J]. 装备环境工程, 2019, 16(6): 35-40. WANG D S, PENG Z R, LI B, et al. Vertical atmospheric structure observation technology based on multi-rotor unmanned aerial vehicle (UAV) platform [J]. Equipment Environmental Engineering, 2019, 16(6): 35-40(in Chinese).
[10] 王红丽, 高雅琴, 景盛翱, 等. 基于走航监测的长三角工业园区周边大气挥发性有机物污染特征 [J]. 环境科学, 2021, 42(3): 1298-1305. doi: 10.13227/j.hjkx.202007265 WANG H L, GAO Y Q, JING S G, et al. Characterization of volatile organic compounds (VOCs) using mobile monitoring around the industrial parks in the yangzte river delta region of China [J]. Environmental Science, 2021, 42(3): 1298-1305(in Chinese). doi: 10.13227/j.hjkx.202007265
[11] HUANG Y Z, GAO S, WU S J, et al. Stationary monitoring and source apportionment of VOCs in a chemical industrial park by combining rapid direct-inlet MSs with a GC-FID/MS [J]. Science of the Total Environment, 2021, 795: 148639. doi: 10.1016/j.scitotenv.2021.148639 [12] CHEN R N, LI T Z, HUANG C T, et al. Characteristics and health risks of benzene series and halocarbons near a typical chemical industrial park [J]. Environmental Pollution, 2021, 289: 117893. doi: 10.1016/j.envpol.2021.117893 [13] HIGGINS C W, WING M G, KELLEY J, et al. A high resolution measurement of the morning ABL transition using distributed temperature sensing and an unmanned aircraft system [J]. Environmental Fluid Mechanics, 2018, 18(3): 683-693. doi: 10.1007/s10652-017-9569-1 [14] LIU B, WU C, MA N, et al. Vertical profiling of fine particulate matter and black carbon by using unmanned aerial vehicle in Macau, China [J]. Science of the Total Environment, 2020, 709: 136109. doi: 10.1016/j.scitotenv.2019.136109 [15] ŠTRBOVÁ K, RACLAVSKÁ H, BÍLEK J. Impact of fugitive sources and meteorological parameters on vertical distribution of particulate matter over the industrial agglomeration [J]. Journal of Environmental Management, 2017, 203: 1190-1198. doi: 10.1016/j.jenvman.2017.06.001 [16] HAN S, ZHANG Y, WU J, et al. Evaluation of regional background particulate matter concentration based on vertical distribution characteristics [J]. Atmospheric Chemistry and Physics, 2015, 15(19): 11165-11177. doi: 10.5194/acp-15-11165-2015 [17] RAN L, DENG Z Z, XU X B, et al. Vertical profiles of black carbon measured by a micro-aethalometer in summer in the North China Plain [J]. Atmospheric Chemistry and Physics, 2016, 16(16): 10441-10454. doi: 10.5194/acp-16-10441-2016 [18] STRAWBRIDGE K B, SNYDER B J. Daytime and nighttime aircraft lidar measurements showing evidence of particulate matter transport into the Northeastern valleys of the Lower Fraser Valley, BC [J]. Atmospheric Environment, 2004, 38(34): 5873-5886. doi: 10.1016/j.atmosenv.2003.10.036 [19] LUO Y H, DOU K, FAN G Q, et al. Vertical distributions of tropospheric formaldehyde, nitrogen dioxide, ozone and aerosol in Southern China by ground-based MAX-DOAS and LIDAR measurements during PRIDE-GBA 2018 campaign [J]. Atmospheric Environment, 2020, 226: 117384. doi: 10.1016/j.atmosenv.2020.117384 [20] XUE L K, DING A J, GAO J, et al. Aircraft measurements of the vertical distribution of sulfur dioxide and aerosol scattering coefficient in China [J]. Atmospheric Environment, 2010, 44(2): 278-282. doi: 10.1016/j.atmosenv.2009.10.026 [21] SCHUYLER T, GUZMAN M. Unmanned aerial systems for monitoring trace tropospheric gases [J]. Atmosphere, 2017, 8(10): 206. doi: 10.3390/atmos8100206 [22] VILLA T F, SALIMI F, MORTON K, et al. Development and validation of a UAV based system for air pollution measurements [J]. Sensors (Basel, Switzerland), 2016, 16(12): 2202. doi: 10.3390/s16122202 [23] 赵晓飞. 开封市近地层大气颗粒物垂直分布研究[D]. 开封: 河南大学, 2011. ZHAO X F. Vertical distribution of atmospheric particles in the ground layer in Kaifeng[D]. Kaifeng: Henan University, 2011(in Chinese).
[24] PENG Z R, WANG D S, WANG Z Y, et al. A study of vertical distribution patterns of PM2.5 concentrations based on ambient monitoring with unmanned aerial vehicles: A case in Hangzhou, China [J]. Atmospheric Environment, 2015, 123: 357-369. doi: 10.1016/j.atmosenv.2015.10.074 [25] 赵晨曦, 王云琦, 王玉杰, 等. 北京地区冬春PM2.5和PM10污染水平时空分布及其与气象条件的关系 [J]. 环境科学, 2014, 35(2): 418-427. ZHAO C X, WANG Y Q, WANG Y J, et al. Temporal and spatial distribution of PM2.5 and PM10 pollution status and the correlation of particulate matters and meteorological factors during winter and spring in Beijing [J]. Environmental Science, 2014, 35(2): 418-427(in Chinese).
[26] 王妘涛, 张强, 温肖宇, 等. 运城市PM2.5时空分布特征和潜在源区季节分析 [J]. 环境科学, 2022, 43(1): 74-84. WANG Y T, ZHANG Q, WEN X Y, et al. Spatiotemporal distribution and seasonal characteristics of regional transport of PM2.5 in Yuncheng City [J]. Environmental Science, 2022, 43(1): 74-84(in Chinese).
[27] LIU C, FEDOROVICH E, HUANG J P. Revisiting entrainment relationships for shear-free and sheared convective boundary layers through large-eddy simulations [J]. Quarterly Journal of the Royal Meteorological Society, 2018, 144(716): 2182-2195. doi: 10.1002/qj.3330 [28] LIU C, HUANG J P, WANG Y W, et al. Vertical distribution of PM2.5 and interactions with the atmospheric boundary layer during the development stage of a heavy haze pollution event [J]. Science of the Total Environment, 2020, 704: 135329. doi: 10.1016/j.scitotenv.2019.135329 [29] YOO H J, KIM J, YI S M, et al. Analysis of black carbon, particulate matter, and gaseous pollutants in an industrial area in Korea [J]. Atmospheric Environment, 2011, 45(40): 7698-7704. doi: 10.1016/j.atmosenv.2011.02.049 [30] MASON E L, SMITH M D. Temperature fluctuations and boundary layer turbulence as seen by Mars Exploration Rovers Miniature Thermal Emission Spectrometer [J]. Icarus, 2021, 360: 114350. doi: 10.1016/j.icarus.2021.114350 -


 下载:
下载:
