


-
$ {\text{PM}}_{\text{2.5}} $ 是大气污染物的主要成分,对环境质量[1]、气候变化[2]和人体健康[3]起着不可忽视的影响.$ {\text{PM}}_{\text{2.5}} $ 具有吸湿性,吸湿性颗粒物是云凝结核的重要物质[4],影响着地方性大气降水,同时$ {\text{PM}}_{\text{2.5}} $ 中的化学组分可以通过吸收和散射太阳辐射,使地表辐射收支不平衡,进一步影响地方气候[5 − 6]. 大气中的细小颗粒物易附着有害物质,粒径较小的颗粒物(如$ {\text{PM}}_{\text{2.5}} $ )可被人体吸入从而损害人体健康[7].水溶性无机离子是
$ {\text{PM}}_{\text{2.5}} $ 的主要化学组分,占$ {\text{PM}}_{\text{2.5}} $ 质量浓度的60%以上[8 − 9]. 随着城市化进程的推进,化石燃烧消耗量增加,大气污染排放量增多,造成了我国城市地区灰霾天气的发生[10]. 除了污染物的直接排放,大气中的污染气体可通过化学反应生成二次颗粒物,例如$ {\text{NO}}_{\text{2}} $ 转化为硝酸盐[11],且污染气体之间存在相互影响,如在高湿、碱性环境下,$ {\text{NO}}_{\text{2}} $ 可以促进$ {\text{SO}}_{\text{2}} $ 转化为硫酸盐的速率[12],加剧大气污染. 水溶性无机离子以二次离子$ {\text{SO}}_{\text{4}}^{\text{2}-} $ 、$ {\text{NO}}_{\text{3}}^{-} $ 和$ {\text{NH}}_{\text{4}}^{+} $ (sulfate nitrate ammonia,SNA)为主[13 − 14],一般认为SNA的形成包括均相和非均相反应,例如$ {\text{SO}}_{\text{2}} $ 和OH自由基的气相氧化反应生成$ {\text{SO}}_{\text{4}}^{\text{2}-} $ ,这是均相反应;在非均相反应中,SO2可以与大气中的液态环境接触生成液态H2SO4,再与NH3反应形成$ {\text{SO}}_{\text{4}}^{\text{2}-} $ 颗粒. 对于$ {\text{NO}}_{\text{3}}^{-} $ ,白天主要由OH氧化$ {\text{NO}}_{\text{2}} $ 生成,在夜间则主要通过N2O5水解反应产生[15]. SNA的形成不仅受大气中$ {\text{NO}}_{\text{2}} $ 、$ {\text{SO}}_{\text{2}} $ 浓度的影响,还与大气温度、湿度以及传输过程等有关. Wang等[16]发现,北京春季40%的颗粒物来源于跨区域的气团输送,Zhu等[17]观测到,来自缅甸的污染气团通过盛行西风输送到我国西南地区. Deng等[18]发现,东南亚生物质燃烧产生的气溶胶会传输到珠三角地区. 因此,分析$ {\text{PM}}_{\text{2.5}} $ 的化学组成特征及其排放源对改善地方性大气环境具有重要意义,同时可进一步认识区域尺度大气传输过程对大气污染的影响.昆明市地处我国西南地区,城市人口密集,交通发达,对能源的依赖程度高,地势平坦,属低纬度高原季风气候,夏季受西南季风、冬季受西风的控制,日照时间长,气候温和. 目前,国内已经广泛地开展了京津翼、长三角等地区细颗粒物中水溶性无机离子的研究,但对西南地区研究仍然较少. 已有研究表明昆明市春季受境外生物质燃烧的影响较大[19]. 此外,来自青藏高原的沙尘粒子也会对云南地区的空气质量产生影响[20]. 本研究选取昆明市作为研究区域,采集了2019年12月至2020年11月的大气
$ {\text{PM}}_{\text{2.5}} $ 样品,分析其中水溶性无机离子组分浓度,并通过相关性分析、主成分分析(principal component analysis,PCA)及后向轨迹聚类分析,探讨昆明市气溶胶的化学组分特征及来源,并讨论气团输送的影响. -
本研究的采样点设置在昆明云南大学呈贡校区教学楼顶(24˚49ʹ46ʺN,102˚51ʹ8ʺE),离地20 m处,海拔高度为1960 m,南邻辽阔的孟加拉湾和南海,紧靠缅甸、老挝地区. 采样点无障碍物遮盖,通风情况良好,观测结果能够反映采样点周边大气环境状况.
于2019年12月1日至2019年12月27日、2020年4月27日至2020年5月25日、2020年6月1日至2020年8月25日和2020年9月1日至2020年11月30日的4个时间段用大流量采样器(AMS-1,广州铭野,流量0.999 m3·min−1)共采集
$ {\text{PM}}_{\text{2.5}} $ 样品124个,其中冬季27个、春季28个、夏季36个、秋季33个. 采样时间为当地时间上午9:00至次日9:00. 此外,采样期间的气象数据(温度、相对湿度、风速及气压)来自美国国家气候数据中心(National Climate Data Center,NCDC). -
使用打孔器切取孔径为16 mm的石英滤膜样品放入玻璃瓶中,向瓶中加入8 mL超纯水(Milli-Q Reference)并超声振荡30 min,随后使用0.22 μm水相针式过滤器过滤液体样品中不溶性杂质. 此外,在实验中加入空白样本,以扣除实验过程中带入的污染. 使用离子色谱仪(ICS 5000 +,Thermo Scientific,USA)检测水溶性无机离子(
$ {\text{Na}}^{+} $ 、$ {\text{K}}^{\text{+}} $ 、$ {\text{Mg}}^{2+} $ 、$ {\text{Ca}}^{\text{2}\text{+}} $ 、$ {\text{NH}}_{\text{4}}^{+} $ 、$ {\text{SO}}_{\text{4}}^{\text{2}-} $ 、$ {\text{NO}}_{\text{3}}^{-} $ 、$ {\text{F}}^{-} $ 、$ {\text{Cl}}^{-} $ 、$ {\text{MSA}}^{-} $ 和$ {\text{NO}}_{\text{2}}^{-} $ ). -
本研究使用石英滤膜(Tissuquartz 2500 QAT-UP,PALLFLEX,USA)收集颗粒物,采样前使用马弗炉在450 ℃下将滤膜烘烤6 h,去除采样滤膜中吸附或残留的有机物. 采样前后用干净的锡纸包裹滤膜并用自封袋密封,后将其放置在-20 ℃的冰柜中. 使用微电子天平(BSA124S,Sartorius,Germany)称量采样前后膜的质量,称重前后将滤膜放置在干燥皿中平衡72 h. 采样前校准采样流量; 实验过程中使用无尘纸擦拭使用的镊子、打孔器等; 玻璃器皿都先用超纯水超声清洗15 min 3次. 制作标准曲线进行标准样品测量,保证每个离子的标准曲线的峰面积与浓度之间相关系数99.9%以上. 在分析样品滤膜时,对水溶性无机离子进行空白校正,每个离子质量浓度需扣除样品空白.
-
本研究利用美国国家海洋与大气管理局(National Oceanic and Atmospheric Administration,NOAA)空气资源实验室(Air Resources Laboratory,ARL)开发的单粒子拉格朗日后向轨迹扩散模型(Hybrid Single Particle Lagrangian Integrated Trajectory Model,HYSPLIT),以NOAA的全球同化数据(Global Data Assimilation System,GDAS)作为气象参数,使用Meteoinfo软件进行分析. 对于昆明气溶胶,计算采样期间距地面500 m高度处气团的48 h后向轨迹并分季节进行聚类. 火点数据从FIRMS(Fire Information for Resource Management System)网站获得.
-
采样期间昆明市
$ {\text{PM}}_{\text{2.5}} $ 的质量浓度及气象要素的变化情况见图1.$ {\text{PM}}_{\text{2.5}} $ 质量浓度年均值为(25.4$ \pm $ 14.7)μg·m−3,达到我国《环境空气质量标准》(GB 3095—2012)年均二级标准(35 μg·m−3),与郭晓等[21]于2017—2019年对昆明大气$ {\text{PM}}_{\text{2.5}} $ 浓度的观测结果相近.$ {\text{PM}}_{\text{2.5}} $ 质量浓度存在明显的季节差异,冬季污染较重,大气$ {\text{PM}}_{\text{2.5}} $ 浓度均值为(40.1$ \pm $ 13.4)μg·m−3,其次是秋春季,大气$ {\text{PM}}_{\text{2.5}} $ 浓度均值分别为(27.8$ \pm $ 14.9)μg·m−3和(24.1$ \pm $ 8.5)μg·m−3,夏季空气较清洁,$ {\text{PM}}_{\text{2.5}} $ 平均浓度为(13.0$ \pm $ 6.1)μg·m−3. 各气象要素季节变化明显,大气相对湿度在夏季较高(均值为78.5%),其次为冬季(75.7%)和秋季(74.5%);气温在春、夏两季较高,平均分别为19.5 ℃和20.0℃,在秋、冬季较低,平均分别为14.9 ℃和6.3℃;此外,冬季平均风速最大(5.2 m·s−1),其次为春季(4.6 m·s−1)、夏季(4.0 m·s−1)和秋季(3.8 m·s−1). 采样期间,在冬季和秋季观测到重污染事件,其中在2019年12月8日至12日的污染事件中,大气$ {\text{PM}}_{\text{2.5}} $ 浓度达到72.4 μg·m−3,大气温度较低、相对湿度较大、风速较小,这种低温高湿低风速的气象条件利于颗粒态污染物的二次生成以及积累. -
研究期间,昆明市各水溶性无机离子质量浓度如表1所示. 昆明市总水溶性无机离子(total water-soluble inorganic ions,TWSIIs)质量浓度年均为(4.7
$ \pm $ 2.6)μg·m−3,占$ {\text{PM}}_{\text{2.5}} $ 质量浓度的21.7%. 从季节特征上看,TWSIIs浓度为春季((5.6$ \pm $ 2.2)μg·m−3)$ \gt $ 冬季((5.5$ \pm $ 2.6)μg·m−3)$ \gt $ 秋季((4.3$ \pm $ 2.8)μg·m−3)>夏季((3.6$ \pm $ 2.2)μg·m−3). 春季是中南半岛生物质燃烧的集中季节,可能对处在盛行风下风向的云南省大部分地区造成影响,导致昆明地区大气离子浓度升高. 夏季昆明市多雨,降水对颗粒物有很好的冲刷作用,使大气中的离子浓度偏低. 各水溶性无机离子浓度年均值为$ {\text{SO}}_{\text{4}}^{\text{2}-} \gt {\text{Ca}}^{\text{2}\text{+}} \gt {\text{NO}}_{\text{3}}^{-} \gt {\text{NH}}_{\text{4}}^{+} \gt {\text{K}}^{\text{+}} \gt {\text{Cl}}^{-} \gt {\text{Na}}^{+} \gt {\text{Mg}}^{2+} \gt {\text{F}}^{-} $ ,表明$ {\text{SO}}_{\text{4}}^{\text{2}-} $ 、$ {\text{Ca}}^{\text{2}\text{+}} $ 、$ {\text{NO}}_{\text{3}}^{-} $ 和$ {\text{NH}}_{\text{4}}^{+} $ 是昆明地区主要的水溶性无机离子.$ {\text{SO}}_{\text{4}}^{\text{2}-} $ 、$ {\text{NO}}_{\text{3}}^{-} $ 和$ {\text{NH}}_{\text{4}}^{+} $ 三者质量浓度的年均值分别为1.9、0.7、0.6 μg·m−3,共占水溶性无机离子的66.9%,是水溶性无机离子重要的二次离子,可能源于化石燃料燃烧产生的气态前体物的二次转化[22 − 23]. 导致$ {\text{Ca}}^{\text{2}\text{+}} $ 浓度偏高的原因可能有:$ {\text{Ca}}^{\text{2}\text{+}} $ 来自土壤尘和建筑扬尘[24],近年来昆明市致力于城市建设、道路桥梁施工等,大气中产生了大量扬尘,使得$ {\text{PM}}_{\text{2.5}} $ 中$ {\text{Ca}}^{\text{2}\text{+}} $ 的浓度较大;沙尘粒子在青藏高原被迫抬升,并随南亚反气旋环流输送到云南[19];昆明的远郊石林属于喀斯特地貌,岩石风化也可能是$ {\text{Ca}}^{\text{2}\text{+}} $ 浓度偏高的原因之一[25].研究发现,各水溶性无机离子质量浓度及占比在不同季节具有不同的特征(图2). 冬季
$ {\text{NO}}_{\text{3}}^{-} $ 质量浓度明显高于其他三季,是夏季$ {\text{NO}}_{\text{3}}^{-} $ 质量浓度的4.1倍,且$ {\text{NO}}_{\text{3}}^{-} $ 在TWSIIs中浓度占比的季节变化与质量浓度一致,冬季最高为20.1%,夏季最低为7.5%. 大气中的$ {\text{NO}}_{\text{3}}^{-} $ 受温度影响较大,在夏季占比较低可能是由于NH4NO3在高温下易分解成NH3和HNO3[26],而冬季低温利于硝酸盐以颗粒态的形式存在[27],导致$ {\text{NO}}_{\text{3}}^{-} $ 浓度季节变化显著. 而$ {\text{SO}}_{\text{4}}^{\text{2}-} $ 与TWSIIs浓度比值高值出现在春季、夏季和秋季(大于40%),低值出现在冬季为33.7%. 冬季光照时间少,大气中·OH自由基浓度低于夏季,使SO2的光化学氧化反应较弱,而秋季虽然$ {\text{SO}}_{\text{2}} $ 的浓度小,但因为相对湿度较大(均值为75%),可以促进SO2的非均相反应发生[28].$ {\text{NO}}_{\text{3}}^{-} $ 和$ {\text{SO}}_{\text{4}}^{\text{2}-} $ 的比值可以判别固定源和移动源的贡献[29 − 30],当$ {\text{NO}}_{\text{3}}^{-} $ /$ {\text{SO}}_{\text{4}}^{\text{2}-} $ 的比值大于1时认为$ {\text{NO}}_{\text{3}}^{-} $ 和$ {\text{SO}}_{\text{4}}^{\text{2}-} $ 主要源于移动源,当比值小于1时则认为固定源的贡献大于移动源. 发达地区$ {\text{NO}}_{\text{3}}^{-} $ /$ {\text{SO}}_{\text{4}}^{\text{2}-} $ 比值一般大于1[31],污染物主要源于车辆尾气排放,而我国大部分地区$ {\text{NO}}_{\text{3}}^{-} $ 和$ {\text{SO}}_{\text{4}}^{\text{2}-} $ 的比值为0.3—0.5[32],污染物主要源于化石燃料燃烧. 本研究中$ {\text{NO}}_{\text{3}}^{-} $ /$ {\text{SO}}_{\text{4}}^{\text{2}-} $ 的年均值为0.33,表明昆明大气主要受煤炭燃烧的影响.$ {\text{NH}}_{\text{4}}^{+} $ 前体物为NH3,其浓度受农业活动影响大[33].$ {\text{NH}}_{\text{4}}^{+} $ 浓度均值春季最高,秋冬次之,夏季最低,可能由于春耕时肥料使用多,随着气温的升高,NH3释放较多,进而与HNO3和H2SO4发生中和反应生成$ \text{NH}_{\text{4}}^+.\ \text{K}^{\text{+}} $ 被认为是生物质燃烧的指示物[34],其浓度在冬、春季相对较高,表明昆明大气在这两个季节受到生物质燃烧的影响[35].$ {\text{Cl}}^{-} $ 质量浓度季节分布显著,冬季$ {\text{Cl}}^{-} $ 浓度最高,是其他季节的两倍多.$ {\text{Cl}}^{-} $ 可以来自海洋源,在城市地区还有燃煤源贡献[36].$ {\text{Na}}^{+} $ 主要来自海洋源,$ {\text{Cl}}^{-} $ /$ {\text{Na}}^{+} $ 的比值在冬季最高(2.3),表明冬季燃烧煤炭对$ {\text{Cl}}^{-} $ 有较大贡献. -
$ {\text{NO}}_{\text{3}}^{-} $ 和$ {\text{SO}}_{\text{4}}^{\text{2}-} $ 是$ {\text{PM}}_{\text{2.5}} $ 中重要的水溶性无机离子,其浓度取决于大气中$ {\text{NO}}_{\text{2}} $ 和$ {\text{SO}}_{\text{2}} $ 向$ {\text{NO}}_{\text{3}}^{-} $ 和$ {\text{SO}}_{\text{4}}^{\text{2}-} $ 的二次转化程度[30],气粒转化程度可用氮氧化速率(NOR)和硫氧化速率(SOR)进行表征. 当大气中存在较高的气粒转化过程,即二次气溶胶浓度增加,SOR和NOR的值越高,二次转化过程越明显[37]. 当SOR值大于0.1时,表明大气中存在光化学氧化反应转化成的$ {\text{SO}}_{\text{4}}^{\text{2}-} $ [38 − 39]. SOR和NOR计算公式如下:图3显示了昆明市SOR和NOR的季节变化.SOR年均值为0.20,表明昆明市存在较高的二次转化,但季节变化并不显著,总体来说,冬季均值明显低于春夏秋季,可能由于冬季为干季,较低的温度和湿度不利于
$ {\text{SO}}_{\text{2}} $ 发生非均相反应. NOR的年均值为0.02,远小于SOR,季节变化特征为冬春季较高,秋季次之,夏季最低,这是由于昆明市处于云贵高原,海拔高,太阳辐射强强度大,且在夏季高温高湿的环境下使得固态NH4NO3挥发进入大气,HNO3易分解为$ {\text{NO}}_{\text{2}} $ ,从而导致$ {\text{NO}}_{\text{3}}^{-} $ 的浓度降低和$ {\text{NO}}_{\text{2}} $ 浓度的升高.昆明市秋季
$ {\text{NO}}_{\text{3}}^{-} $ 和$ {\text{SO}}_{\text{4}}^{\text{2}-} $ 质量浓度均值为0.71 μg·m−3和1.83 μg·m−3,二者的气态前体物$ {\text{NO}}_{\text{2}} $ 和$ {\text{SO}}_{\text{2}} $ 浓度均值为34.39 μg·m−3和5.78 μg·m−3,NOR和SOR的均值为0.02和0.23. 大气中$ {\text{NO}}_{\text{2}} $ 浓度是$ {\text{SO}}_{\text{2}} $ 浓度的5.95倍,但$ {\text{NO}}_{\text{3}}^{-} $ 质量浓度仅占$ {\text{SO}}_{\text{4}}^{\text{2}-} $ 质量浓度的38.08%,表明在相同的环境里,$ {\text{SO}}_{\text{2}} $ 的二次转化为$ {\text{SO}}_{\text{4}}^{\text{2}-} $ 的过程更易发生,其中秋季转化速率最大. -
研究认为,
$ {\text{NH}}_{\text{4}}^{+} $ 是大气中含量最多的碱性离子,NH3可以和酸性气体相互反应从而生成铵盐.$ {\text{SO}}_{\text{4}}^{\text{2}-} $ 、$ {\text{NO}}_{\text{3}}^{-} $ 和$ {\text{Cl}}^{-} $ 都会共同竞争$ {\text{NH}}_{\text{4}}^{+} $ [38],但由于$ {\text{Cl}}^{-} $ 在大气中的含量远低于其他两者,且NH4Cl极不稳定,遇热易挥发,故仅讨论$ {\text{NH}}_{\text{4}}^{+} $ 与$ {\text{SO}}_{\text{4}}^{\text{2}-} $ 、$ {\text{NO}}_{\text{3}}^{-} $ 的存在形式. 若$ {\text{NH}}_{\text{4}}^{+} $ 主要以(NH4)2SO4、NH4NO3的形式存在,使用公式(3)计算$ {\text{NH}}_{\text{4}}^{+} $ 浓度,若以NH4HSO4、NH4NO3的形式存在则使用公式(4)计算$ {\text{NH}}_{\text{4}}^{+} $ 浓度. 各个季节$ {\text{NH}}_{\text{4}}^{+} $ 浓度的实际值与计算值的相关性分析见图4,1:1的虚线代表$ {\text{NH}}_{\text{4}}^{+} $ 实测值等于$ {\text{NH}}_{\text{4}}^{+} $ 计算值.由图4可知,昆明市四季的
$ {\text{NH}}_{\text{4}}^{+} $ 实际值与计算值的相关性较强(R2$ \gt $ 0.88). 在冬季、春季和夏季,按照(4)式计算得出的$ {\text{NH}}_{\text{4}}^{+} $ 与实际值较为吻合,表明大气中的$ {\text{NH}}_{\text{4}}^{+} $ 主要以NH4HSO4和NH4NO3的形式存在; 在秋季,(3)式得出的$ {\text{NH}}_{\text{4}}^{+} $ 线性回归方程的斜率与1:1的虚线更接近,表明铵盐主要以NH4NO3和(NH4)2SO4的形式存在. -
表2显示在采样期间,二次离子之间有良好的相关性,
$ {\text{NH}}_{\text{4}}^{+} $ 与$ {\text{SO}}_{\text{4}}^{\text{2}-} $ 、$ {\text{NO}}_{\text{3}}^{-} $ 三者之间的相关系数分别为0.85、0.7和0.77,因此在大气中的可能以(NH4)2SO4、NH4NO3的形式存在.$ {\text{Ca}}^{\text{2}\text{+}} $ 和$ {\text{Mg}}^{2+} $ 有强相关性,相关系数为0.68,$ {\text{Mg}}^{2+} $ /$ {\text{Ca}}^{\text{2}\text{+}} $ 的平均值为0.05. 研究表明,当$ {\text{Mg}}^{2+} $ /$ {\text{Ca}}^{\text{2}\text{+}} $ 的比值范围小于0.09,$ {\text{Ca}}^{\text{2}\text{+}} $ 和$ {\text{Mg}}^{2+} $ 主要源于土壤粉尘,比值小于0.12和0.17认为$ {\text{Ca}}^{\text{2}\text{+}} $ 和$ {\text{Mg}}^{2+} $ 来源于海盐和沙漠[40],高于这些则认为源于化石燃料燃烧和工厂排放[41 − 42].$ {\text{Ca}}^{\text{2}\text{+}} $ 与$ {\text{Na}}^{+} $ 相关性低,表明昆明市的$ {\text{Ca}}^{\text{2}\text{+}} $ 和$ {\text{Mg}}^{2+} $ 主要源于土壤粉尘.$ {\text{Cl}}^{-} $ 和$ {\text{K}}^{\text{+}} $ 有多种源,可能来自于煤炭燃烧、生物质燃烧、海盐等[34, 43]. 当$ {\text{Cl}}^{-} $ 和$ {\text{K}}^{\text{+}} $ 有强相关性以及低$ {\text{Cl}}^{-} $ /$ {\text{K}}^{\text{+}} $ 的比值则认为$ {\text{Cl}}^{-} $ 和$ {\text{K}}^{\text{+}} $ 源自生物质燃烧[44]. 本研究中$ {\text{Cl}}^{-} $ /$ {\text{K}}^{\text{+}} $ 的比值为0.88,$ {\text{K}}^{\text{+}} $ 和$ {\text{Cl}}^{-} $ 相关性显著,相关系数为0.85,说明$ {\text{K}}^{\text{+}} $ 来自生物质燃烧. 研究发现$ {\text{F}}^{-} $ 主要源自工业燃烧一次排放[45],$ {\text{F}}^{-} $ 与Ca2+和Mg2+呈显著相关,由于三者均来自一次排放. 本研究采样点附近有一些铝业(如云南铝业有限公司),这可能是$ {\text{F}}^{-} $ 的主要贡献者. -
为进一步研究昆明市气溶胶中水溶性无机离子的主要来源,利用SPSS(V19.0)对9种离子分季节进行主成分分析(PCA),每个季节提取特征值大于1的2个因子. 根据特征因子、累计贡献率判别污染来源及其类型.由表3可知,通过主成分分析识别了四季水溶性无机离子来源. 冬季因子1中高荷载的离子有
$ {\text{NO}}_{\text{3}}^{-} $ (0.94)、$ {\text{SO}}_{\text{4}}^{\text{2}-} $ (0.88)和$ {\text{NH}}_{\text{4}}^{+} $ (0.87),三者都是二次离子,主要由气态前体物在大气中发生氧化反应或水解反应而产生;此外$ {\text{K}}^{\text{+}} $ 负载为0.81,主要来自于生物质燃烧,因此可以推测因子1代表二次源和生物质燃烧源,解释了总方差的51.82%. 因子2中$ {\text{F}}^{-} $ 和$ {\text{Mg}}^{2+} $ 这两种离子的负荷占主导,代表一次工业源和土壤尘,贡献率为24.42%. 春季两因子的方差贡献率达到了80.34%,来源贡献与冬季相近,因子1中负载最大的离子为$ {\text{NH}}_{\text{4}}^{+} $ (0.90),其次为$ {\text{K}}^{\text{+}} $ (0.88)、$ {\text{SO}}_{\text{4}}^{\text{2}-} $ (0.86)和$ {\text{NO}}_{\text{3}}^{-} $ (0.85),因此因子1代表二次源和生物质燃烧源,贡献率为52.72%; 因子2中$ {\text{F}}^{-} $ 和$ {\text{Mg}}^{2+} $ 为负荷较大的离子,代表一次工业源和土壤尘,对总离子浓度贡献率为27.62%. 夏季因子1和因子2的方差贡献率分别为58.03%和24.94%,因子1中$ {\text{NO}}_{\text{3}}^{-} $ (0.93)、$ {\text{Mg}}^{2+} $ (0.91)和$ {\text{K}}^{\text{+}} $ (0.90)为主要负荷的离子,因子1为机动车尾气、土壤源和生物质燃烧. 因子2中最大荷载的离子为$ {\text{NH}}_{\text{4}}^{+} $ (0.72),一般来自粪便和农业化肥,为农业源. 秋季因子1中高荷载的离子为代表燃烧源的$ {\text{K}}^{\text{+}} $ (0.95)、$ {\text{NO}}_{\text{3}}^{-} $ (0.90)和$ {\text{SO}}_{\text{4}}^{\text{2}-} $ (0.80),方差贡献率为50.90%. 因子2高荷载离子为$ {\text{Ca}}^{\text{2}\text{+}} $ 和$ {\text{F}}^{-}, $ 共解释了总方差的23.24%. 因此秋季$ {\text{PM}}_{\text{2.5}} $ 主要源于二次转化、生物质燃烧源,其次是土壤尘和一次工业源. 昆明市工业主要由烟草制品业、石油及煤炭等燃料加工业、化学制品制造业、冶金工业、装备制造业、医药制造业以及电力生产业组成[46]. 化石燃料燃烧、冶金、发电等工业活动会向大气中排放大量一次离子及二次离子的气态前体物,烟草秸秆作为生物质,其燃烧过程中可释放$ {\text{K}}^{\text{+}} $ ,因此生物质燃烧也是昆明市大气$ {\text{PM}}_{\text{2.5}} $ 中水溶性离子组分的重要贡献源. -
$ {\text{PM}}_{\text{2.5}} $ 中水溶性无机离子的浓度不仅与局地排放、天气条件有关,还受远距离输送的影响. 为进一步探究不同季节污染物的传输模式,分季节分析后向轨迹. 结果显示由于昆明夏季受西南季风、冬季受西风气流的影响,高空500 m的后向气流轨迹大致呈东西走向,但各个季节的气流轨迹存在差异,如图5所示. 图5(a)在冬季气流主要来源于中南半岛,其中占比最多的气团来自于云南景洪市和老挝丰沙里省交界处,此处火点集中,生物质燃烧活动密集,产生的污染气团传输到昆明,对环境质量产生严重的影响;另外有19.87%的气团来自缅甸中部地区,穿过缅甸掸邦省来到本地. 还有31.57%的污染气团来自于东北方向的贵州地区. 图5 (b)在春季影响昆明市的污染物大部分来自境外,起源于缅甸掸邦省通过临沧市汇入本地,结合卫星火点图发现缅甸春季有野火燃烧的现象,沿途将大量生物质燃烧的污染物带入云南省内. 还有接近30%的气团来自云南地区的景洪市,仍有15.37%来自贵州地区.图5 (c)影响昆明市夏季的气流轨迹和冬季较为相似,有62.55%的气团源自老挝琅南塔省,穿过老挝的丰沙里省抵达昆明市,有两支占比接近20%的气团分别来自缅甸和贵州地区. 图5 (d)在秋季其污染气团主要来自云南景洪市,占据了45.67%,有32.67%的污染气团来自云南文山市,此外有近20%的污染气团从重庆穿过贵州达到昆明,这条轨迹线较长,说明气团移速快,对污染的贡献较小.
-
(1)昆明市
$ {\text{PM}}_{\text{2.5}} $ 的年质量浓度的均值为(25.4$ \pm $ 14.7)μg·m−3,各水溶性无机离子年平均浓度从大到小依次为$ {\text{SO}}_{\text{4}}^{\text{2}-} \gt {\text{Ca}}^{\text{2}\text{+}} \gt {\text{NO}}_{\text{3}}^{-} \gt {\text{NH}}_{\text{4}}^{+} \gt {\text{K}}^{\text{+}} \gt {\text{Cl}}^{-} \gt {\text{Na}}^{+} \gt {\text{Mg}}^{2+} \gt {\text{F}}^{-} $ ,说明二次离子和$ {\text{Ca}}^{\text{2}\text{+}} $ 是昆明地区大气中的主要离子组分.$ {\text{NO}}_{\text{3}}^{-} $ 浓度季节变化显著,$ {\text{NO}}_{\text{3}}^{-} $ /TWSIIs比值冬季明显高于夏季为0.21,$ {\text{SO}}_{\text{4}}^{\text{2}-} $ /TWSIIs浓度比最高值出现在春季和秋季为0.43.(2)昆明市SOR年平均值分别为0.20,NOR年平均值分别为0.02,表明昆明市大气中存在明显的二次转化. SOR季节变化不显著,但冬季明显低于其他三季节,是因为冬季为干季,较低的温度和湿度不利于
$ {\text{SO}}_{\text{2}} $ 发生非均相反应,NOR的季节变化特征为冬春最高,秋季次之,夏季最低,这是因为NH4NO3在高温下易分解,而冬季低温利于$ {\text{NO}}_{\text{3}}^{-} $ 以颗粒态的形式存在. 分析各个季节$ {\text{NH}}_{\text{4}}^{+} $ 浓度的实际值与计算值的相关性,得出二次离子$ {\text{NH}}_{\text{4}}^{+} $ 、$ {\text{SO}}_{\text{4}}^{\text{2}-} $ 和$ {\text{NO}}_{\text{3}}^{-} $ 在秋季以NH4NO3和(NH4)2SO4的形式存在,其他季节主要以NH4HSO4和NH4NO3形式存在.(3)通过主成分分析显示,昆明市大气
$ {\text{PM}}_{\text{2.5}} $ 中水溶性无机离子在冬、秋和春季一致,主要来自二次源和生物质燃烧源,其次是工业源和土壤尘,而夏季则主要来自机动车尾气、生物质燃烧源和土壤尘. 通过后向轨迹分析可知,影响昆明市的气流轨迹既有来自中南半岛也有部分来自贵州、重庆和云南本地. 在秋季污染气团主要来自云南本地,其他三个季节较多受境外的中南半岛的影响.
昆明市PM2.5中水溶性无机离子的化学特征及来源解析
Chemical characteristics and source analysis of water-soluble inorganic in PM2.5 in Kunming
-
摘要: 为探究昆明市大气中水溶性无机离子的化学组分、季节差异及主要来源,本研究于2019年12月至2020年11月在云南大学进行
$ {\text{PM}}_{\text{2.5}} $ 样品采集,利用离子色谱仪分析样品中水溶性无机离子的质量浓度,并结合离子相关性分析、后向轨迹分析和主成分分析等方法,阐明了昆明市大气中$ {\text{PM}}_{\text{2.5}} $ 及其水溶性无机离子的季节污染特征及来源. 结果表明,采样期间各季节总水溶性无机离子浓度均值排序为春季((5.6$ \pm $ 2.2)μg·m−3)$ \gt $ 冬季((5.5$ \pm $ 2.6)μg·m−3)$ \gt $ 秋季((4.3$ \pm $ 2.8)μg·m−3)$ \gt $ 夏季((3.6$ \pm $ 2.2)μg·m−3),水溶性无机离子年质量浓度的均值从大到小为$ {\text{SO}}_{\text{4}}^{\text{2}-} \gt {\text{Ca}}^{\text{2}\text{+}} \gt {\text{NO}}_{\text{3}}^{-} \gt {\text{NH}}_{\text{4}}^{+} \gt {\text{K}}^{\text{+}} \gt {\text{Cl}}^{-} \gt {\text{Na}}^{+} \gt {\text{Mg}}^{2+} \gt {\text{F}}^{-} $ ,其中$ {\text{SO}}_{\text{4}}^{\text{2}-} $ 、$ {\text{Ca}}^{\text{2}\text{+}} $ 、$ {\text{NO}}_{\text{3}}^{-} $ 和$ {\text{NH}}_{\text{4}}^{+} $ 是主要的水溶性无机离子.$ {\text{Ca}}^{\text{2}\text{+}} $ 主要源于土壤粉尘,其他三者由前体物($ {\text{SO}}_{\text{2}} $ 、NOx和NH3)二次转化生成,主要受化石燃料燃烧排放影响.SOR和NOR全年均值分别为0.20和0.02,表明在相同的环境里,$ {\text{SO}}_{\text{2}} $ 二次转化为$ {\text{SO}}_{\text{4}}^{\text{2}-} $ 的过程更易发生,且在秋季转化速率最大(SOR=0.23).$ {\text{SO}}_{\text{4}}^{\text{2}-} $ 、$ {\text{NO}}_{\text{3}}^{-} $ 和$ {\text{NH}}_{\text{4}}^{+} $ 在秋季主要以NH4NO3和(NH4)2SO4的形式存在,其他三季则以NH4HSO4和NH4NO3的形式存在. 昆明市大气$ {\text{PM}}_{\text{2.5}} $ 中水溶性无机离子在冬、秋和春季一致,主要来自二次源和生物质燃烧源,其次是工业源和土壤尘,而夏季则主要来自机动车尾气、生物质燃烧源和土壤尘. 除本地排放的影响外,冬季和夏季受到来自缅甸、老挝和贵州污染气团的影响,春季污染气团来自缅甸、云南本地和贵州,而秋季则受到云南东部和南部地区的气团输送影响.-
关键词:
- 水溶性无机离子 /
- $ {\text{PM}}_{\text{2.5}} $ /
- 来源解析 /
- 昆明 /
- 后向轨迹分析.
Abstract: In this study,$ {\text{PM}}_{\text{2.5}} $ samples were collected at Yunnan University, Kunming from December 2019 to November 2020 to explore the chemical composition, seasonal variation, and sources of water-soluble inorganic ions in Kunming. The analyzed mass concentration of water-soluble inorganic ions (WSIIs) were combined with correlation, backward trajectory, and principal component analysis to clarify the seasonal characteristics and potential sources of$ {\text{PM}}_{\text{2.5}} $ and WSIIs in Kunming. The results indicated that the mean concentrations of WSIIs peaked in spring ((5.6$ \pm $ 2.2)μg·m−3), followed by winter ((5.5$ \pm $ 2.6)μg·m−3), autumn ((4.3$ \pm $ 2.8)μg·m−3), and summer ((3.6$ \pm $ 2.2)μg·m−3). The average annual mass concentration of WSIIs was$ {\text{SO}}_{\text{4}}^{\text{2}-} \gt {\text{Ca}}^{\text{2}\text{+}} \gt {\text{NO}}_{\text{3}}^{-} \gt {\text{NH}}_{\text{4}}^{+} \gt $ $ {\text{K}}^{\text{+}} \gt {\text{Cl}}^{-} \gt {\text{Na}}^{+} \gt {\text{Mg}}^{2+} \gt {\text{F}}^{-} $ , among which$ {\text{SO}}_{\text{4}}^{\text{2}-} $ ,$ {\text{Ca}}^{\text{2}\text{+}} $ ,$ {\text{NO}}_{\text{3}}^{-} $ , and$ {\text{NH}}_{\text{4}}^{+} $ dominant the fractions in WSIIs.$ {\text{Ca}}^{\text{2}\text{+}} $ mainly came from soil dust, while the other three were generated by the secondary formation of its precursors (i.e., SO2, NOx, and NH3), which are mainly emitted by anthropogenic emissions (i.e., fossil fuel combustion). Here, the annual average values of SOR and NOR are 0.20 and 0.02, respectively, indicating that the secondary conversion from SO2 to$ {\text{SO}}_{\text{4}}^{\text{2}-} $ is more likely to occur with the same weather conditions. The conversion rate was highest in autumn (SOR=0.23).$ {\text{SO}}_{\text{4}}^{\text{2}-} $ ,$ {\text{NO}}_{\text{3}}^{-} $ , and$ {\text{NH}}_{\text{4}}^{+} $ mainly exist in the form of NH4NO3 and (NH4)2SO4 in autumn, and the other seasons exist in the form of NH4HSO4 and NH4NO3. The WSIIs and$ {\text{PM}}_{\text{2.5}} $ in Kunming showed the similar sources, which were mainly from the secondary reaction and biomass combustion sources, followed by industrial and soil dust sources, in winter, autumn, and spring. In contrast, WSIIs and$ {\text{PM}}_{\text{2.5}} $ were mainly from motor vehicle exhaust, biomass burning sources, and soil dust in summer. Apart from the local emissions, the polluted air masses showed a seasonal variation: Myanmar, Laos, and Guizhou in winter and summer; Myanmar, Yunnan, and Guizhou in spring; eastern and southern parts of Yunnan in autumn. -

-

图 1 采样期间
$ {\text{PM}}_{\text{2.5}} $ 质量浓度及气象要素的时间分布Figure 1. Time distribution of meteorological parameters and mass concentrations of
$ {\text{PM}}_{\text{2.5}} $ during sampling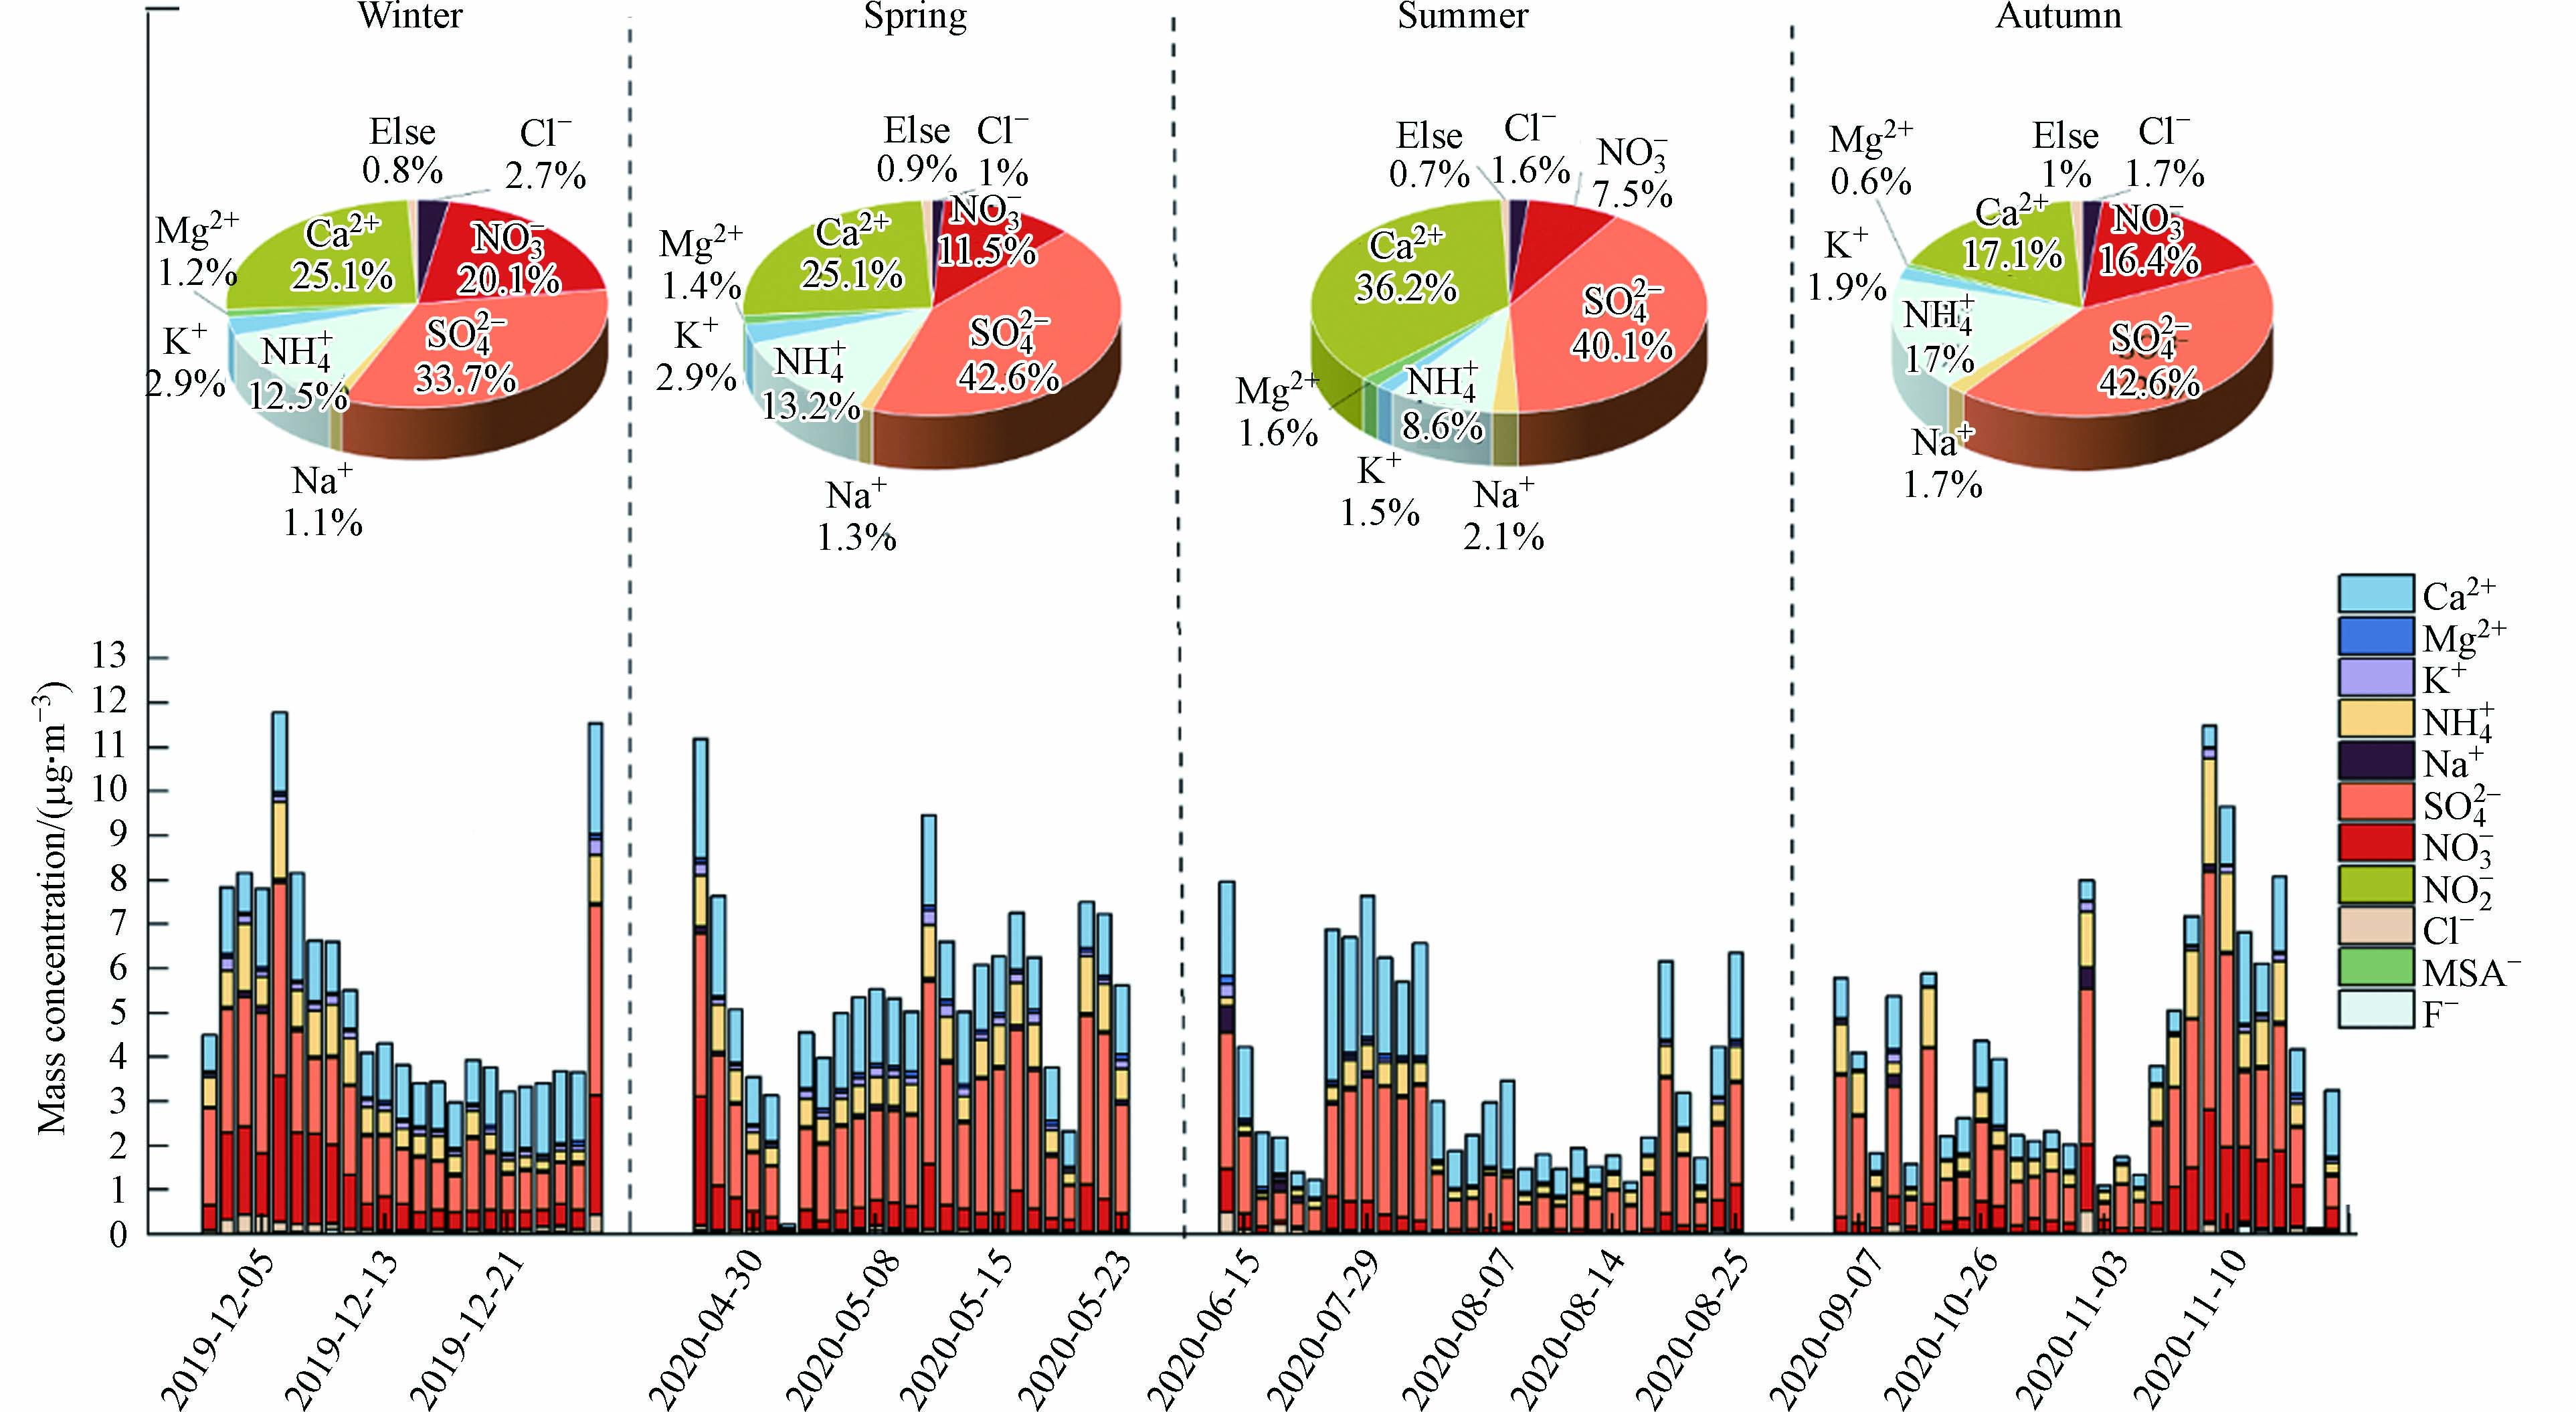
图 2
$ {\text{PM}}_{\text{2.5}} $ 中各水溶性无机离子浓度及占比的季节变化Figure 2. Seasonal variation of concentration and proportion of water-soluble inorganic ions in
$ {\text{PM}}_{\text{2.5}} $ 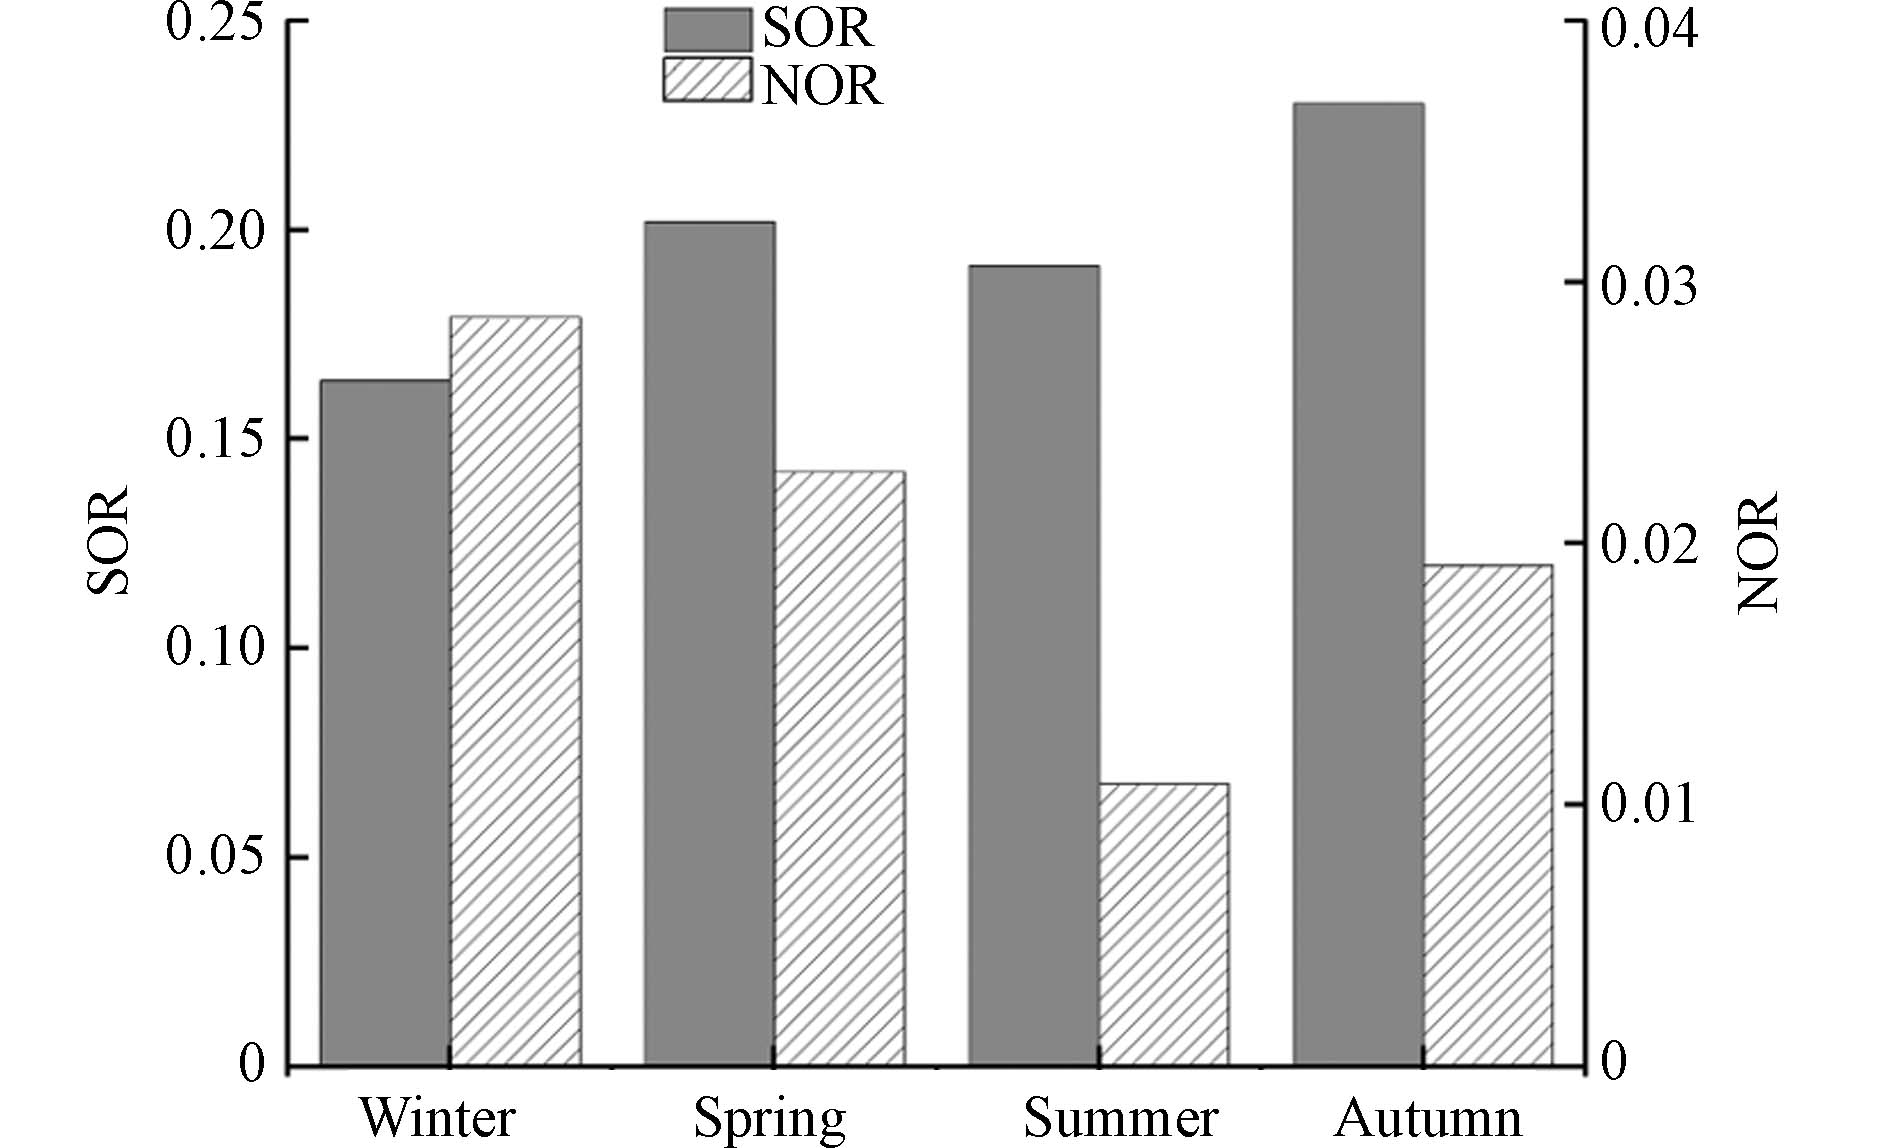
图 3 昆明市SOR和NOR季节变化特征
Figure 3. Seasonal variation characteristics of SOR and NOR in Kunming
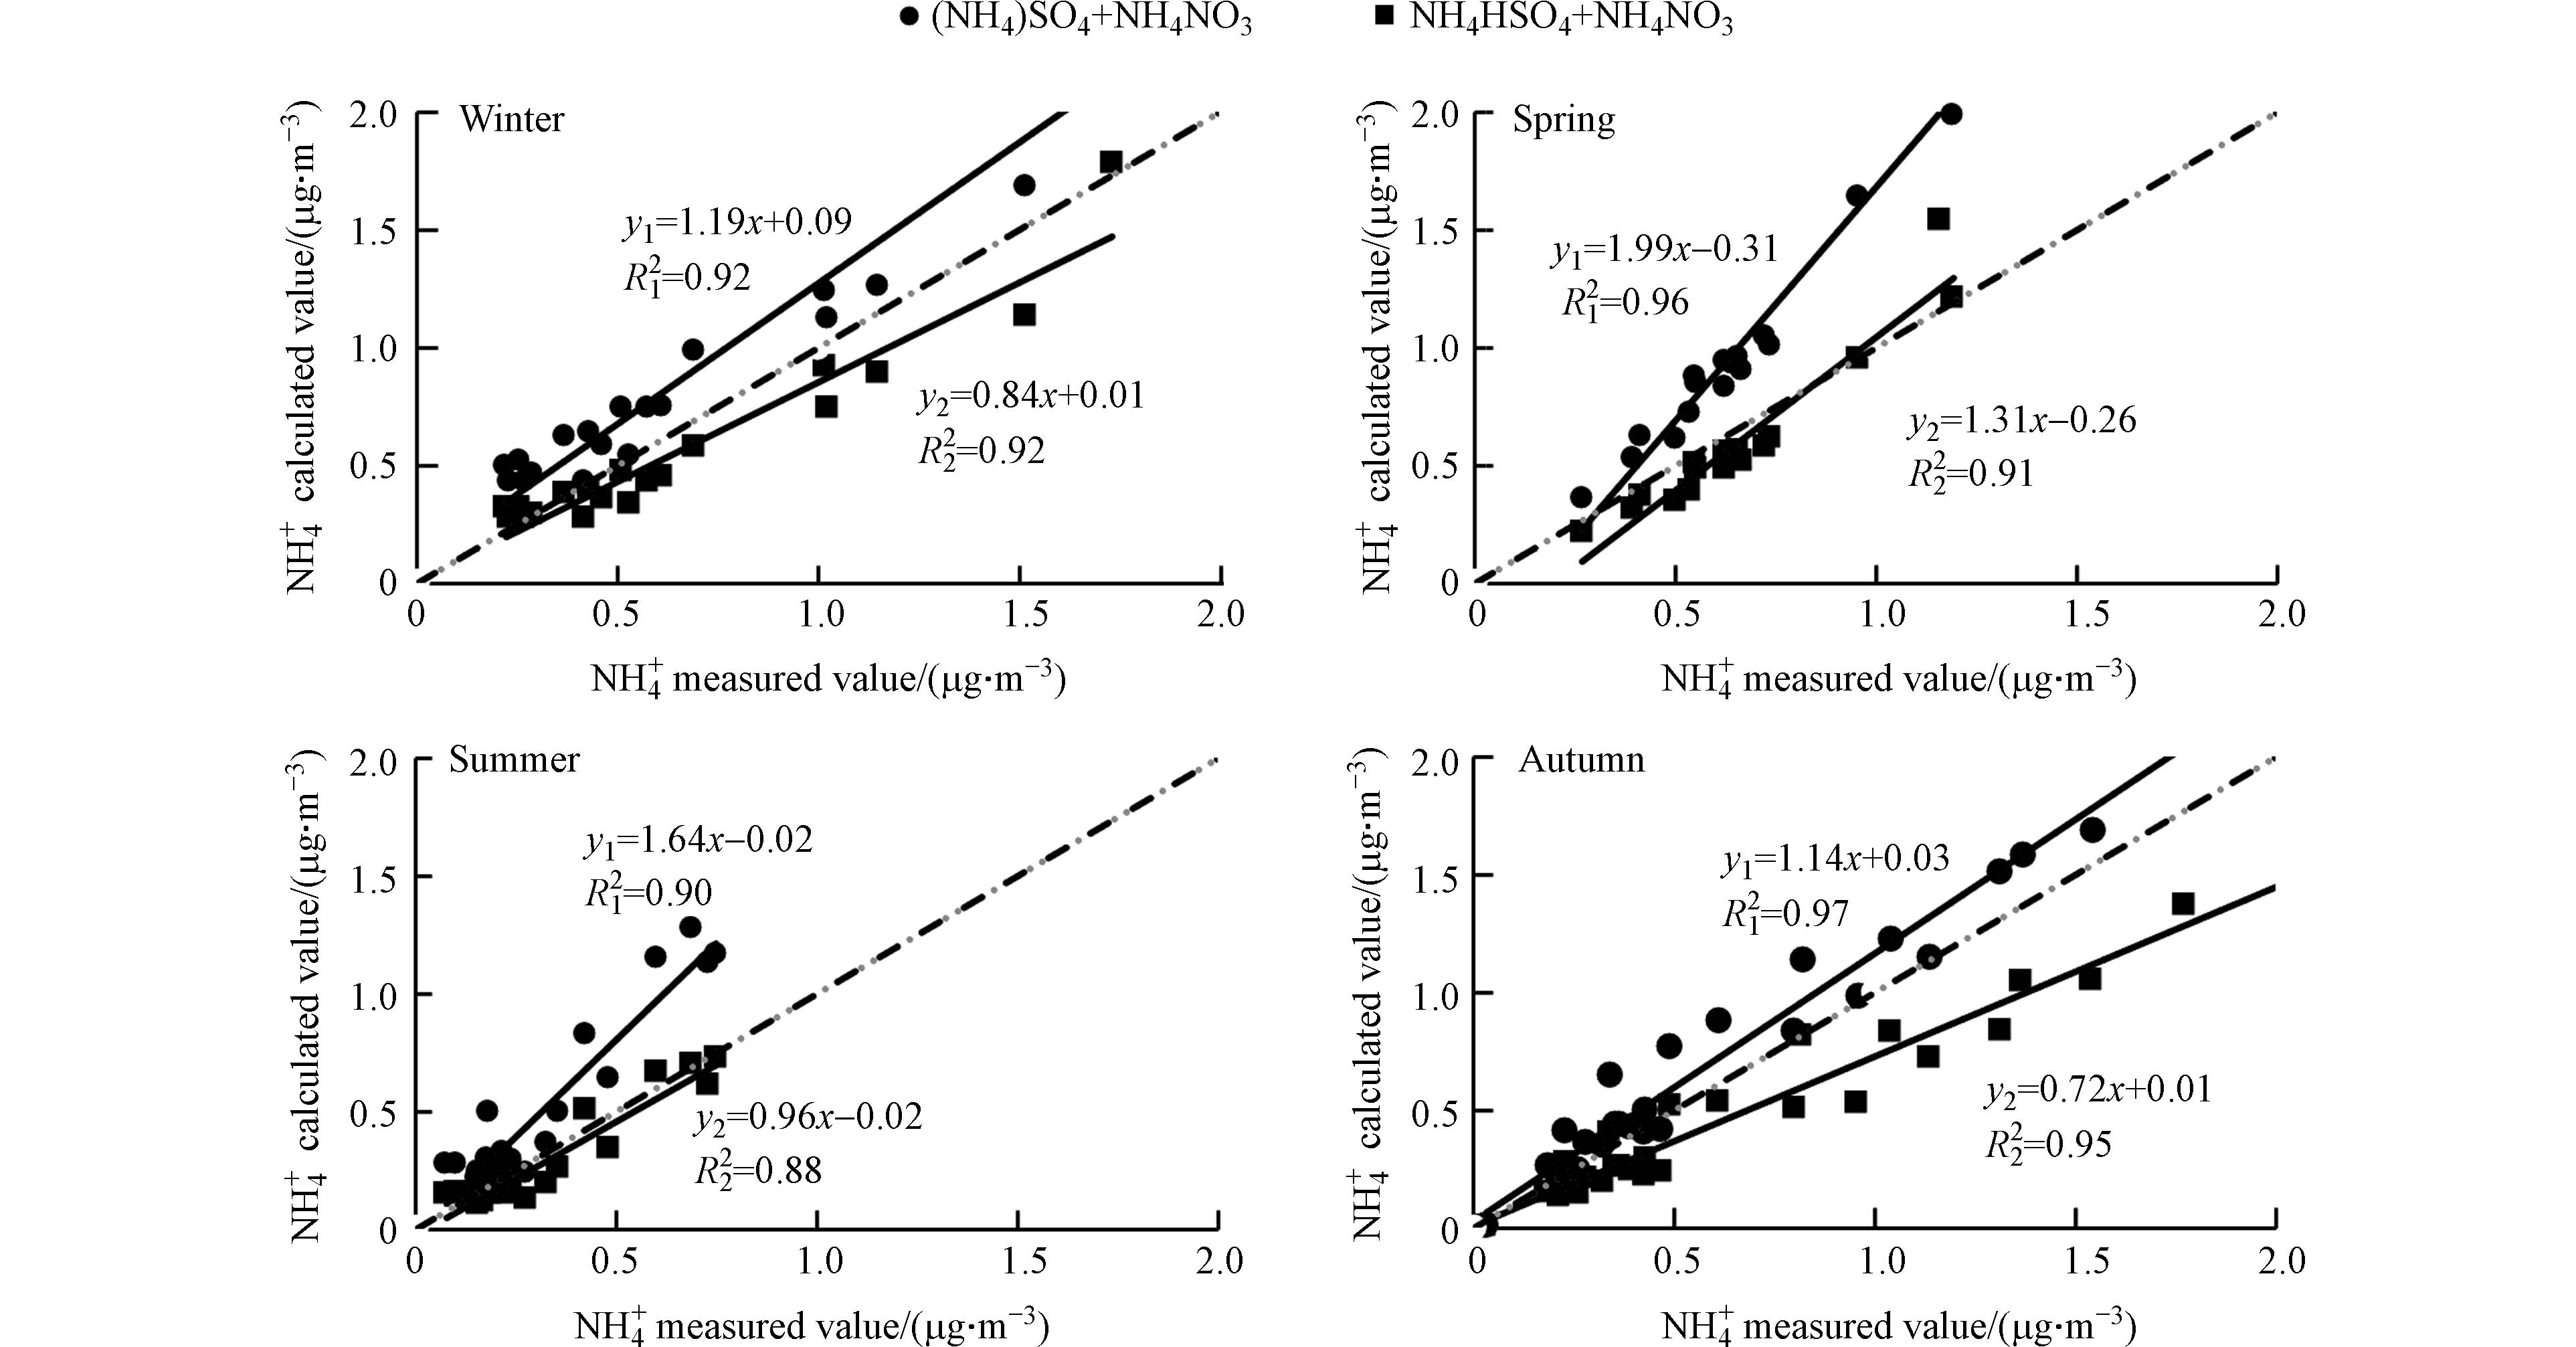
图 4 实际
$ {\text{NH}}_{\text{4}}^{+} $ 浓度与计算$ {\text{NH}}_{\text{4}}^{+} $ 浓度的线性关系及季节变化Figure 4. Correlation and seasonal variation of actual
$ {\text{NH}}_{\text{4}}^{+} $ concentration and calculation of$ {\text{NH}}_{\text{4}}^{+} $ concentration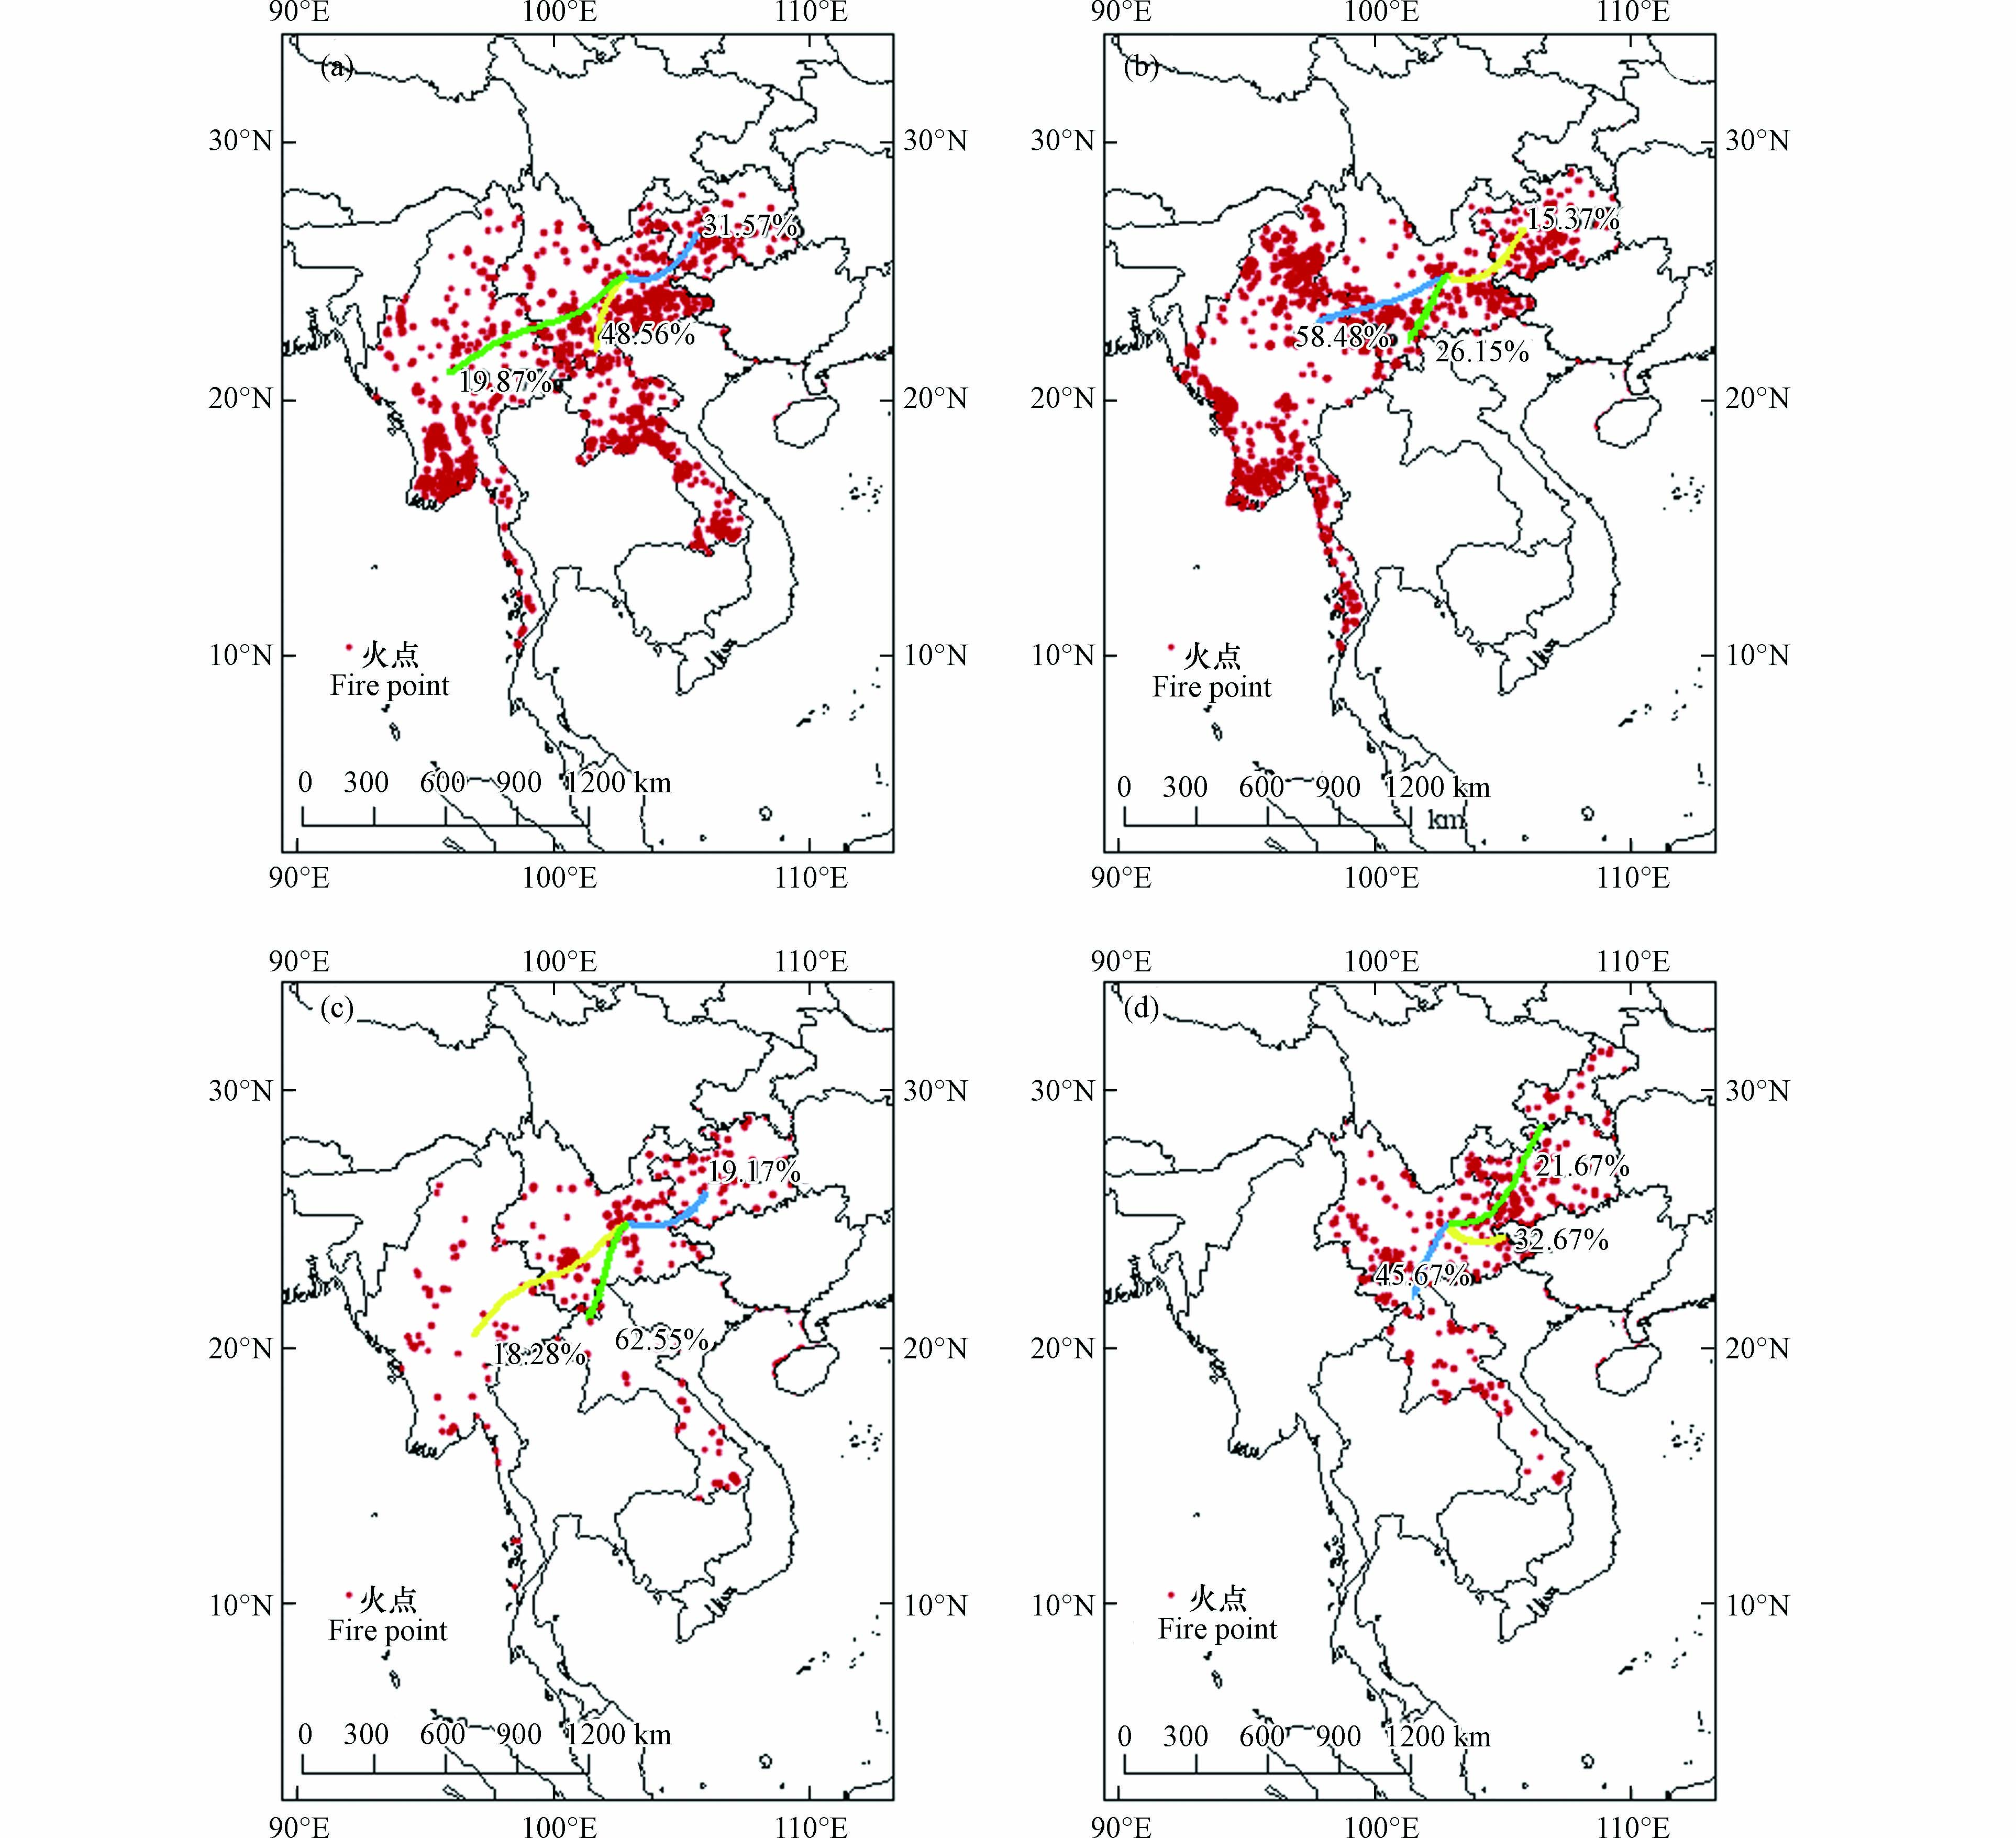
图 5 昆明48 h后向轨迹聚类分析及火点空间分布(a.冬季;b.春季;c.夏季;d.秋季)
Figure 5. Cluster analysis of 48 h backward trajectories and spatial distribution of fire points in Kunming (a. winter; b. spring; c. summer; d. autumn)
表 1
$ {\text{PM}}_{\text{2.5}} $ Table 1. Seasonal distribution of water-soluble inorganic ions and gaseous pollutant concentration in
$ {\text{PM}}_{\text{2.5}} $ 项目
Project季节
Season冬
Winter春
Spring夏
Summer秋
Autumn$ {\text{F}}^{-} $ 0.04 $ \pm $ 0.04 $ \pm $ 0.02 $ \pm $ 0.03 $ \pm $ $ {\text{Cl}}^{-} $ 0.15 $ \pm $ 0.05 $ \pm $ 0.06 $ \pm $ 0.07 $ \pm $ $ {\text{NO}}_{\text{3}}^{-} $ 1.10 $ \pm $ 0.67 $ \pm $ 0.27 $ \pm $ 0.71 $ \pm $ $ {\text{SO}}_{\text{4}}^{\text{2}-} $ 1.84 $ \pm $ 2.37 $ \pm $ 1.44 $ \pm $ 1.83 $ \pm $ $ {\text{Na}}^{+} $ 0.06 $ \pm $ 0.07 $ \pm $ 0.08 $ \pm $ 0.07 $ \pm $ $ {\text{NH}}_{\text{4}}^{+} $ 0.68 $ \pm $ 0.76 $ \pm $ 0.31 $ \pm $ 0.73 $ \pm $ $ {\text{K}}^{\text{+}} $ 0.16 $ \pm $ 0.16 $ \pm $ 0.05 $ \pm $ 0.08 $ \pm $ $ {\text{Mg}}^{2+} $ 0.07 $ \pm $ 0.08 $ \pm $ 0.06 $ \pm $ 0.03 $ \pm $ $ {\text{Ca}}^{\text{2}\text{+}} $ 1.37 $ \pm $ 1.40 $ \pm $ 1.30 $ \pm $ 0.74 $ \pm $ TWSIIs 5.47 $ \pm $ 5.57 $ \pm $ 3.59 $ \pm $ 4.30 $ \pm $ $ {\text{PM}}_{\text{2.5}} $ 40.13 $ \pm $ 24.13 $ \pm $ 12.99 $ \pm $ 27.77 $ \pm $ SNA 3.62 $ \pm $ 3.75 $ \pm $ 2.02 $ \pm $ 3.27 $ \pm $ $ {\text{SO}}_{\text{2}} $ 9.27 $ \pm $ 9.48 $ \pm $ 6.07 $ \pm $ 5.78 $ \pm $ $ {\text{NO}}_{\text{2}} $ 38.05 $ \pm $ 28.40 $ \pm $ 22.80 $ \pm $ 34.39 $ \pm $ $ {\text{NO}}_{\text{3}}^{-} $ $ {\text{SO}}_{\text{4}}^{\text{2}-} $ 0.55 0.26 0.16 0.38 注:表中数值为平均值 $ \pm $ $ \pm $  下载: 导出CSV
表 2 昆明市
$ {\text{PM}}_{\text{2.5}} $ Table 2. Correlation coefficients among water-soluble inorganic ions in
$ {\text{PM}}_{\text{2.5}} $ 成分
Component$ {\text{F}}^{-} $ $ {\text{Cl}}^{-} $ $ {\text{NO}}_{\text{3}}^{-} $ $ {\text{SO}}_{\text{4}}^{\text{2}-} $ $ {\text{Na}}^{+} $ $ {\text{NH}}_{\text{4}}^{+} $ $ {\text{K}}^{+} $ $ {\text{Mg}}^{2+} $ $ {\text{Ca}}^{\text{2}\text{+}} $ $ {\text{F}}^{-} $ 1.00 $ {\text{Cl}}^{-} $ 0.06 1.00 $ {\text{NO}}_{\text{3}}^{-} $ 0.40** 0.58** 1.00 $ {\text{SO}}_{\text{4}}^{\text{2}-} $ 0.16 0.39** 0.70** 1.00 $ {\text{Na}}^{+} $ 0.05 0.72** 0.25** 0.33** 1.00 $ {\text{NH}}_{\text{4}}^{+} $ 0.23* 0.29** 0.77** 0.85** 0.12 1.00 $ {\text{K}}^{\text{+}} $ 0.40** 0.58** 0.66** 0.64** 0.44** 0.53** 1.00 $ {\text{Mg}}^{2+} $ 0.36** 0.26** 0.23* 0.37** 0.34** 0.06 0.62** 1.00 $ {\text{Ca}}^{\text{2}\text{+}} $ 0.45** 0.18 0.39** 0.44** 0.17 0.14 0.44** 0.68** 1.00 注:**表示变量在双尾T检验中P<0.01,*表示变量在双尾T检验中P<0.05.
Note: ** indicates the variable P<0.01 in bilateral T-test, * indicates the variable P<0.05 in bilateral T-test.
下载: 导出CSV
表 3 主成分旋转因子载荷矩阵
Table 3. Rotated component matrix of major components
项目
Project冬季Winter 春季Spring 夏季Summer 秋季Autumn 因子1
Factor 1因子2
Factor 2因子1
Factor 1因子2
Factor 2因子1
Factor 1因子2
Factor 2因子1
Factor 1因子2
Factor 2$ {\text{K}}^{\text{+}} $ 0.81 −0.02 0.88 −0.02 0.90 −0.41 0.95 −0.04 $ {\text{Na}}^{+} $ 0.52 0.39 0.74 0.39 0.74 −0.65 0.64 −0.43 $ {\text{Ca}}^{\text{2}\text{+}} $ 0.55 0.42 0.84 0.18 0.74 0.42 0.57 0.75 $ {\text{Mg}}^{2+} $ −0.40 0.88 −0.38 0.88 0.91 −0.12 0.55 0.62 $ {\text{NH}}_{\text{4}}^{+} $ 0.87 −0.24 0.90 −0.22 0.46 0.72 0.72 −0.32 $ {\text{F}}^{-} $ −0.38 0.89 −0.38 0.89 0.58 0.45 0.52 0.70 $ {\text{Cl}}^{-} $ 0.80 0.38 0.33 0.82 0.66 −0.73 0.64 −0.5 $ {\text{NO}}_{\text{3}}^{-} $ 0.94 −0.10 0.85 0.10 0.93 0.22 0.90 0.01 $ {\text{SO}}_{\text{4}}^{\text{2}-} $ 0.88 0.28 0.86 0.08 0.82 0.40 0.80 −0.34 方差贡献率/% 51.82 24.42 52.72 27.62 58.03 24.94 50.90 23.24 累计贡献率/% 51.82 76.24 52.72 80.34 58.03 82.97 50.90 74.15 可能来源 二次源和生
物质燃烧源工业源和
土壤尘二次源和
生物质燃烧源工业源和
土壤尘机动车尾气、生物
质燃烧源和土壤尘农业源 二次转化和生
物质燃烧源土壤尘和
工业源注:黑体字为该因子中载荷较大的组分载荷量. Note: The boldface is the load of the component with larger load in this factor.
下载: 导出CSV
-
[1] SUN Y L, WANG Z F, DU W, et al. Long-term real-time measurements of aerosol particle composition in Beijing, China: Seasonal variations, meteorological effects, and source analysis[J]. Atmospheric Chemistry and Physics, 2015, 15(17): 10149-10165. doi: 10.5194/acp-15-10149-2015 [2] TIAN S L, PAN Y P, WANG Y S. Size-resolved source apportionment of particulate matter in urban Beijing during haze and non-haze episodes[J]. Atmospheric Chemistry and Physics, 2016, 16(1): 1-19. doi: 10.5194/acp-16-1-2016 [3] TIAN M, WANG H B, CHEN Y, et al. Characteristics of aerosol pollution during heavy haze events in Suzhou, China[J]. Atmospheric Chemistry and Physics, 2016, 16(11): 7357-7371. doi: 10.5194/acp-16-7357-2016 [4] 徐沛华, 杨艳蓉, 刘梦迪, 等. 生物质燃烧排放颗粒物中水溶性有机物的光学特性[J]. 环境化学, 2022, 41(6): 2133-2142. doi: 10.7524/j.issn.0254-6108.2021022202 XU P H, YANG Y R, LIU M D, et al. Optical properties of water-soluble organic matters in particulate matter from biomass burning[J]. Environmental Chemistry, 2022, 41(6): 2133-2142 (in Chinese). doi: 10.7524/j.issn.0254-6108.2021022202
[5] YU X N, MA J, AN J L, et al. Impacts of meteorological condition and aerosol chemical compositions on visibility impairment in Nanjing, China[J]. Journal of Cleaner Production, 2016, 131: 112-120. doi: 10.1016/j.jclepro.2016.05.067 [6] CHEN P F, KANG S C, GUL C, et al. Seasonality of carbonaceous aerosol composition and light absorption properties in Karachi, Pakistan[J]. Journal of Environmental Sciences, 2020, 90: 286-296. doi: 10.1016/j.jes.2019.12.006 [7] 黄含含, 王羽琴, 李升苹, 等. 西安市PM2.5中水溶性离子的季节变化特征[J]. 环境科学, 2020, 41(6): 2528-2535. HUANG H H, WANG Y Q, LI S P, et al. Seasonal variation of water-soluble ions in PM2.5 in Xi’an[J]. Environmental Science, 2020, 41(6): 2528-2535 (in Chinese).
[8] WANG H L, ZHU B, SHEN L J, et al. Water-soluble ions in atmospheric aerosols measured in five sites in the Yangtze River Delta, China: Size-fractionated, seasonal variations and sources[J]. Atmospheric Environment, 2015, 123: 370-379. doi: 10.1016/j.atmosenv.2015.05.070 [9] 尹璐, 董敏丽, 任芮芮, 等. 舟山市环境空气PM2.5及水溶性离子污染特征分析[J]. 环境化学, 2019, 38(3): 556-564. doi: 10.7524/j.issn.0254-6108.2018050904 YIN L, DONG M L, REN R R, et al. Characteristics of PM2.5 and water-soluble ions in ambient air in Zhoushan[J]. Environmental Chemistry, 2019, 38(3): 556-564 (in Chinese). doi: 10.7524/j.issn.0254-6108.2018050904
[10] JACOBSON M C, HANSSON H C, NOONE K J, et al. Organic atmospheric aerosols: Review and state of the science[J]. Reviews of Geophysics, 2000, 38(2): 267-294. doi: 10.1029/1998RG000045 [11] 徐昶. 中国特大城市气溶胶的理化特性、来源及其形成机制[D]. 上海: 复旦大学, 2010: 53-63. XU C. Characteristics, source and the formation mechanism of aerosol in mega-city, China[D]. Shanghai: Fudan University, 2010: 53-63 (in Chinese).
[12] WANG G H, ZHANG R Y, GOMEZ M E, et al. Persistent sulfate formation from London Fog to Chinese haze[J]. Proceedings of the National Academy of Sciences of the United States of America, 2016, 113(48): 13630-13635. [13] 黄炯丽, 陈志明, 莫招育, 等. 基于高分辨率MARGA分析桂林市PM2.5水溶性离子特征[J]. 中国环境科学, 2019, 39(4): 1390-1404. HUANG J L, CHEN Z M, MO Z Y, et al. Analysis of characteristics of water-soluble ions in PM2.5 in Guilin based on the MARGA[J]. China Environmental Science, 2019, 39(4): 1390-1404 (in Chinese).
[14] 刘安康, 王红磊, 陈魁, 等. 南京市一次霾污染过程中水溶性离子分布特征[J]. 中国环境科学, 2019, 39(5): 1793-1803. LIU A K, WANG H L, CHEN K, et al. Distribution characteristics of water-soluble ions during a haze pollution process in Nanjing[J]. China Environmental Science, 2019, 39(5): 1793-1803 (in Chinese).
[15] ALEXANDER B, SHERWEN T, HOLMES C D, et al. Global inorganic nitrate production mechanisms: Comparison of a global model with nitrate isotope observations[J]. Atmospheric Chemistry and Physics, 2020, 20(6): 3859-3877. doi: 10.5194/acp-20-3859-2020 [16] WANG L T, HAO J M, HE K B, et al. A modeling study of coarse particulate matter pollution in Beijing: Regional source contributions and control implications for the 2008 summer olympics[J]. Journal of the Air & Waste Management Association, 2008, 58(8): 1057-1069. [17] ZHU J, XIA X, CHE H, et al. Study of aerosol optical properties at Kunming in southwest China and long-range transport of biomass burning aerosols from North Burma[J]. Atmospheric Research, 2016, 169: 237-247. doi: 10.1016/j.atmosres.2015.10.012 [18] DENG X J, TIE X X, ZHOU X J, et al. Effects of Southeast Asia biomass burning on aerosols and ozone concentrations over the Pearl River Delta (PRD) region[J]. Atmospheric Environment, 2008, 42(36): 8493-8501. doi: 10.1016/j.atmosenv.2008.08.013 [19] 潘春梅. 中南半岛春季生物质燃烧对云南省空气质量影响研究[D]. 昆明: 云南师范大学, 2021: 32-51. PAN C M. Study on the impact of biomass burning on air quality in Yunnan Province in spring over indo-China peninsula[D]. Kunming: Yunnan Normal University, 2021: 32-51 (in Chinese).
[20] 周哆多. 云南地区上空UTLS区沙尘气溶胶传输过程及来源的数值模拟研究[D]. 昆明: 云南大学, 2019: 15-48. ZHOU D D. A simulation study on the source and transmission of the dust aerosol to the UTLS over the Yunnan Province[D]. Kunming: Yunnan University, 2019: 15-48 (in Chinese).
[21] 郭晓. 昆明市呈贡区及主城区干季大气PM2.5的化学特征和来源对比[D]. 昆明: 云南师范大学, 2020: 17-29. GUO X. Comparison of chemical characteristics and sources of atmospheric PM2.5 in Chenggong district and main urban district of Kunming in dry season[D]. Kunming: Yunnan Normal University, 2020: 17-29 (in Chinese).
[22] ZHU Y H, HUANG L, LI J Y, et al. Sources of particulate matter in China: Insights from source apportionment studies published in 1987-2017[J]. Environment International, 2018, 115: 343-357. doi: 10.1016/j.envint.2018.03.037 [23] 古金霞, 吴丽萍, 霍光耀, 等. 天津市PM2.5中水溶性无机离子污染特征及来源分析[J]. 中国环境监测, 2013, 29(3): 30-34. GU J X, WU L P, HUO G Y, et al. Pollution character and source of water-soluble inorganic ions in PM2.5 over Tianjin[J]. Environmental Monitoring in China, 2013, 29(3): 30-34 (in Chinese).
[24] 贺瑶, 韩秀秀, 黄晓虎, 等. 南京市不同功能区冬季大气PM2.5分布特征及其来源解析[J]. 环境科学学报, 2021, 41(3): 830-841. HE Y, HAN X X, HUANG X H, et al. Distribution characteristics and source apportionment of atmospheric PM2.5 in winter season from different functional areas of Nanjing[J]. Acta Scientiae Circumstantiae, 2021, 41(3): 830-841 (in Chinese).
[25] 肖浩. 贵阳市PM2.5水溶性无机离子组成特征及氮源解析[D]. 贵阳: 贵州大学, 2019: 23-51. XIAO H. Composition characteristics of water-soluble inorganic ions and nitrogen source analysis in PM2.5 in Guiyang city[D]. Guiyang: Guizhou University, 2019: 23-51 (in Chinese).
[26] 高晓梅. 我国典型地区大气PM2.5水溶性离子的理化特征及来源解析[D]. 济南: 山东大学, 2012: 48-97. GAO X M. Characterization and sources of PM2.5 water-soluble ions in typical areas in China[D]. Jinan: Shandong University, 2012: 48-97 (in Chinese).
[27] 杨慧慧. 兰州市PM2.5中水溶性离子的污染特征及来源解析[D]. 抚州: 东华理工大学, 2019: 15-41. YANG H H. Pollution characteristics and source analysis of water-soluble ions in PM2.5 in Lanzhou city[D]. Fuzhou: East China Institute of Technology, 2019: 15-41 (in Chinese).
[28] 刘凡, 谭钦文, 江霞, 等. 成都市冬季相对湿度对颗粒物浓度和大气能见度的影响[J]. 环境科学, 2018, 39(4): 1466-1472. LIU F, TAN Q W, JIANG X, et al. Effect of relative humidity on particulate matter concentration and visibility during winter in Chengdu[J]. Environmental Science, 2018, 39(4): 1466-1472 (in Chinese).
[29] ARIMOTO R, DUCE R A, SAVOIE D L, et al. Relationships among aerosol constituents from Asia and the north Pacific during PEM-west A[J]. Journal of Geophysical Research: Atmospheres, 1996, 101(D1): 2011-2023. doi: 10.1029/95JD01071 [30] WANG Y, ZHUANG G S, TANG A H, et al. The ion chemistry and the source of PM2.5 aerosol in Beijing[J]. Atmospheric Environment, 2005, 39(21): 3771-3784. doi: 10.1016/j.atmosenv.2005.03.013 [31] 吴丹, 蔺少龙, 杨焕强, 等. 杭州市PM2.5中水溶性离子的污染特征及其消光贡献[J]. 环境科学, 2017, 38(7): 2656-2666. WU D, LIN S L, YANG H Q, et al. Pollution characteristics and light extinction contribution of water-soluble ions of PM2.5 in Hangzhou[J]. Environmental Science, 2017, 38(7): 2656-2666 (in Chinese).
[32] QIU X H, DUAN L, GAO J, et al. Chemical composition and source apportionment of PM10 and PM2.5 in different functional areas of Lanzhou, China[J]. Journal of Environmental Sciences, 2016, 40: 75-83. doi: 10.1016/j.jes.2015.10.021 [33] SAFAI P D, BUDHAVANT K B, RAO P S P, et al. Source characterization for aerosol constituents and changing roles of calcium and ammonium aerosols in the neutralization of aerosol acidity at a semi-urban site in SW India[J]. Atmospheric Research, 2010, 98(1): 78-88. doi: 10.1016/j.atmosres.2010.05.011 [34] XU L L, DUAN F K, HE K B, et al. Characteristics of the secondary water-soluble ions in a typical autumn haze in Beijing[J]. Environmental Pollution, 2017, 227: 296-305. doi: 10.1016/j.envpol.2017.04.076 [35] 张玉洽, 杨迎春, 李杰, 等. 东南亚生物质燃烧对我国春季PM2.5质量浓度影响的数值模拟[J]. 环境科学研究, 2016, 29(7): 952-962. ZHANG Y Q, YANG Y C, LI J, et al. Modeling the impacts of biomass burning in Southeast Asia on PM2.5 over China in spring[J]. Research of Environmental Sciences, 2016, 29(7): 952-962 (in Chinese).
[36] CHEN C R, ZHANG H X, LI H Y, et al. Chemical characteristics and source apportionment of ambient PM1.0 and PM2.5 in a polluted city in North China plain[J]. Atmospheric Environment, 2020, 242: 117867. doi: 10.1016/j.atmosenv.2020.117867 [37] 黄敏. 上海浦东新区城区大气PM2.5中水溶性离子污染特征研究[J]. 环境监控与预警, 2022, 14(2): 70-77. HUANG M. Study on pollution characteristics of water-soluble ions in PM2.5 in Pudong new district[J]. Environmental Monitoring and Forewarning, 2022, 14(2): 70-77 (in Chinese).
[38] DICKERSON R. Atmospheric chemistry and physics: From air pollution to climate change (second edition)[J]. Bulletin of the American Meteorological Society, 2009, 90(6): 868-870. [39] 段卿. 南京北郊大气气溶胶化学组分特征分析[D]. 南京: 南京信息工程大学, 2015: 28-37. DUAN Q. The analysis of aerosol chemical composition characteristics in Nanjing northern suburb[D]. Nanjing: Nanjing University of Information Science & Technology, 2015: 28-37 (in Chinese).
[40] DENG X L, SHI C E, WU B W, et al. Characteristics of the water-soluble components of aerosol particles in Hefei, China[J]. Journal of Environmental Sciences, 2016, 42: 32-40. doi: 10.1016/j.jes.2015.07.010 [41] LI X R, WANG L L, JI D S, et al. Characterization of the size-segregated water-soluble inorganic ions in the Jing-Jin-Ji urban agglomeration: Spatial/temporal variability, size distribution and sources[J]. Atmospheric Environment, 2013, 77: 250-259. doi: 10.1016/j.atmosenv.2013.03.042 [42] ZHAO J P, ZHANG F W, XU Y, et al. Characterization of water-soluble inorganic ions in size-segregated aerosols in coastal city, Xiamen[J]. Atmospheric Research, 2011, 99(3/4): 546-562. [43] XIE Z S, FAN C L, LU R, et al. Characteristics of ambient bioaerosols during haze episodes in China: A review[J]. Environmental Pollution, 2018, 243: 1930-1942. doi: 10.1016/j.envpol.2018.09.051 [44] WANG J, ZHANG J S, LIU Z J, et al. Characterization of chemical compositions in size-segregated atmospheric particles during severe haze episodes in three mega-cities of China[J]. Atmospheric Research, 2017, 187: 138-146. doi: 10.1016/j.atmosres.2016.12.004 [45] PERNIGOTTI D, BELIS C A, SPANÒ L. SPECIEUROPE: The European data base for PM source profiles[J]. Atmospheric Pollution Research, 2016, 7(2): 307-314. doi: 10.1016/j.apr.2015.10.007 [46] 昆明市统计局. 2021年昆明市国民经济和社会发展统计公报[EB/OL]. -
 点击查看大图
计量
- 文章访问数: 1290
- HTML全文浏览数: 1290
- PDF下载数: 89
- 施引文献: 0


