-
浊度 (turbidity,T,NTU) 是水环境监测的重要参数,反映了光在水体传输中的受阻程度,浊度的变化能够表征水中悬浮颗粒物浓度的变化,对水中污染物质迁移具有重要指示作用[1-2],浊度还会通过影响水下光的传播改变水生生态系统的初级生产力和生态平衡[3],因此浊度对于水资源管理、水生态保护等具有重要意义。长三角地区水环境状况复杂多变,前人对长三角地区的水体浊度[4]、总悬浮物浓度 (total suspended matter concentration,TSM,mg∙L−1) [5]、透明度[6]等开展了众多研究,但研究多为大型河湖水体,中小型湖泊和河流研究较少,长三角示范区是引领长三角地区高质量一体化发展的重要区域,浊度反演研究可为示范区绿色发展提供重要依据。
如何利用卫星数据准确估算水体浊度是国内外学者研究的重点,常见的有经验模型、半经验模型和机器学习模型。HOU等[5]运用MODIS 555 nm和645 nm波段表面反射率比值构建了总悬浮物浓度经验模型用于长江中下游流域大型湖泊和水库的浊度动态监测。DOXARAN等[7]基于MODIS 858 nm和645 nm波段表面反射率比值构建浊度反演经验模型,用于研究法国吉伦特河口最大浑浊带浊度动态变化。DOGLIOTTI等[8]从固有光学特性出发基于MODIS 645 nm波段遥感反射率 (remote sensing reflectance,Rrs,sr−1) 发展了适用于沿海和河口水域中低浊度的半经验反演模型。MA等[9]运用梯度增强决策树 (gradient boosting decision trees,GBDT) 估算了中国东北地区湖泊浊度。前人研究的浊度反演模型大多应用于开阔的近海河口水域,受人类活动影响较小,研究对象多为光学敏感性较高的高度浑浊水体。而本研究水体主要为中低浊度水体,且研究区内湖荡密布,航道众多,生产生活密集,水动力变化复杂,针对此类水体浊度的长时序监测研究尚不多见。
本研究以长三角示范区内典型河湖为研究区,运用实测数据构建并对比了经验模型、半经验模型和机器学习模型三类浊度反演模型,随后基于最佳的XGBoost (eXtreme Gradient Boosting) 模型运用Landsat卫星数据反演研究区浊度,分析浊度的长期时空动态变化及其驱动因素。
-
长三角示范区包括上海市青浦区、江苏省吴江区、浙江省嘉善县,研究区位于长三角示范区中部,包括淀山湖、元荡湖、汾湖、大莲湖、白蚬湖和太浦河等,研究区内河湖水系密布,相互连通,白蚬湖-淀山湖航道、汾湖-太浦河航道为研究区主要航道,研究区位置和采样点分布见图1。以9×9卫星影像像素选择4个目标区域,依次编号为:1-淀山湖入湖口、2-淀山湖出湖口、3-太浦河上游、4-太浦河下游。
-
Landsat TM/ETM+/OLI传感器获取了1982年以来时间连续的地表遥感影像,能够满足近40年研究区长时序浊度监测的应用需求。Landsat TM/ETM+波段范围为450~2 350 nm,分别有7个和8个波段,Landsat OLI波段范围为430~2 290 nm,共9个波段。本研究使用来自美国地质调查局 (United States Geological Survey, USGS,https://earthexplorer.usgs.gov/) 30 m空间分辨率的Landsat Level-1数据。剔除1984‒2022年研究区受云量、条带、耀光影响的数据,最终筛选得到323幅高质量影像。
VANHELLEMONT和RUDDICK[10]提出的暗光谱拟合大气校正算法 (dark spectrum fitting,DSF) 能够对高空间分辨率影像进行准确的大气校正处理[11-13],经验证该方法得到的遥感反射率精度较高[14],能够应用于悬浮物浓度[15-16]、浊度[17]的反演研究。因此,本研究采用该方法对Landsat数据进行大气校正,处理工具为ACOLITE Python (Version 20210114.0) 。
-
1) 现场实测数据。使用地物光谱仪 (ASD FieldSpec4 HR NG,北京理加联合科技有限公司) 获取水体高光谱数据,根据水面以上测量方法[18]计算水体高光谱遥感反射率,光谱分辨率为1 nm。使用多参数水质分析仪 (HYDROLAB HL7,美国HACH公司;YSI-EMS-KorEXO,美国Xylem公司) 现场测量水样获取水质数据,包括电导率、温度、pH、溶解氧、氨氮和浊度等。野外实验严格遵循《地表水和污水监测技术规范》[19]的要求。将采集的水样带回实验室,采用称重法[20]测量水体总悬浮物浓度。2022‒2023年进行了5次现场数据采集工作,共采集了126组实测高光谱遥感反射率和水质数据,剔除异常数据后得到实测浊度和高光谱遥感反射率匹配的有效数据81组 (见表1) 。
2) 等效遥感反射率。为匹配Landsat大气校正后的多光谱遥感反射率和现场实测高光谱遥感反射率,根据Landsat不同传感器的光谱响应函数 (spectral response function,SRF) ,将实测高光谱遥感反射率转化为传感器等效波长处的遥感反射率[21],计算公式如式(1)所示。
式中:Bi表示卫星传感器第i个波段;Rrs(Bi)是传感器第i个波段的等效遥感反射率,sr−1;λ1和λ2分别是第i个波段波长的最小值和最大值,nm;Rrs(λ)是波长λ处实测高光谱遥感反射率,sr−1;S(λ)为传感器在λ处的光谱响应函数。
-
研究区覆盖急水港桥、淀峰、太浦河桥和汾湖大桥4个国控水质监测断面,本研究搜集了以上4个站点2021年夏季到2022年秋季的水质监测数据,用于浊度反演模型的真实性检验,数据来源于国家地表水水质自动监测发布系统 (https://szzdjc.cnemc.cn:8070/GJZ/Business/Publish/Main.html) 。
本研究收集了1984—2022年研究区的降水量 (mm) 和风速 (m∙s−1) 数据,用于分析降水量、风速与浊度季节性变化的关系。该气象数据来自欧洲中期天气预报中心 (European Centre for Medium-Range Weather Forecasts,ECMWF) 的ERA5-Land数据集(https://cds.climate.copernicus.eu/),ERA5-Land数据集收集了1950年至今的陆地月平均气象数据 ,空间分辨率为0.1°×0.1°,时间分辨率为1个月 (30 d) 。
-
目前发展的浊度反演方法以经验模型为主,通过简单的数学函数,拟合浊度和遥感反射率之间的关系;半经验模型从辐射传输理论出发,计算过程较为复杂;机器学习可以很好地描述客观变量和特征变量之间的非线性关系,能够更加灵活地处理具有高维特征的数据集。下文分别构建经验模型、半经验模型和机器学习模型,对比分析三类模型精度,以获取最佳浊度反演模型。
-
以多项式、指数、幂函数模型为例的经验回归模型由于构造简单,被广泛运用于浊度和总悬浮物浓度的遥感反演[5, 22]。常用单波段Bi[4, 23]、波段比(Bi/Bj)[23-24]或波段组合(Bi-Bj)/(Bi+Bj)[4, 9]构建浊度反演模型 (对于OLI传感器,Bi和Bj表示OLI 2、3、4或5波段遥感反射率) 。利用相关系数选择与浊度相关性最高的光谱特征组合,分别使用多项式、指数、幂函数模型对浊度和光谱特征组合进行拟合。
-
常见的半经验浊度反演模型有2个,一个是DOGLIOTTI等[8]从NECHAD等[2]的反射率模型发展的单波段浊度反演模型 (Semi-Empirical Single Band turbidity retrieval algorithm,SESB) ,另一个是基于LEE等[25]准分析算法 (Quasi-Analytical Algorithm,QAA) 的浊度反演模型。
参考NECHAD等[2]的模型构建方法,对SESB模型引入系数
BλT 以提高模型的准确性和预测能力,模型如式(2)和式(3)所示。式中:T表示浊度,NTU;ρw(λ)表示波长λ处水体表面反射率,sr−1,与离水辐亮度 (water-leaving radiance,Lw(λ),W/(m2∙sr∙nm)) 和水面以上下行辐照度 (downwelling irradiance just above the water surface,
E0+d ,W/(m2∙nm)) 有关;AλT 和BλT 是波长依赖的两个系数,由实测数据回归获得。Cλ 是NECHAD等[2]通过“标准”固有光学特性校准的系数,当λ为655 nm时,Cλ 为0.1686。BALASUBRAMANIAN等[26]已证明中低浊度水体的悬浮颗粒物浓度与665 nm处的颗粒物后向散射系数 (particulate backscattering coefficient,bbp,m−1) 存在幂函数关系。通过LEE等[25]的QAA算法获取OLI的bbp(655),对bbp(655)和浊度进行幂函数拟合,构建基于QAA的浊度反演算法。本研究所用的QAA版本为QAA_v6,bbp(655)计算步骤见表2。
-
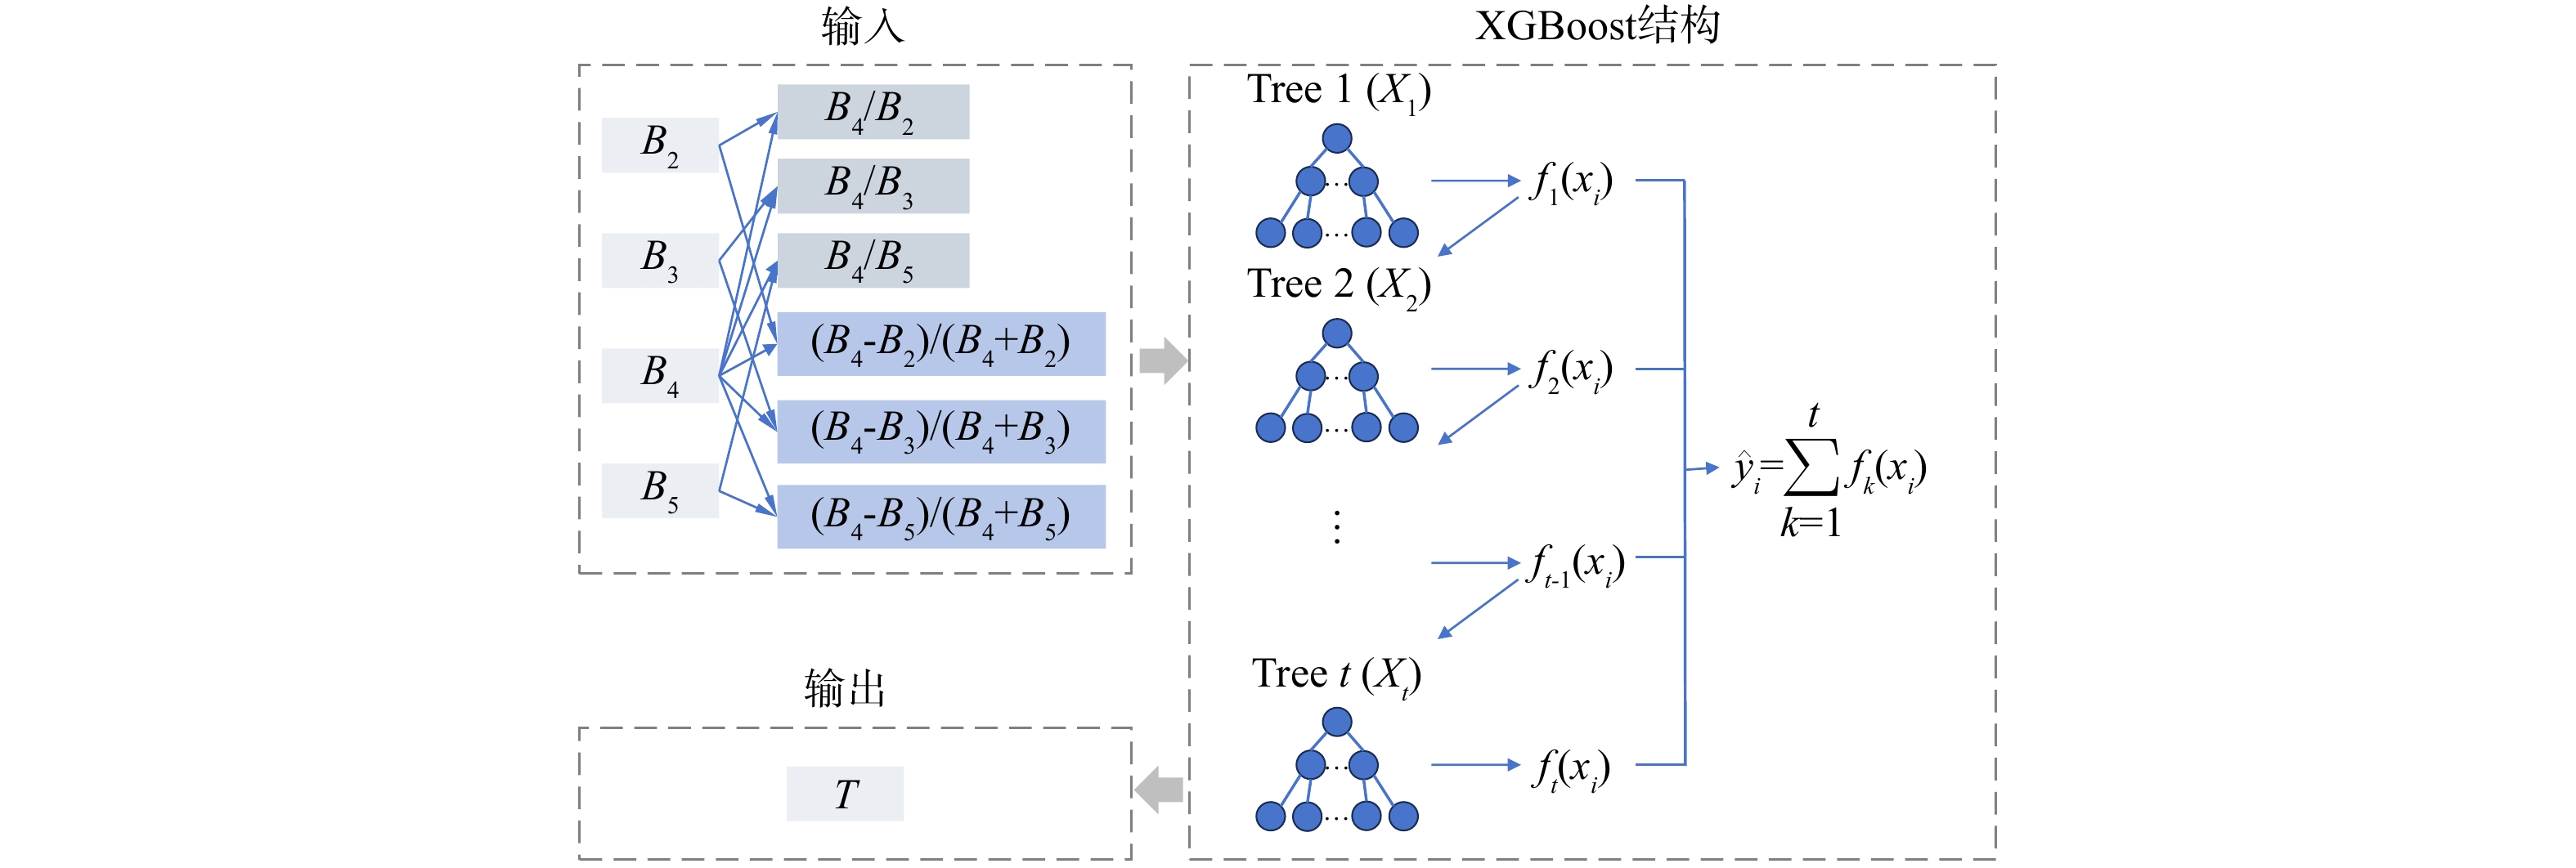
机器学习模型具有良好的泛化能力和鲁棒性,受噪声的影响较小,以XGBoost为代表的机器学习模型被广泛应用于水质参数反演[27-28],对于小样本量数据适用性良好[29]。XGBoost是CHEN和GUESTRIN[30]提出的基于GBDT的一种新实现,通过加法策略将一组弱学习器组合成一个强学习器。XGBoost的弱学习器是决策树,决策树的目标函数值必须为最小值。模型训练时首先使用整个数据集拟合一个学习器,然后添加第二个学习器来拟合前一个学习器的残差,重复训练过程,直到满足停止标准,最终预测结果为每个学习器的预测结果之和,XGBoost模型如图2所示。
对于由n个样本和m个特征组成的给定训练集,D=(xi,yi),(|D|=n,xi∈Rm, yi∈R),XGBoost模型可视为由t个回归树组成的加法模型,XGBoost模型的预测值如式(4)所示,目标函数如式(5)所示。
式中:t是树的数量,yi和
ˆyi 分别是测量值和预测值,F是CART回归树的函数空间,fk是第k个独立树所代表的函数。式(5)中引入fk最小化目标,ˆyi(k−1) 表示第k-1次迭代时对第i个实例的预测,l(yi,ˆyi )度量预测值ˆyi 和测量值yi之间的差异。Ω(fk)为正则化项,即每棵树的复杂度之和,它可以控制模型的复杂性,防止过拟合,γ和λ分别为模型的惩罚系数和L2正则项系数,M为叶节点数,ω为叶得分。模型的输入包括10个单波段或波段组合:OLI的B2、B3、B4、B5波段,波段比B4/B2、B4/B3、B4/B5,以及波段组合(B4−B2)/(B4+B2)、(B4−B3)/(B4+B3)、(B4−B5)/(B4+B5)。输出为浊度T。确定模型结构的主要参数包括学习器数量n_estimators和最大树深max_depth,通过10倍交叉验证的网格搜索方法对参数进行调整。为避免过拟合,将subsample和colsample_bytree两个参数设置为0.7。本研究中使用XGBoost的Python库来实现该算法 (XGBoost Version: 1.7.4;Python 3.9.12) 。
-
为评估浊度反演模型精度,运用决定系数 (R2) 、均方根误差 (Root Mean Square Error,RMSE) 、平均绝对百分比误差 (Mean Absolute Percentage Error,MAPE) 作为评价指标。各指标公式如式(6)~式(8)所示。
式中:
Xmi 为实测值,Xei 为模型预测值,n为样本数量。 -
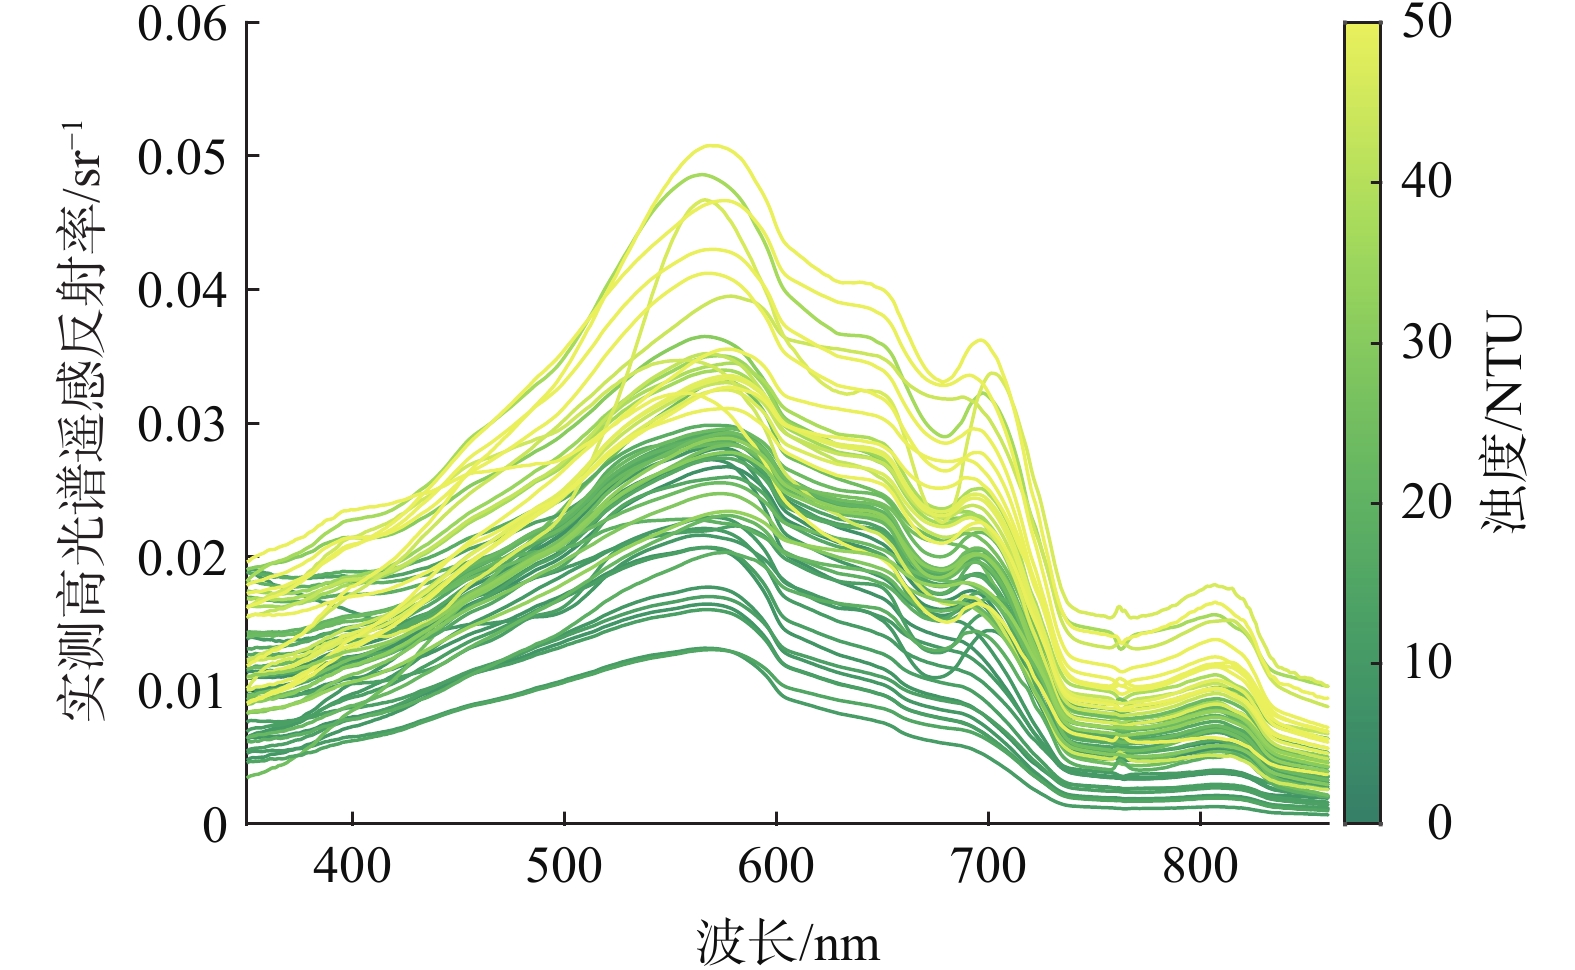
研究区水体属于中低浊度水体,实测浊度为0~50 NTU,中位数为25 NTU。图3为实测浊度的光谱响应,浊度较高的水体高光谱遥感反射率也较高,在可见光波段,560~580 nm和700~720 nm处分别存在明显反射峰,反射谷则落在670~680 nm,在近红外波段,810~820 nm处存在一个较小反射峰,说明红、绿波段是浊度的敏感波段,可能是由悬浮颗粒物散射造成的[5]。图4显示浊度和总悬浮物浓度线性相关,相关系数r为0.69 (p<0.01) ,这与已有的研究结果一致[7, 31-32]。
-
表3显示了Landsat OLI遥感反射率不同波段组合与浊度的相关性。单波段中,B4与浊度相关性最高,相关系数为0.71;波段组合中,B4/B3和与浊度相关性最高,相关系数为0.88,证明OLI红绿波段遥感反射率比值对浊度较为敏感。
利用三类方法 (第2.1至2.3节所述) 构建浊度反演模型。由于实测数据量有限,在构建模型时使用留一交叉验证[33] (Leave One Out Cross Validation,LOOCV) 对模型进行评估,此方法适用于样本量较少的数据集,在完成交叉验证后,将所有数据用于模型构建。表4列出了三类浊度反演模型的交叉验证结果。基于B4/B3的XGBoost浊度反演模型精度最优,R2为0.83,RMSE为4.58 NTU;基于B4/B3波段组合的二次多项式、指数、幂函数回归模型的R2均为0.78,RMSE为5.25~5.26 NTU;基于QAA的半经验模型R2为0.54,RMSE为7.60 NTU,基于SESB的半经验模型R2为0.39,RMSE为8.72 NTU;经验模型和半经验模型效果均低于XGBoost机器学习模型精度,说明XGBoost模型对于处理小样本量数据具有一定优势。
-
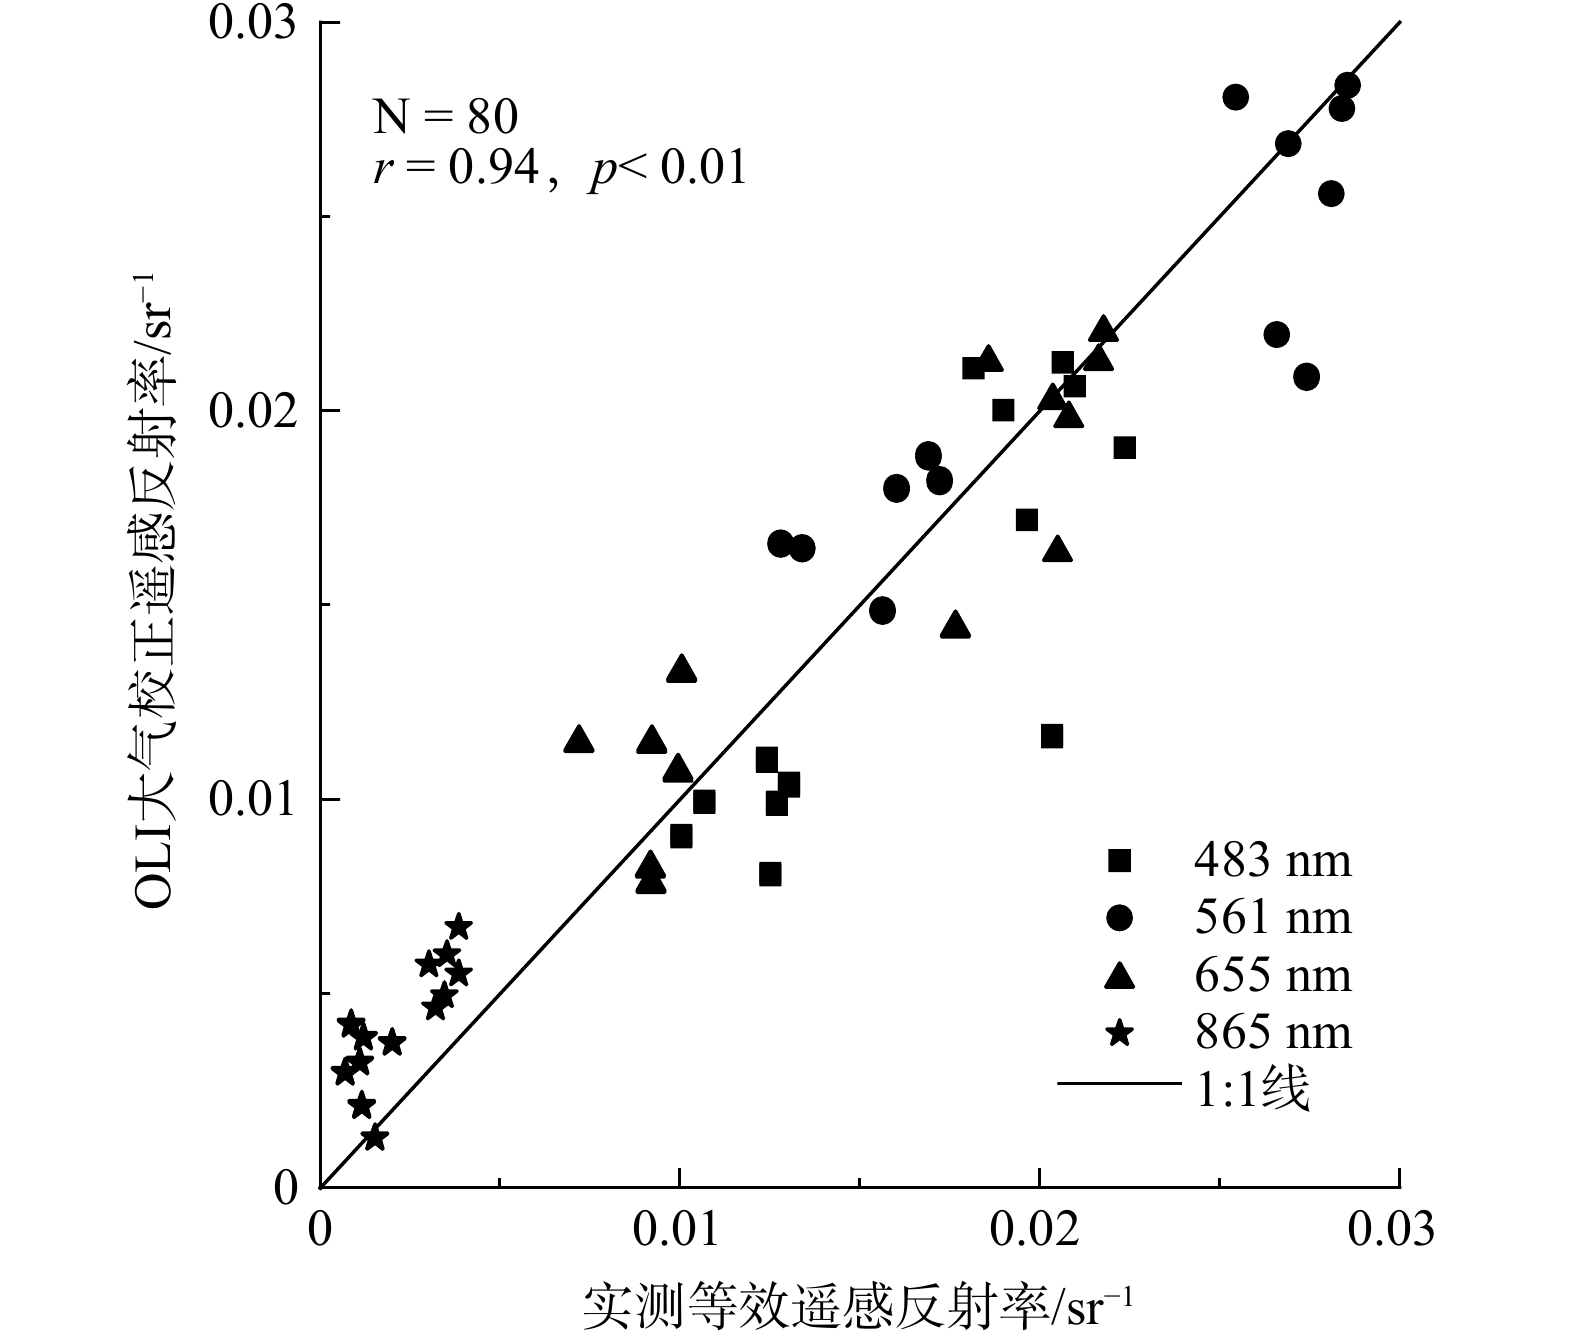
获取采样点同步卫星数据遥感反射率时,采样时间与卫星过境时间相差1.5 h以内,以采样点所在像元为中心使用3×3窗口进行卫星遥感反射率平均。图5显示OLI传感器实测等效遥感反射率与Acolite大气校正的遥感反射率相关系数达0.94 (p<0.01) 。
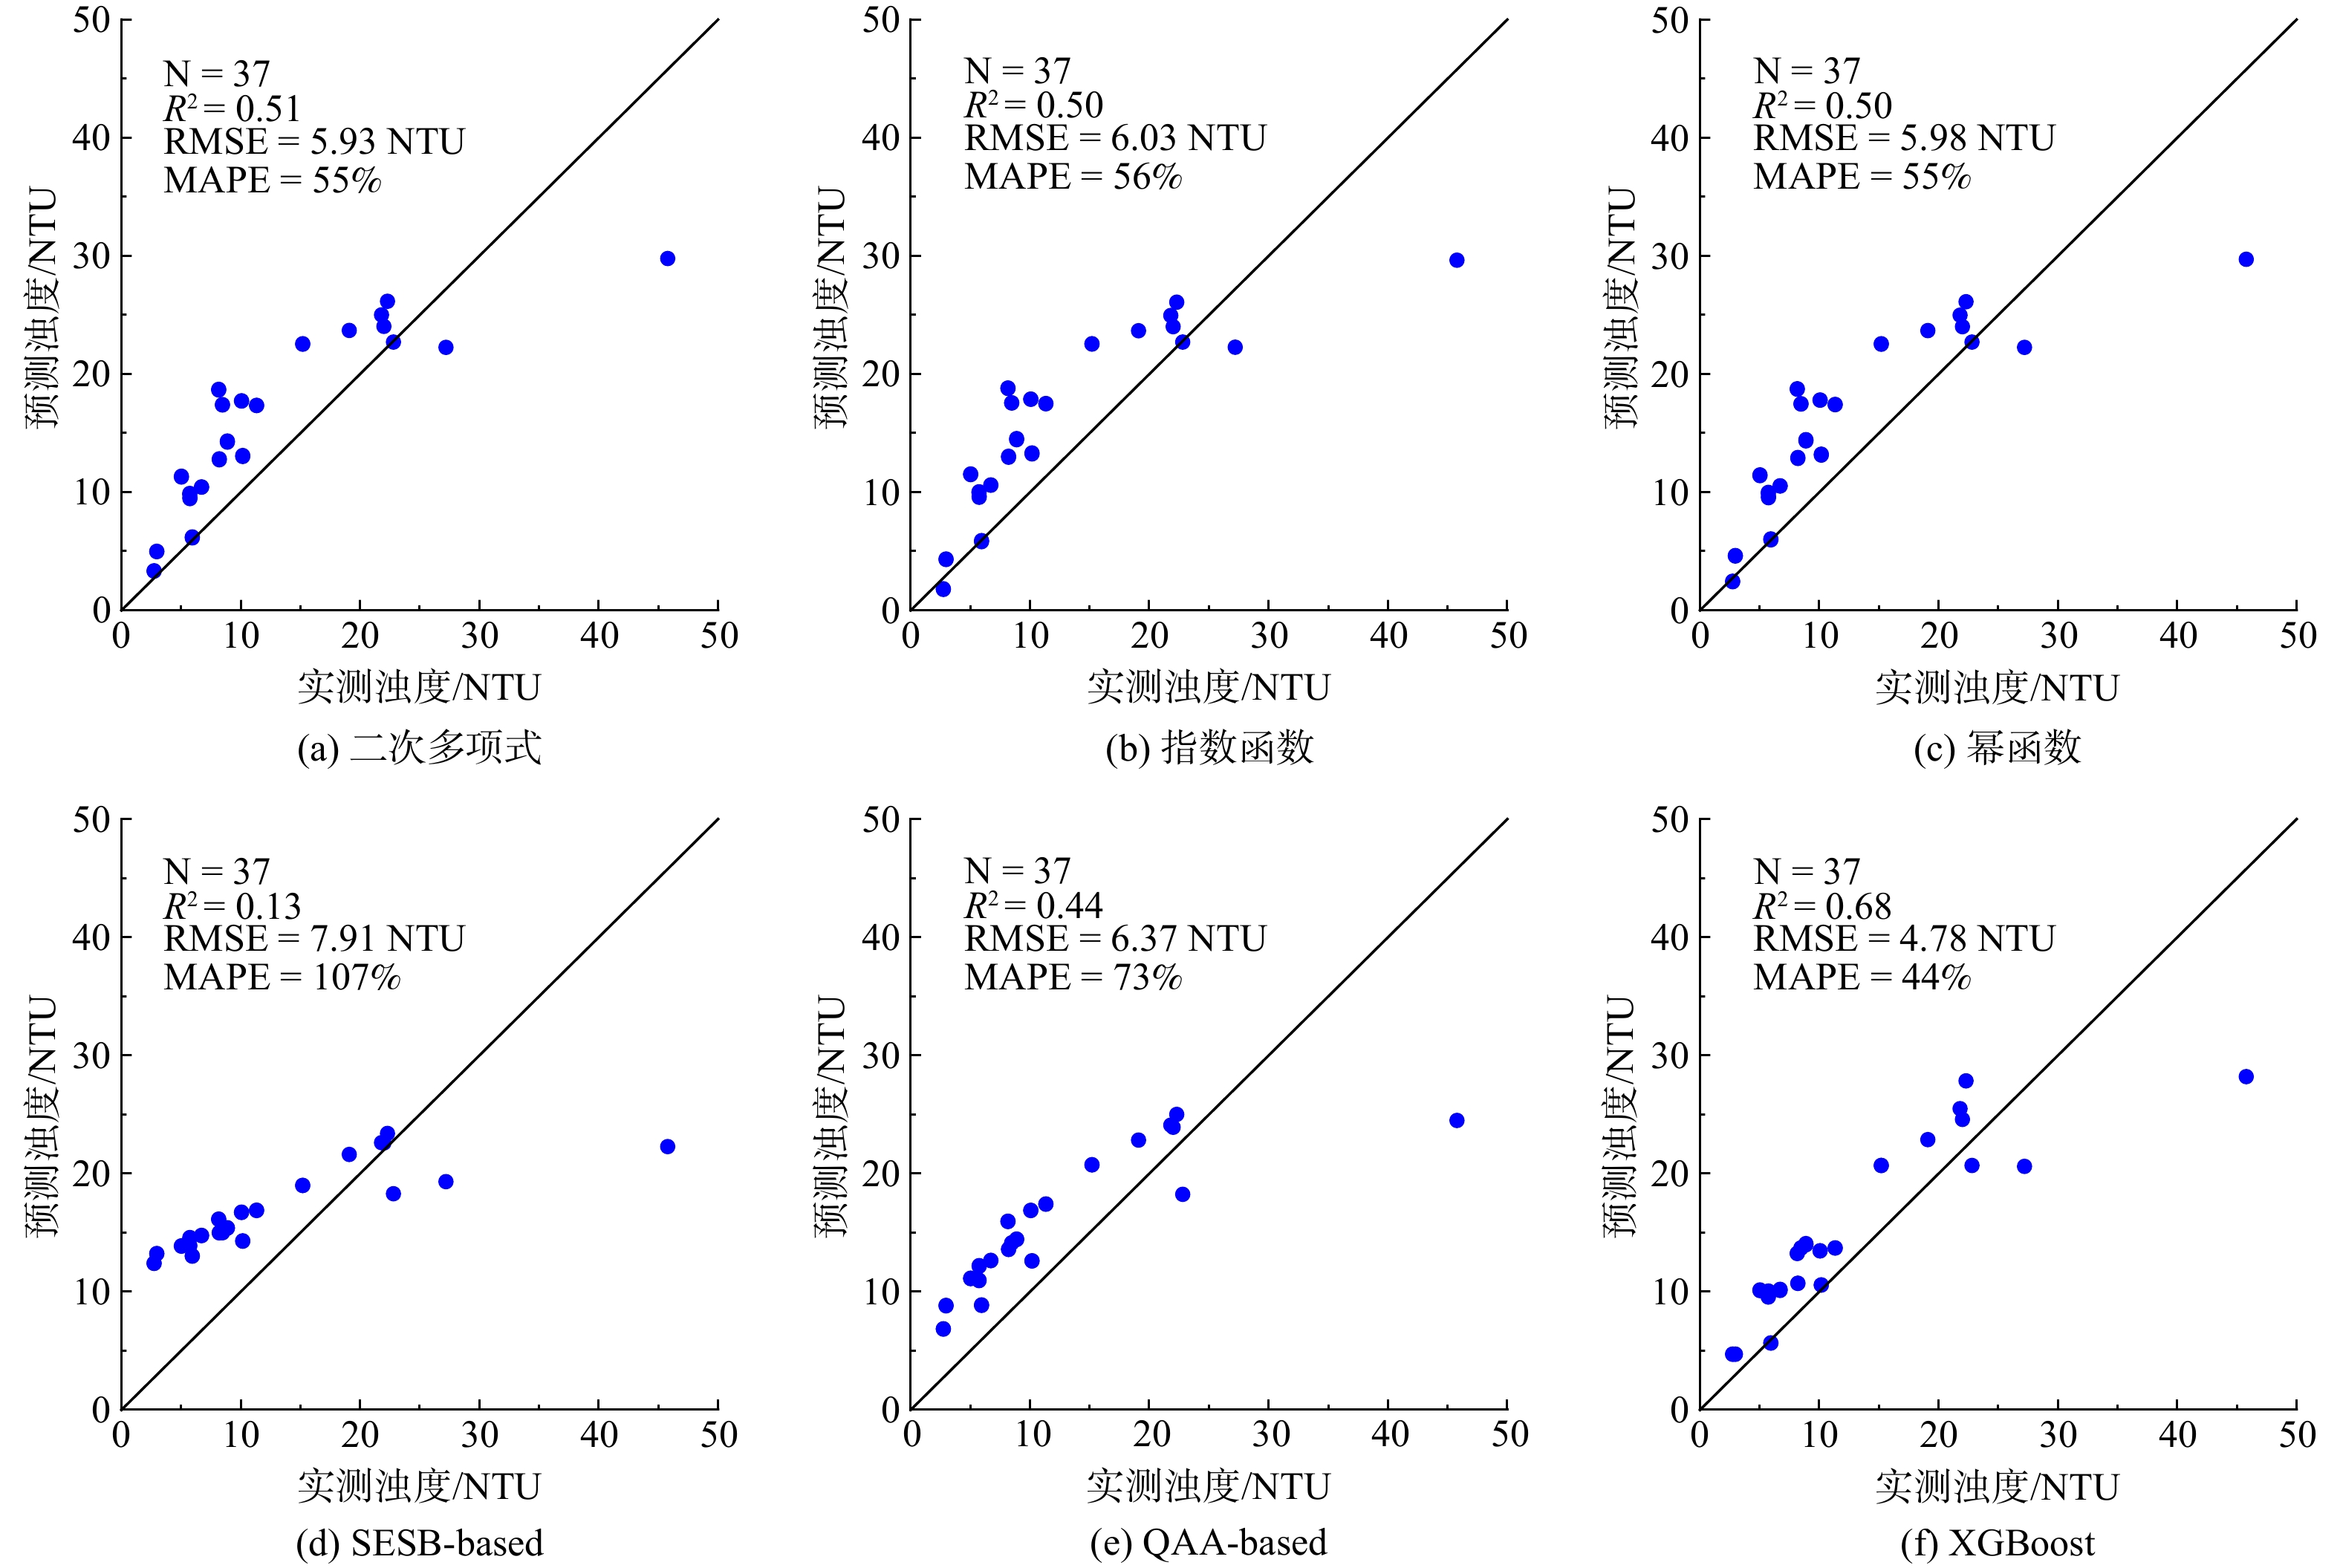
将浊度反演模型应用到卫星数据时 (图6) ,浊度实测值和预测值大部分处于1∶1线附近,浊度大于30 NTU的点预测偏差较大。基于XGBoost的浊度反演模型效果最好,R2为0.68,RMSE为4.78 NTU;其次是二次多项式、指数、幂函数经验模型,R2为0.5~0.51、RMSE为5.93~6.03 NTU;半经验模型效果相对较差,基于SESB的半经验模型R2为0.13,RMSE为7.91 NTU,基于QAA的半经验模型R2为0.44,RMSE为6.37 NTU。验证结果表明XGBoost机器学习方法能够一定程度上提高模型精度。
-
基于XGBoost模型,利用1984—2022年Landsat TM/ETM+/OLI卫星数据反演研究区浊度,分析浊度长期时空动态变化,结合自然因素和人类活动分析浊度变化的驱动因素。
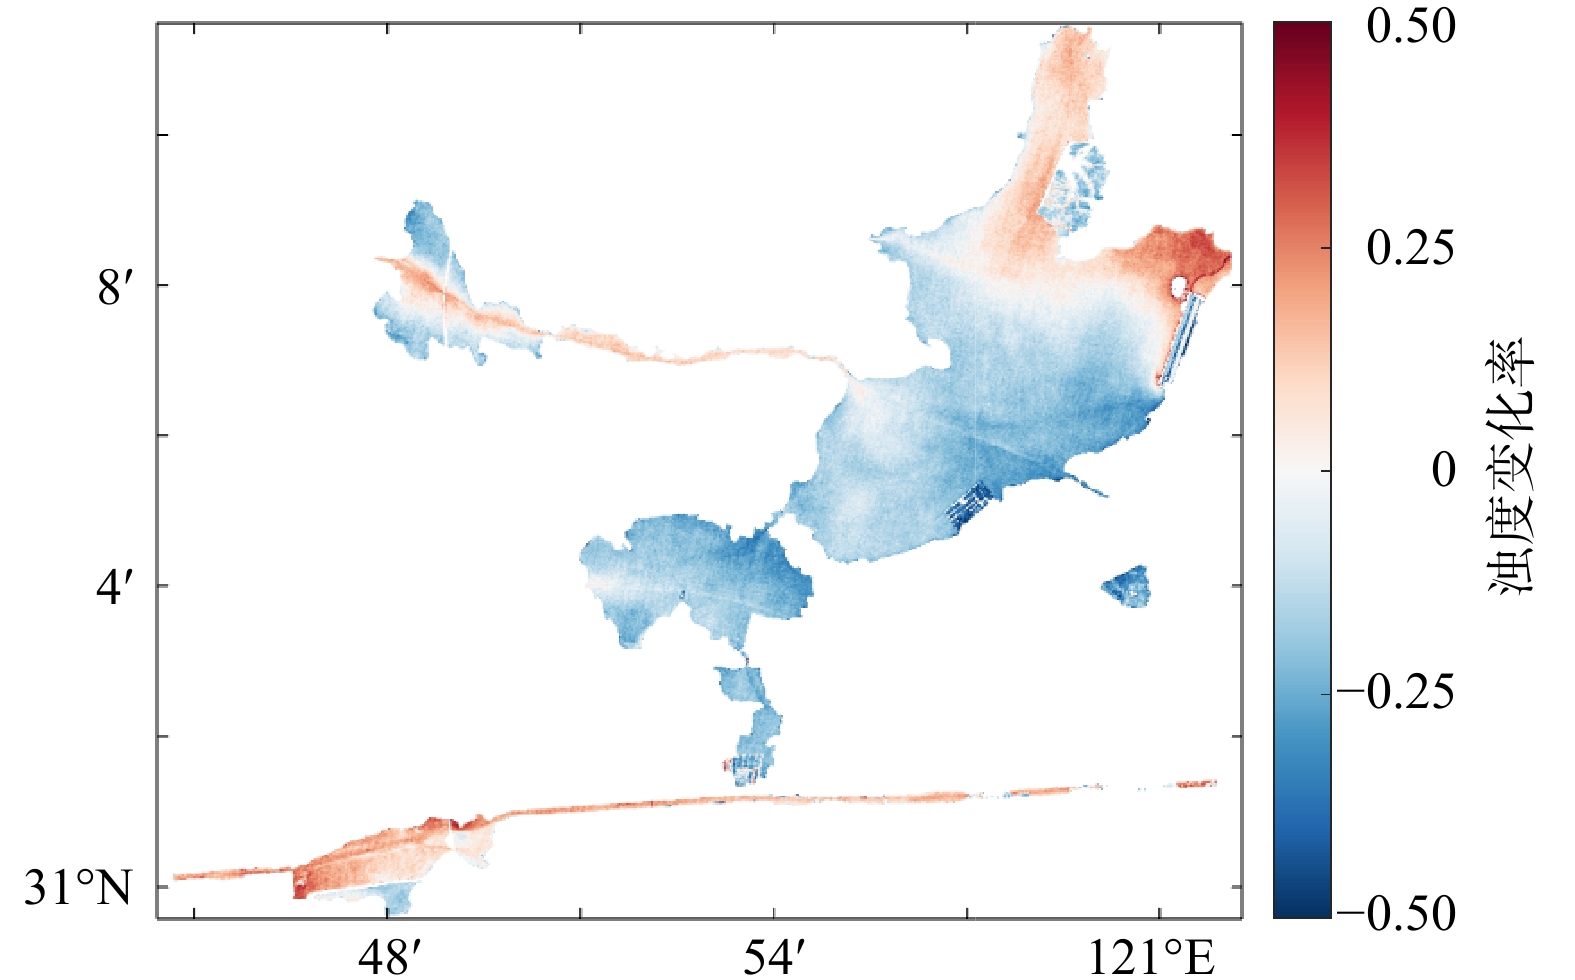
1) 浊度的年际时空变化。研究区浊度的长时序时空变化分析以3年为周期求平均值[16],结果见图7。1993—1995年、2014—2019年汾湖-太浦河航道浊度较高,可能与1991年底开启的太浦河疏浚工程和2014年底动工的金泽水库开发工程有关。1996年汾湖一分为二,内汾湖浊度低于外汾湖。2005年淀山湖北部渔场开发,该区域在2005‒2007年浊度显著上升。图8显示了研究区近40年浊度整体变化趋势,研究区河流航道、淀山湖北部非渔场区域浊度升高,分别上升了10%和12%,可能与水上货运量增多和区域建设有关。元荡湖、大莲湖浊度下降,分别下降了19%和27%,可能与河湖湿地生态保护修复有关。
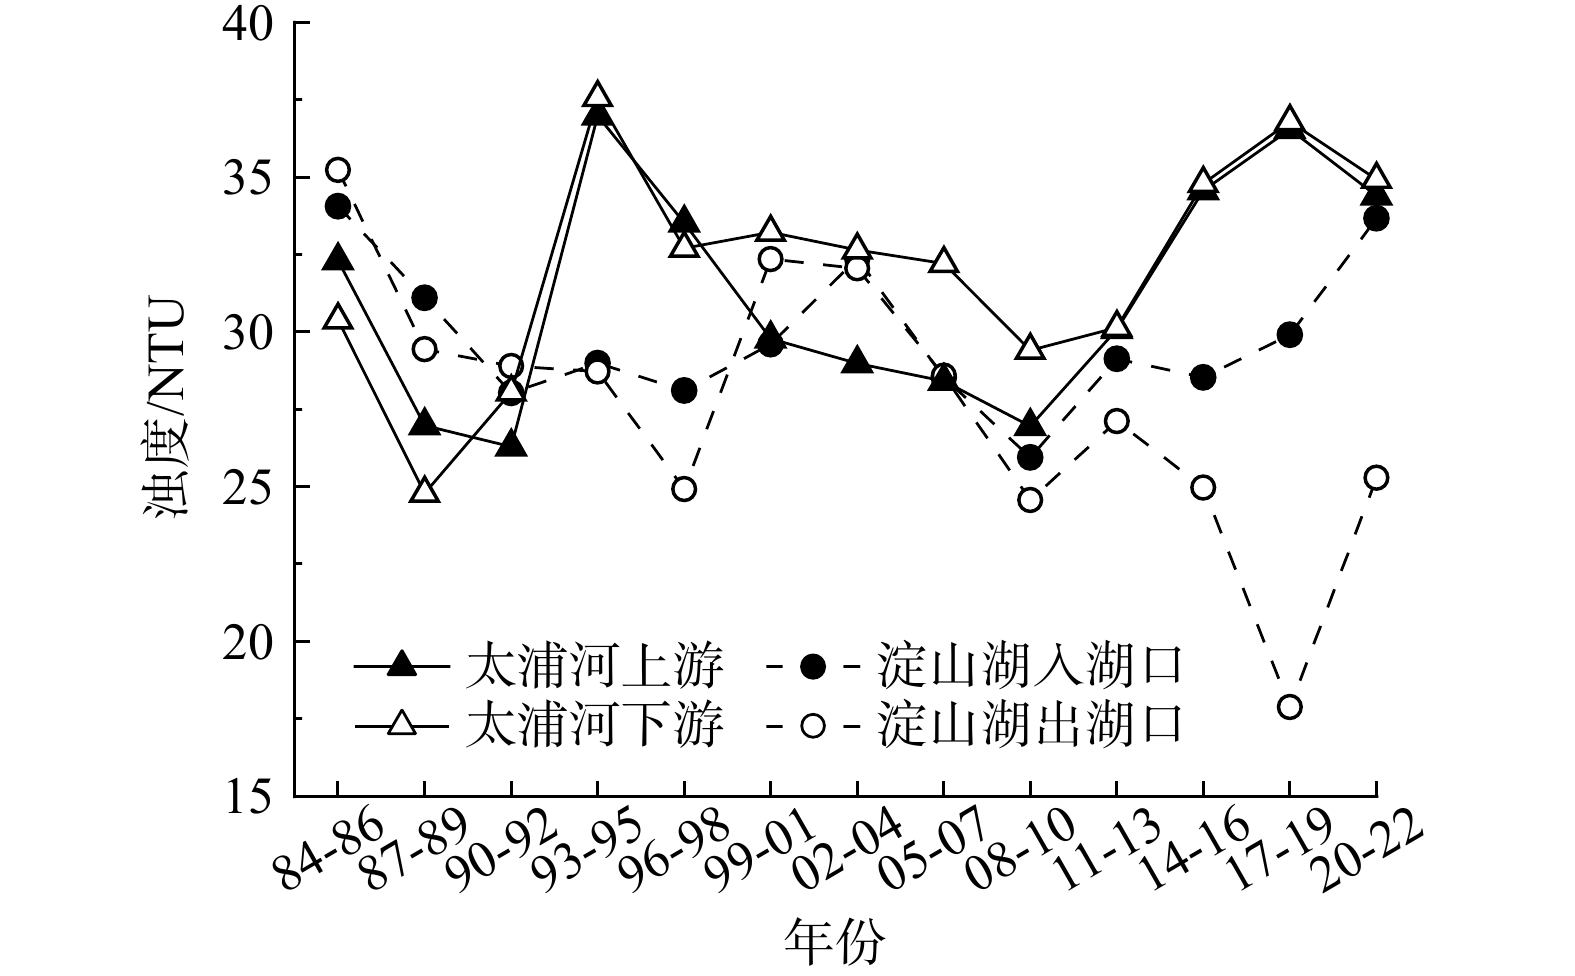
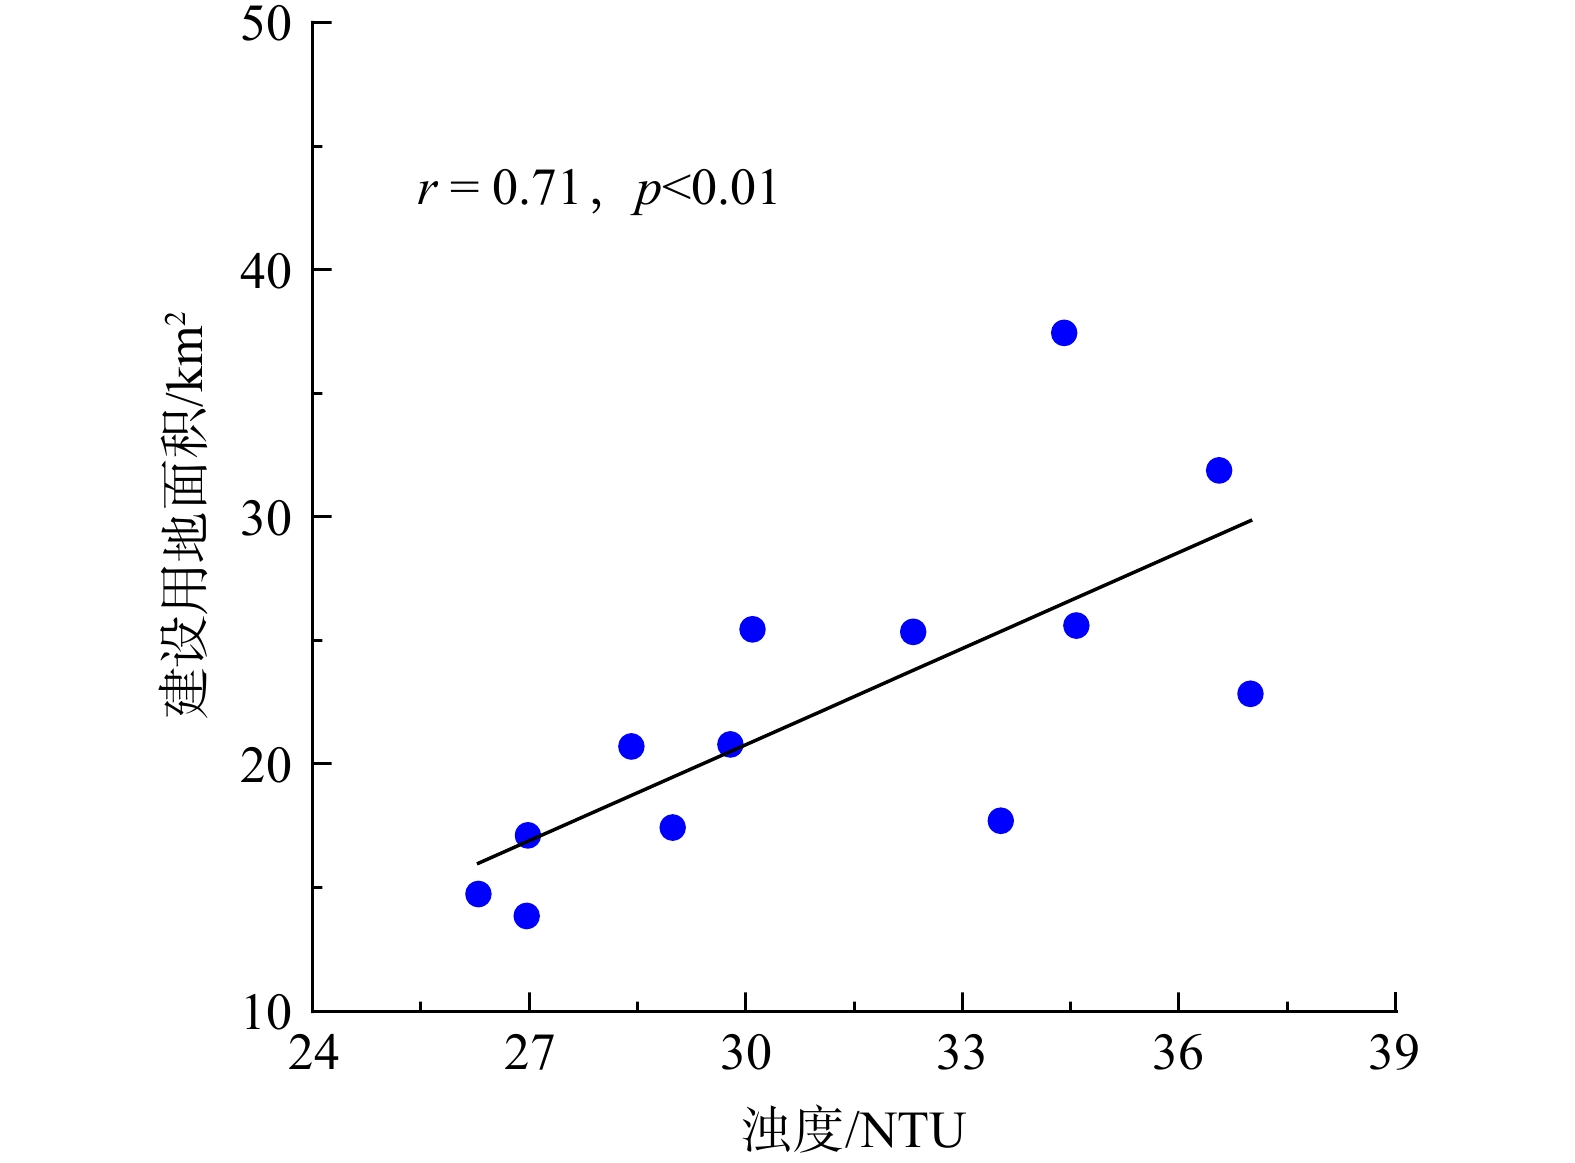
定量分析4个目标区域 (图1) 近40年浊度变化,结果如图9所示,目标区域近40年浊度在15~40 NTU之间,2017年以前,淀山湖入湖口和出湖口浊度差异较小,2017年以后,入湖口浊度大于出湖口,浊度平均相差10 NTU,太浦河上下游浊度差值保持在0~4 NTU之间,浊度差异较小。土地利用分类结果显示,太浦河沿岸建设用地面积近40年增长了1.5倍,太浦河上游浊度和建设用地面积相关系数为0.71 (p<0.01) (图10) ,说明建设用地的增加在一定程度上会影响研究区浊度变化。
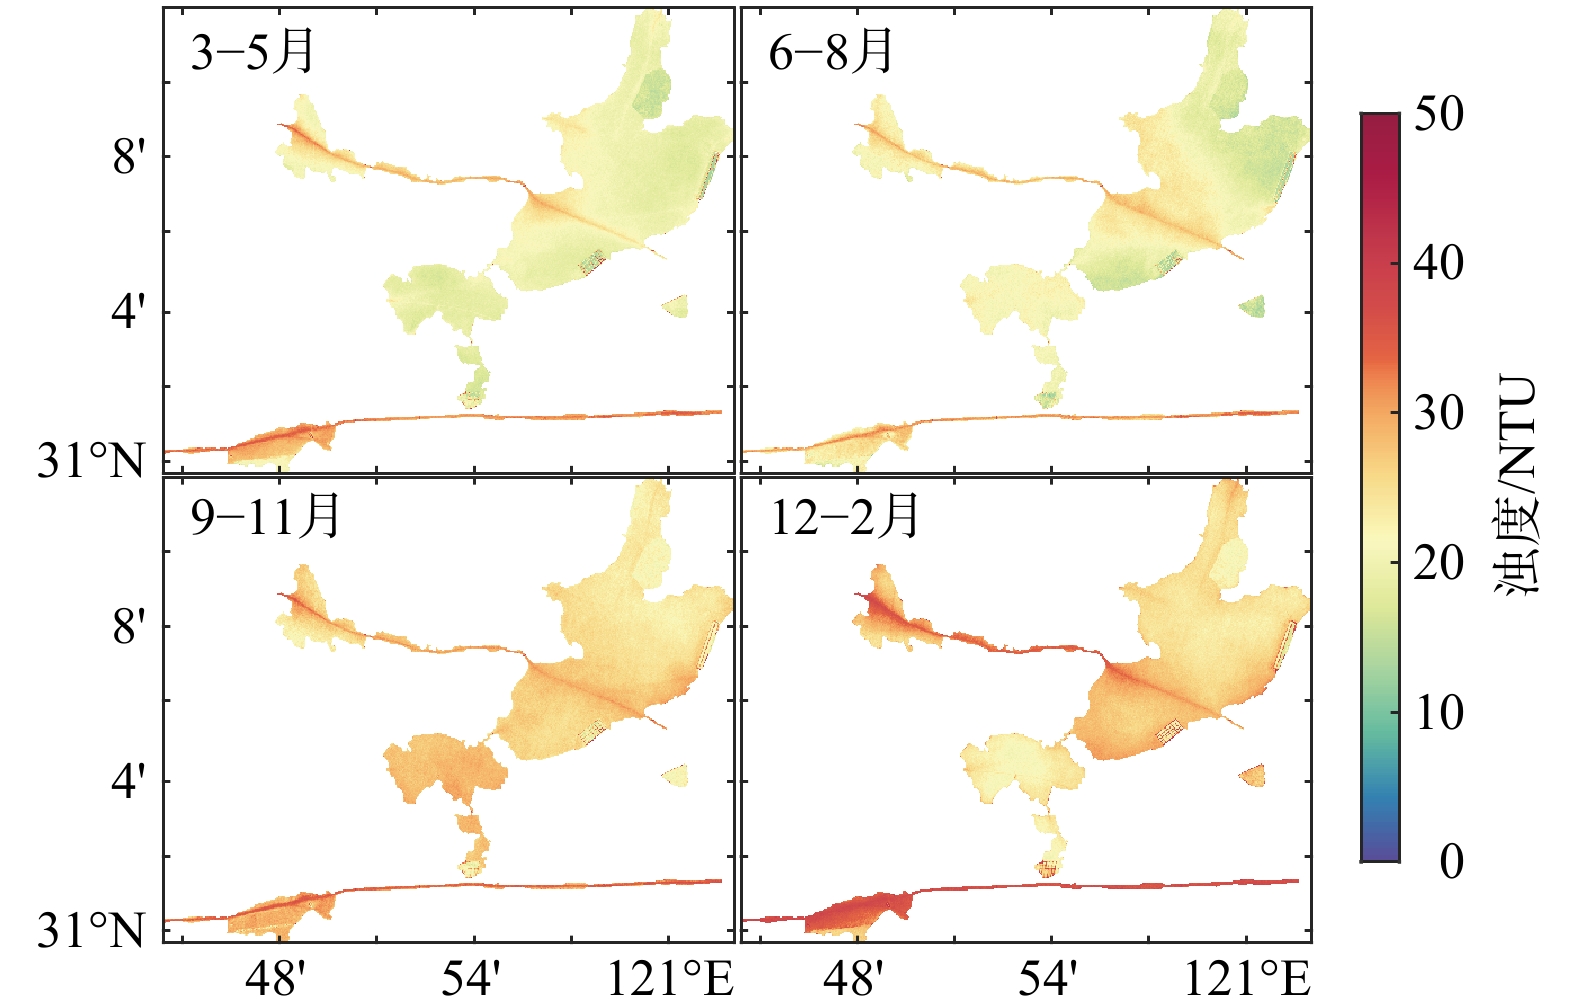
2) 浊度的季节性变化。研究浊度的季节性变化时将近40年浊度反演结果按季节求平均值,如图11所示。研究区近40年浊度季节性变化显著,秋冬季平均浊度为27 NTU,春夏季平均浊度为21 NTU,秋冬季平均浊度比春夏季高6 NTU。白蚬湖-淀山湖航道和汾湖-太浦河航道冬季浊度明显高于其他季节。
降水和风力是调节水体浊度的重要因素[22, 34],1984—2022年月平均浊度和降水量、风速之间的关系如图12所示。近40年研究区1~3月、9~12月月平均浊度较高 (>25 NTU) ,而4~8月浊度较低,月平均浊度秋冬季高于春夏季,这与HOU等[5]的研究结果一致。近40年月平均降水量在0~10 mm之间,6月降水量最高为9 mm,浊度与降水量整体呈负相关关系,相关系数为−0.61 (p<0.05) 。1984‒2022年月平均风速在1~2 m·s−1之间,7月风速最大为1.8 m·s−1,浊度与风速之间无显著相关性。
-
1) 与经验、半经验模型相比,XGBoost在模型构建和真实性检验时具有较高的精度 (模型构建时R2为0.83,RMSE为4.58 NTU;真实性检验时R2为0.68,RMSE为4.78 NTU) ,适用于浊度反演研究。
2) 近40年研究区浊度时空变化明显。人类活动较为频繁的河流航道和淀山湖北部非渔场区域浊度上升,而位于湿地生态保护修复区的元荡湖、大莲湖浊度下降,建设用地面积增加一定程度上使得研究区浊度上升。
3) 近40年研究区浊度季节性变化明显。秋冬季浊度高于春夏季,月平均浊度与月平均降水量相关性较为明显,相关系数为-0.61 (p<0.05) ,而与月平均风速无明显相关性。
基于XGBoost的内陆河湖浊度反演与长时序分析
Inversion and long-term series analysis of turbidity in inland rivers and lakes based on XGBoost
-
摘要: 浊度是影响水下光场及营养盐循环的关键要素之一,浊度监测可以为河湖水质的污染防控和预警提供科学依据。以长三角示范区的典型河湖为研究区,使用实测数据构建浊度反演模型,并利用1984—2022年Landsat卫星数据分析了研究区河湖浊度的长时序动态变化。对比传统经验模型、半经验模型和机器学习模型,XGBoost机器学习模型精度最高 (R2为0.68,RMSE为4.78 NTU) 。浊度反演结果表明,近40年河流航道和淀山湖北部非渔场区域浊度上升了10%和12%,而元荡湖和大莲湖浊度下降了19%和27%,并且浊度随着建设用地面积的增加而增大;研究区浊度季节性变化显著,秋冬季平均浊度比春夏季高6 NTU,月平均浊度与月平均降水量负相关,相关系数为-0.61 (p<0.05) ,但与月平均风速没有显著的相关性。基于XGBoost的Landsat长时序浊度反演能够把握研究区浊度的时空变化趋势,明确水污染管理与治理方向,最终助力长三角一体化发展。Abstract: Turbidity is one of the key elements affecting the underwater light field and nutrient cycling. Turbidity monitoring can provide a scientific basis for pollution prevention, control, and early warning of river and lake water quality. The typical rivers and lakes in the demonstration zone of the Yangtze River Delta were taken as the study area. The turbidity inversion model was constructed using in-situ data, based on which the long-term dynamic changes of turbidity in the rivers and lakes of the study area were analyzed using a total of 323 Landsat TM/ETM+/OLI images from 1984 to 2022. Through the comparison between the traditional empirical model, semi-empirical model, and machine learning model, the machine learning model named XGBoost demonstrated the highest accuracy (R2 and RMSE were 0.68 and 4.78 NTU, respectively). The results of turbidity inversion showed that, in the last 40 years, turbidity in the river channel and the northern non-fishing area of Dianshan Lake increased by 10% and 12%, respectively, while turbidity in Yuandang Lake and Dalian Lake decreased by 19% and 27%, respectively. Moreover, it was found that turbidity increased with the expansion of the built-up land area. The seasonal variation of turbidity in the study area was significant and the average turbidity in autumn and winter was 6 NTU higher than that in spring and summer. The monthly average turbidity was negatively correlated with the monthly average precipitation (r=-0.61, p<0.05), but its correlation with the monthly average wind speed was found to be insignificant. The XGBoost-based long-term inversion of turbidity from Landsat images can not only capture the spatiotemporal trend of turbidity in the study area, but also reveal the direction of water pollution management and control, eventually contributing to the integrated development of the Yangtze River Delta.
-
Key words:
- turbidity /
- XGBoost /
- Landsat /
- long-term series /
- demonstration zone of the Yangtze River Delta
-
浊度 (turbidity,T,NTU) 是水环境监测的重要参数,反映了光在水体传输中的受阻程度,浊度的变化能够表征水中悬浮颗粒物浓度的变化,对水中污染物质迁移具有重要指示作用[1-2],浊度还会通过影响水下光的传播改变水生生态系统的初级生产力和生态平衡[3],因此浊度对于水资源管理、水生态保护等具有重要意义。长三角地区水环境状况复杂多变,前人对长三角地区的水体浊度[4]、总悬浮物浓度 (total suspended matter concentration,TSM,mg∙L−1) [5]、透明度[6]等开展了众多研究,但研究多为大型河湖水体,中小型湖泊和河流研究较少,长三角示范区是引领长三角地区高质量一体化发展的重要区域,浊度反演研究可为示范区绿色发展提供重要依据。
如何利用卫星数据准确估算水体浊度是国内外学者研究的重点,常见的有经验模型、半经验模型和机器学习模型。HOU等[5]运用MODIS 555 nm和645 nm波段表面反射率比值构建了总悬浮物浓度经验模型用于长江中下游流域大型湖泊和水库的浊度动态监测。DOXARAN等[7]基于MODIS 858 nm和645 nm波段表面反射率比值构建浊度反演经验模型,用于研究法国吉伦特河口最大浑浊带浊度动态变化。DOGLIOTTI等[8]从固有光学特性出发基于MODIS 645 nm波段遥感反射率 (remote sensing reflectance,Rrs,sr−1) 发展了适用于沿海和河口水域中低浊度的半经验反演模型。MA等[9]运用梯度增强决策树 (gradient boosting decision trees,GBDT) 估算了中国东北地区湖泊浊度。前人研究的浊度反演模型大多应用于开阔的近海河口水域,受人类活动影响较小,研究对象多为光学敏感性较高的高度浑浊水体。而本研究水体主要为中低浊度水体,且研究区内湖荡密布,航道众多,生产生活密集,水动力变化复杂,针对此类水体浊度的长时序监测研究尚不多见。
本研究以长三角示范区内典型河湖为研究区,运用实测数据构建并对比了经验模型、半经验模型和机器学习模型三类浊度反演模型,随后基于最佳的XGBoost (eXtreme Gradient Boosting) 模型运用Landsat卫星数据反演研究区浊度,分析浊度的长期时空动态变化及其驱动因素。
1. 研究区域与数据
1.1 研究区概况
长三角示范区包括上海市青浦区、江苏省吴江区、浙江省嘉善县,研究区位于长三角示范区中部,包括淀山湖、元荡湖、汾湖、大莲湖、白蚬湖和太浦河等,研究区内河湖水系密布,相互连通,白蚬湖-淀山湖航道、汾湖-太浦河航道为研究区主要航道,研究区位置和采样点分布见图1。以9×9卫星影像像素选择4个目标区域,依次编号为:1-淀山湖入湖口、2-淀山湖出湖口、3-太浦河上游、4-太浦河下游。
1.2 卫星数据及处理
Landsat TM/ETM+/OLI传感器获取了1982年以来时间连续的地表遥感影像,能够满足近40年研究区长时序浊度监测的应用需求。Landsat TM/ETM+波段范围为450~2 350 nm,分别有7个和8个波段,Landsat OLI波段范围为430~2 290 nm,共9个波段。本研究使用来自美国地质调查局 (United States Geological Survey, USGS,https://earthexplorer.usgs.gov/) 30 m空间分辨率的Landsat Level-1数据。剔除1984‒2022年研究区受云量、条带、耀光影响的数据,最终筛选得到323幅高质量影像。
VANHELLEMONT和RUDDICK[10]提出的暗光谱拟合大气校正算法 (dark spectrum fitting,DSF) 能够对高空间分辨率影像进行准确的大气校正处理[11-13],经验证该方法得到的遥感反射率精度较高[14],能够应用于悬浮物浓度[15-16]、浊度[17]的反演研究。因此,本研究采用该方法对Landsat数据进行大气校正,处理工具为ACOLITE Python (Version 20210114.0) 。
1.3 现场数据及处理
1) 现场实测数据。使用地物光谱仪 (ASD FieldSpec4 HR NG,北京理加联合科技有限公司) 获取水体高光谱数据,根据水面以上测量方法[18]计算水体高光谱遥感反射率,光谱分辨率为1 nm。使用多参数水质分析仪 (HYDROLAB HL7,美国HACH公司;YSI-EMS-KorEXO,美国Xylem公司) 现场测量水样获取水质数据,包括电导率、温度、pH、溶解氧、氨氮和浊度等。野外实验严格遵循《地表水和污水监测技术规范》[19]的要求。将采集的水样带回实验室,采用称重法[20]测量水体总悬浮物浓度。2022‒2023年进行了5次现场数据采集工作,共采集了126组实测高光谱遥感反射率和水质数据,剔除异常数据后得到实测浊度和高光谱遥感反射率匹配的有效数据81组 (见表1) 。
表 1 采样位置、时间和数量Table 1. Sampling location, time and number of samples编号 位置 时间 采样数量 有效数据量 1 太湖西山岛以北 2022-10-24 35 6 2 元荡湖 2022-10-25 35 29 3 太浦河、汾湖、三白荡 2022-11-23 18 15 4 淀山湖南部 2022-12-13 20 15 5 淀山湖、元荡湖 2023-03-26 18 16 2) 等效遥感反射率。为匹配Landsat大气校正后的多光谱遥感反射率和现场实测高光谱遥感反射率,根据Landsat不同传感器的光谱响应函数 (spectral response function,SRF) ,将实测高光谱遥感反射率转化为传感器等效波长处的遥感反射率[21],计算公式如式(1)所示。
Rrs(Bi)=∫λ2λ1Rrs(λ)S(λ)d(λ)∫λ2λ1S(λ)d(λ) (1) 式中:Bi表示卫星传感器第i个波段;Rrs(Bi)是传感器第i个波段的等效遥感反射率,sr−1;λ1和λ2分别是第i个波段波长的最小值和最大值,nm;Rrs(λ)是波长λ处实测高光谱遥感反射率,sr−1;S(λ)为传感器在λ处的光谱响应函数。
1.4 其他数据
研究区覆盖急水港桥、淀峰、太浦河桥和汾湖大桥4个国控水质监测断面,本研究搜集了以上4个站点2021年夏季到2022年秋季的水质监测数据,用于浊度反演模型的真实性检验,数据来源于国家地表水水质自动监测发布系统 (https://szzdjc.cnemc.cn:8070/GJZ/Business/Publish/Main.html) 。
本研究收集了1984—2022年研究区的降水量 (mm) 和风速 (m∙s−1) 数据,用于分析降水量、风速与浊度季节性变化的关系。该气象数据来自欧洲中期天气预报中心 (European Centre for Medium-Range Weather Forecasts,ECMWF) 的ERA5-Land数据集(https://cds.climate.copernicus.eu/),ERA5-Land数据集收集了1950年至今的陆地月平均气象数据 ,空间分辨率为0.1°×0.1°,时间分辨率为1个月 (30 d) 。
2. 浊度遥感反演方法
目前发展的浊度反演方法以经验模型为主,通过简单的数学函数,拟合浊度和遥感反射率之间的关系;半经验模型从辐射传输理论出发,计算过程较为复杂;机器学习可以很好地描述客观变量和特征变量之间的非线性关系,能够更加灵活地处理具有高维特征的数据集。下文分别构建经验模型、半经验模型和机器学习模型,对比分析三类模型精度,以获取最佳浊度反演模型。
2.1 经验模型
以多项式、指数、幂函数模型为例的经验回归模型由于构造简单,被广泛运用于浊度和总悬浮物浓度的遥感反演[5, 22]。常用单波段Bi[4, 23]、波段比(Bi/Bj)[23-24]或波段组合(Bi-Bj)/(Bi+Bj)[4, 9]构建浊度反演模型 (对于OLI传感器,Bi和Bj表示OLI 2、3、4或5波段遥感反射率) 。利用相关系数选择与浊度相关性最高的光谱特征组合,分别使用多项式、指数、幂函数模型对浊度和光谱特征组合进行拟合。
2.2 半经验模型
常见的半经验浊度反演模型有2个,一个是DOGLIOTTI等[8]从NECHAD等[2]的反射率模型发展的单波段浊度反演模型 (Semi-Empirical Single Band turbidity retrieval algorithm,SESB) ,另一个是基于LEE等[25]准分析算法 (Quasi-Analytical Algorithm,QAA) 的浊度反演模型。
参考NECHAD等[2]的模型构建方法,对SESB模型引入系数
BλT T=AλTρw(λ)/(1−ρw(λ)/Cλ)+BλT (2) ρw(λ)=πLw(λ)/E0+d(λ) (3) 式中:T表示浊度,NTU;ρw(λ)表示波长λ处水体表面反射率,sr−1,与离水辐亮度 (water-leaving radiance,Lw(λ),W/(m2∙sr∙nm)) 和水面以上下行辐照度 (downwelling irradiance just above the water surface,
E0+d AλT BλT Cλ Cλ BALASUBRAMANIAN等[26]已证明中低浊度水体的悬浮颗粒物浓度与665 nm处的颗粒物后向散射系数 (particulate backscattering coefficient,bbp,m−1) 存在幂函数关系。通过LEE等[25]的QAA算法获取OLI的bbp(655),对bbp(655)和浊度进行幂函数拟合,构建基于QAA的浊度反演算法。本研究所用的QAA版本为QAA_v6,bbp(655)计算步骤见表2。
表 2 基于QAA计算OLI的颗粒物后向散射系数bbp(655)Table 2. Calculation of bbp at 655 nm for OLI based on QAA步骤 计算 1 rrs(λ)=Rrs(λ)/(0.52+1.7Rrs(λ)) 2 μ(λ)=−g0+√(g0)2+4g1×rrs(λ)2g1 g0 g1 如果Rrs(655)<0.0015 sr−1 否则655 nm = λ0 3 χ=log(rrs(443)+rrs(483)rrs(561)+5rrs(655)/rrs(483)×rrs(655)) a(λ0)=a(561)=aw(561)+10h0+h1χ+h2χ2 h0=−1.146 h1=−1.366 h2=−0.469 a(λ0)=a(655)=aw(655)+0.39(Rrs(655)Rrs(443)+Rrs(483))1.14 4 bbp(λ0)=bbp(561)=μ(561)×a(561)1−μ(561)−bbw(561) bbp(λ0)=bbp(655)=μ(655)×a(655)1−μ(655)−bbw(655) 5 η=2.0(1−1.2exp(−0.9rrs(443)/rrs(561))) 6 bbp(λ)=bbp(λ0)(λ0/λ)η 注:表中a和aw分别为总吸收系数和纯海水吸收系数,m−1;bbw和bbp分别为纯海水和悬浮颗粒的后向散射系数,m−1。rrs(λ)为水表面以下遥感反射率,sr−1,Rrs(λ)是水面以上遥感反射率,sr−1。 2.3 机器学习模型
机器学习模型具有良好的泛化能力和鲁棒性,受噪声的影响较小,以XGBoost为代表的机器学习模型被广泛应用于水质参数反演[27-28],对于小样本量数据适用性良好[29]。XGBoost是CHEN和GUESTRIN[30]提出的基于GBDT的一种新实现,通过加法策略将一组弱学习器组合成一个强学习器。XGBoost的弱学习器是决策树,决策树的目标函数值必须为最小值。模型训练时首先使用整个数据集拟合一个学习器,然后添加第二个学习器来拟合前一个学习器的残差,重复训练过程,直到满足停止标准,最终预测结果为每个学习器的预测结果之和,XGBoost模型如图2所示。
对于由n个样本和m个特征组成的给定训练集,D=(xi,yi),(|D|=n,xi∈Rm, yi∈R),XGBoost模型可视为由t个回归树组成的加法模型,XGBoost模型的预测值如式(4)所示,目标函数如式(5)所示。
ˆyi=∑tk=1fk(xi),fk∈F (4) Obj(k)=∑ni=1l(yi,^yi(k−1)+fk(xi))+Ω(fk),Ω(fk)=γMk+12λ‖ωk‖2 (5) 式中:t是树的数量,yi和
ˆyi ˆyi(k−1) ˆyi ˆyi 模型的输入包括10个单波段或波段组合:OLI的B2、B3、B4、B5波段,波段比B4/B2、B4/B3、B4/B5,以及波段组合(B4−B2)/(B4+B2)、(B4−B3)/(B4+B3)、(B4−B5)/(B4+B5)。输出为浊度T。确定模型结构的主要参数包括学习器数量n_estimators和最大树深max_depth,通过10倍交叉验证的网格搜索方法对参数进行调整。为避免过拟合,将subsample和colsample_bytree两个参数设置为0.7。本研究中使用XGBoost的Python库来实现该算法 (XGBoost Version: 1.7.4;Python 3.9.12) 。
2.4 评价指标
为评估浊度反演模型精度,运用决定系数 (R2) 、均方根误差 (Root Mean Square Error,RMSE) 、平均绝对百分比误差 (Mean Absolute Percentage Error,MAPE) 作为评价指标。各指标公式如式(6)~式(8)所示。
R2=1−(∑ni=1(Xmi−Xei)2)/(∑ni=1(Xmi−¯Xmi)2) (6) RMSE=√1n∑ni=1(Xei−Xmi)2 (7) MAPE = 100%n∑ni=1|(Xei−Xmi)/Xmi| (8) 式中:
Xmi Xei 3. 结果与分析
3.1 水体浊度特征
研究区水体属于中低浊度水体,实测浊度为0~50 NTU,中位数为25 NTU。图3为实测浊度的光谱响应,浊度较高的水体高光谱遥感反射率也较高,在可见光波段,560~580 nm和700~720 nm处分别存在明显反射峰,反射谷则落在670~680 nm,在近红外波段,810~820 nm处存在一个较小反射峰,说明红、绿波段是浊度的敏感波段,可能是由悬浮颗粒物散射造成的[5]。图4显示浊度和总悬浮物浓度线性相关,相关系数r为0.69 (p<0.01) ,这与已有的研究结果一致[7, 31-32]。
3.2 不同浊度反演模型参数化及比较
表3显示了Landsat OLI遥感反射率不同波段组合与浊度的相关性。单波段中,B4与浊度相关性最高,相关系数为0.71;波段组合中,B4/B3和与浊度相关性最高,相关系数为0.88,证明OLI红绿波段遥感反射率比值对浊度较为敏感。
表 3 遥感反射率光谱特征组合与浊度的相关性Table 3. Correlation between combinations of Rrs spectral features and turbidity波段组合 相关系数r 波段组合 相关系数r B2 0.49** B3 0.50** B4 0.71** B5 0.65** B4/B2 0.78** B4/B3 0.88** B4/B5 −0.23* (B4-B2)/(B4+B2) 0.76** (B4-B3)/(B4+B3) 0.87** (B4-B5)/(B4+B5) −0.38** 注:*表示相关性在0.05水平上显著;**表示相关性在0.01水平上显著。 利用三类方法 (第2.1至2.3节所述) 构建浊度反演模型。由于实测数据量有限,在构建模型时使用留一交叉验证[33] (Leave One Out Cross Validation,LOOCV) 对模型进行评估,此方法适用于样本量较少的数据集,在完成交叉验证后,将所有数据用于模型构建。表4列出了三类浊度反演模型的交叉验证结果。基于B4/B3的XGBoost浊度反演模型精度最优,R2为0.83,RMSE为4.58 NTU;基于B4/B3波段组合的二次多项式、指数、幂函数回归模型的R2均为0.78,RMSE为5.25~5.26 NTU;基于QAA的半经验模型R2为0.54,RMSE为7.60 NTU,基于SESB的半经验模型R2为0.39,RMSE为8.72 NTU;经验模型和半经验模型效果均低于XGBoost机器学习模型精度,说明XGBoost模型对于处理小样本量数据具有一定优势。
表 4 浊度反演模型参数化及比较Table 4. Parameterization and comparison of turbidity inversion models序号 模型 表达式 留一交叉验证 R2 RMSE (NTU) MAPE (%) 1 二次多项式 y=136.38x12−97.36x1+19.55 0.78 5.25 31.43 2 指数函数 y=5e2.72x1−15.16 0.78 5.25 30.35 3 幂函数 y=62.7x12.99−3.28 0.78 5.26 30.93 4 SESB-based y=117.14ρw(λ)/(1−ρw(λ)/0.1686)+9.63 0.39 8.72 57.91 5 QAA-based y=74.14x0.962 0.54 7.60 48.83 6 XGBoost y=fXGBoost(x1) 0.83 4.58 23.79 注:x1表示OLI传感器B4/B3,x2表示bbp(655),m−1,y表示实测浊度,NTU;fXGBoost表示XGBoost模型函数。 3.3 基于卫星数据反演的浊度真实性检验与评估
获取采样点同步卫星数据遥感反射率时,采样时间与卫星过境时间相差1.5 h以内,以采样点所在像元为中心使用3×3窗口进行卫星遥感反射率平均。图5显示OLI传感器实测等效遥感反射率与Acolite大气校正的遥感反射率相关系数达0.94 (p<0.01) 。
将浊度反演模型应用到卫星数据时 (图6) ,浊度实测值和预测值大部分处于1∶1线附近,浊度大于30 NTU的点预测偏差较大。基于XGBoost的浊度反演模型效果最好,R2为0.68,RMSE为4.78 NTU;其次是二次多项式、指数、幂函数经验模型,R2为0.5~0.51、RMSE为5.93~6.03 NTU;半经验模型效果相对较差,基于SESB的半经验模型R2为0.13,RMSE为7.91 NTU,基于QAA的半经验模型R2为0.44,RMSE为6.37 NTU。验证结果表明XGBoost机器学习方法能够一定程度上提高模型精度。
3.4 近40年浊度长时序变化
基于XGBoost模型,利用1984—2022年Landsat TM/ETM+/OLI卫星数据反演研究区浊度,分析浊度长期时空动态变化,结合自然因素和人类活动分析浊度变化的驱动因素。
1) 浊度的年际时空变化。研究区浊度的长时序时空变化分析以3年为周期求平均值[16],结果见图7。1993—1995年、2014—2019年汾湖-太浦河航道浊度较高,可能与1991年底开启的太浦河疏浚工程和2014年底动工的金泽水库开发工程有关。1996年汾湖一分为二,内汾湖浊度低于外汾湖。2005年淀山湖北部渔场开发,该区域在2005‒2007年浊度显著上升。图8显示了研究区近40年浊度整体变化趋势,研究区河流航道、淀山湖北部非渔场区域浊度升高,分别上升了10%和12%,可能与水上货运量增多和区域建设有关。元荡湖、大莲湖浊度下降,分别下降了19%和27%,可能与河湖湿地生态保护修复有关。
定量分析4个目标区域 (图1) 近40年浊度变化,结果如图9所示,目标区域近40年浊度在15~40 NTU之间,2017年以前,淀山湖入湖口和出湖口浊度差异较小,2017年以后,入湖口浊度大于出湖口,浊度平均相差10 NTU,太浦河上下游浊度差值保持在0~4 NTU之间,浊度差异较小。土地利用分类结果显示,太浦河沿岸建设用地面积近40年增长了1.5倍,太浦河上游浊度和建设用地面积相关系数为0.71 (p<0.01) (图10) ,说明建设用地的增加在一定程度上会影响研究区浊度变化。
2) 浊度的季节性变化。研究浊度的季节性变化时将近40年浊度反演结果按季节求平均值,如图11所示。研究区近40年浊度季节性变化显著,秋冬季平均浊度为27 NTU,春夏季平均浊度为21 NTU,秋冬季平均浊度比春夏季高6 NTU。白蚬湖-淀山湖航道和汾湖-太浦河航道冬季浊度明显高于其他季节。
降水和风力是调节水体浊度的重要因素[22, 34],1984—2022年月平均浊度和降水量、风速之间的关系如图12所示。近40年研究区1~3月、9~12月月平均浊度较高 (>25 NTU) ,而4~8月浊度较低,月平均浊度秋冬季高于春夏季,这与HOU等[5]的研究结果一致。近40年月平均降水量在0~10 mm之间,6月降水量最高为9 mm,浊度与降水量整体呈负相关关系,相关系数为−0.61 (p<0.05) 。1984‒2022年月平均风速在1~2 m·s−1之间,7月风速最大为1.8 m·s−1,浊度与风速之间无显著相关性。
4. 结论
1) 与经验、半经验模型相比,XGBoost在模型构建和真实性检验时具有较高的精度 (模型构建时R2为0.83,RMSE为4.58 NTU;真实性检验时R2为0.68,RMSE为4.78 NTU) ,适用于浊度反演研究。
2) 近40年研究区浊度时空变化明显。人类活动较为频繁的河流航道和淀山湖北部非渔场区域浊度上升,而位于湿地生态保护修复区的元荡湖、大莲湖浊度下降,建设用地面积增加一定程度上使得研究区浊度上升。
3) 近40年研究区浊度季节性变化明显。秋冬季浊度高于春夏季,月平均浊度与月平均降水量相关性较为明显,相关系数为-0.61 (p<0.05) ,而与月平均风速无明显相关性。
-
表 1 采样位置、时间和数量
Table 1. Sampling location, time and number of samples
编号 位置 时间 采样数量 有效数据量 1 太湖西山岛以北 2022-10-24 35 6 2 元荡湖 2022-10-25 35 29 3 太浦河、汾湖、三白荡 2022-11-23 18 15 4 淀山湖南部 2022-12-13 20 15 5 淀山湖、元荡湖 2023-03-26 18 16 表 2 基于QAA计算OLI的颗粒物后向散射系数bbp(655)
Table 2. Calculation of bbp at 655 nm for OLI based on QAA
步骤 计算 1 rrs(λ)=Rrs(λ)/(0.52+1.7Rrs(λ)) 2 μ(λ)=−g0+√(g0)2+4g1×rrs(λ)2g1 g0 g1 如果Rrs(655)<0.0015 sr−1 否则655 nm = λ0 3 χ=log(rrs(443)+rrs(483)rrs(561)+5rrs(655)/rrs(483)×rrs(655)) a(λ0)=a(561)=aw(561)+10h0+h1χ+h2χ2 h0=−1.146 h1=−1.366 h2=−0.469 a(λ0)=a(655)=aw(655)+0.39(Rrs(655)Rrs(443)+Rrs(483))1.14 4 bbp(λ0)=bbp(561)=μ(561)×a(561)1−μ(561)−bbw(561) bbp(λ0)=bbp(655)=μ(655)×a(655)1−μ(655)−bbw(655) 5 η=2.0(1−1.2exp(−0.9rrs(443)/rrs(561))) 6 bbp(λ)=bbp(λ0)(λ0/λ)η 注:表中a和aw分别为总吸收系数和纯海水吸收系数,m−1;bbw和bbp分别为纯海水和悬浮颗粒的后向散射系数,m−1。rrs(λ)为水表面以下遥感反射率,sr−1,Rrs(λ)是水面以上遥感反射率,sr−1。 表 3 遥感反射率光谱特征组合与浊度的相关性
Table 3. Correlation between combinations of Rrs spectral features and turbidity
波段组合 相关系数r 波段组合 相关系数r B2 0.49** B3 0.50** B4 0.71** B5 0.65** B4/B2 0.78** B4/B3 0.88** B4/B5 −0.23* (B4-B2)/(B4+B2) 0.76** (B4-B3)/(B4+B3) 0.87** (B4-B5)/(B4+B5) −0.38** 注:*表示相关性在0.05水平上显著;**表示相关性在0.01水平上显著。 表 4 浊度反演模型参数化及比较
Table 4. Parameterization and comparison of turbidity inversion models
序号 模型 表达式 留一交叉验证 R2 RMSE (NTU) MAPE (%) 1 二次多项式 y=136.38x12−97.36x1+19.55 0.78 5.25 31.43 2 指数函数 y=5e2.72x1−15.16 0.78 5.25 30.35 3 幂函数 y=62.7x12.99−3.28 0.78 5.26 30.93 4 SESB-based y=117.14ρw(λ)/(1−ρw(λ)/0.1686)+9.63 0.39 8.72 57.91 5 QAA-based y=74.14x0.962 0.54 7.60 48.83 6 XGBoost y=fXGBoost(x1) 0.83 4.58 23.79 注:x1表示OLI传感器B4/B3,x2表示bbp(655),m−1,y表示实测浊度,NTU;fXGBoost表示XGBoost模型函数。 -
[1] PETUS C, CHUST G, GOHIN F, et al. Estimating turbidity and total suspended matter in the Adour River plume (South Bay of Biscay) using MODIS 250-m imagery[J]. Continental Shelf Research, 2010, 30(5): 379-392. doi: 10.1016/j.csr.2009.12.007 [2] NECHAD B, RUDDICK K G, PARK Y. Calibration and validation of a generic multisensor algorithm for mapping of total suspended matter in turbid waters[J]. Remote Sensing of Environment, 2010, 114(4): 854-866. doi: 10.1016/j.rse.2009.11.022 [3] DING W H, ZHAO J X, QIN B Q, et al. Exploring and quantifying the relationship between instantaneous wind speed and turbidity in a large shallow lake: case study of Lake Taihu in China[J]. Environmental Science and Pollution Research, 2021, 28(13): 16616-16632. doi: 10.1007/s11356-020-11544-y [4] LIN X N, WU M, SHAO X X, et al. Water turbidity dynamics using random forest in the Yangtze River Delta Region, China[J]. Science of the Total Environment, 2023, 903: 166511. doi: 10.1016/j.scitotenv.2023.166511 [5] HOU X J, FENG L, DUAN H T, et al. Fifteen-year monitoring of the turbidity dynamics in large lakes and reservoirs in the middle and lower basin of the Yangtze River, China[J]. Remote Sensing of Environment, 2017, 190: 107-121. doi: 10.1016/j.rse.2016.12.006 [6] YIN Z Y, LI J S, LIU Y, et al. Water clarity changes in Lake Taihu over 36 years based on Landsat TM and OLI observations[J]. International Journal of Applied Earth Observation and Geoinformation, 2021, 102: 102457. doi: 10.1016/j.jag.2021.102457 [7] DOXARAN D, FROIDEFOND J, CASTAING P, et al. Dynamics of the turbidity maximum zone in a macrotidal estuary (the Gironde, France): Observations from field and MODIS satellite data[J]. Estuarine, Coastal and Shelf Science, 2009, 81(3): 321-332. doi: 10.1016/j.ecss.2008.11.013 [8] DOGLIOTTI A I, RUDDICK K G, NECHAD B, et al. A single algorithm to retrieve turbidity from remotely-sensed data in all coastal and estuarine waters[J]. Remote Sensing of Environment, 2015, 156: 157-168. doi: 10.1016/j.rse.2014.09.020 [9] MA Y, SONG K S, WEN Z D, et al. Remote sensing of turbidity for lakes in northeast China using Sentinel-2 images with machine learning algorithms[J]. IEEE Journal of Selected Topics in Applied Earth Observations and Remote Sensing, 2021, 14: 9132-9146. doi: 10.1109/JSTARS.2021.3109292 [10] VANHELLEMONT Q, RUDDICK K. Acolite for Sentinel-2: Aquatic applications of MSI imagery[C]// Proceedings of the 2016 ESA Living Planet Symposium. Prague: 2016: 9-13. [11] VANHELLEMONT Q. Sensitivity analysis of the dark spectrum fitting atmospheric correction for metre- and decametre-scale satellite imagery using autonomous hyperspectral radiometry[J]. Optics Express, 2020, 28(20): 29948. doi: 10.1364/OE.397456 [12] VANHELLEMONT Q. Adaptation of the dark spectrum fitting atmospheric correction for aquatic applications of the Landsat and Sentinel-2 archives[J]. Remote Sensing of Environment, 2019, 225: 175-192. doi: 10.1016/j.rse.2019.03.010 [13] VANHELLEMONT Q, RUDDICK K. Atmospheric correction of metre-scale optical satellite data for inland and coastal water applications[J]. Remote Sensing of Environment, 2018, 216: 586-597. doi: 10.1016/j.rse.2018.07.015 [14] TANG R G, SHEN F, PAN Y Q, et al. Multi-source high-resolution satellite products in Yangtze Estuary: cross-comparisons and impacts of signal-to-noise ratio and spatial resolution[J]. Optics Express, 2019, 27(5): 6426. doi: 10.1364/OE.27.006426 [15] LI P, KE Y H, BAI J H, et al. Spatiotemporal dynamics of suspended particulate matter in the Yellow River Estuary, China during the past two decades based on time-series Landsat and Sentinel-2 data[J]. Marine Pollution Bulletin, 2019, 149: 110518. doi: 10.1016/j.marpolbul.2019.110518 [16] LUO W, SHEN F, HE Q, et al. Changes in suspended sediments in the Yangtze River Estuary from 1984 to 2020: Responses to basin and estuarine engineering constructions[J]. Science of the Total Environment, 2022, 805: 150381. doi: 10.1016/j.scitotenv.2021.150381 [17] VANHELLEMONT Q. Daily metre-scale mapping of water turbidity using CubeSat imagery[J]. Optics Express, 2019, 27(20): A1372-A1399. doi: 10.1364/OE.27.0A1372 [18] 唐军武, 田国良, 汪小勇, 等. 水体光谱测量与分析Ⅰ: 水面以上测量法[J]. 遥感学报, 2004(1): 37-44. doi: 10.11834/jrs.20040106 [19] 国家环境保护总局. 地表水和污水监测技术规范: HJ/T 91-2002[S]. 北京: 中国环境出版社, 2002. [20] 国家环境保护局. 水质 悬浮物的测定 重量法: GB 11901-89[S]. 1990. [21] LUO W, LI R H, SHEN F, et al. HY-1C/D CZI image atmospheric correction and quantifying suspended particulate matter[J]. Remote Sensing, 2023, 15(2): 386. doi: 10.3390/rs15020386 [22] SHI K, ZHANG Y L, ZHU G W, et al. Long-term remote monitoring of total suspended matter concentration in Lake Taihu using 250 m MODIS-Aqua data[J]. Remote Sensing of Environment, 2015, 164: 43. doi: 10.1016/j.rse.2015.02.029 [23] ALLAM M, YAWAR ALI KHAN M, MENG Q. Retrieval of turbidity on a spatio-temporal scale using Landsat 8 SR: A case study of the Ramganga River in the Ganges Basin, India[J]. Applied Sciences, 2020, 10(11): 3702. doi: 10.3390/app10113702 [24] KRATZER S, KYRYLIUK D, EDMAN M, et al. Synergy of satellite, in situ and modelled data for addressing the scarcity of water quality information for eutrophication assessment and monitoring of Swedish Coastal Waters[J]. Remote Sensing, 2019, 11(17): 2051. doi: 10.3390/rs11172051 [25] LEE Z P, CARDER K L, ARNONE R A. Deriving inherent optical properties from water color: a multiband quasi-analytical algorithm for optically deep waters[J]. Applied Optics, 2002, 41(27): 5755-5772. doi: 10.1364/AO.41.005755 [26] BALASUBRAMANIAN S V, PAHLEVAN N, SMITH B, et al. Robust algorithm for estimating total suspended solids (TSS) in inland and nearshore coastal waters[J]. Remote Sensing of Environment, 2020, 246: 111768. doi: 10.1016/j.rse.2020.111768 [27] LIU H Z, LI Q Q, BAI Y, et al. Improving satellite retrieval of oceanic particulate organic carbon concentrations using machine learning methods[J]. Remote Sensing of Environment, 2021, 256: 112316. doi: 10.1016/j.rse.2021.112316 [28] GHATKAR J G, SINGH R K, SHANMUGAM P. Classification of algal bloom species from remote sensing data using an extreme gradient boosted decision tree model[J]. International Journal of Remote Sensing, 2019, 40(24): 9412-9438. doi: 10.1080/01431161.2019.1633696 [29] CAO Z G, MA R H, DUAN H T, et al. A machine learning approach to estimate chlorophyll-a from Landsat-8 measurements in inland lakes[J]. Remote Sensing of Environment, 2020, 248: 111974. doi: 10.1016/j.rse.2020.111974 [30] CHEN T Q, GUESTRIN C. XGBoost: a scalable tree boosting system[C]// Proceedings of the 22nd ACM SIGKDD International Conference on Knowledge Discovery and Data Mining. New York: Association for Computing Machinery, 2016: 785-794. [31] NECHAD B, RUDDICK K G, NEUKERMANS G. Calibration and validation of a generic multisensor algorithm for mapping of turbidity in coastal waters[C]// Remote Sensing of the Ocean, Sea Ice, and Large Water Regions 2009. SPIE, 2009: 7473: 74730H. [32] CASTAGNA A, AMADEI MARTÍNEZ L, BOGORAD M, et al. Optical and biogeochemical properties of diverse Belgian inland and coastal waters[J]. Earth System Science Data, 2022, 14(6): 2697-2719. doi: 10.5194/essd-14-2697-2022 [33] WONG T T. Performance evaluation of classification algorithms by k-fold and leave-one-out cross validation[J]. Pattern Recognition, 2015, 48(9): 2839-2846. doi: 10.1016/j.patcog.2015.03.009 [34] ZHENG Z B, LI Y M, GUO Y L, et al. Landsat-based long-term monitoring of total suspended matter concentration pattern change in the wet season for Dongting Lake, China[J]. Remote Sensing, 2015, 7(10): 13975-13999. doi: 10.3390/rs71013975 -


 下载:
下载:


