-
河流自净是一个涉及物理、化学和生物的复杂过程,是河流在一定空间内恢复其洁净状态的现象[1-2]。河流自净能力的恢复是城市生态环境建设和景观保护的重要环节,而目前城市内河流普遍采用“三面光”的梯形硬质化渠道,河水流速快,沉降性能低,改变了原有自然生态本底和水文特征,削弱了河流的自净能力。目前,河流只监测基本的水文参数和水质参数,同时,监测河流健康状况的方法对监测员的技术要求高且不能做到在线实时监测。因此,迫切需要一种在线监测河流水质参数和自净能力的方法。
荧光和紫外光谱技术因其具有灵敏度高、用量少、测量简单、不消耗化学试剂等优点[3],近年来,被广泛应用于河流、湖泊、海洋等自然水体中污染物的监测[4-5]以及污水处理厂的过程控制[6-7]、工业废水中特定污染物的鉴别[8-9]。三维激发发射矩阵(3D-EEM)光谱,被称为“荧光指纹”,被广泛应用于检测废水、表征河流中溶解性有机物(DOM)[10]。紫外可见光谱分析中特定波长254 nm处的吸光度值(UV254)可作为总有机碳(TOC)和溶解性有机碳(DOC)的替代参数[11-12]。河流净化过程包括稀释、沉淀、曝气等多种化学与生物机制,可以采用数学模型进行评价[13],KARRASCH等[14]从浮游微生物的胞外酶角度分析得出,工业废水使微生物耐受性增强,降解能力提高,赵长森等[15]采用生物学指数与水生物指示环境结合的方法评价水样污染程度、生态系统稳定性与河流及水库的健康程度。
河流水质与自净能力的传统测定方法及参数选取较为复杂,而从河流微生物的生理状态的角度分析河流的自净能力鲜有研究。本研究将人工净化与河流自净功能的协同作用发挥出来,以渭河流域西安段的河流及污水处理厂为考察对象,采用三维荧光光谱、紫外光谱联用呼吸图谱的方法,考察了不同性质的河流及污水处理厂各处理单元中微生物与有机物之间的作用关系,探讨了光谱法与呼吸图谱法联用表征河流状态及自净能力的可行性,以期得到河流水质和健康状况的综合评判方法。
全文HTML
-
2018年4—6月,对陕西省西安市境内的河流进行采样,包括皂河(A1~A6)、太平河(A7)、灞河(A8)3条纳污河,泾河(N1)、渭河(N2~N4)2条天然水体。为了对比自然净化和人工净化的异同,按照工艺处理单元顺序,对污水处理厂WWTP1分别采样,W1~W7分别为进水(格栅后端)、曝气沉砂池、氧化沟泥水混合物、氧化沟沉淀30 min后的上清液、氧化沟沉淀2 h后的上清液终沉池出水和最终排水。其中,通过收集氧化沟不同沉淀时间的上清液,可模拟得到终沉池沉淀过程中的样品。
在渭河的众多支流中,皂河、太平河和灞河属于“三面光”设计类型的渠道式城市纳污河,其中,皂河[16]具有最大的泄洪和纳污能力,全长35.8 km,集水面积283 km2,接纳西安市城区60%的生活污水、工业废水及3个污水处理厂的出水。太平河属于皂河的支流,接纳西安市西部的污废水。灞河[17]接纳西安市东部的污废水,在流入渭河前设有人工湿地。泾河是渭河最大的支流,接纳陕西北部的污废水。
-
采用有机玻璃采样器于水下0.5 m处收集得到样品,将水引到无菌聚乙烯瓶中,然后通过冰袋运输至实验室,放入冰箱4 °C冷藏保存,分析前,将水样自然升温至25 °C,将收集的样品混合均匀,量取300 mL进行呼吸图谱的测定,另外100 mL水样通过0.45 µm滤膜过滤,以除去大尺寸的悬浮固体,用于光谱测定。所有样品的检测分析均在采样结束后2~3 d内完成。
-
采用日立F-7000型荧光分光光度计进行三维荧光光谱检测。检测条件为:采用氙弧灯为激发光源,激发波长Ex=200~400 nm,发射波长Em=200~600 nm,狭缝宽度与扫描间隔均为5 nm,扫描速度为2 000 nm·min−1,响应时间为0.5 s,灵敏度为中等,光倍增管电压为700 V,采用超纯水(18.3 Ω)作为空白水样,以消除水的拉曼散射。采用752N紫外分光度计于波长254 nm处测量UV254。
呼吸图谱采用序批式呼吸计量法[18],于西安绿标水环境公司提供的BM300分析平台进行测定,分别获得现场呼吸速率OURS、内源呼吸速率OURe和总呼吸速率OURT。
1.1. 实验原料
1.2. 样品预处理
1.3. 实验方法
-
根据污染物负荷及断面功能属性将全部采样断面分为3类:纳污河(A1~A8);自然水体(N1~N4);污水处理厂(W1~W7)。
代表性断面的三维荧光图谱见图1。根据CHEN等[19]的三维荧光矩阵图五区划分法,识别出上述3类断面的5个特征峰(图1(b)),分别为类色氨酸T峰(Ex/Em=275 nm/340 nm)、类酪氨酸S峰(Ex/Em=225 nm/340 nm)、腐殖质C峰(Ex/Em=(310~320) nm /(380~410) nm)、富里酸A峰(Ex/Em=(240~260) nm/(380~400) nm),3类水样表现出峰位置及荧光强度的差异。纳污河自上游至下游各峰的最大荧光强度呈下降趋势,皂河源头及上游、污水厂进水有机物含量极高,且类蛋白峰在水样中占优势,类腐殖酸荧光强度相对较低,这是由于这些断面是河流接纳污水的源头,有机污染程度高,微生物含量高;而皂河下游、渭河、污水厂二沉池及出水中类腐殖酸占优势,这是因为这些断面经过污水厂的强化生物作用及河流自净作用后,有机物含量小,微生物繁殖速率慢,这与HENDERSON等[20]的描述一致,T峰反映的是不稳定易降解有机物,在废水中占主导地位,与废水微生物活性相关,与BOD之间的相关性较强,腐殖质C峰、富里酸A峰为难降解有机物,在天然水中占优势。
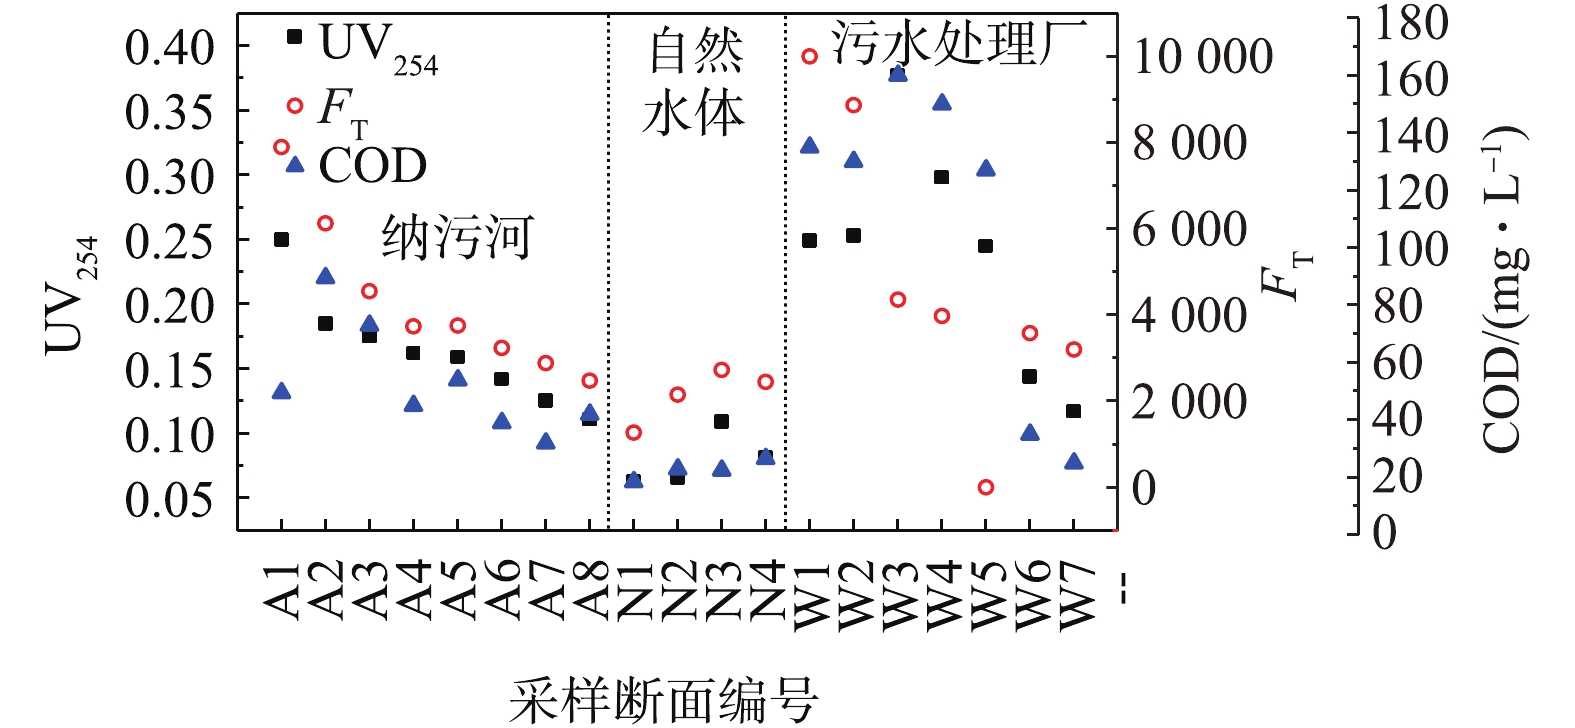
如图2所示,以传统水质参数COD值作为参照,可以看到UV254,FT与COD变化趋势基本一致,其中FT代表T峰的最大荧光强度。纳污河自上游至下游污染程度逐渐降低,自然水体污染程度低且稳定,污水处理厂水样的COD和UV254值从进水至出水在氧化沟工艺阶段出现极大值,而FT在进水出现极大值,FT与BOD呈显著正相关性,这表示可生物降解的有机物,FT可用于监测污水处理厂工艺处理过程中有机物的去除效果。
如表1所示,FT和FC分别代表T峰和C峰的最大荧光强度,在皂河源头A1流入渭河N4的过程中,FT与FC逐渐减小,对应的污染物的去除率分别为69.0%、49.2%,而污水处理厂从进水W1至出水W7过程中,T峰与C峰对应的污染物去除率分别为68.0%、33.0%,河流与污水厂的T峰去除率基本相同,河流中微生物去除难降解有机物的能力高于污水处理厂,这说明河流中微生物群落与污水处理厂有所不同,且河流微生物更容易降解难降解有机物。
皂河源头A1的腐殖化指数HIXb[21]较小(表1),这说明DOM较不稳定,易于生物降解;河流断面A4~A8、N1、N3的HIXb要高于其他断面,同时这些断面的FT较小,其中A4、A5、A7、N3均为接纳污水处理厂排放水的河流断面,可见污水厂排放水中DOM腐殖化程度更高,DOM更稳定,易生物降解的物质较少,A6、A8、N1断面的水质较好,难降解物质占优势;而污水厂进入生化处理阶段后的断面A3~A7的HIXb高于河流,且没有明显的下降趋势,这说明污水厂的微生物对去除难降解物质的能力匮乏,从DOM的腐殖化程度的角度分析证实了上述结论。
本研究的全部断面的自生源指数BIX[22]为0.93~1.08,差异较小,DOM具有较强的自生源特征,是生物细菌活动产生的。
-
总呼吸速率OURT反映的是基质不受限制条件下微生物最大的呼吸速率,其值越高,说明微生物的降解有机物的潜能越高。微生物的现场呼吸速率OURS反映的是采样时水样中微生物的现场活性,OURs越高,说明微生物数量及活性较高。纳污河的OURs普遍比自然水体高(表1),说明纳污河中微生物数量大且活性较高,其接纳了大量人类活动产生的生活污水,含大量类蛋白、脂肪等有机物,致使微生物大量繁殖,而纳污河断面中A5和A7由于接纳了污水厂出水,有机物浓度被稀释,微生物现场活性较弱;污水厂的W3点为氧化沟泥水混合物,其OURS极高,这与污水厂生物处理阶段活性污泥含量高的结果一致,此阶段微生物大量繁殖,降解有机物的速率极高,与自然净化的慢速过程形成对比。
-
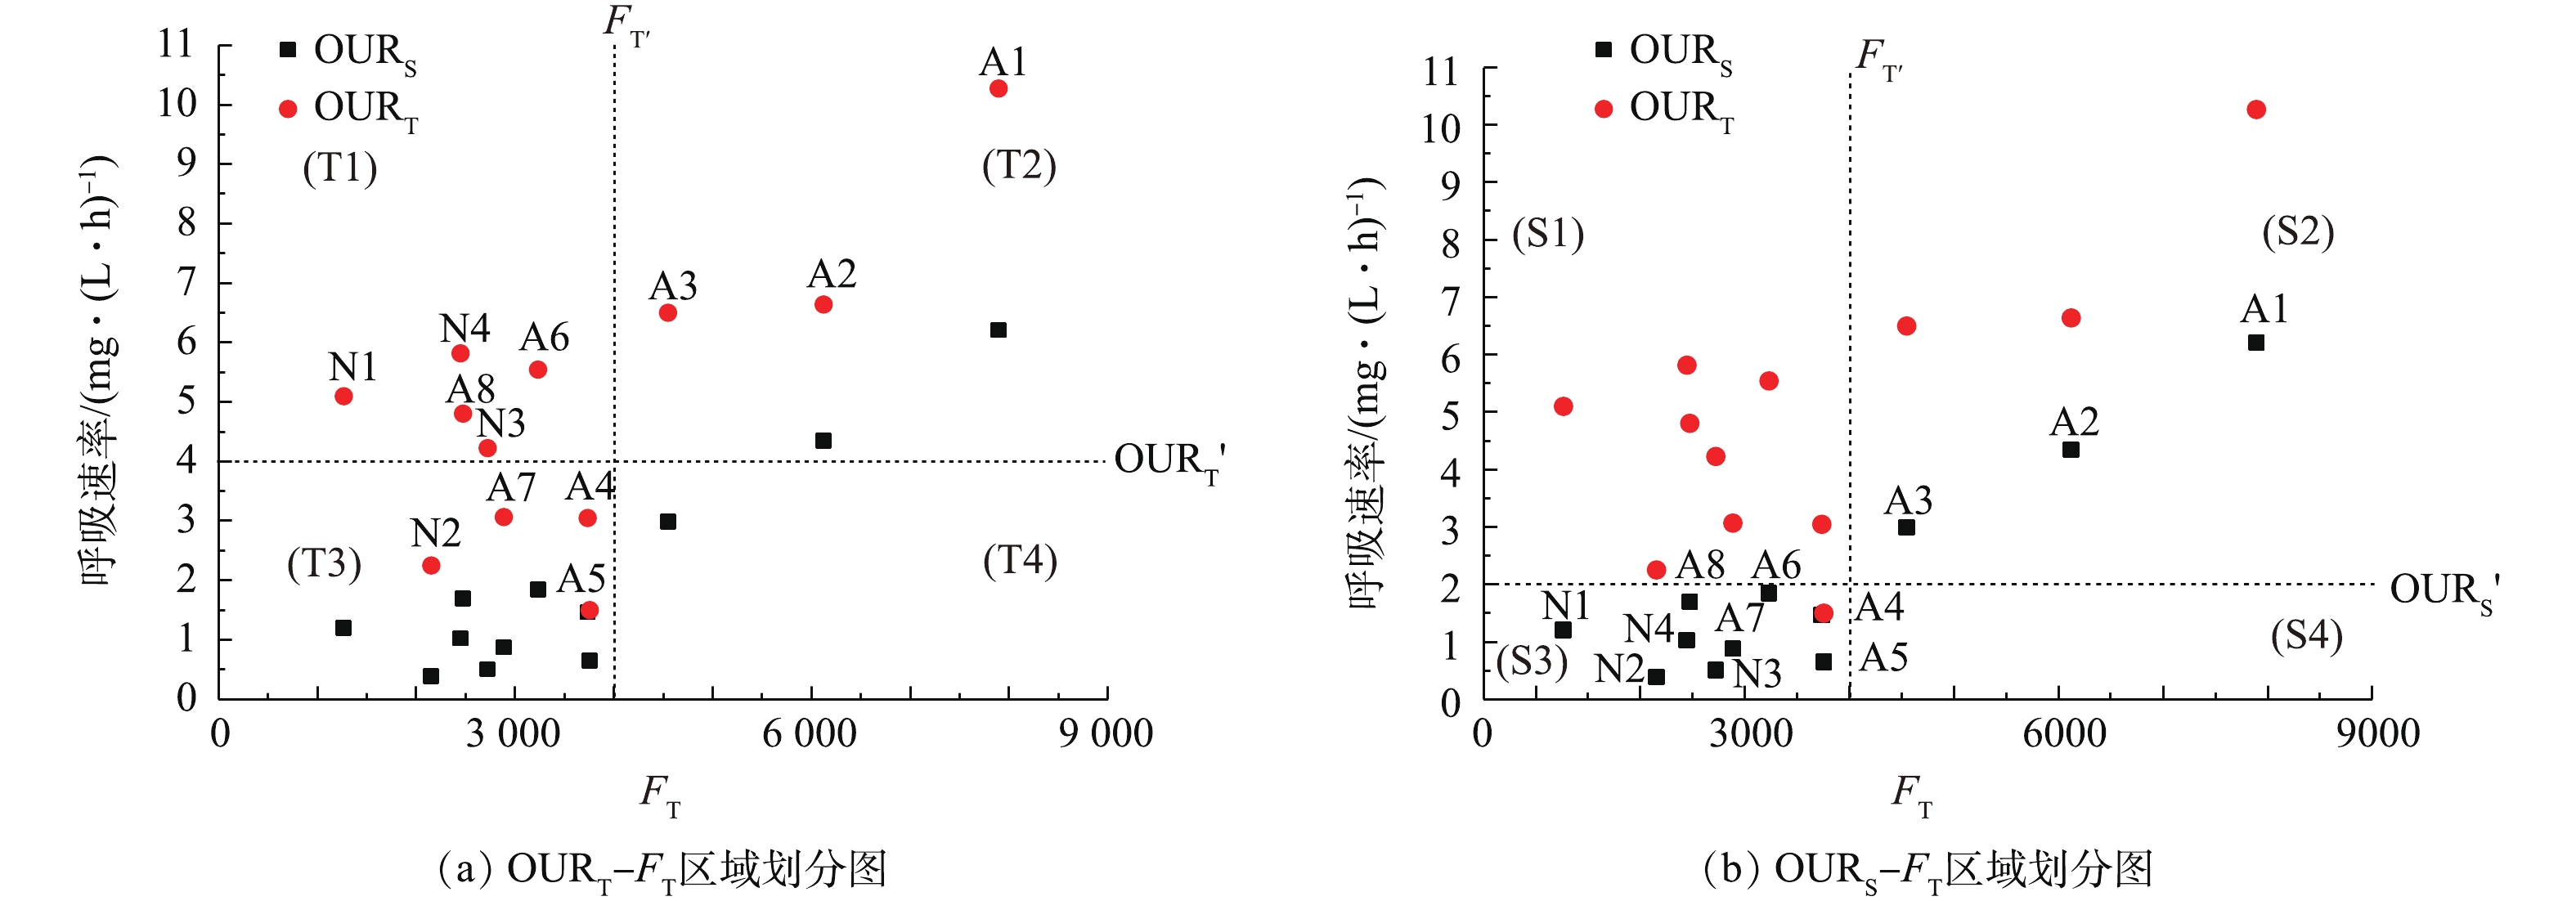
通过OUR=OURT′、FT= FT′,将OURT-FT(图3(a))平面划分为4个区域(T1~T4);通过OUR= OURS′、FT= FT′,将OURS-FT(图3(b))平面划分为4个区域(S1~S4)。其中,OURT′、OURS′、FT′的定量根据河流接纳的水样性质的不同而有所不同。
T1表示OURT> OURT′、FT<FT′,为超量潜在自净能力区域,包含断面A6、A8、N1、N2、N4,这说明断面污染程度较低,但微生物的潜在降解能力较高,自净能力较高,此时河流进入自净过程的后续阶段。同时,这种生物活性的改善可能归因于外部环境条件的改善,如更好的供氧,因为生物活性比需要降解的污染物更充分,这表明水生生态系统的健康。T2表示OURT> OURT′、FT>FT′,为受污染区域,包含断面A1~A3,这说明河流受到严重有机污染,虽然微生物活性极强且大量繁殖,但有机物处于超饱和状态,可能超过了微生物的降解能力与河流自净容量,一段时间后,会形成黑臭水样。T3表示OURT< OURT′、FT<FT′,为人工净化完成区域,包含断面A4、A5、A7、N3,这些断面接纳污水厂出水,污染物被稀释,虽然水样表观上恢复了原本干净的状态,但仍含有较多复杂不易降解的有机物,须汇入河流,经微生物长期降解才能恢复水样原本健康的状态。T4表示OURT< OURT′、FT>FT′,为无法判定区域,本研究无断面出现此情况,污染程度大而微生物呼吸速率小的情况出现的概率非常小,也不符合自净理论。
S1表示OURS> OURS′、FT<FT′,为无法判定区域,本研究中无断面出现在此区域,同时,有机物含量小而微生物现场耗氧速率较强的情况出现的概率非常小,也不符合自净理论;S2表示OURS> OURS′、FT>FT′,为受污染区域,包含断面A1~A3,与上述T2区域描述基本一致;S3表示OURS< OURS′、FT<FT′,为受基质限制的区域,包含除A1~A3以外的其他断面,说明微生物现场活性受基质限制而无法生存;S4表示OURS< OURS′、FT>FT′,为无法判定区域,说明有机物含量大而微生物现场耗氧速率较弱的情况出现的概率也非常小,同样不符合自净理论。
综上,结合2种不同的区域划分方法,可以判定河流的状态和自净能力:A1~A3为受污染断面,污染程度可能超过了自净容量;A4、A5、A7和N3为人工净化完成的断面,仍有大量难降解有机物须经过水样自净完成净化过程;A6、A8、N1、N2和N4为进行到水样自净过程的后续阶段的断面,生物活性受基质含量限制,但微生物具有超量潜在自净能力,可能归因于外部环境的改善,如溶解氧的升高或更适宜微生物生存的温度。
2.1. 3类水体的水质参数和光谱特征参数的空间分布特征
2.2. 3类水体呼吸图谱参数的空间分布特征
2.3. 呼吸图谱与光谱联用判定河流污染状态与自净能力
-
1) 3类水样(纳污河、自然水体与污水处理厂各处理单元)表现出不同的荧光强度与荧光特征值,纳污河及污水处理厂前处理单元普遍类蛋白最大荧光强度高于自然水体,自然水体及污水处理厂后处理单元的DOM的腐殖化程度高于纳污河,类蛋白最大荧光强度可用于区分水体类型及判定有机污染程度,腐殖化程度可用于判定DOM的难易降解程度。
2)类蛋白T峰(Ex/Em=275 nm/340 nm)的最大荧光强度FT可作为反映污水处理过程中有机污染程度及微生物量的指标,纳污河自上游至下游、污水厂自进水至出水的FT逐渐减小,河流微生物群落与污水处理厂的活性污泥有所不同,纳污河微生物去除难降解有机物(C峰)的能力高于活性污泥。
3) OURS通常用于表征微生物现场活性,OURT用于表征微生物降解有机物的潜能,自然水体的有机污染程度及微生物现场活性均较低,纳污河与污水处理厂生物处理单元的微生物现场活性与潜能颇高,微生物呼吸速率与水体有机污染程度密切相关。
4)采用呼吸图谱与紫外光谱、三维荧光光谱联用,以OURS-FT,OURT-FT这2种区域划分方式为依据,研究了河流微生物与有机污染之间的作用关系,建立了判定河流的污染状态和自净能力的定量指标,为城镇两极分化条件下的河流生态管理提供参考。


 下载:
下载:


