

基于土壤气挥发通量的污染场地三氯甲烷健康风险评估
Health Risk Assessment of Trichloromethane at Contaminated Sites Based on Soil Gas Volatilization Fluxes
-
摘要: 我国现行技术导则在评估VOCs呼吸暴露途径健康风险时推荐Johnson-Ettinger(J&E)模型,该模型虽然简单易用,但在实际应用中存在过于保守的问题,采用双元平衡模型(dual equilibrium desorption,DED)对J&E模型进行校正后可以在一定程度上克服该问题。为准确评估实际场地中VOCs呼吸暴露风险,探索JE-DED模型在预测实际场地中VOCs呼吸暴露途径健康风险的适用性,选取苏州某污染场地面积约314 m2的重污染区域开展三氯甲烷土壤气挥发通量研究进行精细化风险评估,并与基于土壤中三氯甲烷浓度采用J&E模型和JE-DED模型的计算结果进行比较。多手段风险评估结果显示,评价区域三氯甲烷呼吸暴露途径的人体致癌健康风险水平超过可接受水平1.00×10⁻⁶;就本场地而言,相对于基于土壤浓度风险评估,以基于实测土壤气挥发通量的风险评估结果来表征研究区域整体暴露风险水平更加稳定;研究区域土壤三氯甲烷浓度整体偏高,J&E和JE-DED模型计算的风险水平无明显差异;通过数据模拟发现,针对该场地,当三氯甲烷浓度<6 mg·kg-1时,能更好地发挥JE-DED模型的优势。该场地三氯甲烷健康风险评估结果表明,基于实测土壤气挥发通量能够一定程度上避免基于土壤浓度计算带来的偶然性结果;JE-DED模型在较低浓度时,才能发挥优势。Abstract: The Johnson-Ettinger (J&E) model is recommended by the current technical guidance of China to assess the health risks of VOCs' respiratory exposure. It is easy to use but too conservative for practical applications. The problem can be overcome to some extent by adopting the dual equilibrium desorption (DED) correction of J&E model. In order to accurately evaluate the risk posed by respiratory exposure of VOCs and test the applicability of the JE-DED model in predicting this risk in a real-world scenario, a detailed risk assessment was carried out in a polluted area of about 314 m2 in Suzhou, China. The results using the J&E model and the JE-DED model based on the concentration of trichloromethane in soil were compared. The results are as follows:(1) Multiple risk assessments showed that the human carcinogenic health risk level from chloroform respiratory exposure in this region was higher than the acceptable level of 1.00×10⁻⁶. (2) Compared with the risk assessment based on soil concentration, the risk assessment based on the measured soil air volatilization flux could more stably represent the overall exposure risk for the evaluation area. (3) No significant difference existed in the risk levels calculated by the J&E and the JE-DED models when based on soil trichloromethane concentrations. Data simulation results show that the advantages of JE-DED model are more pronounced when the concentration of trichloromethane is less than 6 mg·kg-1 for this site. The results suggest that measuring soil air volatilization flux can avoid inaccurate results based on soil concentration calculations to a certain extent, and that the JE-DED model is advantageous at lower contaminant concentration.
-
Key words:
- trichloromethane /
- contaminated site /
- risk assessment /
- volatile flux /
- J&E model /
- JE-DED model
-
己烯雌酚(DES)是一种典型的人工合成非甾体类雌激素, 是环境水体中常被检出的内分泌干扰物之一[1 − 2]. 由于对胎儿生殖器官的致畸作用和可能导致肿瘤[3],己烯雌酚已被禁止用于孕期妇女,但是在临床中仍是治疗雌激素分泌不足所导致的妇科疾病及乳腺癌的药物之一[4]. 随着生活及养殖废水的排放,己烯雌酚最终会进入环境水体,并可能污染饮用水水源. 例如,在我国某些饮用水水源或环境水体中,仍可以检出一定浓度(≤ 2.52 ng·L−1)的己烯雌酚[2,5]. 己烯雌酚常用的检测方法有气相色谱-质谱法、液相色谱-质谱法、酶联免疫吸附法(ELISA)等[6]. 但这些方法或需要利用价格高昂的仪器,对试验人员的专业技术手段要求较高,或耗时较长,无法用于对己烯雌酚的现场快速检测.
胶体金免疫层析检测试纸由于具有简单、快速、易于解读的优势而在临床检测[7]、动物疫病[8]、食品安全[9]、环境监测[10]等领域得到广泛应用,是一种适用于现场快速检测的技术. 该技术的原理是基于目标物与由胶体金标记的抗体或抗原相互作用,在固定有用于捕获抗体或抗原的反应区和控制区,通过目视或使用读取装置读取测试结果[11]. 利用胶体金免疫层析试纸获取目标物含量信息的方式主要有以下三种. 最常见的一种方式是根据检测线(T线)出现与否判断目标物是否超过一定浓度. 在环境检测或食品安全检测中常用来判定目标物含量是否超标,是一种定性检测方式;第二种类型,检测线上包被的反应物设计成只能结合一定量的分析物,过量的分析物会与下一条检测线结合,产生一个条带梯度[12];第三种是用特定仪器读取检测卡显色情况,并将显色情况转换为数字信号达到定量的目的[13].
研究发现[14],利用传统方法制备的己烯雌酚胶体金免疫层析检测卡受温度、湿度影响很大,不适于野外现场检测. 为克服这一问题,我们在金标垫上增加偶联IgY的胶体金做为第二金标物,在NC膜上包被3种不同浓度的羊抗IgY作为参考线,在检测反应中这3条参考线的颜色分别对应3个DES的浓度,通过检测线与3条参考线的颜色对比实现对样品中的DES残留所处浓度区间的确定. 这种体系使得检测线反应和参考线反应处于相同的反应条件,使其很大程度不受环境干扰,通过半定量参考线与检测线的结合,实现了不依赖检测仪器的己烯雌酚可视化检测. 本文研究并验证了基于半定量参考线方法对水中己烯雌酚残留进行现场检测的可行性.
1. 材料与方法(Materials and methods)
1.1 试剂与仪器
己烯雌酚单克隆抗体、DES-BSA购于广东优抗多生物技术有限公司,羊抗鼠抗体、牛血清白蛋白(BSA)购自杭州索莱尔博奥生物技术有限公司,鸡免疫球蛋白IgY、羊抗IgY购自洛阳佰奥通实验材料中心,己烯雌酚、Tween-20购自Merck公司(德国),氯金酸购自于国药集团化学试剂有限公司. 硝酸纤维素膜(VIVID170)购自美国PALL公司. 玻璃纤维膜、PVC底板、吸水纸购于上海金标生物科技有限公司. 己烯雌酚ELISA检测试剂盒购自北京普赞生物技术有限公司.
喷金划膜仪购自上海捷宁生物技术有限公司,可编程切条机(HGS201)购于杭州峰航科技有限公司.
1.2 免疫胶体金的制备
胶体金的制备参考Sun等报道的方法[15]. 主要步骤如下:将2 mL氯金酸溶液(1%,W/V)加入到100 mL超纯水中,加热使溶液沸腾. 然后,在不断搅拌下加入1.3 mL柠檬酸钠溶液(2%,W/V). 待溶液颜色变为酒红色后,继续保持沸腾10 min. 然后,停止搅拌及加热,待溶液冷却至室温后加入超纯水将溶液体积补足至100 mL. 4 ℃冰箱中储存待用. 制备的胶体金平均粒径为30 nm. 分别将DES单克隆抗体和IgY标记在胶体金上,方法简述如下:用0.1 mol·L−1的K2CO3将胶体金溶液调节至最适pH值,加入计算好的最适稳定量的蛋白质,轻摇混匀1 min,静置30 min. 用10% BSA溶液(pH7.2)封闭30 min后,将离心管于4 ℃、
12000 r·min−1离心30 min;弃去上清液. 用 1% BSA(pH7.2)溶液洗涤沉淀,于4 ℃、12000 r·min−1离心30 min;弃去上清液. 加入100 μL胶体金复溶液(10 mmol·L−1磷酸盐缓冲液、pH 7.2、含1% BSA、10%蔗糖、5%海藻糖、0.05%叠氮钠)复溶沉淀.1.3 最适DES-BSA包被浓度的优化
用喷金划膜仪以3 μL·cm−1的速度,将上一步制备的标记了DES单抗的胶体金结合物溶液喷到玻璃纤维素膜上,37 °C烘干24 h,制成DES金标结合物垫. 用喷金划膜仪,以0.8 μL·cm−1的速度,将一系列不同浓度的DES-BSA溶液(0.2、0.4、0.6、0.8 mg·mL−1)和羊抗鼠IgG溶液(0.5 mg·mL−1)划在NC膜上,37 °C烘干24 h;将玻璃纤维膜在样品垫处理液(20 mmol·L−1磷酸盐缓冲液,pH7.2,含1% Tween-20,1% BSA)中浸泡5s,取出后,37 °C烘干24 h,制成样品垫. 按照图1a所示组装己烯雌酚试纸条,分别将80 μL浓度为0、10、20、40 ng·mL−1 的DES溶液滴加到试纸条的样品垫上,反应5min后,目视观察,并利用ImageJ对试纸条的T线和C线灰度值进行分析. 以T线对不同浓度DES的显色区分度选择最适DES-BSA包被浓度.
 图 1 胶体金试纸条示意图Figure 1. Schematic diagram of colloidal gold test stripa 常规免疫层析试纸组成示意图;b 基于“动态比色卡”的免疫层析试纸组成示意图a. schematic diagram of the composition of conventional immunochromatographic test strip; b. schematic diagram of the composition of immunochromatography test strip based on the "dynamic colorimetric card".
1.4 羊抗IgY最适包被浓度的优化
用喷金划膜仪以3 μL·cm−1的速度,将上一步制备的标记了IgY的胶体金结合物溶液喷到玻璃纤维素膜上,37 °C烘干24 h,制成IgY金标结合物垫. 用喷金划膜仪,以0.8 μL·cm−1的速度,将优化浓度的DES-BSA溶液划到NC膜T线位置. 将不同浓度羊抗IgY溶液(0.1、0.2、0.3、0.4 mg·mL−1)划在NC膜C线位置,37 °C烘干24 h;然后按照样品垫、DES金标垫、IgY金标垫、NC膜、吸水纸的顺序组装检测试纸,考察试纸对浓度为0、5、10、20、40 ng·mL−1 DES溶液的响应,目视观察,分别考察在DES浓度为5、10、20 ng·mL−1时T线与C线显色相近的羊抗IgY包被浓度. 如图1b所示,将选出的3个浓度的羊抗IgY按浓度由低到高顺序,依次包被到NC膜上,制备图1b所示检测试纸,并用ImageJ分析试纸对不同上述浓度DES的显色情况,根据分析结果对参考线浓度进行微调,直到阴性条件下该区间中3条半定量参考线中最深显色不超过T线显色,并且3条半定量参考线由低到高分别与5、10、20 ng·mL−1时T线显色相近.
1.5 检测卡的组装
将样品垫、金标垫、硝酸纤维素膜和吸水纸依次贴在底板上,彼此间以搭接方式连接(如图1),用切条机切成4 mm宽试纸条,装入塑料卡壳,加干燥剂密封保存.
1.6 温度、湿度对检测结果的影响
为研究温度对试纸条检测结果的影响,在实验室用空调将实验室温度分别调节至16、25 °C,实验期间室内湿度为30%—35%. 在恒温恒湿箱中将温度调为35 °C、湿度35%. 将试纸放在上述环境中平衡30 min后,考察其对不同浓度DES的响应.
为研究湿度对试纸条检测结果的影响,分别将试纸条放在实验室内(温度25 °C、湿度30%—35%)以及恒温恒湿箱中(温度25 °C、湿度55%)平衡及反应,考察其对不同浓度DES的响应.
1.7 地表水中DES的检测及验证
在山东省王屋水库黄水河入库口、水库中心、大坝位置取3个水样,经0.45 μm滤膜过滤后,分别用本文制备的检测卡及市售的己烯雌酚酶联免疫试剂盒检测水样中己烯雌酚的含量. 在不含己烯雌酚的水样中添加5、10、20 ng·mL−1的己烯雌酚,分别用本文制备的检测卡及己烯雌酚ELISA试剂盒检测,比较二者的检测结果.
2. 结果与讨论 (Results and discussion)
2.1 DES单克隆抗体的标记浓度及DES-BSA包被浓度的优化
首先对DES单克隆抗体在胶体金上的标记浓度进行了优化. 由图2a可见,当DES单克隆抗体的标记浓度为5 μg·mL−1胶体金及以上时,向胶体金中加入饱和NaCl不会导致胶体金颜色的变化,提示5 μg·mL−1胶体金为DES抗体的稳定标记浓度. 为保证DES抗体对胶体金的充分结合,在此标记浓度基础上增加20%,即6 μg·mL−1胶体金作为DES单克隆抗体的标记浓度. 图2b是以不同浓度DES-BSA包被NC膜得到的检测试纸T线在不同浓度DES下的显色,可以看到,随DES-BSA浓度增加,T线显色呈加深的趋势. 由于DES-BSA浓度为0.6 mg·mL−1时对阴性样本显色较深(灰度值>200),且在40 ng·mL−1DES样本完全消线,所以将其作为最优DES-BSA包被浓度.
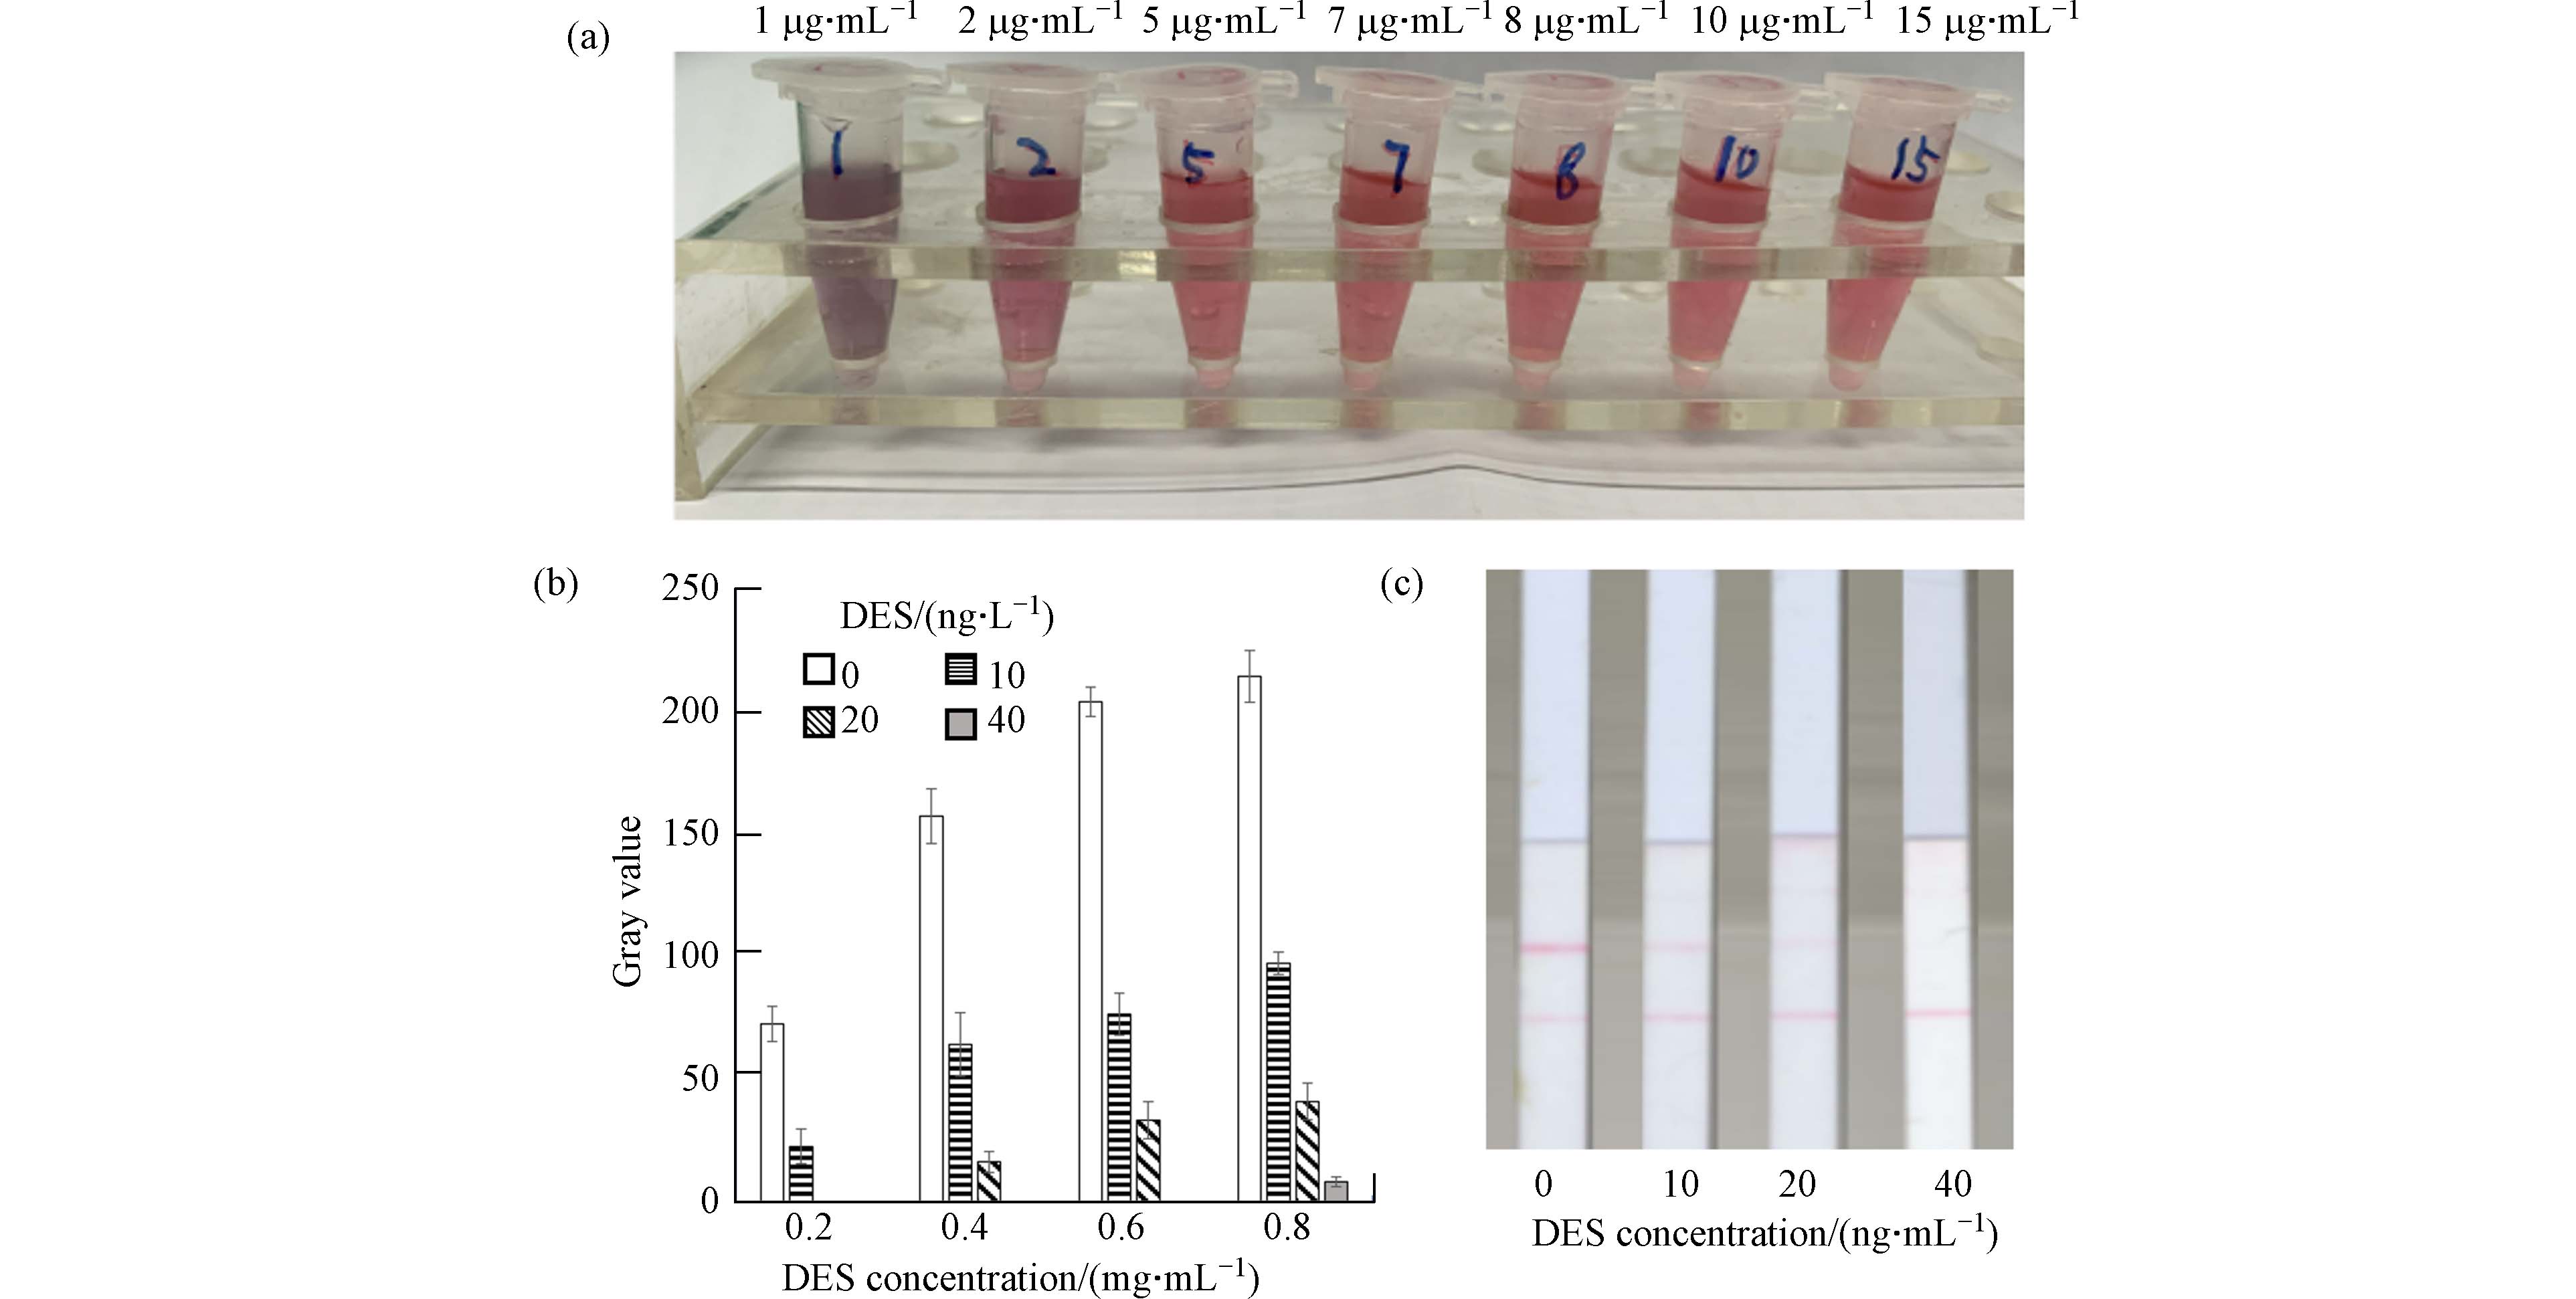 图 2 DES单克隆抗体的标记浓度及DES-BSA包被浓度的优化Figure 2. Optimization of DES monoclonal antibody labeling concentration and DES-BSA coating concentrationa.加入饱和NaCl后不同浓度DES单抗标记的胶体金颜色变化;b.检测试纸T线在不同浓度DES时的灰度值;c.检测试纸对不同浓度DES的显色效果a. The color changes of colloidal gold labeled with DES monoclonal antibodies at different concentrations after adding saturated NaCl; b. The gray values of the T-line of the test strip at different concentrations of DES; c. The images of the test paper on different concentrations of DES.
2.2 IgY标金浓度及羊抗IgY包被浓度的优化
首先用” 2.1”所述的方法优化出IgY的标金浓度为5 μg·mL−1胶体金. 然后,按照”1.4”所述方法,确定了3条定量参考线的羊抗IgY包被浓度在0.1、0.2、0.3 mg·mL−1附近,然后经进一步微调,最终确定3条定量参考线(C1、C2、C3)的羊抗IgY包被浓度依次为0.1、0.17、0.25 mg·mL−1.
在优化条件下制备的试纸条如图3a所示,目视观察可以看到,当样品中不含DES或DES含量低于5 ng·mL−1时,T线显色比三条定量参考线深,当DES浓度为5、10、20 ng·mL−1时,T线显色分别与C3、C2、C1相近,当样品中DES含量大于20 ng·mL−1时,T线显色比C1浅. 利用ImageJ软件对试纸进行分析,可以看到当DES浓度为5、10、20 ng·mL−1时,T线灰度值分别与C3、C2、C1的灰度值相近(图3b). 因此试纸条对DES残留的半定量检测区间为≤5、5—10、10—20、≥20 ng·mL−1.
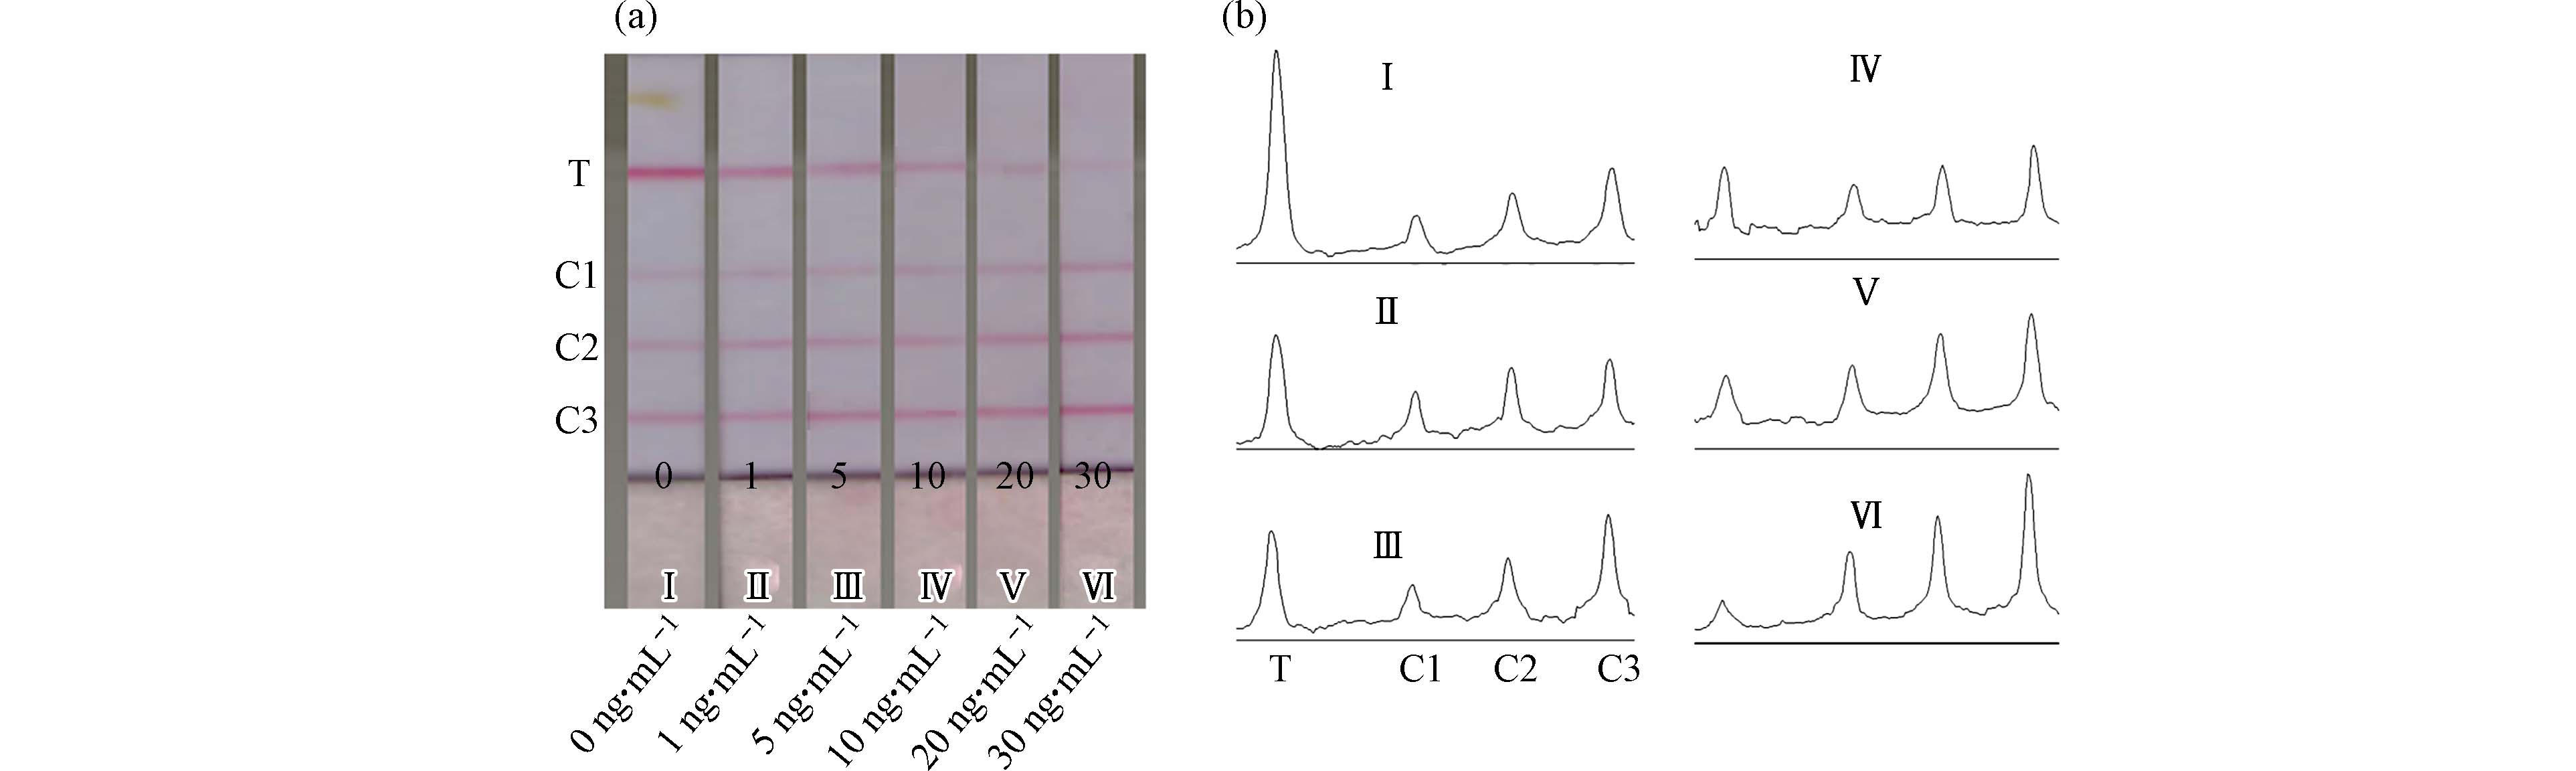 图 3 DES半定量检测试纸Figure 3. DES semi-quantitative detection test strip.a.不同DES浓度时试纸的显色. b.对各试纸条的ImageJ分析,峰高对应T线或C线的灰度值.a. The images of the test strip at different DES concentrations. b. Plotting of the gray value spectrum of the strip image by ImageJ, and the peak height corresponds to the gray value of the T line or C line.
2.3 温度与湿度对DES半定量试纸检测结果的影响
首先考察了16、25、35°C 3个温度对DES半定量试纸检测结果的影响,结果如图4所示. 由图4可见,随环境温度升高,试纸条的显色逐渐加深,尤其在16°C和25°C之间显色变化最为显著,这可能是温度影响了抗体与抗原的免疫反应速度所导致的.
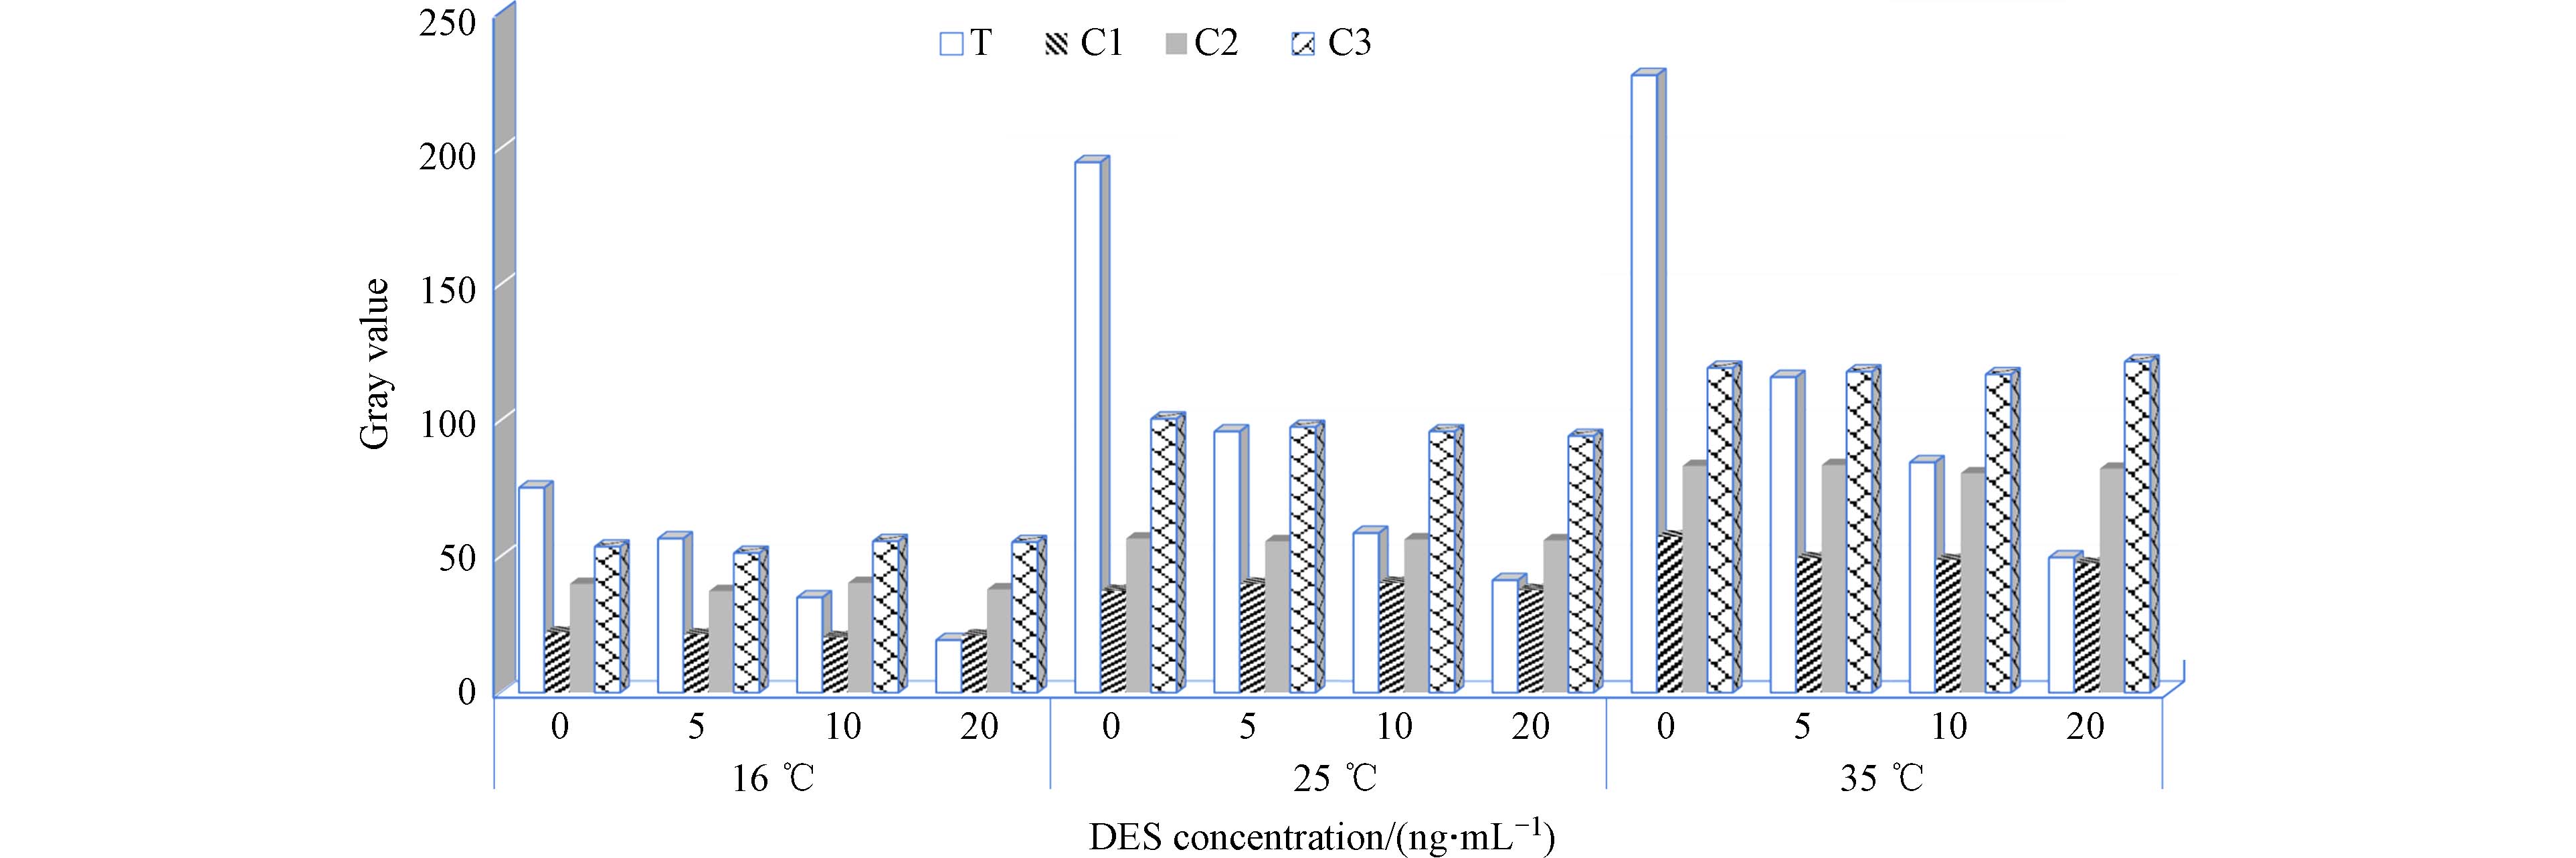 图 4 不同温度对DES检测试纸显色的影响Figure 4. The effect of temperature on the color development of DES test stripsT为检测线,C1-C3为3条参考线T is the detection line, and C1-C3 is the three reference lines
考察了35%和55%两个湿度条件对DES试纸检测的影响,实验温度为25°C. 结果显示,在高湿度条件下,DES的显色显著低于低湿度条件. 图4和图5的结果说明,如果采用固定色卡与T线显色做对比来进行半定量测定会产生很大的偏差. 温度、湿度会显著影响胶体金的释放速度及在NC膜上的扩散速度,并且温度还会影响抗体与抗原的分子热运动进而影响免疫反应速度,所以不同温湿度下,胶体金免疫层析试纸上T、C线的显色速度会受到较大影响. 而由于金标DES抗体和DES-BSA反应体系以及组成“动态色卡”体系的金标IgY与羊抗IgY反应体系是在同一条检测试纸上受到相同的温湿度的影响,因此,T线和参考线的显色速度变化趋势则是基本相同的. 本实验结果证明了在检测试纸上集成“动态色卡”这种设计的可行性,它有助于消除温湿度变化对于胶体金侧向流免疫层析试纸显色结果判定的不利影响,从而提高目视检测的准确度.
 图 5 不同湿度对DES试纸显色的影响Figure 5. The effect of humidity on the color development of DES test strip
2.4 地表水中DES的检测及验证
分别用本文制备的DES检测卡及市售的DES酶联免疫试剂盒(检测限为0.1 ng·mL−1)检测了山东省王屋水库采集的3个水样,均未检出己烯雌酚. 在水库中心水样中添加了己烯雌酚,使其终浓度分别为5、10、20 ng·mL−1,然后分别用本文制备的检测卡及己烯雌酚ELISA试剂盒对加标样品进行了检测,二者的检测结果如表1所示. 结果表明本研究所制备的DES检测卡对加标水样的检测结果与市售ELISA试剂盒的实测结果一致.
表 1 DES半定量检测试纸和ELISA检测试剂盒对实际样品的检测结果Table 1. The detection results of DES semi-quantitative test strip and ELISA kit on actual samples采样位置Sample collection site 加标浓度/ (ng·mL−1) Spiked concentration 试纸检测值/ (ng·mL−1)Results from test strip ELISA试剂盒检测值/ (ng·mL−1)Results from ELISA kit 黄水河入库口Reservoir mouth — ND* ND 水库中心Reservoir center — ND ND 5 ≤5 4.18 10 5-10 8.49 20 10-20 17.30 水库大坝Reservoir Dam — ND ND *ND., 未检出. ND., not detected. | Show Table DownLoad:
CSV
DownLoad:
CSV
3. 结论(Conclusion)
本研究通过将不同浓度的羊抗IgY包被在NC膜上,与金标IgY结合,在DES检测试纸上构建了一个独立于检测线免疫反应的“动态色卡”,由于受相同温湿度的影响,色卡的半定量参考线在不同温度和湿度下的显色与DES检测线基本一致,因此可以在不同温度和湿度的环境中实现对DES的半定量检测. 制备的试纸条对DES残留的半定量检测区间为≤5 ng·mL−1;5—10 ng·mL−1,10—20 ng·mL−1,≥20 ng·mL−1,对地表水样品中DES的目视半定量检测结果与ELISA试剂盒检测结果一致. 本研究克服了传统免疫层析试纸条的检测结果易受环境温湿度等因素影响的缺点,能够在野外环境中实现对己烯雌酚的现场检测. 同时,由于组成“动态色卡”的反应体系独立于DES的反应体系,本研究所提出的“动态色卡”设计思路可以应用于其它抗原的免疫层析试纸检测,在环境监测、体外诊断、食品安全等对现场快速检测有较大需求的领域有可观的应用前景.
-
周友亚, 姜林, 张超艳, 等. 我国污染场地风险评估发展历程概述[J]. 环境保护, 2019, 47(8):34-38 Zhou Y Y, Jiang L, Zhang C Y, et al. Development of risk assessment of contaminated sites in China[J]. Environmental Protection, 2019, 47(8):34-38(in Chinese)
Zhao X, Ma H, Lu J, et al. Characteristics and source apportionment of volatile organic compounds during the remediation of contaminated sites in Zhenjiang, China[J]. International Journal of Environmental Science and Technology, 2020:1-12 Liu G, Shi Y, Guo G L, et al. Soil pollution characteristics and systemic environmental risk assessment of a large-scale arsenic slag contaminated site[J]. Journal of Cleaner Production, 2020, 251:119721 Elsner M, Couloume G L, Mancini S, et al. Carbon isotope analysis to evaluate nanoscale Fe(O) treatment at a chlorohydrocarbon contaminated site[J]. Ground Water Monitoring & Remediation, 2010, 30(3):79-95 Fang C, Behr M, Xie F, et al. Mechanism of chloroform-induced renal toxicity:Non-involvement of hepatic cytochrome P450-dependent metabolism[J]. Toxicology and Applied Pharmacology, 2008, 227(1):48-55 Zhou Y, Wu H J, Zhang Y H, et al. Ionic mechanisms underlying cardiac toxicity of the organochloride solvent trichloromethane[J]. Toxicology, 2011, 290(2-3):295-304 Scheepers P T J, Graumans M H F, van Dael M, et al. Intrusion of chlorinated hydrocarbons and their degradation products from contaminated soil. Measurement of indoor air quality and biomonitoring by analysis of end-exhaled air[J]. Science of the Total Environment, 2019, 653:223-230 United States Environmental Protection Agency (US EPA). Office of Solid Waste and Emergency Response technical guide for assessing and mitigating the vapor intrusion pathway from subsurface vapor sources to indoor air[R]. Washington D C:Office of Solid Waste and Emergency Response, 2015 United States Environmental Protection Agency (US EPA). Technical guide for addressing petroleum vapor intrusion at leaking underground storage tank sites[S]. Washington D C:Office of Underground Storage Tanks, 2015 Ma J, McHugh T, Beckley L, et al. Vapor intrusion investigations and decision-making:A critical review[J]. Environmental Science & Technology, 2020, 54(12):7050-7069 McHugh T, Loll P, Eklund B. Recent advances in vapor intrusion site investigations[J]. Journal of Environmental Management, 2017, 204:783-792 中华人民共和国生态环境部. 建设用地土壤污染风险评估技术导则:HJ 25.3-2019[S]. 北京:中国环境科学出版社 Zhang R H, Jiang L, Zhong M S, et al. Applicability of soil concentration for VOC-contaminated site assessments explored using field data from the Beijing-Tianjin-Hebei urban agglomeration[J]. Environmental Science & Technology, 2019, 53(2):789-797 Kan A T, Fu G, Hunter M, et al. Irreversible sorption of neutral hydrocarbons to sediments:Experimental observations and model predictions[J]. Environmental Science & Technology, 1998, 32(7):892-902 姜林, 钟茂生, 夏天翔, 等. 基于土壤气中实测苯浓度的健康风险评价[J]. 环境科学研究, 2012, 25(6):717-723 Jiang L, Zhong M S, Xia T X, et al. Health risk assessment based on benzene concentration detected in soil gas[J]. Research of Environmental Sciences, 2012, 25(6):717-723(in Chinese)
Chen W, Kan A T, Newell C J, et al. More realistic soil cleanup standards with dual-equilibrium desorption[J]. Ground Water, 2002, 40(2):153-164 Chen W, Kan A T, Fu G M, et al. Adsorption-desorption behaviors of hydrophobic organic compounds in sediments of Lake Charles, Louisiana, USA[J]. Environmental Toxicology and Chemistry, 1999, 18(8):1610-1616 罗晓丽, 齐亚超, 张承东, 等. 多环芳烃在中国两种典型土壤中的吸附和解吸行为研究[J]. 环境科学学报, 2008, 28(7):1375-1380 Luo X L, Qi Y C, Zhang C D, et al. Sorption and desorption of polycyclic aromatic hydrocarbons in two typical Chinese soils[J].Acta Scientiae Circumstantiae, 2008, 28(7):1375-1380(in Chinese)
Smith J A,Chiou C T, Kammer J A, et al. Effect of soil moisture on the sorption of trichloroethene vapor to vadose-zone soil at Picatinny Arsenal, New Jersey[J]. Environmental Science & Technology, 1990, 24(5):676-683 McNeel P J, Dibley V. Case study comparisons of vapor inhalation risk estimates:ASTM RBCA model prediction vs specific soil vapor data[R]. Washington DC:Lawrencen Livermore National Laboratory, 1997 Healy R M, Wang J M, Karellas N S, et al. Assessment of a passive sampling method and two on-line gas chromatographs for the measurement of benzene, toluene, ethylbenzene and xylenes in ambient air at a highway site[J]. Atmospheric Pollution Research, 2019, 10(4):1123-1127 Schreiner V C, Bakanov N, Kattwinkel M, et al. Sampling rates for passive samplers exposed to a field-relevant peak of 42 organic pesticides[J]. Science of the Total Environment, 2020, 740:140376 Woolfenden E. Sorbent-based sampling methods for volatile and semi-volatile organic compounds in air Part 1:Sorbent-based air monitoring options[J]. Journal of Chromatography A, 2010, 1217(16):2674-2684 Healy R M, Bennett J, Wang J M, et al. Evaluation of a passive sampling method for long-term continuous monitoring of volatile organic compounds in urban environments[J]. Environmental Science & Technology, 2018, 52(18):10580-10589 Gilman J B, Lerner B M,Kuster W C, et al. Biomass burning emissions and potential air quality impacts of volatile organic compounds and other trace gases from fuels common in the US[J]. Atmospheric Chemistry and Physics, 2015, 15(24):13915-13938 Walgraeve C, Demeestere K, Dewulf J, et al. Diffusive sampling of 25 volatile organic compounds in indoor air:Uptake rate determination and application in Flemish homes for the elderly[J]. Atmospheric Environment, 2011, 45(32):5828-5836 中华人民共和国环境保护部.土壤环境质量建设用地土壤污染风险管控标准:GB36600-2018[S]. 北京:中国环境科学出版社, 2018 中华人民共和国环境保护部. 土壤和沉积物挥发性有机物的测定吹扫捕集/气相色谱-质谱法:HJ 605-2011[S]. 北京:中国环境科学出版社, 2011 Seethapathy S, Górecki T. Polydimethylsiloxane-based permeation passive air sampler. Part I:Calibration constants and their relation to retention indices of the analytes[J]. Journal of Chromatography A, 2011, 1218(1):143-155 中华人民共和国环境保护部. 环境空气挥发性卤代烃的测定活性炭吸附-二硫化碳解吸/气相色谱法:HJ 645-2013[S]. 北京:中国环境科学出版社, 2013 钟茂生, 赵莹, 姜林. 采用球形被动式采样器测定土壤气体挥发通量的方法:CN106053288A. 2016-10-26 武晓峰, 谢磊. Johnson & Ettinger模型和Volasoil模型在污染物室内挥发风险评价中的应用和比较[J]. 环境科学学报, 2012, 32(4):984-991 Wu X F, Xie L. Comparative study on Johnson & Ettinger model and Volasoil model in the indoor volatilization risk assessment of contaminant[J]. Acta Scientiae Circumstantiae, 2012, 32(4):984-991(in Chinese)
张瑞环, 钟茂生, 姜林, 等. 基于DED模型的挥发性有机物健康风险评价[J]. 环境科学研究, 2018, 31(1):170-178 Zhang R H, Zhong M S, Jiang L, et al. Health risk assessment of volatile organic compounds based on DED model[J]. Research of Environmental Sciences, 2018, 31(1):170-178(in Chinese)
Holton C, Luo H, Dahlen P, et al. Temporal variability of indoor air concentrations under natural conditions in a house overlying a dilute chlorinated solvent groundwater plume[J]. Environmental Science & Technology, 2013, 47(23):13347-13354 Ström J G V, Guo Y M, Yao Y J, et al. Factors affecting temporal variations in vapor intrusion-induced indoor air contaminant concentrations[J]. Building and Environment, 2019, 161:106196 -

 点击查看大图
计量
- 文章访问数: 3149
- HTML全文浏览数: 3149
- PDF下载数: 107
- 施引文献: 0
