-
近年来,虽然我国采取了一系列针对生态环境问题的有力举措,使得空气质量得到很大程度的改善,但城市空气污染的防治形势依然比较严峻. 2022年京津冀及周边地区“2+26”城市和汾渭平原11个城市PM2.5的年均浓度分别为44 μg·m−3和46 μg·m−3,超过环境空气质量标准(GB3095-2012)中要求的PM2.5污染物浓度24小时平均限值一级标准35 μg·m−3;O3 日最大8小时浓度(O3_8h)分别为179 μg·m−3和167 μg·m−3,较2021年增长了4.7%、7.3%和1.2%,均超过了O3_8h浓度日最大8小时平均限值二级标准160 μg·m-3[1]. 我国空气污染的现状是不仅PM2.5尚未得到根本性控制,O3也呈现污染逐渐严重的趋势,O3浓度缓慢升高. 已有的研究表明,高浓度的PM2.5会影响能见度,给生产、生活带来诸多不便,也会对人体的呼吸系统和心脑血管系统等产生损害,甚至会改变区域气候[2 − 7]. O3浓度的升高不仅会直接对人体健康造成损害,还会增强大气氧化性,导致二次PM2.5比例的增加等[8],已成为仅次于PM2.5影响空气质量的重要因素[9 − 13]. 因此,PM2.5 和 O3 协同控制已成为我国持续改善空气质量的焦点[14 − 15].
基于以上原因,我国政府在《中华人民共和国国民经济和社会发展第十四个五年规划和2035年远景目标纲要》中提出到2025年全国重度及以上污染天气基本消除;PM2.5和臭氧协同控制取得积极成效,臭氧浓度增长趋势得到有效遏制等目标. 因此,识别大气环境中PM2.5及O3的变化趋势和关键驱动因素至关重要,有助于制定行之有效的精准控制措施,降低污染物浓度,综合改善大气环境的质量[13 − 15].
污染源排放和气象状况是PM2.5和O3的两种关键驱动因素[16 − 17],然而它们对PM2.5和O3生成与消耗大气化学过程的影响是多路径、多相态、动态变化的,导致PM2.5和O3之间的关系非常复杂. 随着大数据技术的发展,机器学习模型具有训练速度快、回归能力强等优点,在处理复杂非线性问题方面表现出良好的性能,在捕获多元关系、判断重要因素和扩展PM2.5和O3浓度分析方面提供了可靠的方法[18 − 20]. Castelli等[20]和Lee等[21]使用机器学习成功预测PM2.5、PM10和气态空气污染物的浓度. Wang 等[22] 利用随机森林模型实现PM2.5浓度的预测,并采用偏依赖算法,揭示复杂城市环境下PM2.5的排放源和形成过程. 龚德才等[23]使用XGBoost-LME模型估算京津冀地区近地面臭氧浓度,并发现在估算变量中地表温度、露点温度、地表太阳向下辐射、甲醛和二氧化氮是影响京津冀地区近地面臭氧浓度的重要因素. 然而之前的研究多集中在应用机器学习模型单独预测PM2.5和O3的浓度和影响因素识别,针对多因素相互作用对PM2.5和O3的影响和协同减排的研究相对较少.
汾渭平原是我国大气污染防治行动计划中,与京津冀和长三角并列的三大重点区域之一. 随着其他两个地区大气污染的有效控制和空气质量的显著改善,汾渭平原将成为未来我国空气污染控制的重点及难点区域,持续改善任务艰巨. 西安市是汾渭平原的中心城市,空气污染主要受本地排放、区域传输、气象和地形等多因素的综合影响. 因此,通过机器学习多年大量数据的方法获得西安市PM2.5和O3质量浓度的变化趋势并探讨其影响因素和协同控制措施,对研究汾渭平原在内的我国北方城市PM2.5和O3的生成机制、驱动因素及变化规律等具有科学意义,为相关部门制定精细化的大气颗粒物及O3污染控制措施提供基础数据支撑,为长期提升我国城市地区空气质量具有重要的现实意义.
-
西安市2017—2021年PM2.5、SO2、NO2、CO和O3_8h每日观测数据从陕西省空气质量实时发布系统获取(http://sthjt.shaanxi.gov.cn/service/). 该时间段内的温度(Temp)、相对湿度(RH)、风速(Wind speed)和大气压力(Pressure)数据从国家基准气候站(泾河站)获取(http://www.meteomanz.com/). 每日太阳辐射(Rad)数据来自美国NASA全球能源预测(POWER)项目 (https://disc.gsfc.nasa.gov/). 边界层高度(PBL)数据(34°25′N,109°00′E)来自欧洲中期天气预报中心逐3小时数据(https://www.ecmwf.int/). 甲醛数据(HCHO)来自欧空局Sentinel-5P和NOAA卫星数据集(https://disc.gsfc.nasa.gov/datasets?page=1&measurement =Formaldehyde). 对于个别缺失的数据,使用相邻数据的平均值作为插值进行了添补.
-
本文采用稳健的非参数统计方法Theil-Sen Median方法分别估计PM2.5和O3的变化趋势,该方法计算效率高,适用于长时间序列数据的趋势分析[18 − 19, 24]. Theil-Sen方法通过计算所有可能的PM2.5和O3对的斜率,并取斜率的中位数作为回归斜率,从而为PM2.5和O3趋势分析提供更保守的置信区间. Theil-Sen函数由R(4.2.1版本)的 openair软件包提供,借助RStudio软件实现PM2.5和O3浓度的逐年变化趋势计算,可分别直观有效反映2017—2021年西安市PM2.5和O3浓度的时间趋势特征以及趋势变化的显著性水平,计算公式如下:
式中,
xi 和xj 为PM2.5或O3浓度第j 个和第i 个样本的时间序列值. 当ρ<0 时,表示PM2.5和O3浓度在时间序列呈下降趋势,当ρ>0 时,表示PM2.5和O3浓度在时间序列呈上升趋势. -
广义可加模型(Generalized Additive Model, GAM)是广义线性模型(Generalized Linear Model, GLM)的半参数拓展[25],实现了用非参数的方法表征自变量对因变量的贡献,建模难度低,灵活性高,广泛用于处理气象和空气质量参数中复杂非线性关系的因变量和众多自变量之间的转换程度[26], 其形式为:
式中,
g(μ) 是连续函数;f1 ,f2 ,⋯fp 是连接自变量的平滑函数;Xp 为自变量;fp(Xp) 是关于自变量Xp 的非指定类别的非参数函数[25]. 在具体分析过程中,采用R软件(4.2.1版本)种mgcv等软件包实现GAM模型的建模. 使用污染气体和气象参数(大气压力、风速、温度、相对湿度、太阳辐射和边界层高度)作为输入变量,分析对PM2.5和O3的影响,其中NO2、SO2、 CO 、O3 作为PM2.5的污染气体 ;HCHO是西安主要的挥发性有机物(VOCs)之一,并且臭氧形成潜势也最高[27], 因此使用NO2、SO2、CO和HCHO作为O3的污染气体. -
西安市PM2.5和O3浓度的年度变化如图1所示. 2017年—2021年PM2.5的年均浓度分别为79.38、61.10 、56.90、51.37、46.52 μg·m−3, PM2.5的质量浓度2017年最高,随后逐年下降,分别下降了18.28、4.20、5.53和4.85 μg·m−3,除2017年到2018年外,其他年份之间的下降幅度均较小,2021年PM2.5的浓度下降到2017年的58.6%,下降幅度明显. O3_8h的年均浓度为94.12、89.66、88.55、88.50、84.88 μg·m−3,也表现为逐年降低的特征. 本文使用Theil-Sen估算了2017—2021年 PM2.5和O3的年变化趋势,结果显示PM2.5以每年6.03%的速度下降,可能主要受到近年来严格的颗粒物减排措施[22]和COVID-19期间工业排放及交通运输减少[28 − 29]的综合影响. O3以每年2.06%的速度下降,下降速度相对PM2.5较慢. 近地面的O3浓度受挥发性有机物(VOCs)和NOx排放、太阳辐射、温度等因素共同影响[30 − 31],在年际尺度上温度和太阳辐射的变化相对较小,减排措施导致的VOCs和NOx排放减少可能是O3缓慢下降的主要原因 [31]. 本研究结果与海口和三亚PM2.5和O3浓度下降的变化趋势一致,但在京津冀和长三角等地区存在PM2.5浓度下降而O3浓度急剧上升的特征如北京南京等城市[8, 12 − 13],并且城市化程度更高的地区PM2.5下降更快而O3上升更多[15]. 不同城市PM2.5和O3的变化趋势差异很大,因此探究汾渭平原PM2.5和O3变化趋势的影响因素有重要的现实意义.
-
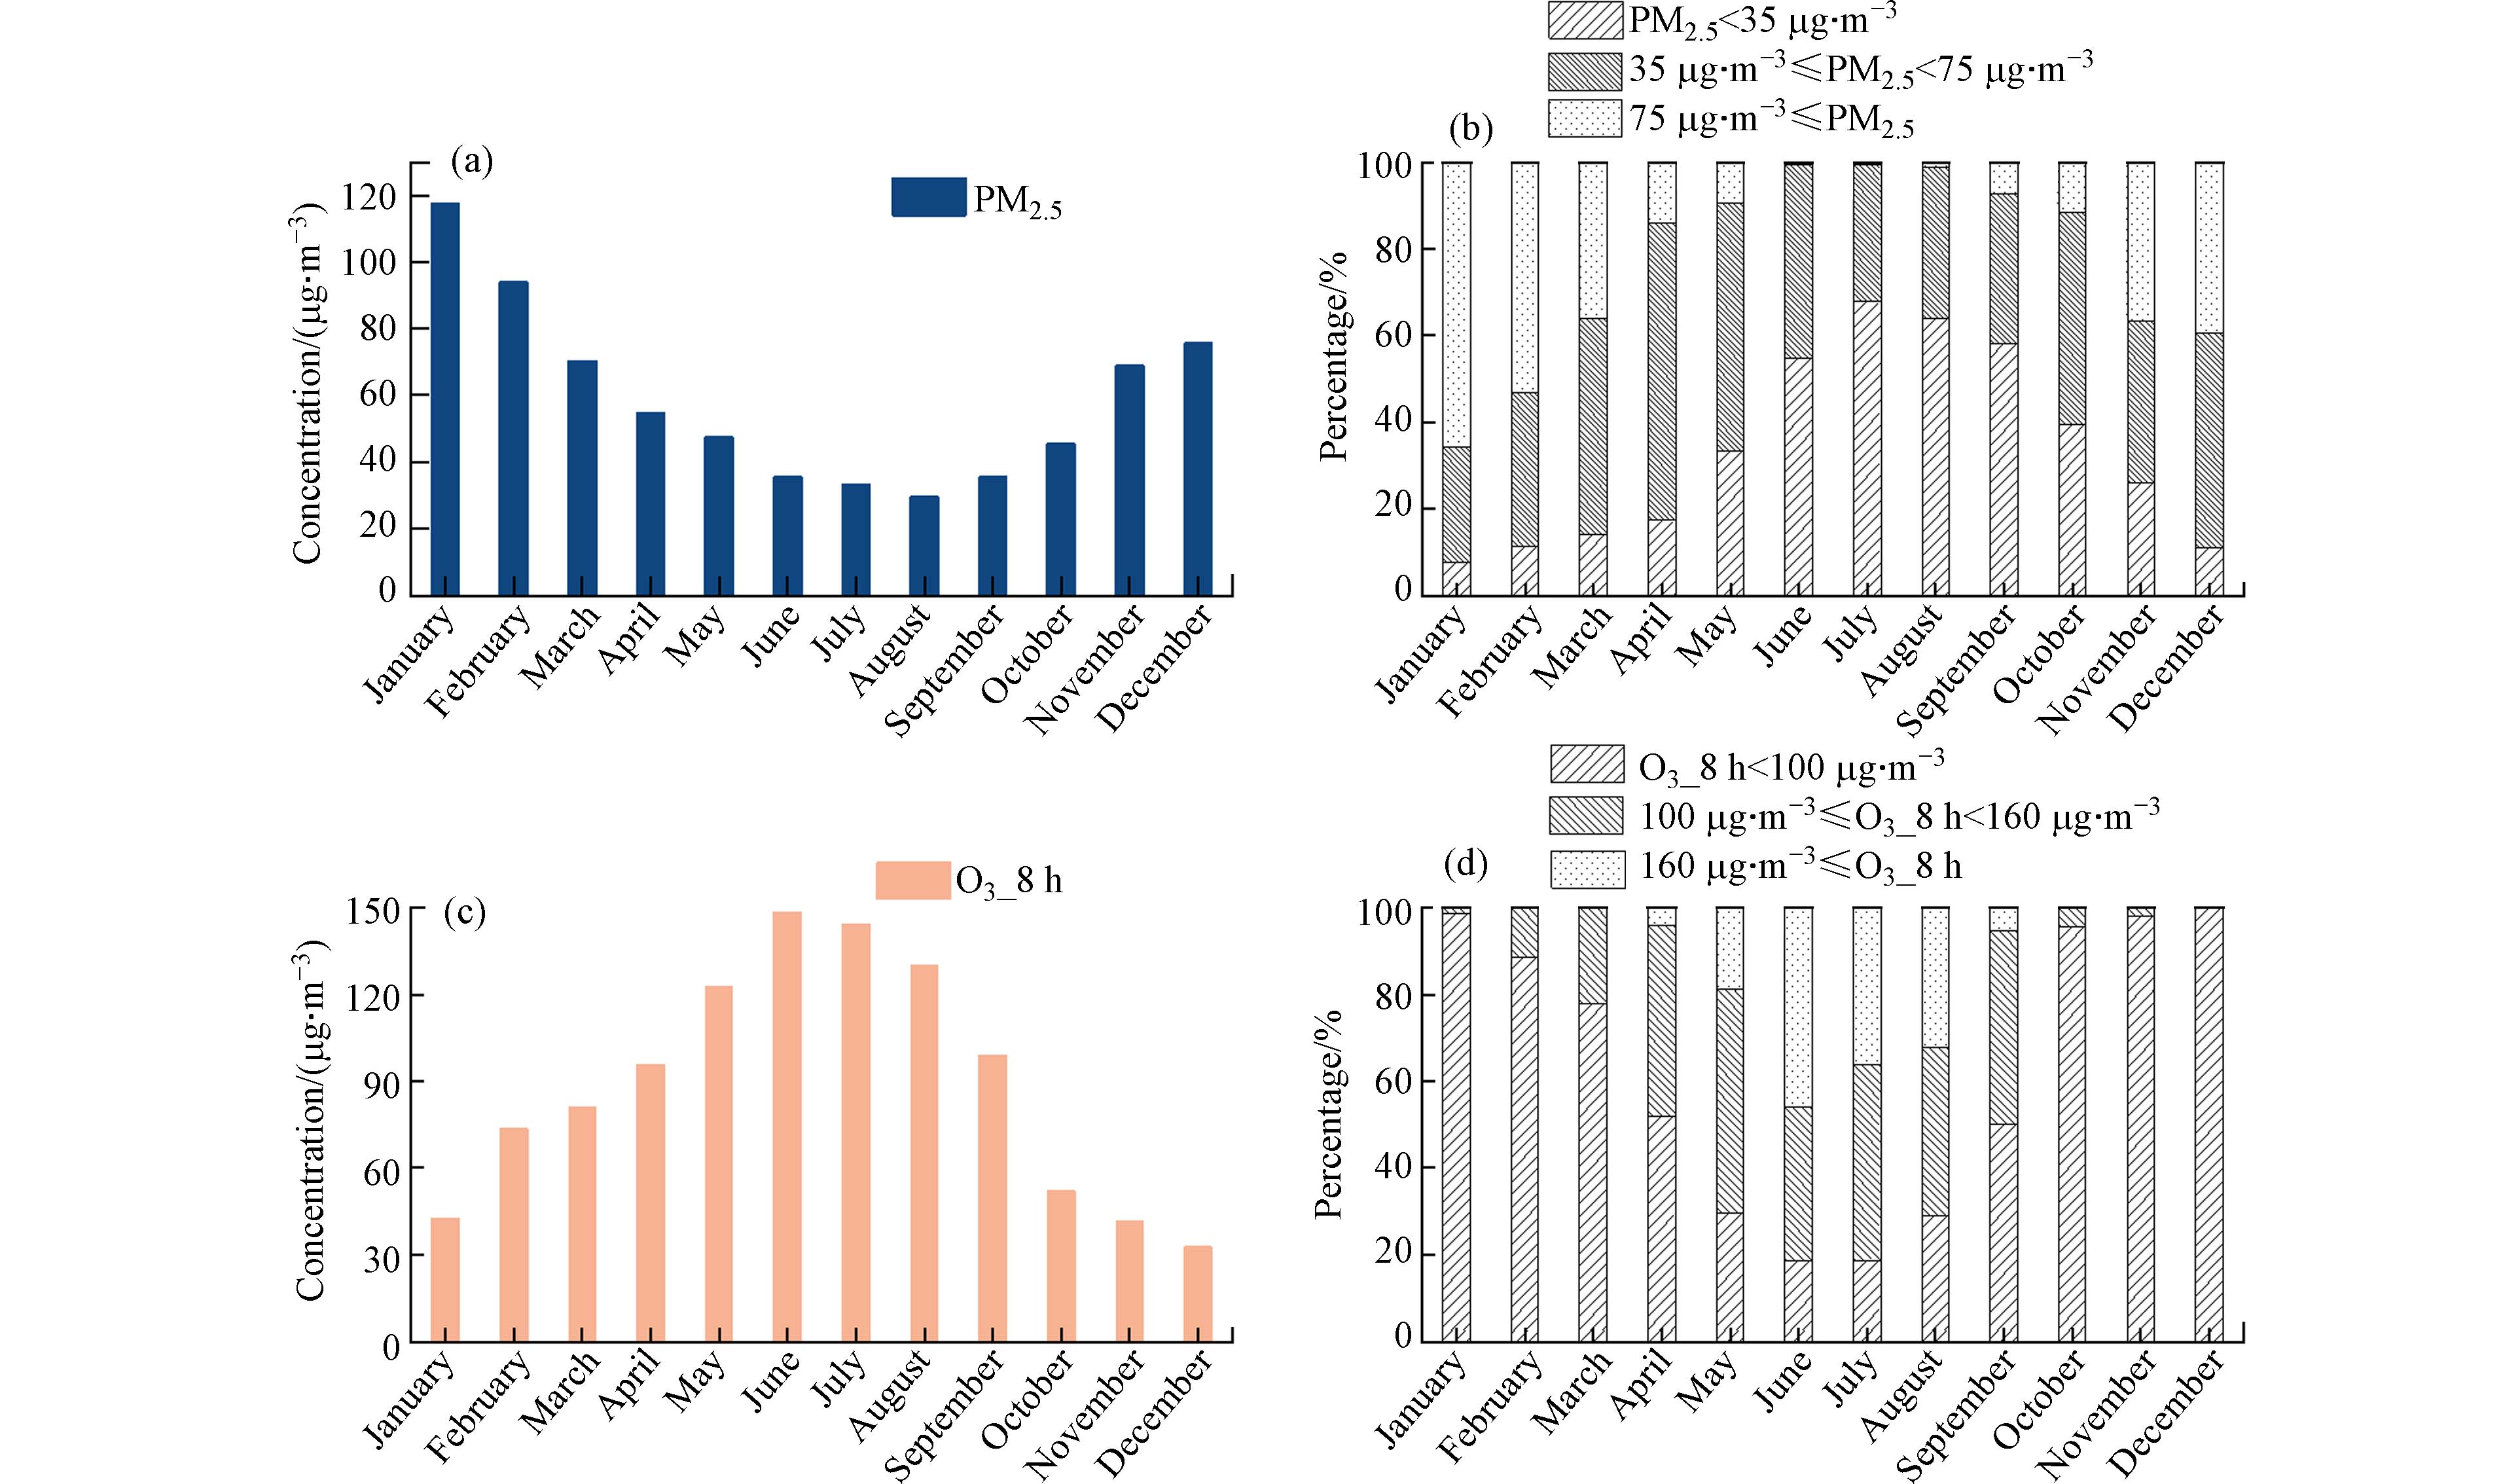
西安市2017年至2021年PM2.5和O3浓度的月度变化分布如图2所示,气象参数和污染物月均值如表1所示. 从图2(a)可以看出,PM2.5的质量浓度呈现“夏季低冬季高”的特征,最高值出现在1月,为117.44 μg·m−3,而后浓度开始下降,最低值出现在8月,为29.65 μg·m−3. 图2(b)显示,PM2.5在1月超过二级标准的天数为102 d,占比最高为65.8%;在6月和7月超过二级标准的污染天数均仅有1 d,占比均为0.6%,对空气质量指数影响最小. 以上季节特征与冬季受供暖影响燃煤量增加 [19, 28, 32]和春节期间烟花爆竹的燃放[32 − 34]导致的污染气体和颗粒物排放量增加有重要关系,同时西安冬季气温较低,大气层结相对稳定,边界层高度均值最低仅有268.55 m,不利于污染物的垂直扩散;而夏季边界层高度升高,平均边界层高度为454.71 m,有利于 PM2.5的扩散,并且夏季降水频繁且降水量大,可以达到在月均值80.00 mm 以上[34],也有利于PM2.5的沉降. 此外,近年大气氧化能力增强及 NH3控制成效不明显导致的二次颗粒物爆发性增长也可能是西安市冬季PM2.5浓度较高的重要原因之一[19, 34 − 36] .
图2(a)和(b)与(c)和(d)比较,可以看出O3浓度和PM2.5浓度呈相反的变化趋势,O3污染在夏季最严重而冬季最轻. O3_8h浓度月均值最高出现在6 月,为148.37 μg·m−3,而最低值出现在12月,为32.69 μg·m−3,O3_8h在6月超过二级标准160 μg·m−3的天数为69 d,占比最高(46.0%),而在10月、11月和12月超过二级标准的污染天均为0 d. 这可能是因为西安夏季气温高,太阳辐射强度最高可达到19.96 kwh·m−2,VOCs和NOx等污染气体受太阳辐射强度及高温的影响,更容易发生氧化反应,有利于近地面的光化学反应生成O3 [31, 37];冬季温度低、太阳辐射减弱,平均仅有9.80 kwh·m−2,不利于O3的生成. 此外,冬季高浓度的PM2.5不仅会散射和吸收太阳辐射,使到达地面的太阳辐射量减少,还可能会通过增加云凝结核,增大云光学厚度降低太阳辐射,抑制O3的生成[26]. 西安市PM2.5和O3浓度月度变化特征与东北、京津冀和长三角地区观测得到的结果基本一致[34, 36 − 38].
-
为探究污染气体与气象条件对PM2.5和O3的影响,将4种污染气体(NO2、SO2、CO和O3)和6种气象参数(大气压力、风速、温度、相对湿度、太阳辐射和边界层高度)共10个影响因素分别作为自变量,PM2.5作为因变量构建模型,如表2所示. 所有影响因素P<0.01,表明各影响因素单独作为PM2.5浓度变化的自变量均具有统计学意义[39]. NO2、SO2和 CO分别与PM2.5浓度变化构建模型方程的拟合度较优,解释率较高(51.1%—60.2%);其它影响因素单独对PM2.5浓度变化的模型拟合度较差,对PM2.5浓度变化的解释率较低(6.2%—27.7%).
将4种污染气体(NO2、SO2、CO和HCHO)和6种气象参数(大气压力、风速、温度、相对湿度、太阳辐射和边界层高度)共10个影响因素作为自变量,O3作为因变量构建模型,如表3所示. 所有影响因素单独作为O3变化自变量具有统计学意义. 大气压力、太阳辐射和温度分别与O3浓度变化构建模型方程的拟合度较优,模型解释率较高(60.6%—67.8%);而其它影响因素单独对O3浓度变化构建模型拟合度较差.
GAM模型分析中,当自由度值(edf)为1时,表明自变量与因变量之间具有线性关系;当edf大于1,自变量与因变量之间具有某种非线性关系,且def值越大,非线性关系越显著[37]. 从表2和表3可以看出,所有影响因素均与PM2.5和O3浓度变化表现出非线性关系,PM2.5和O3浓度的变化是受多种影响因素共同作用的结果. 因此,采用GAM模型可以较好分析影响因素与PM2.5和O3浓度间的非线性关系.
-
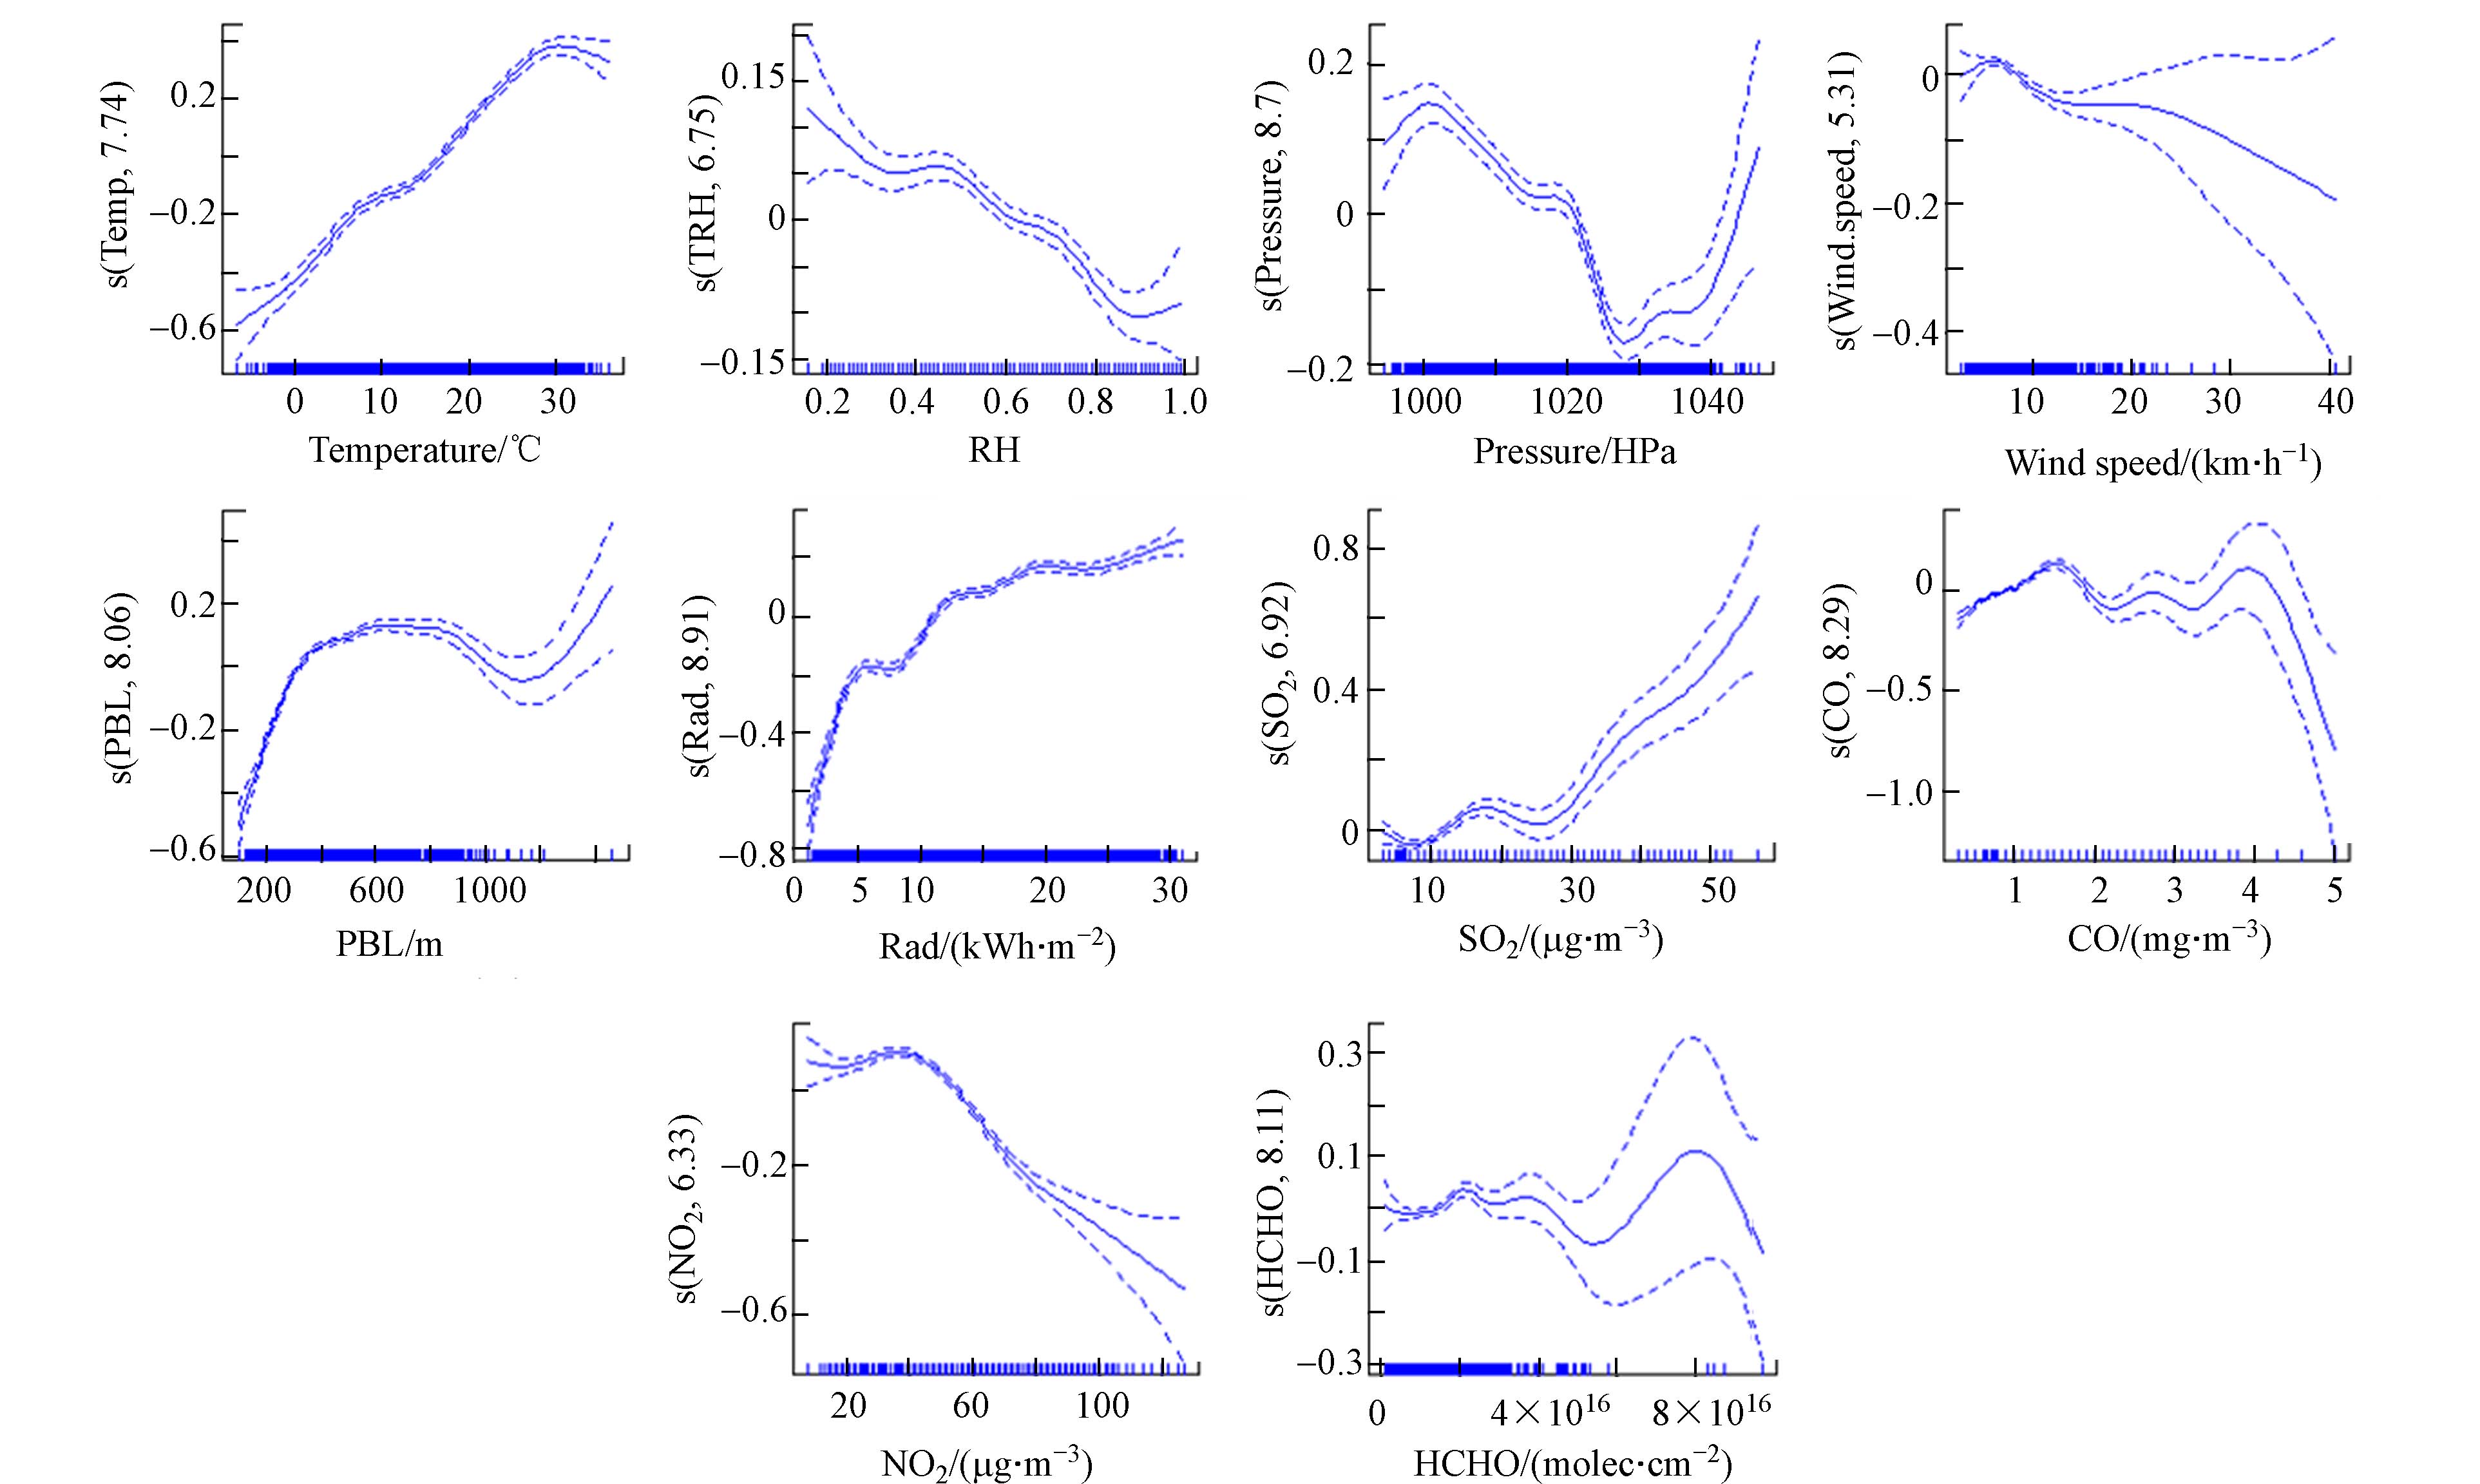
将单因素分析中具有统计意义和经过显著性检验的影响因素作为自变量与PM2.5和O3分别建立多因素GAM模型,如表4和表5所示,模型调整判定系数分别为0.854和0.764,方差解释率分别为84.9%和75.0%,并得到影响因素对PM2.5和O3浓度影响效应,如图3和图4所示. 图3和图4中虚线表示拟合可信区间的上、下限,实线代表PM2.5和O3浓度的平滑拟合曲线. 横坐标表示各自变量的实测值,纵坐标表示自变量对PM2.5和O3浓度的平滑拟合值,纵坐标括号数值代表估计自由度值[39].
从图3可以看出,温度从25 ℃降到-10 ℃,PM2.5随着温度的下降而升高,这可能是因为随着温度的降低,西安市供暖需求增加导致污染物的排放量增加,一次或二次转换促进PM2.5浓度升高[33 − 34, 36]. 相对湿度在20%—37%和45%—60%区间时,PM2.5随着相对湿度的增加而增加,相对湿度的增加可能会导致颗粒物的吸湿性增加,进一步促进非均相反应的发生[40],当相对湿度>60%时,PM2.5开始缓慢下降,当相对湿度>80%时,PM2.5转为急速下降,这可能是因为较高的相对湿度可能加速PM2.5的湿沉降,从而降低其浓度[41]. 当大气压力>1000 HPa后,PM2.5随着大气压力的升高而降低,这也跟低气压有利于污染物的积聚有关[42]. 风速低于8 km·h−1,PM2.5随着风速的降低而升高,这可能是因为风速较低不利于污染物的扩散传输. 边界层高度<500 m,随着边界层高度的升高而增高,这可能是因为边界层高度较低多发生于秋冬季,此时污染物排放的增加对PM2.5的影响更大. 当太阳辐射高于7.5 kwh·m−2时,PM2.5随着太阳辐射的升高而降低,这可能是因为太阳辐射通常表现为夏季高冬季低,而夏季边界层增高,扩散条件好,不利于污染物的积聚,当太阳辐射低于7.5 kwh·m−2时,PM2.5随着太阳辐射的升高而升高,这可能时因为冬季污染气体排放增加,太阳辐射促进大气的氧化性增强,进而促进颗粒物的增加. CO、NO2和O3_8h与PM2.5的相关性呈现正相关,表明随着一次排放导致污染气体的浓度升高和二次转化的增加,有利于PM2.5的浓度增加[43]. SO2对PM2.5的影响与其他污染气体不同,PM2.5随着SO2浓度的升高而降低,当SO2达到27 μg·m−3左右时PM2.5达到最低值,随后随着SO2浓度的升高而增加.
从图4可以看出,温度和太阳辐射与O3呈正相关,太阳辐射和温度的升高会加速光化学反应,促进臭氧生成速率的加快,进而增加O3浓度. 当大气压力<1028 HPa时,O3与大气压力呈现负相关,大气压表现出冬季高夏季低趋势,所以机器学习在进行统计分析时,表现出随着气压的降低,O3浓度升高,大气压力>1028 HPa主要集中在冬季,冬季可能由于NOx和VOCs等污染气体排放的增加,O3表现出一定幅度的升高. 边界层高度与O3呈现非线性关系,当边界层高度<500 m时,O3随着边界层高度的增加而升高,500 m<边界层高度<900 m时,O3受边界层高度的影响较小. CO>3.8 mg·m−3时,O3随着CO的升高而降低,这可能是因为CO作为O3的前体物,低浓度的CO对O3浓度的影响较小,而高浓度的CO消耗的同时促进O3的产生[34]. O3与NO2呈现负相关,这可能是因为高浓度的NO2促进O3生成,消耗NO2的同时O3浓度不断升高[34]. [HCHO]<2×10¹⁶ molec·cm2时与O3呈现正相关,表明甲醛作为O3的前体污染物,对O3的形成有一定的贡献,当[HCHO]>2×10¹⁶ molec·cm2时,拟合函数标准差逐渐变大,可信性变小.
-
从以上分析可以看出,PM2.5和O3浓度变化受各影响因素之间交互作用的共同影响. 因此,本研究通过将影响因素两两交互构建GAM模型,分析它们对PM2.5和O3浓度变化的作用,有利于全面、 深入地认识复杂大气环境中各个影响因素对PM2.5和O3浓度变化的作用.
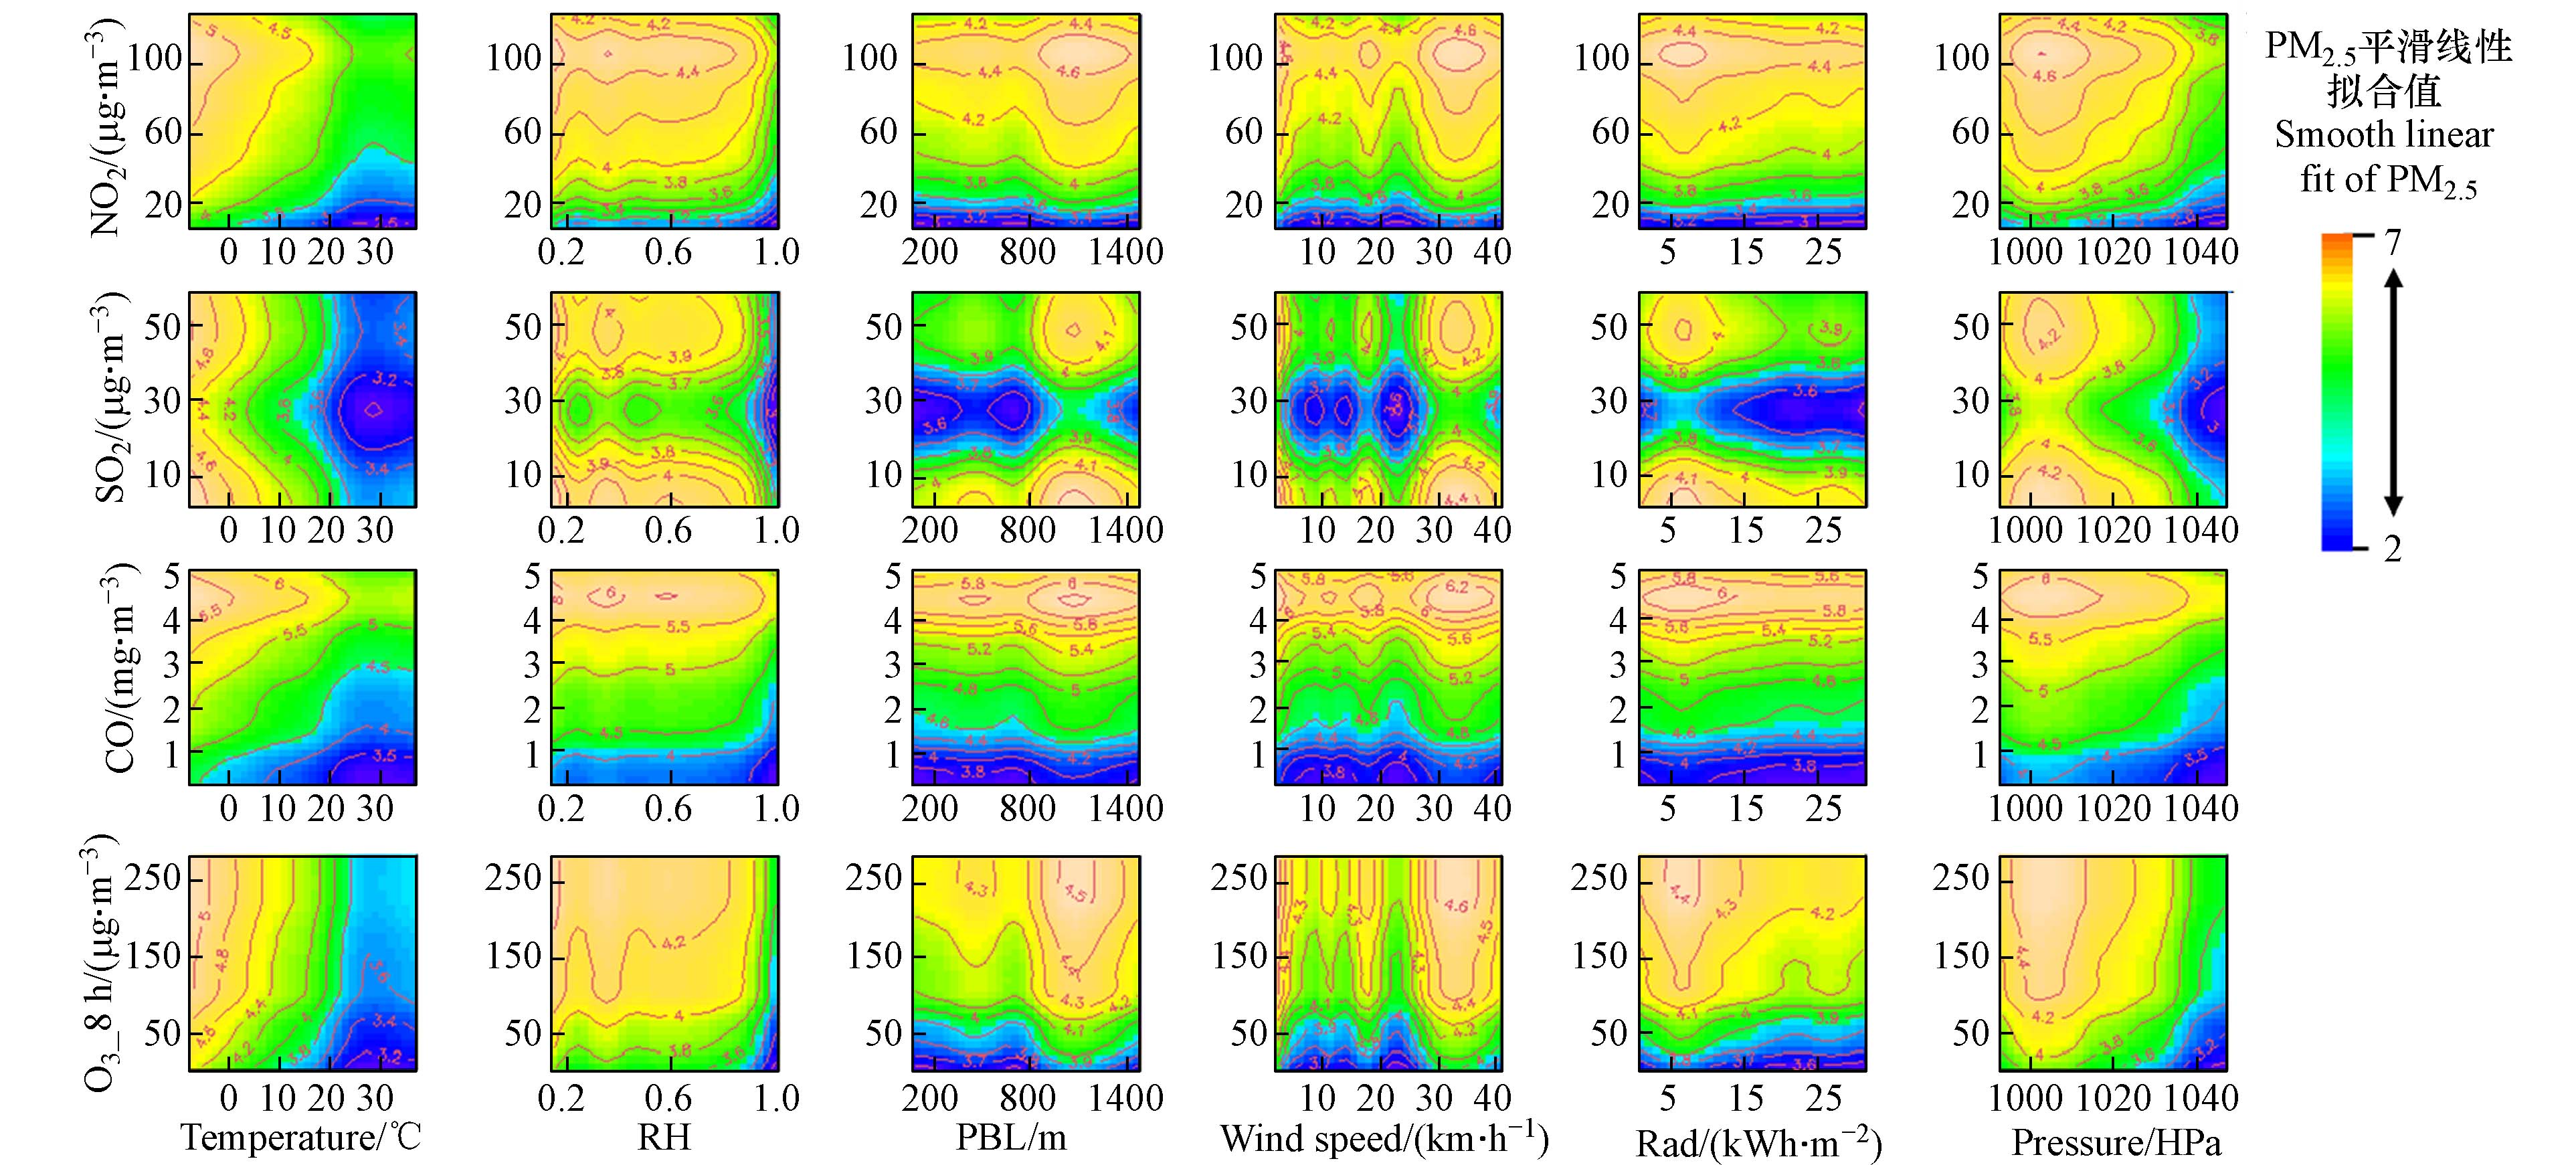
图5表示污染气体NO2、SO2、CO和O3分别与气象条件两两相互作用对PM2.5浓度变化的影响. 如图5所示,当温度分别与NO2、CO和O3_8h相互作用时,温度对PM2.5的影响更大,随着温度的降低PM2.5逐渐升高. 而相对湿度、边界层高度、太阳辐射和大气压力分别与NO2、CO和O3_8h相互作用时,污染气体对PM2.5的影响更大,PM2.5随着污染气体浓度的升高而增加. PM2.5浓度分别在温度<0 ℃、相对湿度<80%、边界层高度在1000—1200 m、太阳辐射在6—7 kwh·m−2、大气压力在1000—1010 HPa,同时NO2为100—120 μg·m−3,SO2为50 μg·m−3和0—10 μg·m−3,CO为4—5 mg·m−3,O3_8h为200—250 μg·m−3左右时达到峰值. 值得注意的是,当SO2分别与气象条件相互作用时,PM2.5先降低而后转为上升趋势,这可能是因为NOx和SO2存在竞争关系,当SO2浓度较低时,NOx有利于NO3-的生成,促进PM2.5的增长[44],机器学习在统计分析时就会表现出SO2浓度低时PM2.5浓度较高的现象,而SO2的浓度较高时有利于SO42-生成,导致PM2.5的显著的增加 [45 − 46]. 当风速与污染气体分别相互作用时,风速低于2.5 km·h−1和30—40 km·h−1范围内时对PM2.5的影响较大.
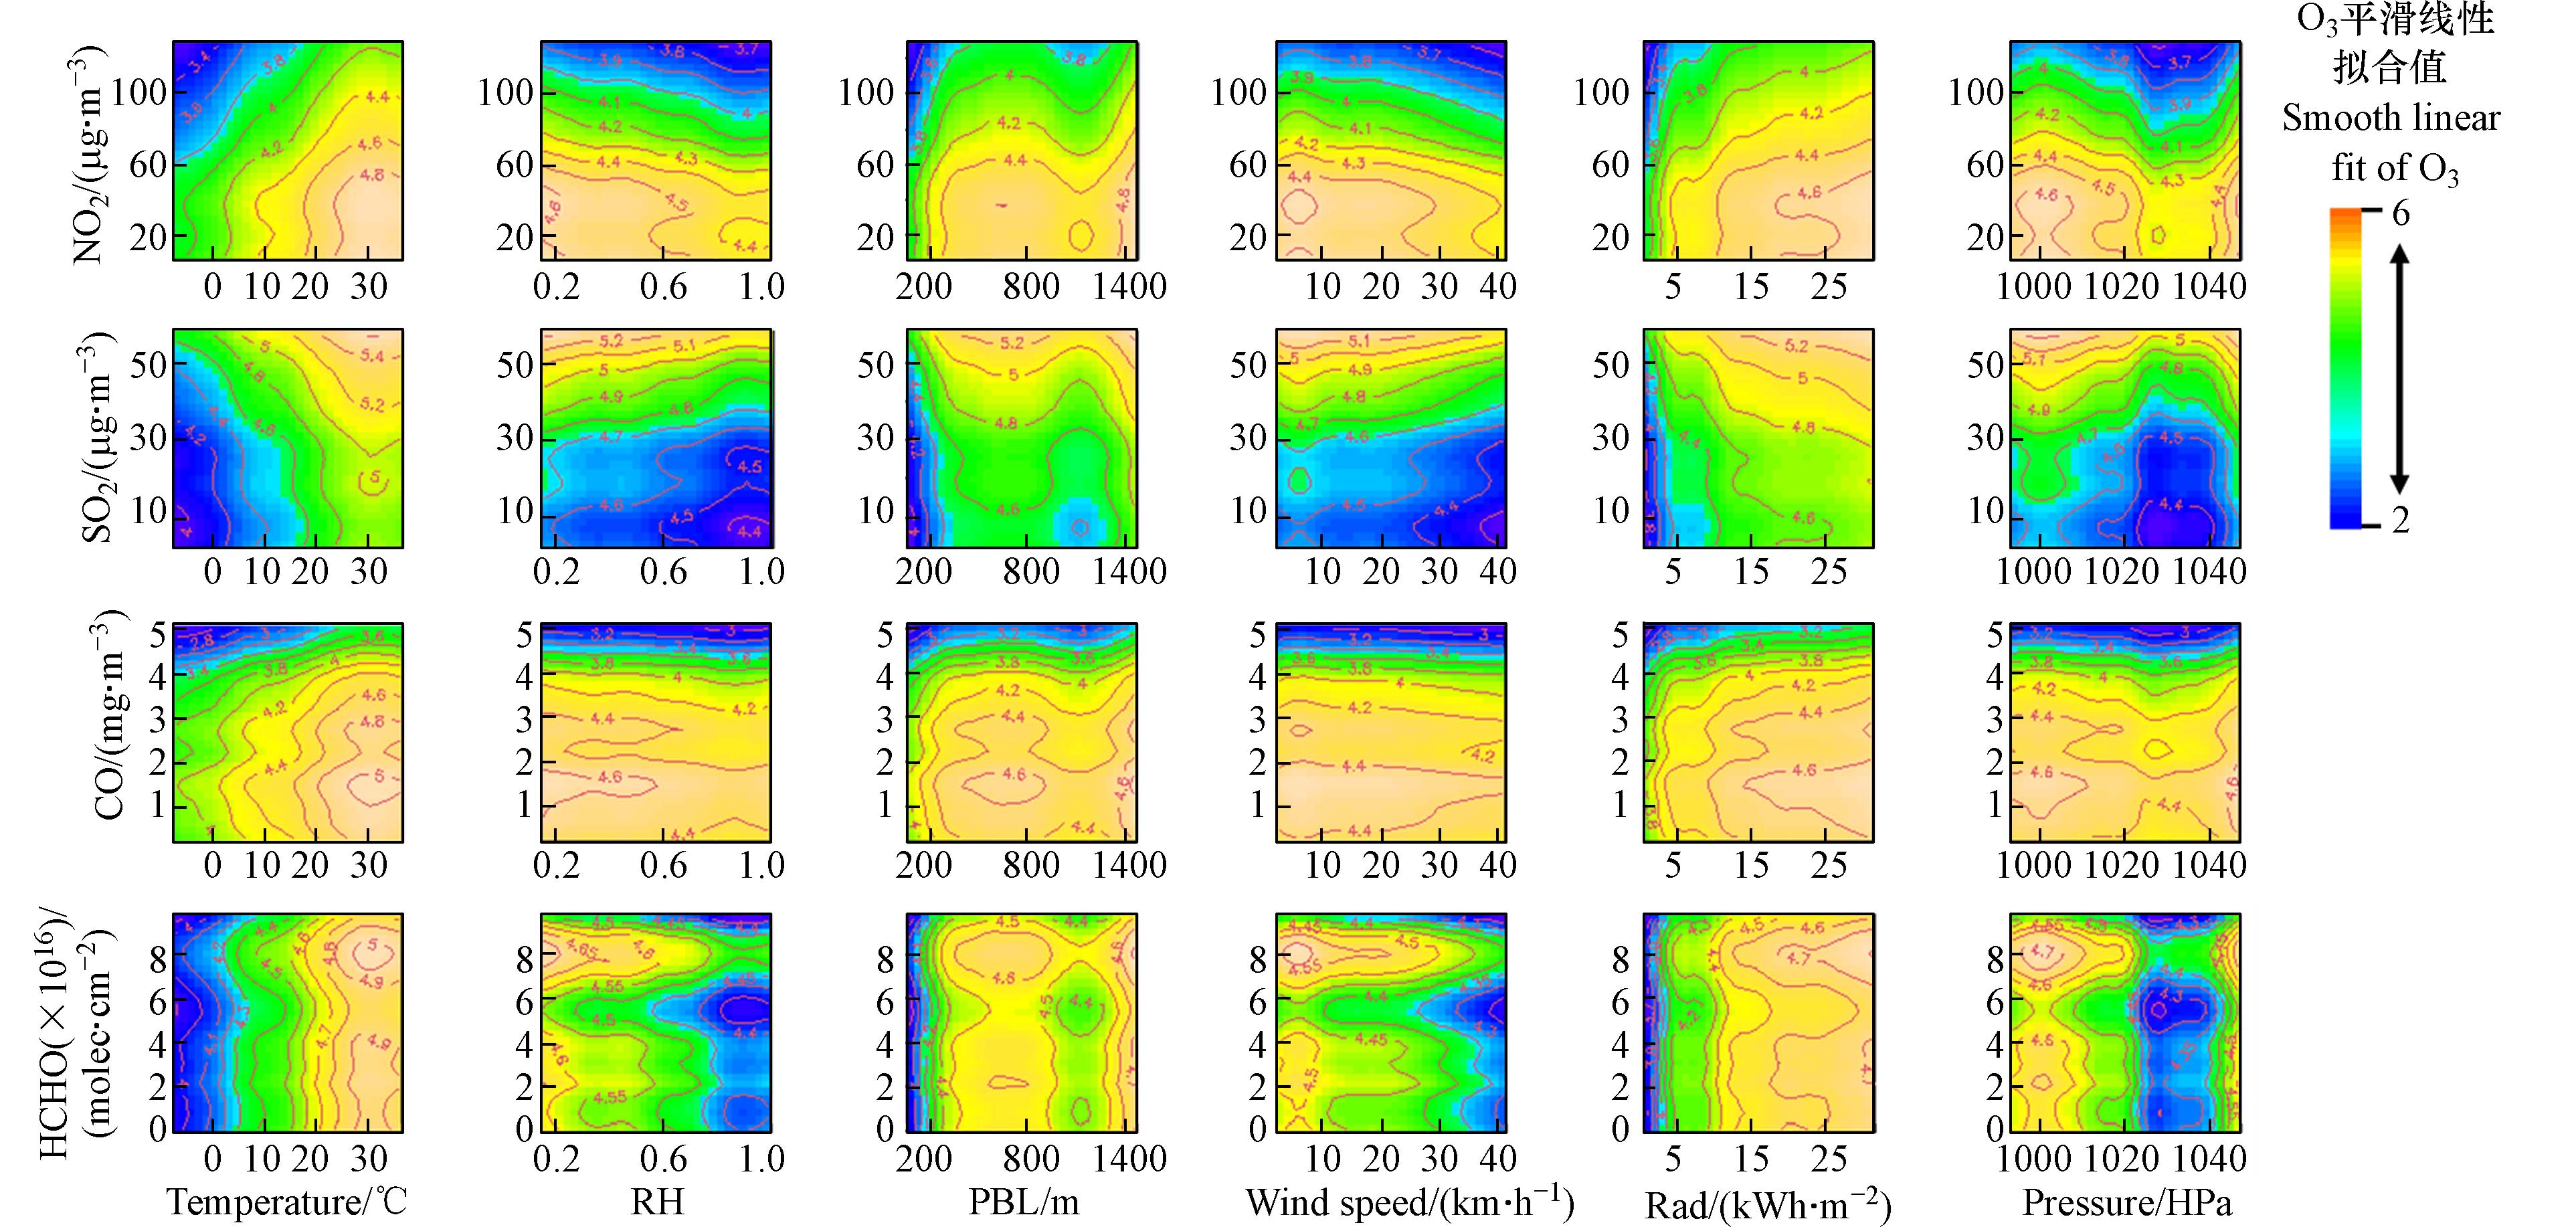
图6表示污染气体NO2、SO2、CO和HCHO分别与气象条件两两相互作用对O3浓度变化的影响. 从图6可以看出,当温度和太阳辐射分别与NO2、SO2、CO和HCHO相互作用时,温度和太阳辐射对O3的影响更大,随着温度和太阳辐射的升高,O3浓度逐渐升高;当相对湿度、边界层高度、风速和大气压力分别与NO2、SO2、CO和HCHO相互作用时,污染物对O3的影响更大. O3浓度在温度>25 ℃、太阳辐射>20 kwh·m−2、相对湿度<40%、边界层高度在400—900 m和>1400 m、大气压力在1000 HPa左右时,NO2<60 μg·m−3,SO2>50 μg·m−3,CO为1—2 mg·m−3,[HCHO]为8×10¹⁶ molec·cm−2左右时达到峰值. 进一步发现NO2和CO与气象条件相互作用时,NO2和CO对O3浓度的影响更大,可能是因为NO2和CO属于CO的前提物,消耗NO2和CO的同时O3浓度随之升高[47 − 48]. HCHO作为西安市主要的VOCs组分之一[49],之前的研究中发现HCHO与O3呈正相关[30],在本研究中可以看出当[HCHO]在8×10¹⁶ molec·cm−2时,与各气象条件相互作用时O3均达到峰值,表明高浓度的HCHO对O3有一定的贡献.
-
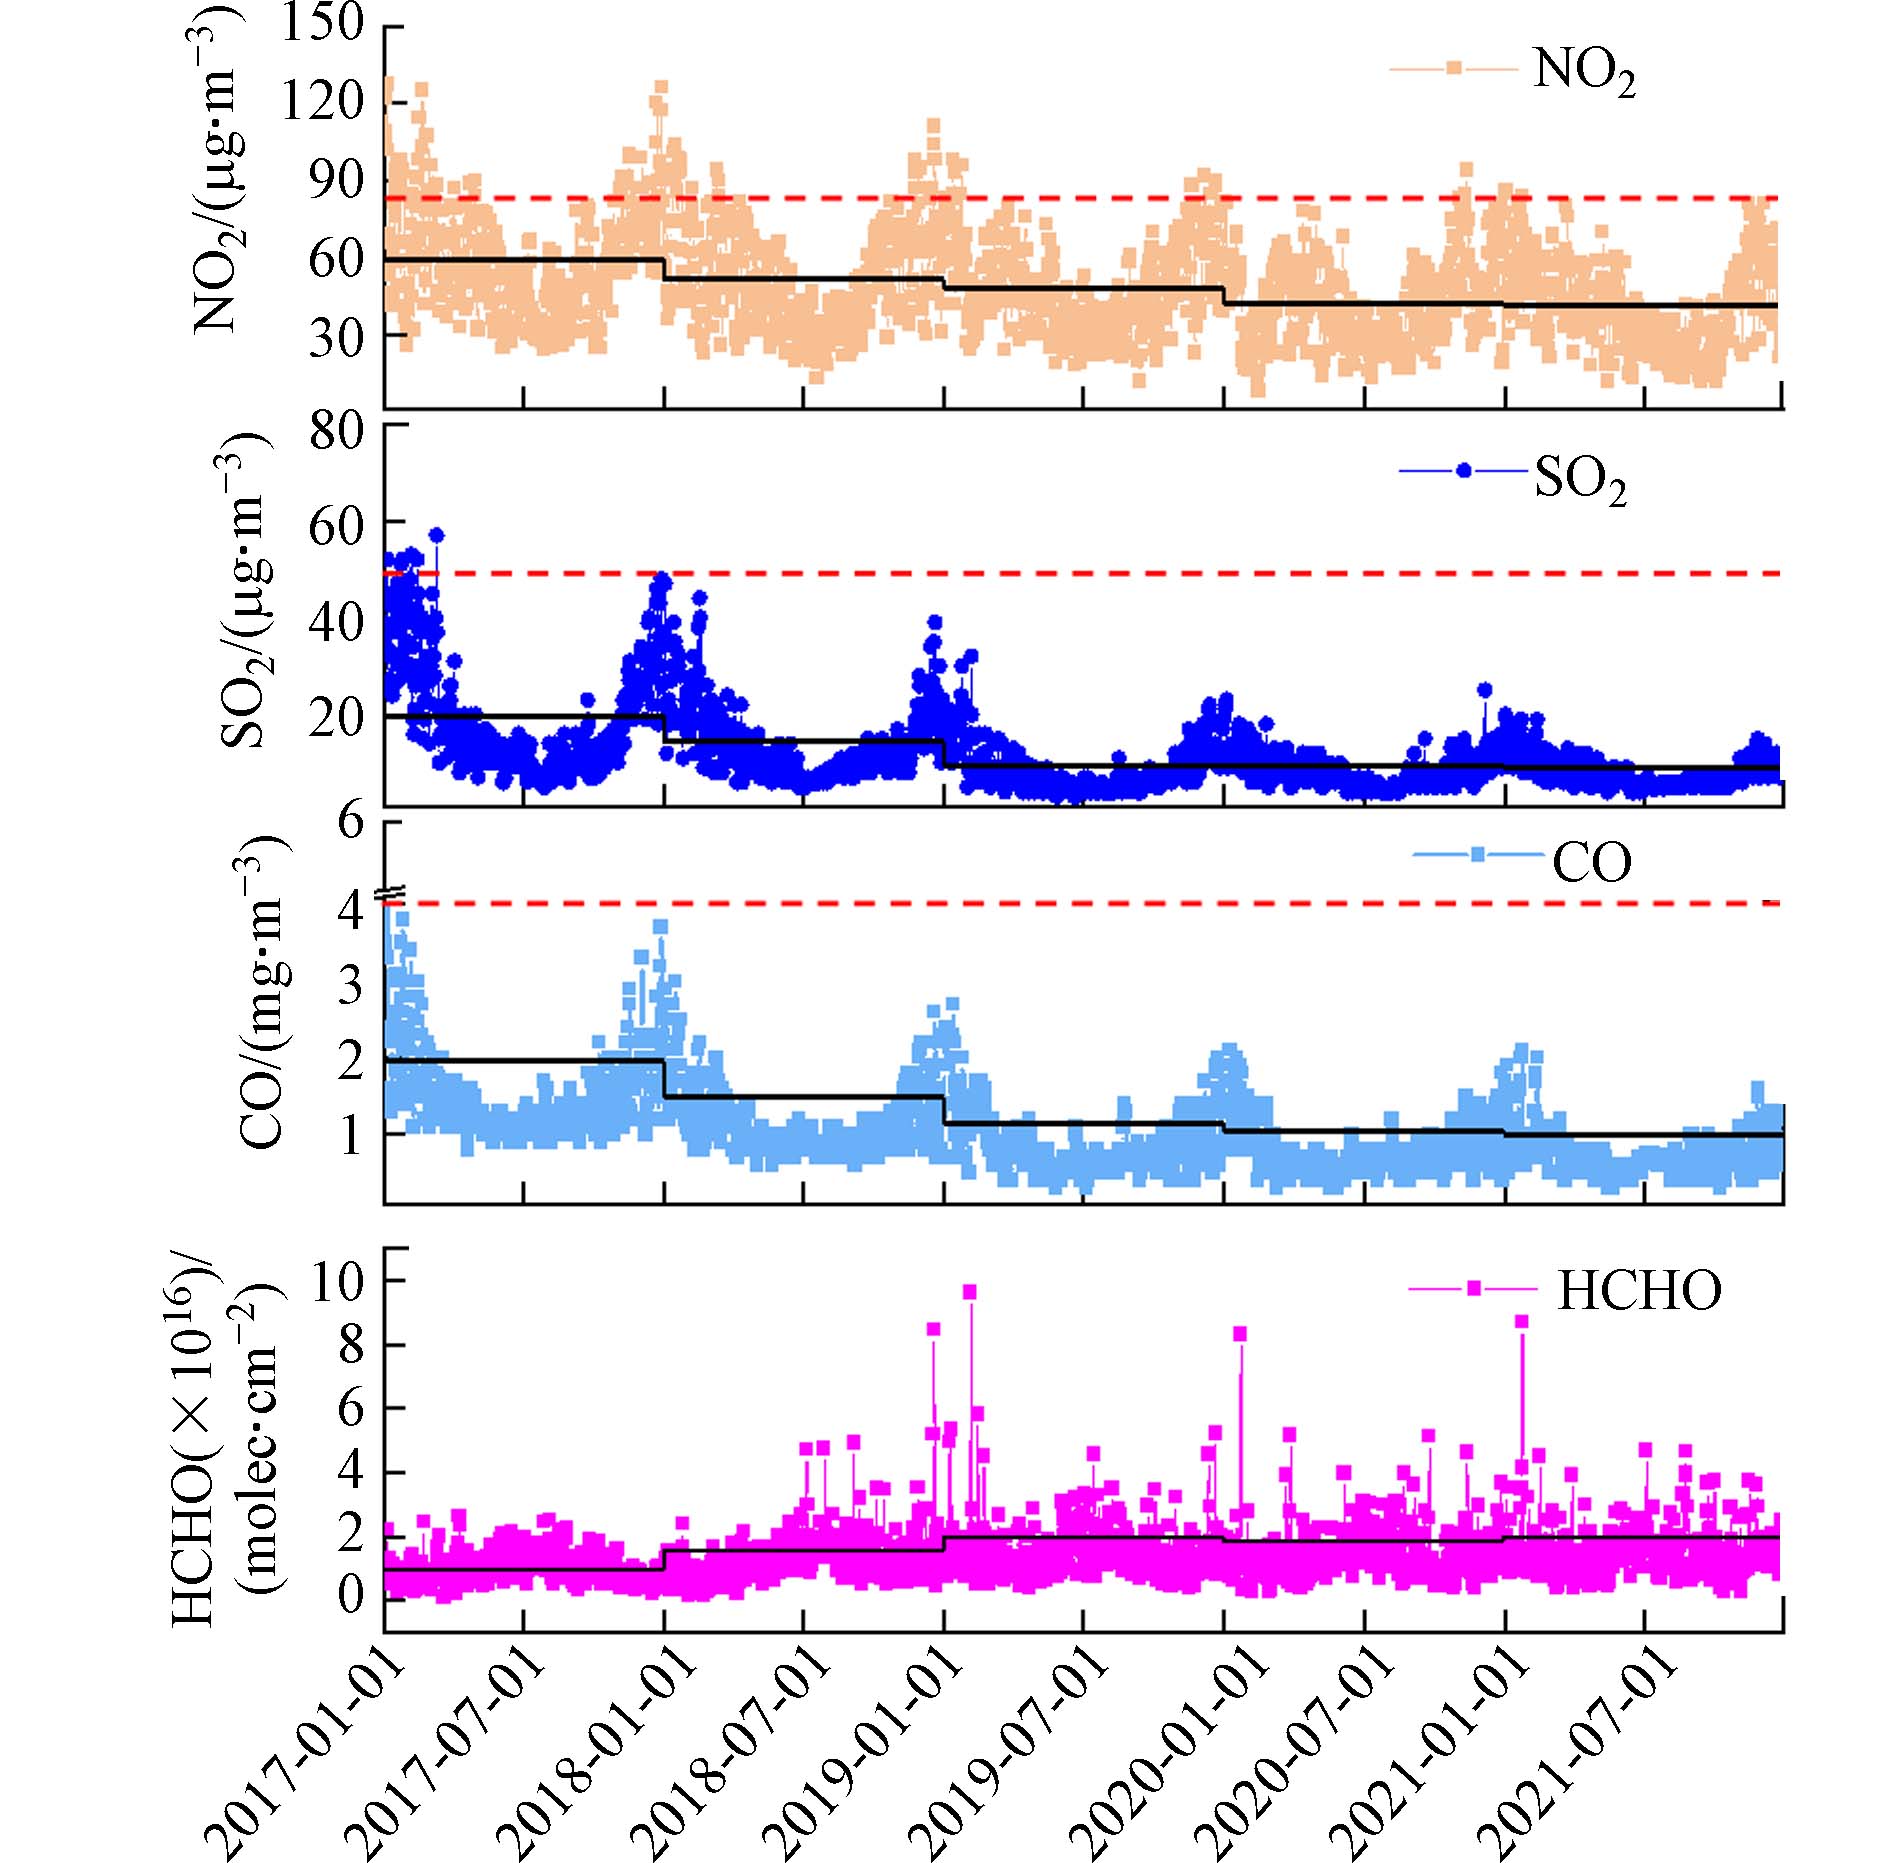
随着“蓝天保卫战行动计划”等政策的执行,环境空气质量得到显著的改善. 因为西安市燃料消耗结构和城市化进程的变化,以及新能源车辆的增多,污染气体来源的模式也发生变化. 图7为NO2、SO2、CO和HCHO浓度的年变化. 2017年到2021年NO2、SO2的年均质量浓度从58.95、18.18 μg·m−3降至40.77、8.06 μg·m−3,CO年均质量浓度由1.55 mg·m−3降至0.75 mg·m−3, 下降幅度分别为30.8%、55.7%和51.6%,SO2和CO的降幅超过一半,NO2的降幅偏小,但HCHO浓度基本没有改善,甚至年均浓度呈逐渐升高趋势. 虽然部分空气污染物(NO2、SO2和CO)已经满足GB3095-2012《环境空气质量标准》的一级标准限值要求,但环境空气污染物的存在就会对健康产生影响,没有绝对的安全标准[22].
通过“2.2”节的分析可以看出PM2.5和O3的浓度主要与气象条件中的温度、太阳辐射和污染气体的关系比较密切. PM2.5的浓度与NO2和CO正相关,而O3则相反,这可能是因为NO2和CO作为化石燃料燃烧的排放产物,其浓度增加会导致一次和二次PM2.5浓度的升高[19, 50 − 51],而高浓度的NO2和CO作为O3的前体物,消耗NO2和CO的同时O3不断升高[48, 52];高浓度的SO2和HCHO分别对PM2.5和O3的浓度有一定的贡献. 因此,对PM2.5和O3浓度的控制措施需要综合考虑.
表6列举了近年来西安市大气污染物源排放清单. 从表6可以看出,NOx的主要来源为工业源和移动源,工业源主要包括火电厂、石油加工炼焦业和化学原料与化学品制造业等[53 − 56],移动源主要指的是机动车,同时发现工业源与移动源的NOx排放量相当;VOCs的主要来源为工业源、移动源和其他来源,工业源的排放量是移动源排放量的3倍左右;SO2的主要来源是工业源;移动源是CO的主要来源之一. 因此,实现PM2.5和O3的协同控制,建议进一步加强工业源排放的控制,包括改造工业燃煤锅炉,减少燃煤的使用量和加强对石油炼焦业、金属制造业等改造,控制NOx和VOCs的排放量;同时通过改善燃油质量和扩大普及新能源车辆等加强对移动源的污染排放控制.
-
1)Theil-Sen趋势分析表明,2017年至2021年西安市PM2.5质量浓度以每年6.03%的速度下降,O3_8h以每年 2.06%速度下降. 不同区域、不同城市PM2.5和O3的变化趋势差异较大.
2)在单影响因素的GAM模型分析中,NO2、SO2和CO对PM2.5浓度变化影响的模型解释率较高,而大气压力、太阳辐射和温度对O3浓度变化影响的模型解释率较高. 在多影响因素的GAM模型分析中,温度与PM2.5浓度之间表现为负相关,而气态污染物CO、NO2和O3与PM2.5呈现正相关,表明污染气体的浓度增加有利于PM2.5浓度的增加. O3浓度与温度和太阳辐射呈现正相关,随温度和太阳辐射的升高而升高;与SO2呈正相关,与CO和NO2呈负相关.
3)影响因素交互作用对PM2.5和O3浓度变化的影响中,当污染气体与温度相互作用时,温度对PM2.5浓度的影响更大;相对湿度、边界层高度、太阳辐射和大气压力分别与NO2、CO和O3相互作用时,污染气体对PM2.5的影响更大,NO2、CO和O3对PM2.5的影响趋势一致,温度<0 ℃、相对湿度<80%、边界层高度在1000—1200 m、太阳辐射在6—7 kwh·m−2、大气压力在1000—1010 HPa,同时NO2为100—120 μg·m−3,SO2为50 μg·m−3和0—10 μg·m−3,CO为4—5 mg·m−3,O3_8h为200—250 μg·m−3左右时达到峰值. 当温度和太阳辐射分别与NO2、SO2、CO和HCHO相互作用时,温度和太阳辐射对O3的影响更大;当相对湿度、边界层高度、风速和大气压力分别与NO2、SO2、CO和HCHO相互作用时,污染气体对O3的影响更大.
4)NO2和CO与气象条件相互作用时,PM2.5随着NO2和CO浓度的增加而增加,但O3反之.
通过对西安市大气污染物源排放清单的分析,建议进一步加强对工业源NOx和VOCs的排放控制;同时通过改善燃油质量和清洁能源替代等加强对移动源的污染排放控制.
基于机器学习的汾渭平原PM2.5和O3变化特征及影响因素
Variation characteristics and influencing factors of PM2.5 and O3 based on machine learning in Fenwei Plain
-
摘要: 本文以2017—2021年汾渭平原典型城市西安大气PM2.5和O3浓度数据为基础,运用机器学习方法分析了PM2.5和O3的变化特征和趋势,讨论了污染气体(NO2、SO2、CO和HCHO)与气象因素(温度、相对湿度、风速、大气压力、边界层高度和太阳辐射)对PM2.5和O3浓度变化的交互影响. Theil-Sen趋势分析发现2017—2021年西安市PM2.5和O3分别以每年6.03%和2.06%的速度下降. 单因素广义加性模型(GAM)中,NO2 、SO2和CO对PM2.5浓度变化影响的模型解释率较高,温度、太阳辐射和大气压对O3浓度变化影响的模型解释率较高. 多因素GAM模型中,PM2.5和O3均呈现非线性变化,模型的解释方差分别为84.9%和75.0%,拟合程度较高. 通过等高线图分析了多个气象因素和多种污染气体两两交互作用分别对PM2.5和O3浓度的影响,其中温度和污染气体(NO2、SO2、CO和O3)对PM2.5浓度的影响更大;温度和太阳辐射对O3的影响更大. NO2和CO分别与气象条件两两相互作用时,PM2.5浓度随NO2和CO的增高而增高,O3浓度则与NO2和CO的变化趋势相反. 结合本地污染物源清单,建议加强控制工业源和移动源排放,有助于降低PM2.5和O3的浓度.Abstract: Based on the concentrations of PM2.5 and O3 in Xi'an, Fenwei Plain from 2017 to 2021, this study analyzed the change characteristics and trend of PM2.5 and O3, and discussed the interaction effects of pollutant gases (NO2, SO2, CO and HCHO) and meteorological factors (temperature, RH, wind speed, atmospheric pressure, boundary layer height and solar radiation) on PM2.5 and O3 by using machine learning method. Theil-Sen trend analysis found that PM2.5 and O3 decreased by 6.03% and 2.06% per year from 2017 to 2021, respectively. For the single influencing factor GAM models, the model explanation rate of the effects of NO2, SO2 and CO on PM2.5 is higher, temperature, solar radiation and pressure on O3 is higher. In the multiple influencing factors GAM model, all factors exhibited a non-linear relationship with PM2.5 and O3, and the contributions to the change of PM2.5 and O3 are 84.9% and 75.0% with significant impact, also suggesting a good model fit. Contour map were used to analyze the pairwise interaction of several meteorological factors and polluting gases on the concentration of PM2.5 and O3, respectively, which found that temperature and pollution gases (NO2, SO2, CO and O3) have considerable impact on PM2.5 concentration. For O3, the influence of temperature and solar radiation is greater. NO2 and CO interact with meteorological conditions, PM2.5 increased with the increase of NO2 and CO, however O3 showed opposite trends. According to the local pollutant source inventory, it is suggested to strengthen the emission of pollutants from industrial sources and mobile sources, which helps to reduce the concentration of PM2.5 and O3.
-
Key words:
- PM2.5 /
- O3 /
- Machine learning /
- Changing trend /
- Influencing factors
-
表 1 2017—2021年气象条件和污染气体月度均值
Table 1. monthly average of meteorological conditions and pollutants from 2017 to 2021
时间Time 温度/℃Temperature 湿度/%RH 大气压/HPaPressure 风速/(km·h−1)Wind speed 边界层高度/mBLH 太阳辐射/(kwh·m−2)Rad SO2/(μg·m−3) CO/(mg·m−3) NO2/(μg·m−3) O3/(μg·m−3) PM2.5/(μg·m−3) HCHO/(×1016 molec·cm−2) 1月 1.58 0.56 1029.37 7.44 303.19 8.78 21.44 1.78 67.65 39.96 118.66 1.33 2月 6.10 0.48 1025.61 7.65 427.61 13.17 18.41 1.34 55.37 77.82 92.84 1.21 3月 12.22 0.51 1018.85 8.98 492.09 14.77 12.88 1.01 55.73 81.12 69.66 1.09 4月 16.90 0.56 1015.13 9.40 544.57 17.28 10.10 0.88 50.07 95.99 54.75 1.10 5月 22.06 0.53 1009.72 8.62 559.92 19.96 8.52 0.73 44.52 122.86 47.38 1.18 6月 26.08 0.58 1004.27 8.13 510.36 18.43 7.10 0.75 34.97 148.37 35.51 1.70 7月 27.98 0.66 1002.34 8.71 438.30 18.88 5.95 0.78 31.22 144.40 33.25 1.71 8月 26.71 0.69 1005.50 8.79 416.37 17.08 6.80 0.79 32.35 134.24 32.63 1.67 9月 21.36 0.73 1013.75 7.85 365.57 13.59 8.07 0.85 40.59 99.20 35.52 1.33 10月 14.16 0.74 1023.14 7.30 325.03 9.49 8.76 0.94 47.04 51.88 45.45 1.18 11月 8.68 0.65 1026.02 7.13 282.14 9.57 12.92 1.17 61.59 41.63 68.93 1.25 12月 2.74 0.53 1031.04 6.91 268.55 8.70 17.88 1.30 62.73 32.69 75.58 1.42 表 2 PM2.5浓度与单影响因素的GAM模型假设检验结果
Table 2. Hypothesis test results of GAM model for PM2.5 and single influencing factors
估计自由度edf 参考自由度Ref.df P 方差解释Deviance explained 调整判断系数Adjust R2 s(Temp) 8.87 9.00 <2e-16 27.7% 0.21 s(RH) 8.88 9.00 <2e-16 6.2% 0.04 s(Pressure) 8.88 9.00 <2e-16 18.4% 0.13 s(Wind speed) 8.96 9.00 <2e-16 6.2% 0.04 s(PBL) 8.66 8.97 <2e-16 8.3% 0.06 s(Rad) 8.54 8.94 <2e-16 10.6% 0.08 s(SO2) 8.95 9.00 <2e-16 51.3% 0.51 s(CO) 8.86 8.99 <2e-16 60.2% 0.64 s(NO2) 8.88 9.00 <2e-16 51.1% 0.50 s(O3) 8.82 8.99 <2e-16 13.4% 0.10 表 3 O3浓度与单影响因素的GAM模型假设检验结果
Table 3. Hypothesis test results of GAM model for O3 and single influencing factors
估计自由度edf 参考自由度Ref.df P 方差解释Deviance explained 调整判断系数Adjust R2 s(Temp) 8.882 8.995 <2e-16 67.8% 0.71 s(RH) 8.697 8.971 <2e-16 12.1% 0.11 s(Pressure) 8.788 8.986 <2e-16 60.6% 0.62 s(Wind speed) 8.664 8.966 <2e-16 6.5% 0.06 s(PBL) 8.78 8.985 <2e-16 41.8% 0.40 s(Rad) 8.915 8.998 <2e-16 60.7% 0.62 s(SO2) 8.903 8.996 <2e-16 12.8% 0.11 s(CO) 8.448 8.856 <2e-16 15.9% 0.14 s(NO2) 8.828 8.985 <2e-16 13.8% 0.12 s(HCHO) 8.86 8.994 <2e-16 11.6% 0.10 表 4 PM2.5浓度与多影响因素的GAM模型假设检验结果
Table 4. Hypothesis test results of GAM model for PM2.5 and multiple influencing factors
s(Temp) s(RH) s(Pressure) s(Wind speed) s(PBL) s(Rad) s(SO2) s(CO) s(NO2) s(O3) edf 7.717 8.841 8.631 8.943 7.718 7.208 6.877 8.871 8.813 7.826 Ref.df 8.602 8.991 8.96 8.999 8.599 8.242 7.898 8.992 8.987 8.589 P <2e-16 <2e-16 <2e-16 <2e-16 <2e-16 <2e-16 <2e-16 <2e-16 <2e-16 <2e-16 表 5 O3浓度与多影响因素的GAM模型假设检验结果
Table 5. Hypothesis test results of GAM model for O3 and multiple influencing factors
s(Temp) s(RH) s(Pressure) s(Wind speed) s(PBL) s(Rad) s(SO2) s(CO) s(NO2) s(HCHO) edf 7.74 6.75 8.7 5.31 8.06 8.91 6.92 8.29 6.33 8.11 Ref.df 8.59 7.84 8.97 6.46 8.76 9 7.8 8.76 7.36 8.79 P <2e-16 <2e-16 <2e-16 <2e-16 <2e-16 <2e-16 <2e-16 <2e-16 <2e-16 <2e-3 表 6 大气污染物源排放清单(104t)
Table 6. Emission inventory of air pollution sources(104t)
-
[1] 中华人民共和国生态环境部. 生态环境部通报2022年12月和1—12月全国环境空气质量状况[EB/OL]. [2023-01-28]. [2] LIN Z H, WANG Y H, ZHENG F X, et al. Rapid mass growth and enhanced light extinction of atmospheric aerosols during the heating season haze episodes in Beijing revealed by aerosol–chemistry–radiation–boundary layer interaction[J]. Atmospheric Chemistry and Physics, 2021, 21(16): 12173-12187. doi: 10.5194/acp-21-12173-2021 [3] TSAI P J, YOUNG L H, HWANG B F, et al. Source and health risk apportionment for PM2.5 collected in Sha-Lu area, Taiwan[J]. Atmospheric Pollution Research, 2020, 11(5): 851-858. doi: 10.1016/j.apr.2020.01.013 [4] LIU L, KUANG Y, ZHAI M M, et al. Strong light scattering of highly oxygenated organic aerosols impacts significantly on visibility degradation[J]. Atmospheric Chemistry and Physics, 2022, 22(11): 7713-7726. doi: 10.5194/acp-22-7713-2022 [5] TAO Y, YUAN Y, CUI Y J, et al. Comparative analysis of the chemical characteristics and sources of fine atmospheric particulate matter (PM2.5) at two sites in Changzhou, China[J]. Atmospheric Pollution Research, 2021, 12(8): 101124. doi: 10.1016/j.apr.2021.101124 [6] WOOD D A. Trend decomposition aids forecasts of air particulate matter (PM2.5) assisted by machine and deep learning without recourse to exogenous data[J]. Atmospheric Pollution Research, 2022, 13(3): 101352. doi: 10.1016/j.apr.2022.101352 [7] MENG F L, ZHANG Y B, KANG J H, et al. Trends in secondary inorganic aerosol pollution in China and its responses to emission controls of precursors in wintertime[J]. Atmospheric Chemistry and Physics, 2022, 22(9): 6291-6308. doi: 10.5194/acp-22-6291-2022 [8] LUO Y H, ZHAO T L, YANG Y J, et al. Seasonal changes in the recent decline of combined high PM2.5 and O3 pollution and associated chemical and meteorological drivers in the Beijing–Tianjin–Hebei region, China[J]. Science of the Total Environment, 2022, 838: 156312. doi: 10.1016/j.scitotenv.2022.156312 [9] LU X, HONG J Y, ZHANG L, et al. Severe surface ozone pollution in China: A global perspective[J]. Environmental Science & Technology Letters, 2018, 5(8): 487-494. [10] LU X, ZHANG L, WANG X L, et al. Rapid increases in warm-season surface ozone and resulting health impact in China since 2013[J]. Environmental Science & Technology Letters, 2020, 7(4): 240-247. [11] WANG X P, MAUZERALL D L. Evaluating impacts of air pollution in China on public health: Implications for future air pollution and energy policies[J]. Atmospheric Environment, 2006, 40(9): 1706-1721. doi: 10.1016/j.atmosenv.2005.10.066 [12] LIU Z Y, QI Z L, NI X F, et al. How to apply O3 and PM2.5 collaborative control to practical management in China: A study based on meta-analysis and machine learning[J]. Science of the Total Environment, 2021, 772: 145392. doi: 10.1016/j.scitotenv.2021.145392 [13] WANG H L, KE Y, TAN Y, et al. Observational evidence for the dual roles of BC in the megacity of Eastern China: Enhanced O3 and decreased PM2.5 pollution[J]. Chemosphere, 2023, 327: 138548. doi: 10.1016/j.chemosphere.2023.138548 [14] 姜华, 高健, 李红, 等. 我国大气污染协同防控理论框架初探[J]. 环境科学研究, 2022, 35(3): 601-610. JIANG H, GAO J, LI H, et al. Preliminary research on theoretical framework of cooperative control of air pollution in China[J]. Research of Environmental Sciences, 2022, 35(3): 601-610(in Chinese).
[15] XING L, MAO X L, DUAN K Q. Impacts of urban–rural disparities in the trends of PM2.5 and ozone levels in China during 2013—2019[J]. Atmospheric Pollution Research, 2022, 13(11): 101590. doi: 10.1016/j.apr.2022.101590 [16] WANG P, CAO J J, SHEN Z X, et al. Spatial and seasonal variations of PM2.5 mass and species during 2010 in Xi’an, China[J]. Science of the Total Environment, 2015, 508: 477-487. doi: 10.1016/j.scitotenv.2014.11.007 [17] GAO M, GAO J H, ZHU B, et al. Ozone pollution over China and India: Seasonality and sources[J]. Atmospheric Chemistry and Physics, 2022, 20(7): 4399-4414. [18] GRANGE S K, CARSLAW D C, LEWIS A C, et al. Random forest meteorological normalisation models for Swiss PM10 trend analysis[J]. Atmospheric Chemistry and Physics, 2018, 18(9): 6223-6239. doi: 10.5194/acp-18-6223-2018 [19] WANG D, ZHAO W J, YING N, et al. Revealing the driving effect of emissions and meteorology on PM2.5 and O3 trends through a new algorithmic model[J]. Chemosphere, 2022, 295: 133756. doi: 10.1016/j.chemosphere.2022.133756 [20] LEE Y S, CHOI E, PARK M, et al. Feature extraction and prediction of fine particulate matter (PM2.5) chemical constituents using four machine learning models[J]. Expert Systems with Applications, 2023, 221: 119696. doi: 10.1016/j.eswa.2023.119696 [21] CASTELLI M, CLEMENTE F M, POPOVIČ A, et al. A machine learning approach to predict air quality in California[J]. Complexity, 2020, 2020: 8049504. [22] WANG M, ZHANG Z Z, YUAN Q, et al. Slower than expected reduction in annual PM2.5 in Xi’an revealed by machine learning-based meteorological normalization[J]. Science of the Total Environment, 2022, 841: 156740. doi: 10.1016/j.scitotenv.2022.156740 [23] 龚德才, 杜宁, 王莉, 等. 基于 XGBoost-LME模型的京津冀地区近地面臭氧浓度估算[J/OL].环境科学:1-16[2024-05-07].https://doi.org/10.13227/j.hjkx.202307110. GONG D C, DU N, WANG L, et al. Estimation of near-surface ozone concentration in the Beijing-Tianjin-Hebei region based on XGBoost-LME mode[J/OL].Environmental Science:1-16[2024-05-07].https://doi.org/10.13227/j.hjkx.202307110.3(in Chinese).
[24] 田义超, 杨棠, 徐欣. 北部湾典型入海流域植被净初级生产力时空分布特征及其影响因素[J]. 生态环境学报, 2021, 30(5): 938-948. TIAN Y C, YANG T, XU X. Temporal and spatial distribution characteristics and influencing factors of net primary productivity of vegetation in typical basin entering the sea in Beibu gulf[J]. Ecology and Environmental Sciences, 2021, 30(5): 938-948(in Chinese).
[25] 刘朋, 马海搏, 陈正元. 基于GAM的鞍山气象条件对PM2.5和SO2的影响研究[J]. 能源环境保护, 2022, 36(4): 104-108. doi: 10.3969/j.issn.1006-8759.2022.04.014 LIU P, MA H B, CHEN Z Y. Study on the influence of Anshan meteorological conditions on PM2.5 and SO2 based on GAM[J]. Energy Environmental Protection, 2022, 36(4): 104-108(in Chinese). doi: 10.3969/j.issn.1006-8759.2022.04.014
[26] HAN D L, ZHANG T T, ZHANG X D, et al. Study on spatiotemporal characteristics and influencing factors of pedestrian-level PM2.5 concentrations in outdoor open spaces of Harbin in winter, using a generalized additive model (GAM)[J]. Urban Climate, 2022, 46: 101313. doi: 10.1016/j.uclim.2022.101313 [27] LIN C S, HUANG R J, ZHONG H B, et al. Elucidating ozone and PM2.5 pollution in the Fenwei Plain reveals the co-benefits of controlling precursor gas emissions in winter haze[J]. Atmospheric Chemistry and Physics, 2023, 23(6): 3595-3607. doi: 10.5194/acp-23-3595-2023 [28] 姜楠, 郝雪新, 郝祺, 等. COVID-19管控前后不同污染阶段PM2.5中二次无机离子变化特征[J]. 环境科学, 2023, 44(5): 2430-2440. JIANG N, HAO X X, HAO Q, et al. Changes in secondary inorganic ions in PM2.5 at different pollution stages before and after COVID-19 control[J]. Environmental Science, 2023, 44(5): 2430-2440(in Chinese).
[29] FENG R, XU H M, WANG Z X, et al. Quantifying air pollutant variations during COVID-19 lockdown in a capital city in Northwest China[J]. Atmosphere, 2021, 12(6): 788. doi: 10.3390/atmos12060788 [30] GONG S L, ZHANG L, LIU C, et al. Multi-scale analysis of the impacts of meteorology and emissions on PM2.5 and O3 trends at various regions in China from 2013 to 2020 2. Key weather elements and emissions[J]. Science of the Total Environment, 2022, 824: 153847. doi: 10.1016/j.scitotenv.2022.153847 [31] 邰姗姗, 祖彪, 万敬华. 2016—2020年辽西四城市PM2.5和O3 污染特征对比分析[J]. 环境科学与技术, 2023, 46(增刊2): 142-149. TAI S S, ZU B, WAN J H. Comparative analysis of pollution characteristics of PM2.5 and O3 in four cities in western Liaoning from 2016 to 2020[J]. Environmental Science & Technology, 2023, 46(Sup2): 142-149(in Chinese).
[32] 纪传文, 肖浩, 李亲凯, 等. 天津市 2018—2020 年春节 PM2.5 中水溶性无机离子特征及重污染过程分析[J]. 环境化学, 2024, 43(1): 1-10. doi: 10.7524/j.issn.0254-6108.2023021407 JI C W, XIAO H, LI Q K, et al. Characteristics of water-soluble inorganic ions in PM2.5 and study of heavy pollution period during2018—2020 Spring Festival in Tianjin[J]. Environmental Chemistry, 2024, 43(1): 1-10(in Chinese). doi: 10.7524/j.issn.0254-6108.2023021407
[33] 王璐瑶, 何婧, 张婷, 等. 烟花爆竹燃放事件对宝鸡市空气质量的影响及健康风险评估[J]. 环境化学, 2023, 42(9): 3004-3016. doi: 10.7524/j.issn.0254-6108.2022091605 WANG L Y, HE J, ZHANG T, et al. Impact of fireworks displays events on air quality and health risk assessment in Baoji[J]. Environmental Chemistry, 2023, 42(9): 3004-3016(in Chinese). doi: 10.7524/j.issn.0254-6108.2022091605
[34] 罗悦函, 赵天良, 孟凯, 等. 华北平原和山区城市PM2.5 和O3 变化关系比较分析[J]. 中国环境科学, 2021, 41(9): 3981-3989. doi: 10.3969/j.issn.1000-6923.2021.09.002 LUO Y H, ZHAO T L, MENG K, et al. Comparative analysis of the relationship between PM2.5 and O3 in plain and mountainous cities in North China[J]. China Environmental Science, 2021, 41(9): 3981-3989(in Chinese). doi: 10.3969/j.issn.1000-6923.2021.09.002
[35] 袁方, 翟园, 洪超, 等. 西安地区近44年降水时空变化特征[J]. 安徽农业科学, 2014, 42(34): 12195-12198,12202. doi: 10.3969/j.issn.0517-6611.2014.34.070 YUAN F, ZHAI Y, HONG C, et al. Temporal and spatial variation characteristics of precipitation in Xi'an in recent 44 years[J]. Journal of Anhui Agricultural Sciences, 2014, 42(34): 12195-12198,12202(in Chinese). doi: 10.3969/j.issn.0517-6611.2014.34.070
[36] 刀谞, 吉东生, 张显, 等. 京津冀及周边地区采暖季PM2.5化学组分变化特征[J]. 环境科学研究, 2021, 34(1): 1-10. DAO X, JI D S, ZHANG X, et al. Characteristics of chemical composition of PM2.5 in Beijing-Tianjin-Hebei and its surrounding areas during the heating period[J]. Research of Environmental Sciences, 2021, 34(1): 1-10(in Chinese).
[37] 孙丹丹, 杨书运, 王体健, 等. 长三角地区城市O3和PM2.5污染特征及影响因素分析[J]. 气象科学, 2019, 39(2): 164-177. SUN D D, YANG S Y, WANG T J, et al. Characteristics of O3 and PM2.5 and its impact factors in Yangtze River Delta[J]. Journal of the Meteorological Sciences, 2019, 39(2): 164-177(in Chinese).
[38] 王闯, 王帅, 杨碧波, 等. 气象条件对沈阳市环境空气臭氧浓度影响研究[J]. 中国环境监测, 2015, 31(3): 32-37. doi: 10.3969/j.issn.1002-6002.2015.03.007 WANG C, WANG S, YANG B B, et al. Study of the effect of meteorological conditions on the ambient air ozone concentrations in Shenyang[J]. Environmental Monitoring in China, 2015, 31(3): 32-37(in Chinese). doi: 10.3969/j.issn.1002-6002.2015.03.007
[39] 贺祥, 林振山. 基于GAM模型分析影响因素交互作用对PM2.5浓度变化的影响[J]. 环境科学, 2017, 38(1): 22-32. HE X, LIN Z S. Interactive effects of the influencing factors on the changes of PM2.5 concentration based on GAM model[J]. Environmental Science, 2017, 38(1): 22-32(in Chinese).
[40] PAN X L, YAN P, TANG J, et al. Observational study of influence of aerosol hygroscopic growth on scattering coefficient over rural area near Beijing mega-city[J]. Atmospheric Chemistry & Physics, 2009, 9(19): 7519-7530. [41] CHENG B W, MA Y X, FENG F L, et al. Influence of weather and air pollution on concentration change of PM2.5 using a generalized additive model and gradient boosting machine[J]. Atmospheric Environment, 2021, 255: 118437. doi: 10.1016/j.atmosenv.2021.118437 [42] XU J M, YAN F X, XIE Y, et al. Impact of meteorological conditions on a nine-day particulate matter pollution event observed in December 2013, Shanghai, China[J]. Particuology, 2015, 20: 69-79. doi: 10.1016/j.partic.2014.09.001 [43] 王琰玮, 王媛, 张增凯, 等. 不同季节天津市PM2.5与O3潜在源区及传输路径分析[J]. 环境科学研究, 2022, 35(3): 673-682. WANG Y W, WANG Y, ZHANG Z K, et al. Analysis of potential source areas and transport pathways of PM2.5 and O3 in Tianjin by season[J]. Research of Environmental Sciences, 2022, 35(3): 673-682(in Chinese).
[44] TIAN M, WANG H B, CHEN Y, et al. Highly time-resolved characterization of water-soluble inorganic ions in PM2.5 in a humid and acidic mega city in Sichuan Basin, China[J]. Science of the Total Environment, 2017, 580: 224-234. doi: 10.1016/j.scitotenv.2016.12.048 [45] WANG S Y, REN Y, XIA B S. PM2.5 and O3 concentration estimation based on interpretable machine learning[J]. Atmospheric Pollution Research, 2023, 14(9): 101866. doi: 10.1016/j.apr.2023.101866 [46] FENG T, BEI N F, ZHAO S Y, et al. Nitrate debuts as a dominant contributor to particulate pollution in Beijing: Roles of enhanced atmospheric oxidizing capacity and decreased sulfur dioxide emission[J]. Atmospheric Environment, 2021, 244: 117995. doi: 10.1016/j.atmosenv.2020.117995 [47] 石玉珍, 徐永福, 王庚辰, 等. 北京市夏季O3、NO x等污染物“周末效应”研究[J]. 环境科学, 2009, 30(10): 2832-2838. doi: 10.3321/j.issn:0250-3301.2009.10.004 SHI Y Z, XU Y F, WANG G C, et al. Study of the “weekend effect” of O3, NO x and other pollutants in summer of Beijing[J]. Environmental Science, 2009, 30(10): 2832-2838(in Chinese). doi: 10.3321/j.issn:0250-3301.2009.10.004
[48] 王占山, 李云婷, 陈添, 等. 北京城区臭氧日变化特征及与前体物的相关性分析[J]. 中国环境科学, 2014, 34(12): 3001-3008. WANG Z S, LI Y T, CHEN T, et al. Analysis on diurnal variation characteristics of ozone and correlations with its precursors in urban atmosphere of Beijing[J]. China Environmental Science, 2014, 34(12): 3001-3008(in Chinese).
[49] 张鸿宇, 王媛, 卢亚灵, 等. 我国臭氧污染控制分区及其控制类型识别[J]. 中国环境科学, 2021, 41(9): 4051-4059. doi: 10.3969/j.issn.1000-6923.2021.09.010 ZHANG H Y, WANG Y, LU Y L, et al. Identification of ozone pollution control zones and types in China[J]. China Environmental Science, 2021, 41(9): 4051-4059(in Chinese). doi: 10.3969/j.issn.1000-6923.2021.09.010
[50] 付卫康, 赵天良, 燕莹莹, 等. 近年山东德州PM2.5和O3 相互作用的季节变化及其机理分析[J]. 环境科学学报, 2023, 43(8): 248-256. FU W K, ZHAO T L, YAN Y Y, et al. Analysis on seasonal changes with the mechanisms of interaction between PM2.5 and O3 in Dezhou, Shandong Province over recent years[J]. Acta Scientiae Circumstantiae, 2023, 43(8): 248-256(in Chinese).
[51] 王羽琴, 李升苹, 陈庆彩, 等. 西安市大气 PM2.5的化学组分及其来源[J]. 环境化学, 2021, 40(5): 1431-1441. doi: 10.7524/j.issn.0254-6108.2019121803 WANG Y Q, LI S P, CHEN Q C, et al. Study on chemical composition and pollution source of atmospheric PM2.5 in Xi’an City[J]. Environmental Chemistry, 2021, 40(5): 1431-1441(in Chinese). doi: 10.7524/j.issn.0254-6108.2019121803
[52] WANG N, LYU X P, DENG X J, et al. Aggravating O3 pollution due to NO x emission control in Eastern China[J]. Science of the Total Environment, 2019, 677: 732-744. doi: 10.1016/j.scitotenv.2019.04.388 [53] 王田. 陕西省大气污染物排放现状及减排潜力研究[D]. 西安: 西安建筑科技大学, 2020. WANG T. Study on the present situation of air pollutant emission and the potential of emission reduction in Shaanxi Province[D]. Xi’an: Xi’an University of Architecture and Technology, 2020(in Chinese).
[54] 汪晶发, 宋慧, 巴利萌, 等. 西安市机动车污染物排放清单与空间分布特征[J]. 环境污染与防治, 2020, 42(6): 666-671,677. WANG J F, SONG H, BA L M, et al. Study on the vehicle emission inventory and spatial distribution characteristics in Xi’an[J]. Environmental Pollution & Control, 2020, 42(6): 666-671,677(in Chinese).
[55] 李琦, 桂丽, 刘明, 等. 西安人为源VOCs排放特征及其对O3和SOA生成潜势的影响[J]. 环境科学研究, 2019, 32(2): 253-262. LI Q, GUI L, LIU M, et al. Emission characteristics of anthropogenic VOCs in Xi’an city and its contribution to ozone formation potential and secondary organic aerosols formation potential[J]. Research of Environmental Sciences, 2019, 32(2): 253-262(in Chinese).
[56] 苏航. 西安市大气污染源排放清单的建立及研究[D]. 西安: 西安建筑科技大学, 2016. SU H. The study of air pollutant emission inventory in Xi’an[D]. Xi’an: Xi’an University of Architecture and Technology, 2016(in Chinese).
[57] 陶双成, 邓顺熙, 郝艳召, 等. 关中城市群道路移动源气态污染物排放特征[J]. 中国环境科学, 2019, 39(2): 542-553. doi: 10.3969/j.issn.1000-6923.2019.02.012 TAO S C, DENG S X, HAO Y Z, et al. Vehicle emission characteristics of gaseous pollutants in Guanzhong urban agglomeration[J]. China Environmental Science, 2019, 39(2): 542-553(in Chinese). doi: 10.3969/j.issn.1000-6923.2019.02.012
[58] 张磊. 西安市近几年机动车尾气污染物排放特征及对策[D]. 西安: 西安工程大学, 2020. ZHANG L. The emission characteristics and countermeasures of automobile exhaust in Xi’an in recent years[D]. Xi’an: Xi’an Polytechnic University, 2020(in Chinese).
[59] 张雅瑞. 关中地区机动车温室效应污染物排放清单及其削减潜力研究[D]. 西安: 长安大学, 2022. ZHANG Y R. Emission inventory and reduction strategy of motor vehicle on greenhouse pollutants in Guanzhong region, China[D]. Xi’an: Changan University, 2022(in Chinese).
-


 下载:
下载:
