-
长江流域是中国第一大流域,覆盖19个省级行政单位,以21%的国土面积承载了全国的40%的人口和经济总量[1-2]。长江流域的中下游人口密度、经济发展程度在改革开放以来均位居我国前列,随之而来的环境压力也不容忽视。随着经济高速发展,排放到长江的污染物总量和强度都在逐年上升,排放到长江的污水量同样占到全国污水总量的40%[1]。长江及其支流监控断面主要水质因子为高锰酸盐指数 (CODMn) 、氨氮 (NH3-N) 等耗氧物质[3]。根据《中国生态环境统计年报》,2008年长江流域接纳的COD和NH3-N负荷分别占到全国的40.2%和40.9%;到2020年,COD和NH3-N负荷仍然分别占据全国的37.3%和42.8%,长江流域的污染排放强度长期以来达到全国平均水平的1.5~2倍[1]。高强度污染物排放,造成长江流域水体耗氧物质的浓度升高[4],溶解氧 (dissolved oxygen, DO) 下降。
DO是地表水监控的基本指标,对于维持水生生态系统正常功能具有重要意义[5]。空气中的氧气溶解和水生植物的光合作用是补充水中DO的主要途径。大气溶氧主要受到气压、温度、水体盐度的影响,此外流量增加也有利于DO恢复[6]。人口密度高、工业发达区域排放的大量有机物质和氮磷含量高的污水进入受纳水体后,一方面会带来营养物质不断积累,引起浮游植物和藻类吸收NH3-N大量生长繁殖[7],造成水体底部造成缺氧,水体富营养化愈演愈烈[8];另一方面,NH3-N和有机物等耗氧物质进入水体后,NH3-N的硝化过程,有机物的降解过程会消耗大量溶解氧[9]。低DO状态的水体中,水质的变化还会引起沉积物中NH3-N的释放[10]。此外,DO低于3 mg∙L−1的缺氧水体会对水体中鱼类的呼吸作用产生影响,抑制鱼类的基因表达,从而导致鱼类和甲壳动物的死亡[11-12],进而破坏生态系统的稳定性和生物多样性。
伴随着长江流域中下游人口和用水量的激增,给水处理系统造成巨大压力,也意味着流域内大量污水排入长江[13]。随污水排放的耗氧污染物导致的水环境危机在流域经济快速发展的过程中已有显现,DO较低、CODMn和NH3-N负荷高为水体恶化的标志[14-15],CODMn和NH3-N与地表水的水质密切相关[16]。为探求长江流域多年的水质变化及其主要原因,本研究利用长江流域2008至2018年间重点监测断面的DO、CODMn和NH3-N质量浓度数据,分析了长江流域重点河段监控断面的DO以及耗氧污染物CODMn和NH3-N的时空变化特征,结合对沿岸污水排放数据的统计和相关性分析,探讨水质变化的关键驱动因素,总结长江流域过去的水污染防治成果,为制定未来的污染物控制目标制定提供参考。
-
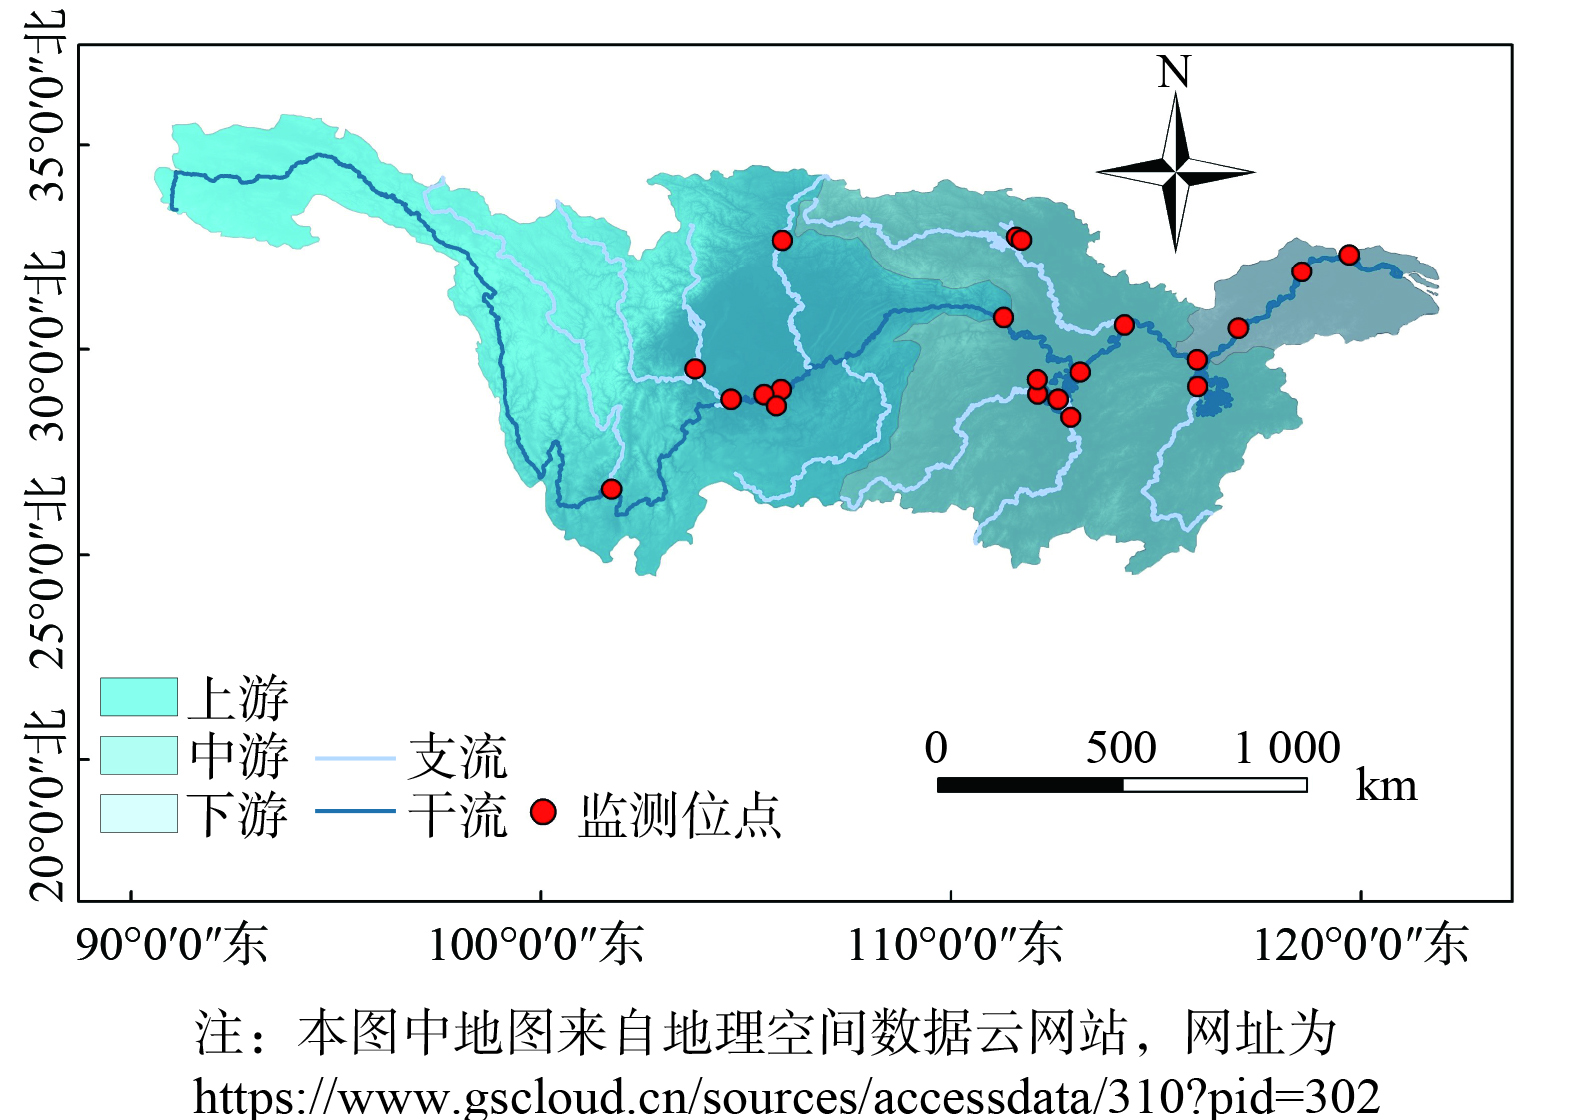
长江流域的范围位于东经90°~122°,北纬24°~36°,是中国覆盖面积最广的大河流域,干流横贯的省级行政单位数量达到11个,整个流域覆盖19个省、直辖市和自治区 (图1) ,为世界第三大流域[17]。长江西起青藏高原唐古拉山脉,东至上海市汇入东海,全长6 300 km,拥有复杂的支流和湖泊系统。长江的主要支流有雅砻江、岷江、沱江、嘉陵江、汉江、湘江、资江、沅江、澧水、赣江等;主要的湖泊包括我国五大淡水湖泊中的4个 (鄱阳湖、洞庭湖、太湖和巢湖) 。此外,长江流域还建有三峡水库这一世界最大河道型水库。长江流域可分为上游、中游和下游三部分,分别以湖北宜昌和江西九江为分界。长江流域支撑的长江经济带人口密集、工业集中、城市化水平高[18],污染物排放量超过全国的40%[19]。
-
长江流域2008—2018年水质数据来自于《中国生态环境状况公报 (2008-2018年) 》 (https://www.mee.gov.cn/hjzl/sthjzk/zghjzkgb/) 和《全国主要流域重点断面水质自动监测周报 (2008-2018年) 》 (https://www.mee.gov.cn/hjzl/sthjzk/zghjzkgb/) ,以下简称《水质监测周报》。其中,《中国生态环境状况公报》涉及的国考断面逐年增加,从2008年的103个增加到2018年的510个断面;《水质监测周报》报告的长江流域重点监控断面如图1所示,共21个站点。2008—2018年,各监控断面每周的DO、CODMn和NH3-N数据来自于《水质监测周报》,其中赤水鲢鱼溪、益阳万家嘴、常德坡头和沙河口站点的监测数据起始自2012年。2008—2018年,长江干流沿岸行政单位的城市环境基础设施建设投资与污水排放数据来自《中国环境统计年鉴 (2009-2019) 年》 (https://www.mee.gov.cn/hjzl/sthjzk/sthjtjnb/) 。研究区域图的底图来自地理空间数据云 (https://www.gscloud.cn/) ,流域边界数据来自http://120.26.232.88:6080/arcgis/rest/services/ROOT/QGSX/MapServer。相关统计计算使用Excel 2021软件进行,相关性分析采用SPSS 26软件进行,绘图分析使用Origin 2021软件进行。
-
2008—2018年,长江流域水质逐渐转好,以Ⅱ类水质为主。如图2 (a) 所示,对《中国生态环境状况公报》的数据进行统计计算后发现,2008—2018年间长江流域的国考断面中,Ⅰ~Ⅲ类水质所占比例增加1.9%,Ⅳ、Ⅴ类水质所占比例增加2.2%,劣Ⅴ类水质减少4.0%。2018年统计的510个国考断面中Ⅰ~Ⅲ水质达到87.5%,劣Ⅴ类水质占比已经减少到1.8%,水质呈现良好状态。在十大流域中,长江流域的Ⅰ~Ⅲ类水质占比位列第4,Ⅳ、Ⅴ类水质占比位列第7,劣Ⅴ类水质占比位列第7,水质总体位于十大流域前列,仅次于西北诸河流域和西南诸河流域的水质。水质呈现周期性阶梯形波动,波动的变化时间点与监测站点数量的变化时间点基本一致。由此可推测纳入监测的站点,水质逐年转好,这可能与后续的污染控制措施有关。
长江流域的重点断面在2008—2018年间水质良好,超标现象发生频率较低,水质有所提升。如图2 (b) 所示,各监控断面各周的水质构成主要为Ⅰ~Ⅲ类水,多年平均占比为94.7%,水质的变化主要是Ⅰ~Ⅲ类的相互转化。其中,Ⅰ类水质平均占比为17.2%,Ⅱ类水质平均占比为61.6%,Ⅲ类水质平均占比为15.8%。出现Ⅰ~Ⅲ类水质的周数从2008年占比92.5%增加到2018年的95.9%,增加了3.4%。其中,Ⅰ类水从18.9%降低到13.4%,Ⅱ类水从59.9%增加到69.9%,Ⅲ类水从13.7%降低到12.6%。Ⅳ、Ⅴ类超标水质出现的周数占比较低,多年平均占比为5.1%。Ⅳ、Ⅴ类水质出现的周数占比从7.4%降低到4.1%,减少了3.3%。其中,Ⅳ类水从6.7%降低到3.7%,Ⅴ类水从0.07%降低到0.03%,劣Ⅴ类水消失。
对2008—2018年重点监控断面每周水质的年内变化进行统计分析,结果见图2 (c) 。流域主要断面水质有较为明显的年内变化,夏季的水质劣于其它季节。7月的Ⅳ类水占比最高,约占8.74%,10月份Ⅳ类水占比最低,约占1.66%。7月的Ⅰ类水占比低于平均值约6.1%,Ⅱ类水比平均低5.0%,Ⅲ类水比平均高7.2%,Ⅳ类水比平均高4.6%。水质变化主要体现在夏季的Ⅰ类水占比减少,Ⅲ、Ⅳ类水占比增加。夏季Ⅳ类水占比较高的原因主要是DO较低,低DO的贡献断面主要为乐山岷江大桥、宜宾凉姜沟、长沙新港、南昌滁槎、九江蛤蟆石,其中出现频率最高的断面为南昌滁槎。
-
2008—2018年间,长江流域各重点监控断面的年DO平均值上升,高DO的断面数量增加。如图3 (a) 所示,2008年各监控断面的DO为5~11 mg∙L−1,平均值为7.81 mg∙L−1;2018年DO为6~10 mg∙L−1,平均值为8.39 mg∙L−1。长江流域的DO分布区间集中,平均值升高0.58 mg∙L−1。如图3 (d) 所示,年DO平均值大于地表水Ⅰ类标准 (7.5 mg∙L−1) 的断面占比逐年升高,到2018年已超过80%;2018年,年DO平均值高于7.5 mg∙L−1的断面比例比2008年高27%,而年DO平均值低于地表水Ⅱ类标准 (6 mg∙L−1) 的监控断面减少了21%。
各重点监控断面的CODMn有所波动,总体处于稳定状态。如图3 (b) ,长江流域各断面的CODMn为1.5~4.5 mg∙L−1,2008年的平均CODMn为2.15 mg∙L−1,2018年平均CODMn为2.32 mg∙L−1。如图3 (e) ,各断面年平均CODMn的变化趋势处于平稳状态,年平均CODMn基本处于Ⅱ类水限值内,均未超过地表水Ⅲ类限值。
各重点监控断面的NH3-N呈现下降趋势,且NH3-N波动范围缩小,高NH3-N的断面逐渐消失。如图3 (c) 所示,单个断面的最高NH3-N年平均值从2011年的1.22 mg∙L−1,降至2018年的0.67 mg∙L−1;每年的平均值从最高的0.27 mg∙L−1 (2011年) 降至0.23 mg∙L−1 (2018年) 。如图3 (f) 所示,年平均NH3-N处于Ⅱ类水质 (0.15~0.5 mg∙L−1) 区间内的断面数量增加,2018年比2008年增加7.8%;超过Ⅱ类水限值 (0.5 mg∙L−1) 的断面数量总体减少,2018年比2008年减少7.0%。这表明长江流域耗氧物质NH3-N水平在有效控制手段下处于稳定。有研究者通过M-K检验和R/S分析对长江流域地表水监测数据进行分析,预测2020年后的十余年间,NH3-N将持续降低[20]。此外,多年来NH3-N浓度超出Ⅱ类水标准 (0.5 mg∙L−1) 的监控断面位于四川岷江大桥和南昌滁槎。这些断面位于人口密集[21]和工业排放密集[22]的地区,NH3-N较高的原因可能与人类活动相关。
对各重点监控断面水质因子浓度的年内变化进行统计分析,发现水质因子的浓度表现出一定的季节变化趋势,其中DO和NH3-N的季节变化特征较为明显。如图3 (g) 所示,夏季的平均DO较低,在一年中表现为先降低后升高,7月的平均DO最低,为7.02 mg∙L−1,比各月平均DO低14.2%。夏季DO较低的原因可能是气温升高不利于水体复氧[23],DO低也是造成各断面夏季的水质低于其他季节的直接原因。如图3 (h) ,CODMn在一年间的变化幅度较小,各月平均值为2.10~2.41 mg∙L−1。如图3 (i) ,各断面的NH3-N分布表现为夏季最低,在一年中先降低后增加。6月的平均NH3-N最低,为0.20 mg∙L−1,比各月平均NH3-N低20.9%,且在夏季各断面NH3-N的离群点较少。这可能是由于夏季水温比其他季节高,微生物活性较强,硝化反应的速率较高[24-25],对水体自净有促进作用。
-
2008—2018年间长江流域主要监控断面的DO升高,且上游变化幅度最大。对比各重点监控断面2008年与2018年 (其中赤水鲇鱼溪、益阳万家嘴、常德坡头和沙河口断面监测数据的统计起始年为2012年) 的DO (图4) 。长江流域上游、中游、下游的平均DO分别升高了0.88 mg∙L−1,0.47 mg∙L−1和0.57 mg∙L−1。其中,上游DO升高最明显,平均增长率为12%,中游DO波动最剧烈。上游DO升高最为显著的断面为彭山岷江大桥 (1.87 mg∙L−1) ,增长比例为34%;中游DO升高最为显著的断面为常德沙河口断面 (1.61 mg∙L−1) ,增长比例为24%;下游DO升高最显著的断面为南京林山断面 (1.49 mg∙L−1) ,增长比例为22%。2018年,上游平均DO为8.59 mg∙L−1,中游平均DO为8.31 mg∙L−1,下游平均DO为8.15 mg∙L−1。
各断面的整体CODMn水平有所上升,变化最显著的区域是长江流域中游。上游、中游和下游的平均CODMn分别变化了0.19 mg∙L−1、0.60 mg∙L−1、-0.01 mg∙L−1。其中,上游重庆朱沱断面CODMn增加最多 (0.83 mg∙L−1) ,增加48%,南津关断面下降最多 (0.80 mg∙L−1) ,下降34%;中游CODMn升高最多的是常德坡头断面 (1.58 mg∙L−1) ,增加161%;下游三江营断面下降0.75 mg∙L−1,下降25%。长江流域的CODMn长期处于较低状态,2018年上游的平均CODMn为2.12 mg∙L−1,中游的平均CODMn为2.44 mg∙L−1,下游的平均CODMn为2.45 mg∙L−1。虽然长时间跨度以来有所波动,但处于地表水环境质量标准的Ⅲ类限值以内,表现出水质的稳定性和安全性。
各断面的NH3-N都有所降低,且长江中游最为显著。2018年上游、中游和下游的年平均NH3-N分别比2008年变化了-0.02 mg∙L−1、-0.09 mg∙L−1和-0.05 mg∙L−1。其中,上游降低最多的断面为乐山岷江大桥 (0.19 mg∙L−1) ,降低了42%;中游降低最多的断面为长沙新港 (0.45 mg∙L−1) ,降低了77%;下游下降最多的断面为扬州三江营 (0.16 mg∙L−1) ,下降了47%。2018年上游的平均NH3-N为0.18 mg∙L−1,中游的平均NH3-N为0.29 mg∙L−1,下游的平均NH3-N为0.18 mg∙L−1。NH3-N的下降代表长江流域的水质在趋于稳定过程中逐渐转好,这可能与重点断面区域的污染物质排放限制措施有关[20]。
-
年DO平均值高于7.5 mg∙L−1的断面被认为是富氧河段,其水中溶解氧接近饱和状态[26],受CODMn和NH3-N变化影响小,将其剔除之后对DO与CODMn、NH3-N进行皮尔逊相关性分析(结果见图5)。DO与CODMn和NH3-N的数据均符合正态分布,双变量相关性p值均小于0.01,变量间有显著相关性。DO与NH3-N的浓度相关性系数均为负,DO与CODMn相关系数为-0.40,DO与NH3-N的相关系数为-0.44,CODMn和NH3-N的相关系数为0.36。CODMn与NH3-N呈现出线性相关关系,这可能是由于部分CODMn和NH3-N同为生活污水的点源排放[16]。DO与CODMn、NH3-N呈现出的相关系数均为负,这表明CODMn和NH3-N为长江流域的耗氧污染物。
长江流域各断面2018年的CODMn超出Ⅱ类水限值的周数为占比为4.08%,比最高的2013年下降了3.65%,超出Ⅲ类水限值的周数除2013年占比达到1.56%外,其余年份占比均小于1.00%。2018年NH3-N超出Ⅱ类水限值的周数最高占比为2010年,达到16.04%,2018年下降到占比为6.72%,减少了9.31%。超出Ⅲ类水限值的周数最高为2010年,占比达到6.19%,到2018年下降到1.05%,减少了5.14%。故CODMn常年处于较低水平,但NH3-N随时间变化较为明显。在研究时间段内,2013年以前出现高NH3-N的监控断面同时表现出相对较低DO,如乐山岷江大桥和南昌滁槎。到2018年,上述断面的年DO平均值有所升高,年平均NH3-N有所降低,也说明了DO与NH3-N相关系数为负,这是由于NH3-N的降低可能伴随耗氧量的降低[14]。但各重点断面2016—2018年仍出现高NH3-N (>0.5 mg∙L−1) ,这表明NH3-N对水质的恶化仍具有较大贡献[27],目前长江流域的主要耗氧污染物为NH3-N。
对比其他流域的耗氧污染,长江流域耗氧污染物浓度处于较低水平。海河流域2007—2011年间超标站点耗氧污染物浓度均值超出Ⅴ类标准1倍以上[15]。其中,NH3-N超标的站点比例达到18%,而长江流域耗氧污染物浓度均未超出V类水标准。但与海河流域相似,长江流域主要的耗氧污染物也已转变为NH3-N,且高浓度区域均为人口密集,经济活动高度发达区域[15]。
区域内的人类活动和经济发展水平将直接通过影响污染物排放[28]对水质产生影响,流域内污染负荷的贡献主要来自于人类活动,例如氮磷肥施肥、耕地灌溉[20]、工业排放、水电开发[29]、畜禽养殖[30]等。以目标污染物为核心的污染负荷削减对水质可起到稳定作用[31]。近年来,长江流域内CODMn和NH3-N超标断面的出现频率的减少与沿岸的污染治理投资和措施有关。如图6 (a) ,2008—2018年,全国环境污染治理投资总体上处于持续增加的状态,2018年全国环境污染治理投资比2008年增加约1倍,达到8 987.6亿元。其中城市环境基础设施建设投资是主要投资,2018年已经达到5 893.2亿元,比2008年增加4 092.2亿元;工业污染治理投资增加28.5%,到2018年已经达到697.5亿元。在全国环境污染治理投资逐年升高的背景下,2008—2018年长江干流沿线省市的城市环境基础设施建设投资呈现升高趋势,平均占全国的56%。城市环境基础设施建设投资中,对排水和绿化的投资占主要地位,长江流域内的污水排放量因此呈现减少的趋势。长江流域污水排放及处理情况如图6 (b) 所示,在2008—2018年间,长江干流沿线省市的城市污水排放总量和平均城市污水处理率逐年升高,2018年的污水排放总量比2008年增加37.9%;平均污水处理率增加23.3%,到2018年已经达到95.7%。污水处理率的明显升高意味着未处理污水量减少,2018年的未处理污水量比2008年减少了77.8%,海河流域耗氧污染物浓度得到控制也与污水处理率提高有直接联系[15]。由此可见,持续的污染治理投资和污水减排对长江流域水质好转有重要作用,流域耗氧污染得到有效控制,且耗氧污染物以NH3-N为主。相关研究结果对未来长江流域的水环境管理与相关控制对策制定具有重要参考意义。
-
1) 长江流域各重点断面水质良好,2008—2018年间稳步上升,水质由Ⅳ和Ⅴ类向Ⅱ和Ⅲ类转变,Ⅰ~Ⅲ类水质占比之和增加了3.4%,劣Ⅴ类水质趋于消失。水质表现出季节性,夏季水质劣于其他季节,表现在Ⅰ、Ⅱ类水占比减少,Ⅲ、Ⅳ类水占比增加,水质变差的原因是DO较低。
2) 2008—2018年,长江流域各重点监控断面整体的DO升高0.58 mg∙L−1,浓度区间集中;CODMn多年来稳定处于Ⅲ类水限值内;各重点监控断面NH3-N浓度下降0.04 mg∙L−1,年平均NH3-N极端值从1.22 mg∙L−1下降到0.67 mg∙L−1。DO变化最大的区域为上游,CODMn和NH3-N变化最大的为中游。
3) 相关性分析表明,DO恢复与NH3-N得到控制密切相关,DO和NH3-N的变化主要体现在高NH3-N下降导致低DO恢复的断面。在环境污染治理投资取得污水减排成效后,长江流域CODMn和NH3-N指标逐步好转,也成为流域重点断面水中溶解氧恢复的主要驱动力。
基于溶解氧和耗氧污染物变化的长江流域水质改善过程分析 (2008—2018年)
Recovery process analysis of water quality in the Yangtze River Basin based on changes of dissolved oxygen and oxygen-consuming substances (2008-2018)
-
摘要: 长江流域以21%国土面积承载了我国40%以上的人口和经济总量。基于长江流域水质监测数据,利用统计和相关性分析方法,分析了长江流域重点断面溶解氧 (DO) 和耗氧污染物 (CODMn和NH3-N) 指标的多年时空变化趋势,探讨了流域水质恢复规律和特征。结果表明:在2008—2018年,长江流域水体的水质整体上呈现好转趋势,重点断面中Ⅰ~Ⅲ类水质占比之和上升,达到95.9%,增加了3.4%。其中,在重点监控断面中年DO平均值逐年升高,大于7.5 mg∙L−1的断面数量占比2018年已经达到85.7%,长江上游区域增加最为明显;年CODMn平均值稳定处于Ⅲ类水限值内;年NH3-N平均值呈现下降趋势,优于地表水Ⅱ类水质标准值 (< 0.5 mg∙L−1) 的断面数量占比已经达到95.2%,下游下降最为明显 (下降13%) 。相关性分析结果表明,DO与CODMn和NH3-N均呈负相关,相关系数分别为−0.40和−0.44;CODMn和NH3-N呈正相关,相关系数为0.36,NH3-N已成为长江流域水体主要耗氧污染物。长江流域水体DO恢复与耗氧污染物减排密切相关,尤其是对高浓度NH3-N的控制。长江干流沿线省市的城市环境基础设施投资多年平均占比超过全国的50%,2018年的污水排放量比2008年增加37.9%,平均污水处理率增加23.3%,未处理污水量减少了77.8%。本研究结果表明,长江流域水体耗氧污染得到有效控制,干流水质呈现逐步好转态势,可为制定长江流域污染物控制目标提供参考。Abstract: The Yangtze River basin, with 21% of its land area supporting more than 40% of China's population and economic aggregate, plays an important role. The temporal and spatial trends of dissolved oxygen (DO) and oxygen consuming pollutants (CODMn and NH3-N) of the Yangtze River Basin were studied, and the process of water quality restoration was analyzed through statistics and correlation analysis. The results showed that from 2008 to 2018, the overall water quality of the Yangtze River Basin showed an improvement trend year by year. The total proportion of class Ⅰ~Ⅲ water quality in key sections increased to 95.9%, increasing by 3.4%. Among them, the annual average concentration of DO in key sections increased, and the number of sections greater than 7.5 mg∙L−1 accounted for 85.7% in 2018, with the most obvious increase in the upstream. The annual average concentration of CODMn was stable within the limit of class Ⅲ water. The average annual concentration of NH3-N showed a downward trend, and the proportion of sections lower than 0.5 mg∙L−1 reached 95.2%, with the most obvious decrease (13%) in the downstream. Correlation analysis showed that DO was negatively correlated with CODMn and NH3-N, with correlation coefficients of −0.40 and −0.44, respectively. CODMn was positively correlated with NH3-N, and the correlation coefficient was 0.36. NH3-N had become the main oxygen consumption pollutant in the water body of the Yangtze River Basin. Water DO recovery in the Yangtze River Basin was closely related to the reduction of oxygen consumption pollutants, especially the control of high concentration of NH3-N. Investment in urban environmental infrastructure in the Yangtze River Basin has accounted for more than 50% of the total country emission on average for many years. In 2018, urban sewage discharge in the Yangtze River Basin was 37.9% higher than that in 2008, the average sewage treatment rate increased by 23.3 percent, and the amount of untreated sewage decreased by 77.8 percent. Therefore, with the progress of water pollution control and treatment in China, oxygen pollution in the main water bodies of the Yangtze River basin has been effectively controlled and water quality has shown gradual improvement accordingly.
-
Key words:
- the Yangtze River Basin /
- water quality /
- DO /
- CODMn /
- NH3-N /
- water pollution control
-
长江流域是中国第一大流域,覆盖19个省级行政单位,以21%的国土面积承载了全国的40%的人口和经济总量[1-2]。长江流域的中下游人口密度、经济发展程度在改革开放以来均位居我国前列,随之而来的环境压力也不容忽视。随着经济高速发展,排放到长江的污染物总量和强度都在逐年上升,排放到长江的污水量同样占到全国污水总量的40%[1]。长江及其支流监控断面主要水质因子为高锰酸盐指数 (CODMn) 、氨氮 (NH3-N) 等耗氧物质[3]。根据《中国生态环境统计年报》,2008年长江流域接纳的COD和NH3-N负荷分别占到全国的40.2%和40.9%;到2020年,COD和NH3-N负荷仍然分别占据全国的37.3%和42.8%,长江流域的污染排放强度长期以来达到全国平均水平的1.5~2倍[1]。高强度污染物排放,造成长江流域水体耗氧物质的浓度升高[4],溶解氧 (dissolved oxygen, DO) 下降。
DO是地表水监控的基本指标,对于维持水生生态系统正常功能具有重要意义[5]。空气中的氧气溶解和水生植物的光合作用是补充水中DO的主要途径。大气溶氧主要受到气压、温度、水体盐度的影响,此外流量增加也有利于DO恢复[6]。人口密度高、工业发达区域排放的大量有机物质和氮磷含量高的污水进入受纳水体后,一方面会带来营养物质不断积累,引起浮游植物和藻类吸收NH3-N大量生长繁殖[7],造成水体底部造成缺氧,水体富营养化愈演愈烈[8];另一方面,NH3-N和有机物等耗氧物质进入水体后,NH3-N的硝化过程,有机物的降解过程会消耗大量溶解氧[9]。低DO状态的水体中,水质的变化还会引起沉积物中NH3-N的释放[10]。此外,DO低于3 mg∙L−1的缺氧水体会对水体中鱼类的呼吸作用产生影响,抑制鱼类的基因表达,从而导致鱼类和甲壳动物的死亡[11-12],进而破坏生态系统的稳定性和生物多样性。
伴随着长江流域中下游人口和用水量的激增,给水处理系统造成巨大压力,也意味着流域内大量污水排入长江[13]。随污水排放的耗氧污染物导致的水环境危机在流域经济快速发展的过程中已有显现,DO较低、CODMn和NH3-N负荷高为水体恶化的标志[14-15],CODMn和NH3-N与地表水的水质密切相关[16]。为探求长江流域多年的水质变化及其主要原因,本研究利用长江流域2008至2018年间重点监测断面的DO、CODMn和NH3-N质量浓度数据,分析了长江流域重点河段监控断面的DO以及耗氧污染物CODMn和NH3-N的时空变化特征,结合对沿岸污水排放数据的统计和相关性分析,探讨水质变化的关键驱动因素,总结长江流域过去的水污染防治成果,为制定未来的污染物控制目标制定提供参考。
1. 研究区域及数据分析
1.1 研究区概况
长江流域的范围位于东经90°~122°,北纬24°~36°,是中国覆盖面积最广的大河流域,干流横贯的省级行政单位数量达到11个,整个流域覆盖19个省、直辖市和自治区 (图1) ,为世界第三大流域[17]。长江西起青藏高原唐古拉山脉,东至上海市汇入东海,全长6 300 km,拥有复杂的支流和湖泊系统。长江的主要支流有雅砻江、岷江、沱江、嘉陵江、汉江、湘江、资江、沅江、澧水、赣江等;主要的湖泊包括我国五大淡水湖泊中的4个 (鄱阳湖、洞庭湖、太湖和巢湖) 。此外,长江流域还建有三峡水库这一世界最大河道型水库。长江流域可分为上游、中游和下游三部分,分别以湖北宜昌和江西九江为分界。长江流域支撑的长江经济带人口密集、工业集中、城市化水平高[18],污染物排放量超过全国的40%[19]。
1.2 数据来源
长江流域2008—2018年水质数据来自于《中国生态环境状况公报 (2008-2018年) 》 (https://www.mee.gov.cn/hjzl/sthjzk/zghjzkgb/) 和《全国主要流域重点断面水质自动监测周报 (2008-2018年) 》 (https://www.mee.gov.cn/hjzl/sthjzk/zghjzkgb/) ,以下简称《水质监测周报》。其中,《中国生态环境状况公报》涉及的国考断面逐年增加,从2008年的103个增加到2018年的510个断面;《水质监测周报》报告的长江流域重点监控断面如图1所示,共21个站点。2008—2018年,各监控断面每周的DO、CODMn和NH3-N数据来自于《水质监测周报》,其中赤水鲢鱼溪、益阳万家嘴、常德坡头和沙河口站点的监测数据起始自2012年。2008—2018年,长江干流沿岸行政单位的城市环境基础设施建设投资与污水排放数据来自《中国环境统计年鉴 (2009-2019) 年》 (https://www.mee.gov.cn/hjzl/sthjzk/sthjtjnb/) 。研究区域图的底图来自地理空间数据云 (https://www.gscloud.cn/) ,流域边界数据来自http://120.26.232.88:6080/arcgis/rest/services/ROOT/QGSX/MapServer。相关统计计算使用Excel 2021软件进行,相关性分析采用SPSS 26软件进行,绘图分析使用Origin 2021软件进行。
2. 结果与讨论
2.1 长江流域多年水质变化态势分析
2008—2018年,长江流域水质逐渐转好,以Ⅱ类水质为主。如图2 (a) 所示,对《中国生态环境状况公报》的数据进行统计计算后发现,2008—2018年间长江流域的国考断面中,Ⅰ~Ⅲ类水质所占比例增加1.9%,Ⅳ、Ⅴ类水质所占比例增加2.2%,劣Ⅴ类水质减少4.0%。2018年统计的510个国考断面中Ⅰ~Ⅲ水质达到87.5%,劣Ⅴ类水质占比已经减少到1.8%,水质呈现良好状态。在十大流域中,长江流域的Ⅰ~Ⅲ类水质占比位列第4,Ⅳ、Ⅴ类水质占比位列第7,劣Ⅴ类水质占比位列第7,水质总体位于十大流域前列,仅次于西北诸河流域和西南诸河流域的水质。水质呈现周期性阶梯形波动,波动的变化时间点与监测站点数量的变化时间点基本一致。由此可推测纳入监测的站点,水质逐年转好,这可能与后续的污染控制措施有关。
长江流域的重点断面在2008—2018年间水质良好,超标现象发生频率较低,水质有所提升。如图2 (b) 所示,各监控断面各周的水质构成主要为Ⅰ~Ⅲ类水,多年平均占比为94.7%,水质的变化主要是Ⅰ~Ⅲ类的相互转化。其中,Ⅰ类水质平均占比为17.2%,Ⅱ类水质平均占比为61.6%,Ⅲ类水质平均占比为15.8%。出现Ⅰ~Ⅲ类水质的周数从2008年占比92.5%增加到2018年的95.9%,增加了3.4%。其中,Ⅰ类水从18.9%降低到13.4%,Ⅱ类水从59.9%增加到69.9%,Ⅲ类水从13.7%降低到12.6%。Ⅳ、Ⅴ类超标水质出现的周数占比较低,多年平均占比为5.1%。Ⅳ、Ⅴ类水质出现的周数占比从7.4%降低到4.1%,减少了3.3%。其中,Ⅳ类水从6.7%降低到3.7%,Ⅴ类水从0.07%降低到0.03%,劣Ⅴ类水消失。
对2008—2018年重点监控断面每周水质的年内变化进行统计分析,结果见图2 (c) 。流域主要断面水质有较为明显的年内变化,夏季的水质劣于其它季节。7月的Ⅳ类水占比最高,约占8.74%,10月份Ⅳ类水占比最低,约占1.66%。7月的Ⅰ类水占比低于平均值约6.1%,Ⅱ类水比平均低5.0%,Ⅲ类水比平均高7.2%,Ⅳ类水比平均高4.6%。水质变化主要体现在夏季的Ⅰ类水占比减少,Ⅲ、Ⅳ类水占比增加。夏季Ⅳ类水占比较高的原因主要是DO较低,低DO的贡献断面主要为乐山岷江大桥、宜宾凉姜沟、长沙新港、南昌滁槎、九江蛤蟆石,其中出现频率最高的断面为南昌滁槎。
2.2 长江流域关键水质因子时空特征分析
2.2.1 DO、CODMn和NH3-N随时间变化特征
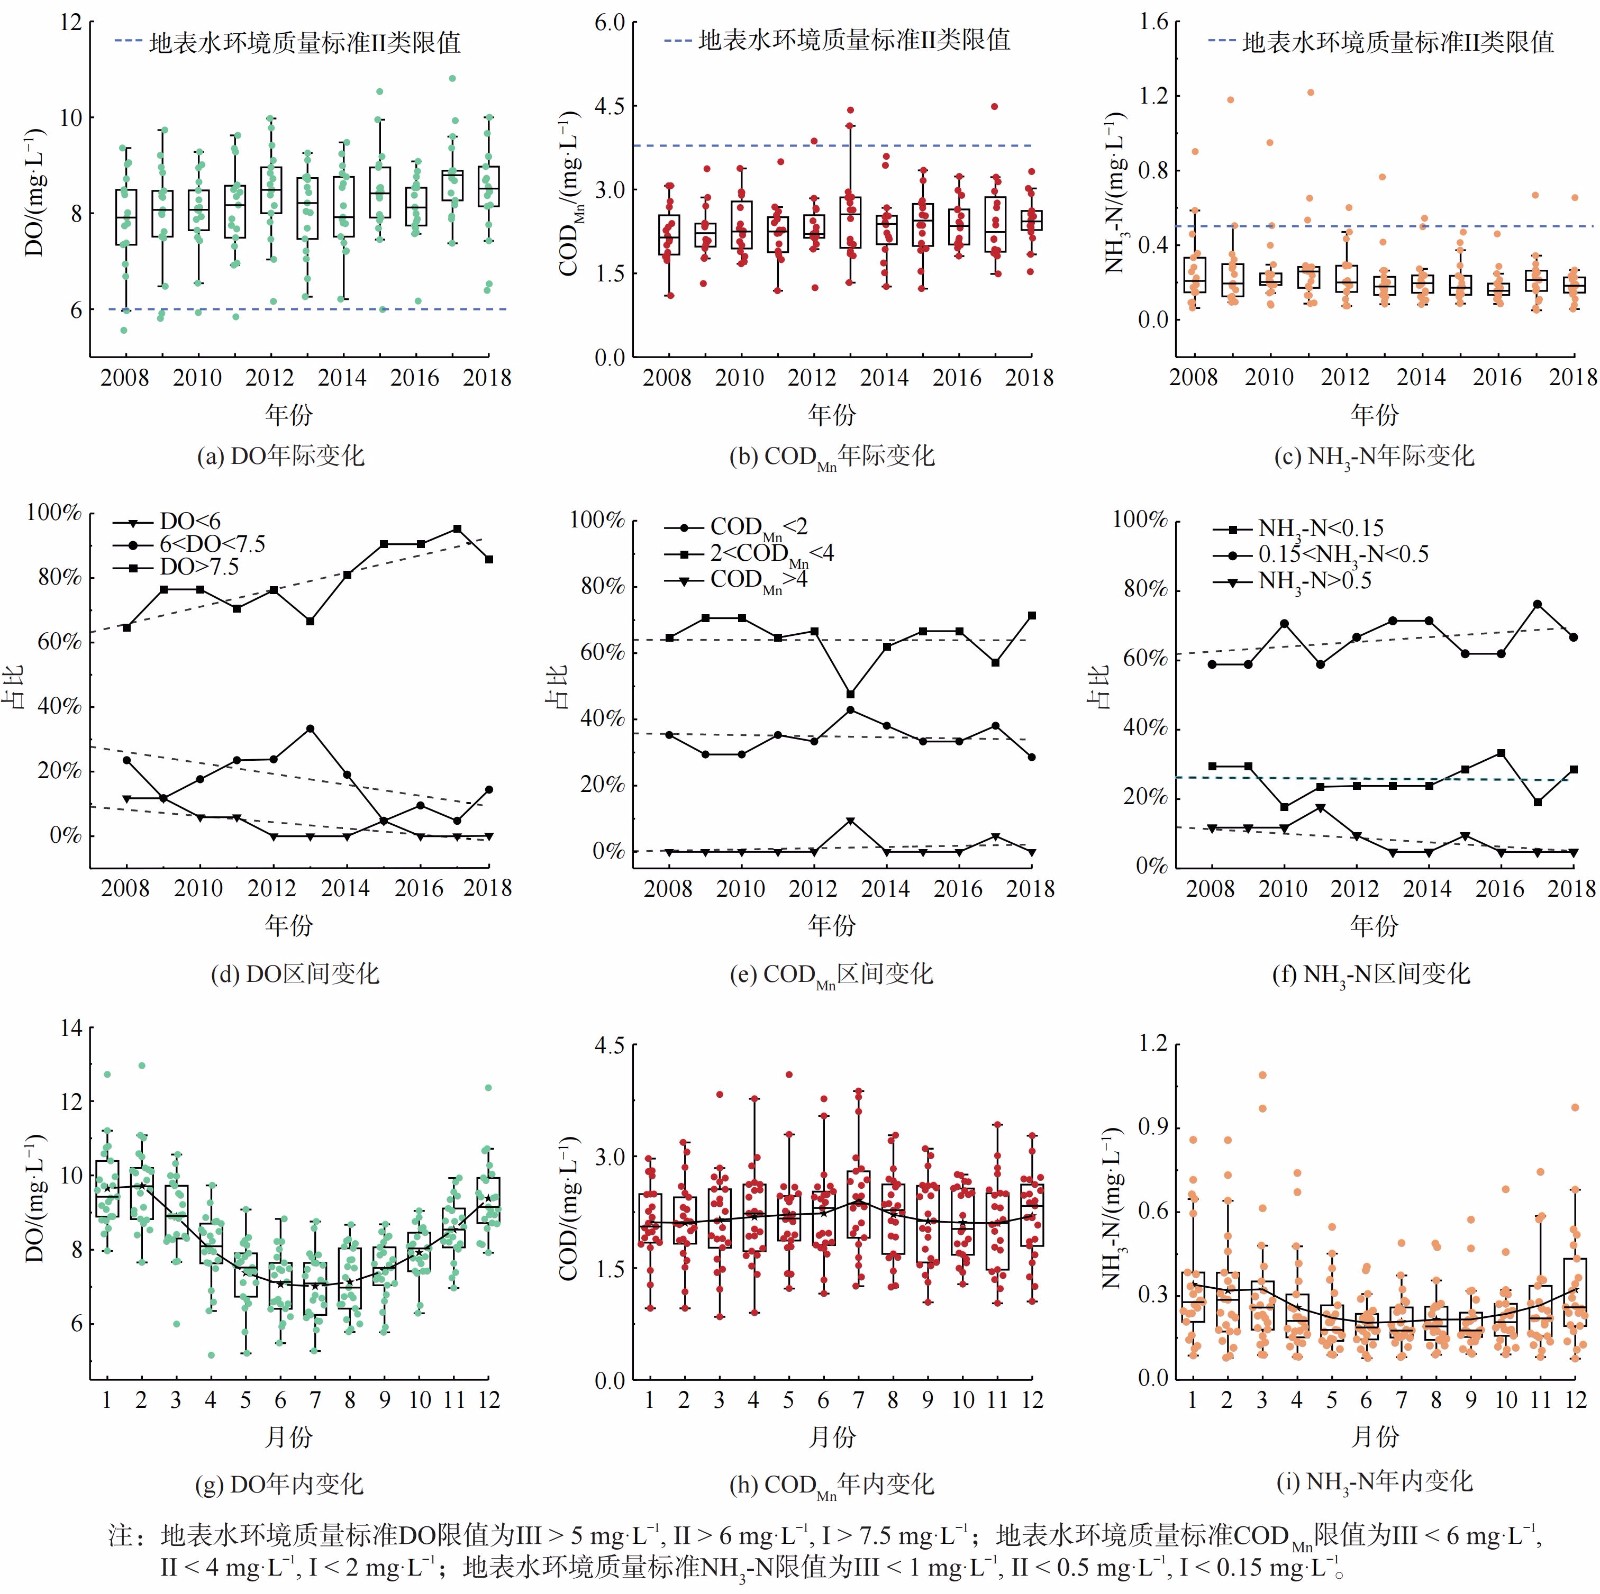
2008—2018年间,长江流域各重点监控断面的年DO平均值上升,高DO的断面数量增加。如图3 (a) 所示,2008年各监控断面的DO为5~11 mg∙L−1,平均值为7.81 mg∙L−1;2018年DO为6~10 mg∙L−1,平均值为8.39 mg∙L−1。长江流域的DO分布区间集中,平均值升高0.58 mg∙L−1。如图3 (d) 所示,年DO平均值大于地表水Ⅰ类标准 (7.5 mg∙L−1) 的断面占比逐年升高,到2018年已超过80%;2018年,年DO平均值高于7.5 mg∙L−1的断面比例比2008年高27%,而年DO平均值低于地表水Ⅱ类标准 (6 mg∙L−1) 的监控断面减少了21%。
各重点监控断面的CODMn有所波动,总体处于稳定状态。如图3 (b) ,长江流域各断面的CODMn为1.5~4.5 mg∙L−1,2008年的平均CODMn为2.15 mg∙L−1,2018年平均CODMn为2.32 mg∙L−1。如图3 (e) ,各断面年平均CODMn的变化趋势处于平稳状态,年平均CODMn基本处于Ⅱ类水限值内,均未超过地表水Ⅲ类限值。
各重点监控断面的NH3-N呈现下降趋势,且NH3-N波动范围缩小,高NH3-N的断面逐渐消失。如图3 (c) 所示,单个断面的最高NH3-N年平均值从2011年的1.22 mg∙L−1,降至2018年的0.67 mg∙L−1;每年的平均值从最高的0.27 mg∙L−1 (2011年) 降至0.23 mg∙L−1 (2018年) 。如图3 (f) 所示,年平均NH3-N处于Ⅱ类水质 (0.15~0.5 mg∙L−1) 区间内的断面数量增加,2018年比2008年增加7.8%;超过Ⅱ类水限值 (0.5 mg∙L−1) 的断面数量总体减少,2018年比2008年减少7.0%。这表明长江流域耗氧物质NH3-N水平在有效控制手段下处于稳定。有研究者通过M-K检验和R/S分析对长江流域地表水监测数据进行分析,预测2020年后的十余年间,NH3-N将持续降低[20]。此外,多年来NH3-N浓度超出Ⅱ类水标准 (0.5 mg∙L−1) 的监控断面位于四川岷江大桥和南昌滁槎。这些断面位于人口密集[21]和工业排放密集[22]的地区,NH3-N较高的原因可能与人类活动相关。
对各重点监控断面水质因子浓度的年内变化进行统计分析,发现水质因子的浓度表现出一定的季节变化趋势,其中DO和NH3-N的季节变化特征较为明显。如图3 (g) 所示,夏季的平均DO较低,在一年中表现为先降低后升高,7月的平均DO最低,为7.02 mg∙L−1,比各月平均DO低14.2%。夏季DO较低的原因可能是气温升高不利于水体复氧[23],DO低也是造成各断面夏季的水质低于其他季节的直接原因。如图3 (h) ,CODMn在一年间的变化幅度较小,各月平均值为2.10~2.41 mg∙L−1。如图3 (i) ,各断面的NH3-N分布表现为夏季最低,在一年中先降低后增加。6月的平均NH3-N最低,为0.20 mg∙L−1,比各月平均NH3-N低20.9%,且在夏季各断面NH3-N的离群点较少。这可能是由于夏季水温比其他季节高,微生物活性较强,硝化反应的速率较高[24-25],对水体自净有促进作用。
2.2.2 DO、CODMn和NH3-N随空间变化特征
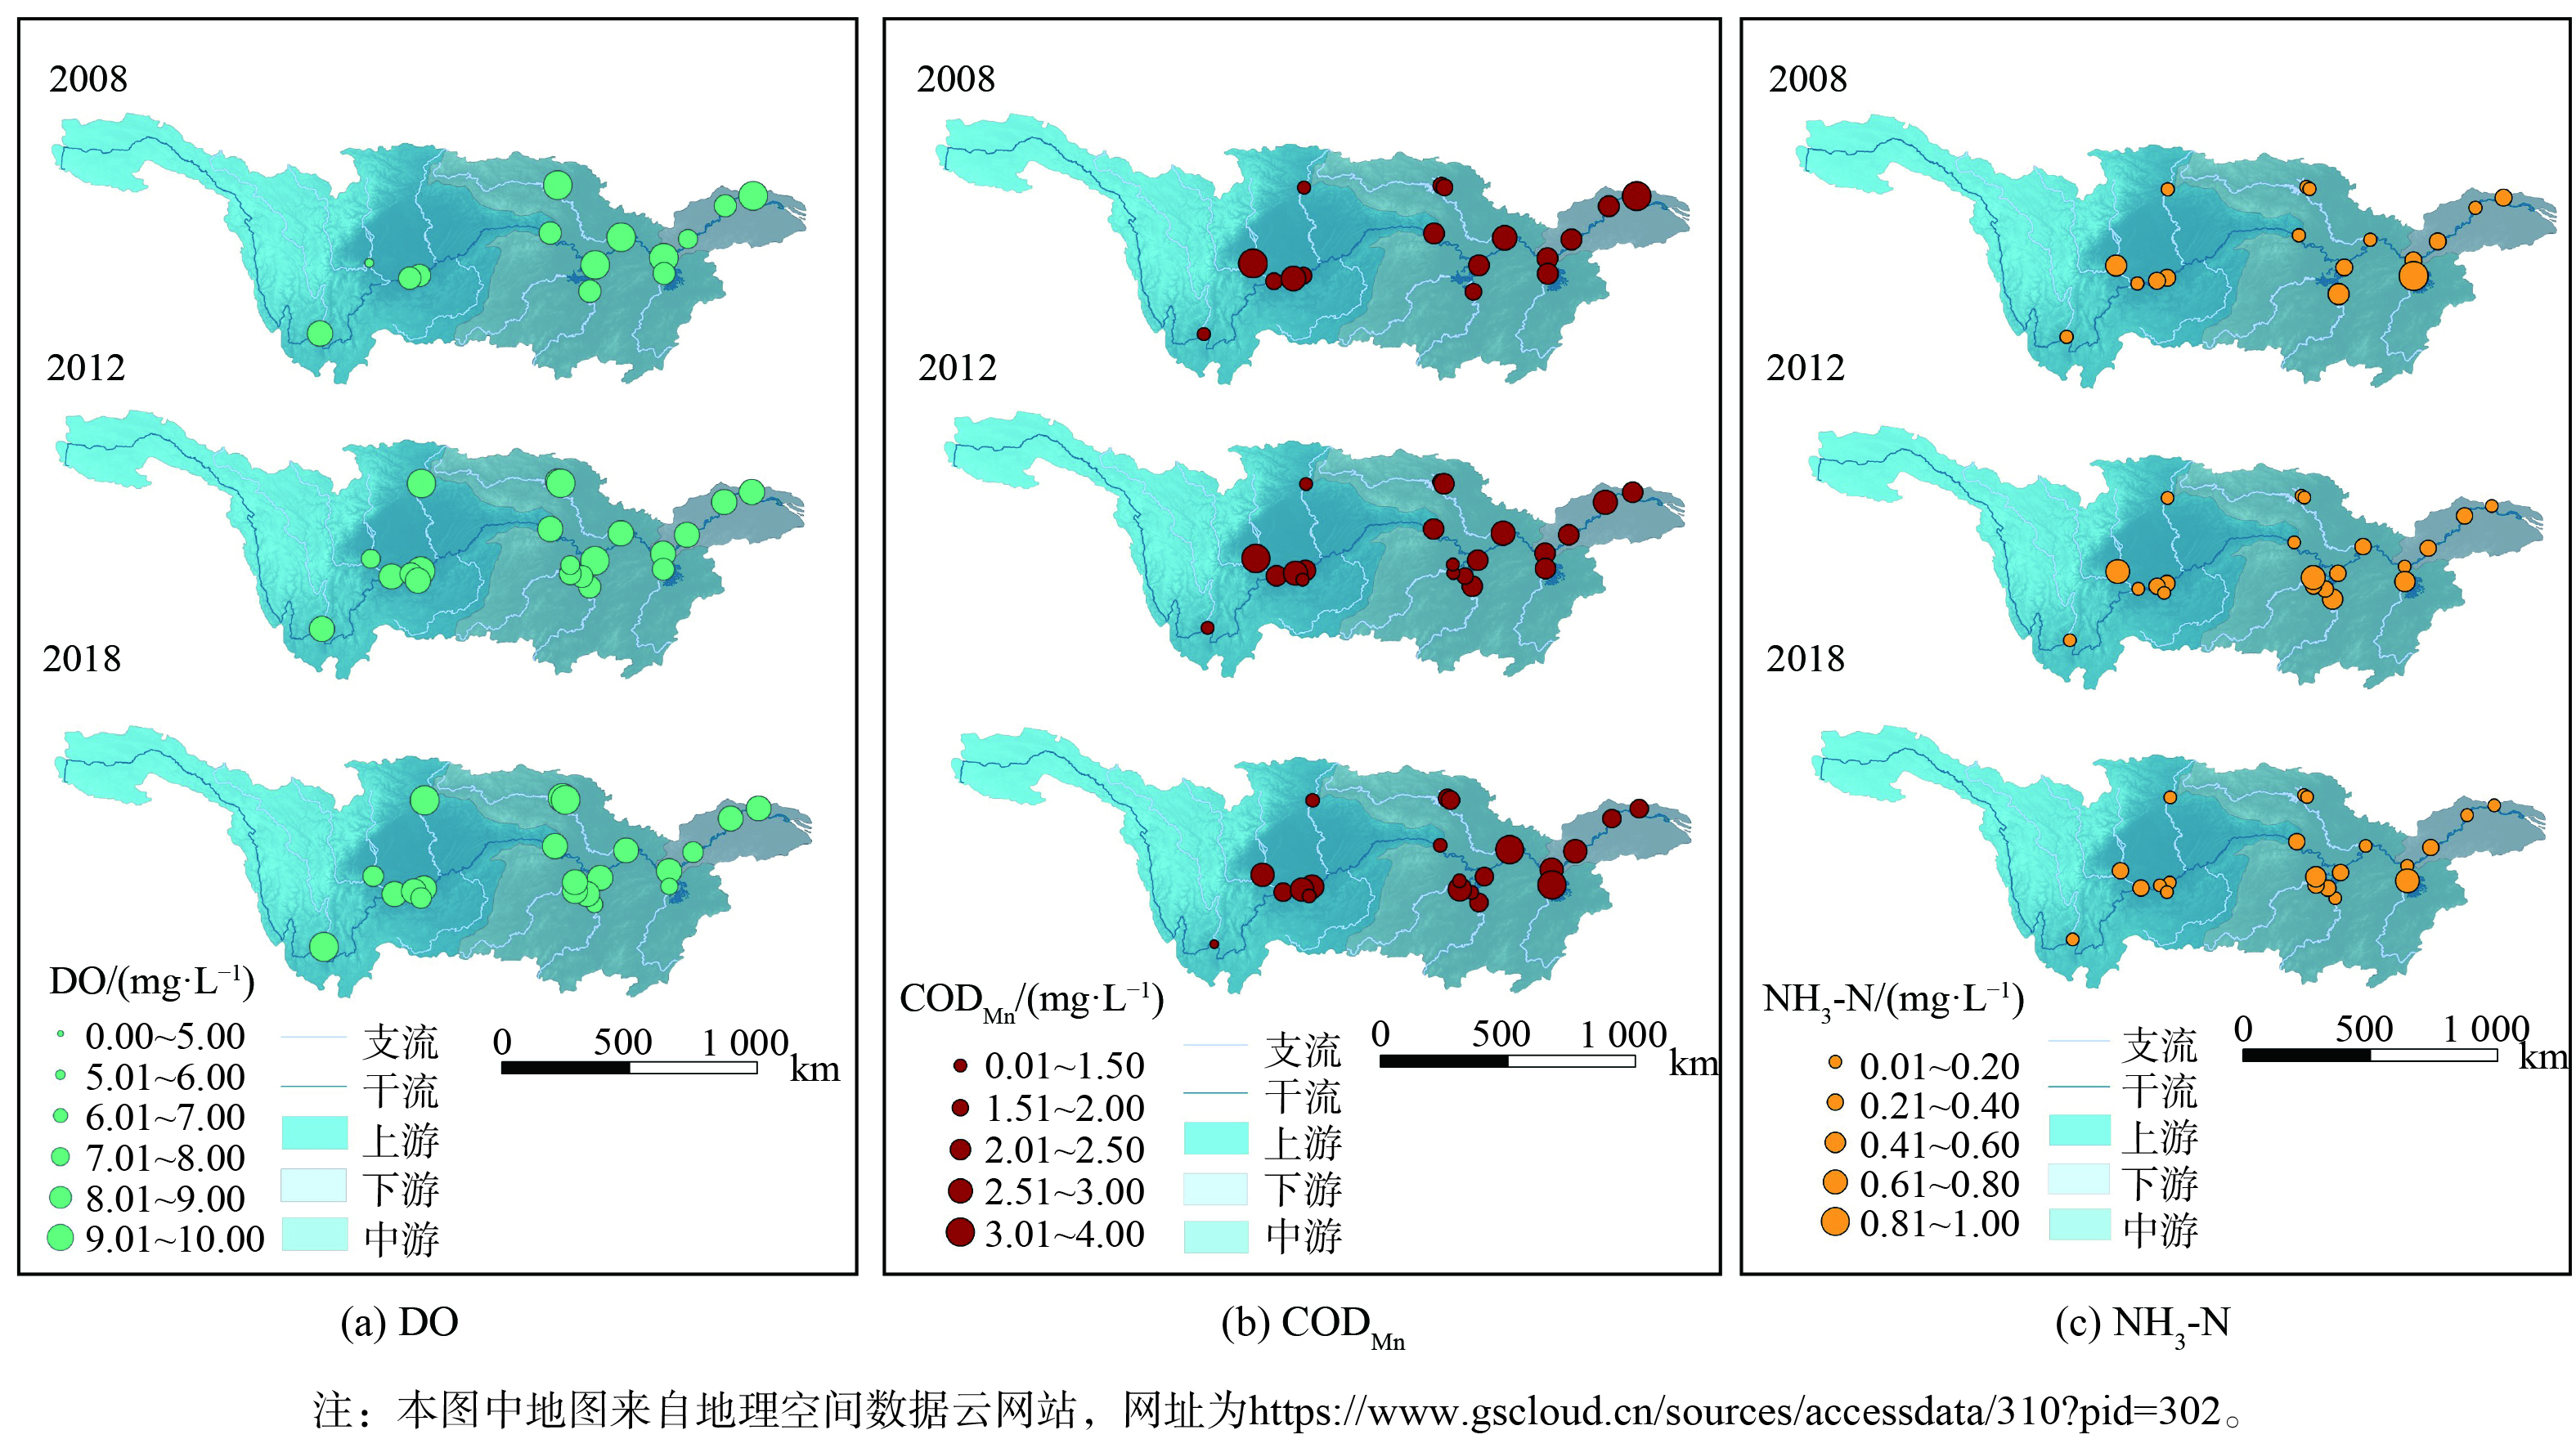
2008—2018年间长江流域主要监控断面的DO升高,且上游变化幅度最大。对比各重点监控断面2008年与2018年 (其中赤水鲇鱼溪、益阳万家嘴、常德坡头和沙河口断面监测数据的统计起始年为2012年) 的DO (图4) 。长江流域上游、中游、下游的平均DO分别升高了0.88 mg∙L−1,0.47 mg∙L−1和0.57 mg∙L−1。其中,上游DO升高最明显,平均增长率为12%,中游DO波动最剧烈。上游DO升高最为显著的断面为彭山岷江大桥 (1.87 mg∙L−1) ,增长比例为34%;中游DO升高最为显著的断面为常德沙河口断面 (1.61 mg∙L−1) ,增长比例为24%;下游DO升高最显著的断面为南京林山断面 (1.49 mg∙L−1) ,增长比例为22%。2018年,上游平均DO为8.59 mg∙L−1,中游平均DO为8.31 mg∙L−1,下游平均DO为8.15 mg∙L−1。
各断面的整体CODMn水平有所上升,变化最显著的区域是长江流域中游。上游、中游和下游的平均CODMn分别变化了0.19 mg∙L−1、0.60 mg∙L−1、-0.01 mg∙L−1。其中,上游重庆朱沱断面CODMn增加最多 (0.83 mg∙L−1) ,增加48%,南津关断面下降最多 (0.80 mg∙L−1) ,下降34%;中游CODMn升高最多的是常德坡头断面 (1.58 mg∙L−1) ,增加161%;下游三江营断面下降0.75 mg∙L−1,下降25%。长江流域的CODMn长期处于较低状态,2018年上游的平均CODMn为2.12 mg∙L−1,中游的平均CODMn为2.44 mg∙L−1,下游的平均CODMn为2.45 mg∙L−1。虽然长时间跨度以来有所波动,但处于地表水环境质量标准的Ⅲ类限值以内,表现出水质的稳定性和安全性。
各断面的NH3-N都有所降低,且长江中游最为显著。2018年上游、中游和下游的年平均NH3-N分别比2008年变化了-0.02 mg∙L−1、-0.09 mg∙L−1和-0.05 mg∙L−1。其中,上游降低最多的断面为乐山岷江大桥 (0.19 mg∙L−1) ,降低了42%;中游降低最多的断面为长沙新港 (0.45 mg∙L−1) ,降低了77%;下游下降最多的断面为扬州三江营 (0.16 mg∙L−1) ,下降了47%。2018年上游的平均NH3-N为0.18 mg∙L−1,中游的平均NH3-N为0.29 mg∙L−1,下游的平均NH3-N为0.18 mg∙L−1。NH3-N的下降代表长江流域的水质在趋于稳定过程中逐渐转好,这可能与重点断面区域的污染物质排放限制措施有关[20]。
2.3 长江流域水质关键影响因素分析
年DO平均值高于7.5 mg∙L−1的断面被认为是富氧河段,其水中溶解氧接近饱和状态[26],受CODMn和NH3-N变化影响小,将其剔除之后对DO与CODMn、NH3-N进行皮尔逊相关性分析(结果见图5)。DO与CODMn和NH3-N的数据均符合正态分布,双变量相关性p值均小于0.01,变量间有显著相关性。DO与NH3-N的浓度相关性系数均为负,DO与CODMn相关系数为-0.40,DO与NH3-N的相关系数为-0.44,CODMn和NH3-N的相关系数为0.36。CODMn与NH3-N呈现出线性相关关系,这可能是由于部分CODMn和NH3-N同为生活污水的点源排放[16]。DO与CODMn、NH3-N呈现出的相关系数均为负,这表明CODMn和NH3-N为长江流域的耗氧污染物。
长江流域各断面2018年的CODMn超出Ⅱ类水限值的周数为占比为4.08%,比最高的2013年下降了3.65%,超出Ⅲ类水限值的周数除2013年占比达到1.56%外,其余年份占比均小于1.00%。2018年NH3-N超出Ⅱ类水限值的周数最高占比为2010年,达到16.04%,2018年下降到占比为6.72%,减少了9.31%。超出Ⅲ类水限值的周数最高为2010年,占比达到6.19%,到2018年下降到1.05%,减少了5.14%。故CODMn常年处于较低水平,但NH3-N随时间变化较为明显。在研究时间段内,2013年以前出现高NH3-N的监控断面同时表现出相对较低DO,如乐山岷江大桥和南昌滁槎。到2018年,上述断面的年DO平均值有所升高,年平均NH3-N有所降低,也说明了DO与NH3-N相关系数为负,这是由于NH3-N的降低可能伴随耗氧量的降低[14]。但各重点断面2016—2018年仍出现高NH3-N (>0.5 mg∙L−1) ,这表明NH3-N对水质的恶化仍具有较大贡献[27],目前长江流域的主要耗氧污染物为NH3-N。
对比其他流域的耗氧污染,长江流域耗氧污染物浓度处于较低水平。海河流域2007—2011年间超标站点耗氧污染物浓度均值超出Ⅴ类标准1倍以上[15]。其中,NH3-N超标的站点比例达到18%,而长江流域耗氧污染物浓度均未超出V类水标准。但与海河流域相似,长江流域主要的耗氧污染物也已转变为NH3-N,且高浓度区域均为人口密集,经济活动高度发达区域[15]。
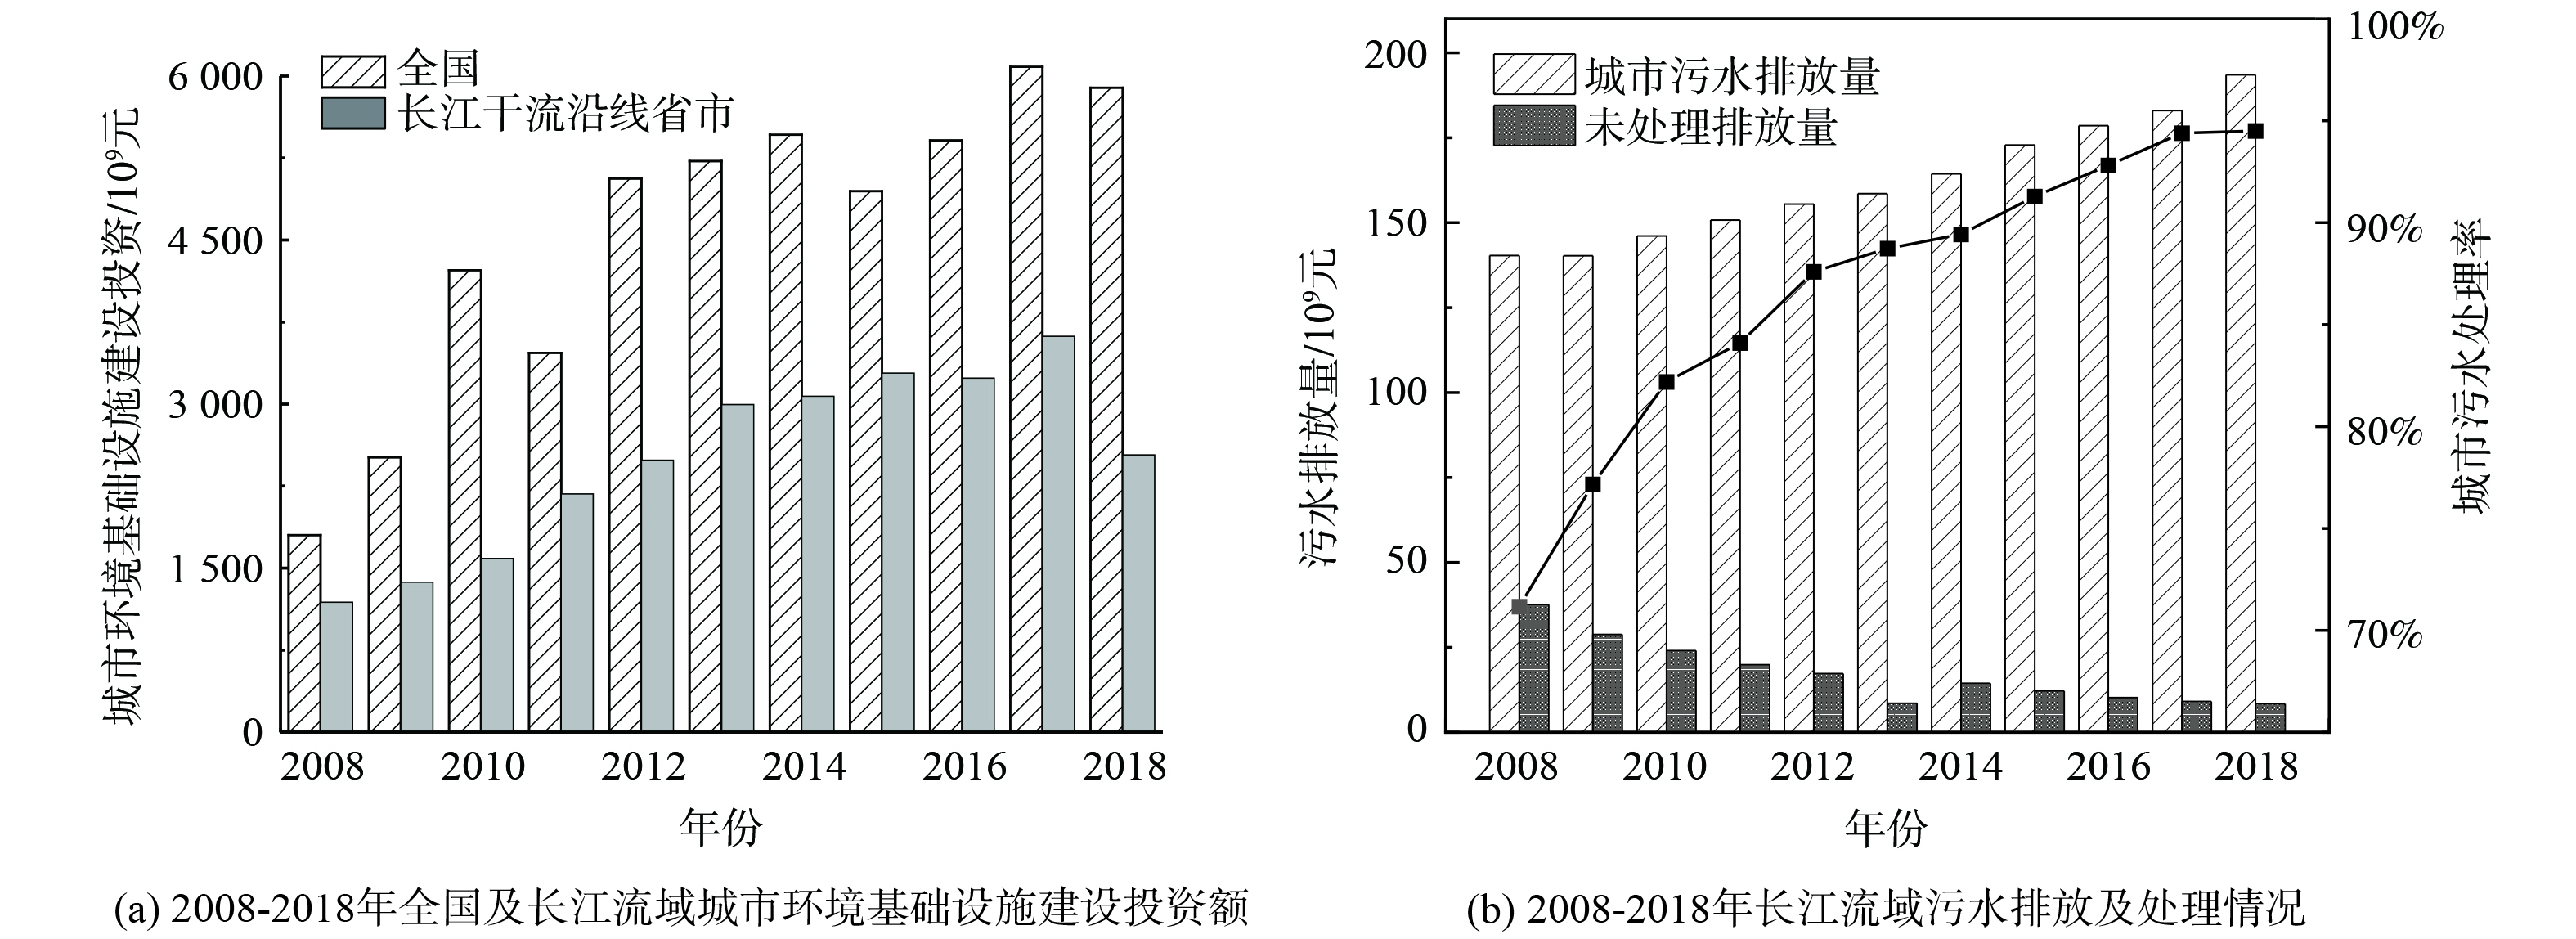
区域内的人类活动和经济发展水平将直接通过影响污染物排放[28]对水质产生影响,流域内污染负荷的贡献主要来自于人类活动,例如氮磷肥施肥、耕地灌溉[20]、工业排放、水电开发[29]、畜禽养殖[30]等。以目标污染物为核心的污染负荷削减对水质可起到稳定作用[31]。近年来,长江流域内CODMn和NH3-N超标断面的出现频率的减少与沿岸的污染治理投资和措施有关。如图6 (a) ,2008—2018年,全国环境污染治理投资总体上处于持续增加的状态,2018年全国环境污染治理投资比2008年增加约1倍,达到8 987.6亿元。其中城市环境基础设施建设投资是主要投资,2018年已经达到5 893.2亿元,比2008年增加4 092.2亿元;工业污染治理投资增加28.5%,到2018年已经达到697.5亿元。在全国环境污染治理投资逐年升高的背景下,2008—2018年长江干流沿线省市的城市环境基础设施建设投资呈现升高趋势,平均占全国的56%。城市环境基础设施建设投资中,对排水和绿化的投资占主要地位,长江流域内的污水排放量因此呈现减少的趋势。长江流域污水排放及处理情况如图6 (b) 所示,在2008—2018年间,长江干流沿线省市的城市污水排放总量和平均城市污水处理率逐年升高,2018年的污水排放总量比2008年增加37.9%;平均污水处理率增加23.3%,到2018年已经达到95.7%。污水处理率的明显升高意味着未处理污水量减少,2018年的未处理污水量比2008年减少了77.8%,海河流域耗氧污染物浓度得到控制也与污水处理率提高有直接联系[15]。由此可见,持续的污染治理投资和污水减排对长江流域水质好转有重要作用,流域耗氧污染得到有效控制,且耗氧污染物以NH3-N为主。相关研究结果对未来长江流域的水环境管理与相关控制对策制定具有重要参考意义。
3. 结论
1) 长江流域各重点断面水质良好,2008—2018年间稳步上升,水质由Ⅳ和Ⅴ类向Ⅱ和Ⅲ类转变,Ⅰ~Ⅲ类水质占比之和增加了3.4%,劣Ⅴ类水质趋于消失。水质表现出季节性,夏季水质劣于其他季节,表现在Ⅰ、Ⅱ类水占比减少,Ⅲ、Ⅳ类水占比增加,水质变差的原因是DO较低。
2) 2008—2018年,长江流域各重点监控断面整体的DO升高0.58 mg∙L−1,浓度区间集中;CODMn多年来稳定处于Ⅲ类水限值内;各重点监控断面NH3-N浓度下降0.04 mg∙L−1,年平均NH3-N极端值从1.22 mg∙L−1下降到0.67 mg∙L−1。DO变化最大的区域为上游,CODMn和NH3-N变化最大的为中游。
3) 相关性分析表明,DO恢复与NH3-N得到控制密切相关,DO和NH3-N的变化主要体现在高NH3-N下降导致低DO恢复的断面。在环境污染治理投资取得污水减排成效后,长江流域CODMn和NH3-N指标逐步好转,也成为流域重点断面水中溶解氧恢复的主要驱动力。
-
-
[1] 中华人民共和国环境保护部, 中华人民共和国国家发展和改革委员会, 中华人民共和国水利部. 长江经济带生态环境保护规划[EB/OL]. [2017-07-13]. https://www.mee.gov.cn/gkml/hbb/bwj/201707/t20170718_418053.html. [2] 曾刚, 曹贤忠, 朱贻文. 长江经济带城市协同发展格局与前景[J]. 长江流域资源与环境, 2022, 31(8): 1685-1693. [3] 中华人民共和国水利部. 三峡工程公报(2020)[EB/OL]. [2021-11-30]. http://www.mwr.gov.cn/sj/tjgb/sxgcgb/202111/t20211130_1553255.html. [4] TANG W Z, PEI Y S, ZHENG H, et al. Twenty years of China's water pollution control: Experiences and challenges. Chemosphere (Oxford)[J]. 2007, 295: 133875–133875. [5] KANNEL P. R, LEE S, LEE Y. S, et al. Application of water quality indices and dissolved oxygen as indicators for river water classification and urban impact assessment[J]. Environmental Monitoring and Assessment, 2007, 132(1): 93-110. [6] ONABULE O A, MITCHELL S B, & COUCEIRO F. The effects of freshwater flow and salinity on turbidity and dissolved oxygen in a shallow macrotidal estuary: A case study of Portsmouth Harbour[J]. Ocean & Coastal Management, 2020, 191: 105179. [7] PAN X, TANG L, FENG J, et al. Experimental research on the degradation coefficient of ammonia nitrogen under different hydrodynamic conditions[J]. Bulletin of Environmental Contamination and Toxicology, 2020, 104(2): 288-292. doi: 10.1007/s00128-019-02781-0 [8] XU J, YIN K, LEE J H, et al. Long-term and seasonal changes in nutrients, Phytoplankton Biomass, and dissolved oxygen on Deep Bay, Hong Kong[J]. Estuaries and Coasts, 2010, 33(2): 399-416. doi: 10.1007/s12237-009-9213-5 [9] 潘向忠, 高玉蓉, 李佳, 等. 钱塘江杭州段水体中溶解氧现状及其影响因素[J]. 环境保护科学, 2011, 37(4): 13-16. doi: 10.3969/j.issn.1004-6216.2011.04.005 [10] 郭建宁, 卢少勇, 金相灿, 等. 低溶解氧状态下河网区不同类型沉积物的氮释放规律[J]. 环境科学学报, 2010, 30(3): 614-620. [11] HLADYZ S, WATKINS S C, WHITWORTH K L, et al. Flows and hypoxic blackwater events in managed ephemeral river channels[J]. Journal of Hydrology, 2011, 401(1/2): 117-125. [12] 宋银都, 曾萌冬 周昊天, 等. 不同溶解氧水平对鳜呼吸代谢酶及其基因表达量的影响[J]. 水产科学, 2022, 41(3): 438-444. doi: 10.16378/j.cnki.1003-1111.20183 [13] POLONENKO L M, HAMOUDA M A, & MOHAMED M M. Essential components of institutional and social indicators in assessing the sustainability and resilience of urban water systems: Challenges and opportunities[J]. Science of the Total Environment, 2020, 708: 135159. doi: 10.1016/j.scitotenv.2019.135159 [14] 雷沛, 王超, 张洪, 等. 重庆市重污染次级河流伏牛溪水污染控制与水质改善[J]. 环境工程学报, 2019, 13(1): 95-108. doi: 10.12030/j.cjee.201712099 [15] 张洪, 林超 雷沛, 等. 海河流域河流耗氧污染变化趋势及氧亏分布研究[J]. 环境科学学报, 2015, 35(8): 2324-2335. [16] YOU Q H, FANG N, LIU L L, et al. Effects of land use, topography, climate and socio-economic factors on geographical variation pattern of inland surface water quality in China[J]. PloS One, 2020, 14(6): e0217840. [17] GEMMER M, JIANG T, SU B, et al. Seasonal precipitation changes in the wet season and their influence on flood/drought hazards in the Yangtze River Basin, China[J]. Quaternary International, 2008, 186(1): 12-21. doi: 10.1016/j.quaint.2007.10.001 [18] 续衍雪, 魏明海 张雨航, 等. 基于水质的长江经济带生态补偿资金分配测算研究[J]. 环境保护科学, 2021, 47(5): 13-15. [19] YANG S, HAO H, LIU B, et al. Influence of socioeconomic development on river water quality: A case study of two river basins in China[J]. Environmental Science and Pollution Research, 2021, 28(38): 53857-53871. doi: 10.1007/s11356-021-14338-y [20] LIU S, FU R, LIU Y, et al. Spatiotemporal variations of water quality and their driving forces in the Yangtze River Basin, China, from 2008 to 2020 based on multi-statistical analyses[J]. Environmental Science and Pollution Research, 2022, 29(46): 1-14. [21] 刘壮, 魏峣 陈强, 等. 长江黄河上游地表水溶解氧时空分布特征研究——以四川省为例[J/OL]. 环境保护科学: 1-9 2-11-02].https://doi.org/10.16803/j.cnki.issn.1004-6216.2022070002.
[22] 袁静. 浅析赣江滁槎断面水质状况[J]. 江西能源, 2007(4): 19-22. [23] 沈忱, 吕平毓, 冯顺新, 等. 向家坝水库蓄水对下游江段溶解氧饱和度影响研究[J]. 淡水渔业, 2014, 44(6): 31-36. doi: 10.3969/j.issn.1000-6907.2014.06.006 [24] 张婷婷, 张建 杨芳, 等. 温度对污水脱氮系统污染物去除效果及氧化亚氮释放的影响[J]. 环境科学, 2012, 33(4): 1283-1287. [25] PERNET-COUDRIER B, Qi W, Liu H, et al. Sources and pathways of nutrients in the semi-arid region of Beijing–Tianjin, China[J]. Environmental Science & Technology, 2012, 46(10): 5294-5301. [26] 黄炜惠, 马春子, 李文攀, 等. 我国地表水溶解氧时空变化及其对全球变暖的响应[J]. 环境科学学报, 2021, 41(5): 1970-1980. [27] HUANG J C, ZHANG Y J, BING H J, et al. Characterizing the river water quality in China: Recent progress and on-going challenges[J]. Water Research (Oxford), 2021, 201: 117309. doi: 10.1016/j.watres.2021.117309 [28] REN F, SUN Y, LIU J, et al. A modified dynamic DEA model to assess the wastewater treatment efficiency: perspective from Yangtze River and non-Yangtze River Basin[J]. Scientific Reports, 2022, 12(1): 1-15. doi: 10.1038/s41598-021-99269-x [29] XU T, CHANG F, HE X, et al. Influence of cascade hydropower development on water quality in the Middle Jinsha River on the upper reach of the Yangtze River[J]. Water, 2022, 14(12): 1943. doi: 10.3390/w14121943 [30] 程元辉, 毛宇鹏, 张洪. 珠江三角洲地区人为氮磷净输入特征及污染管控建议[J]. 环境工程学报, 2022, 16(6): 2049-2060. doi: 10.12030/j.cjee.202111035 [31] 雷沛, 王超, 张洪, 等. 重庆园博园龙景湖水质保持及其上游流域水污染治理方案[J]. 环境工程学报, 2019, 13(2): 481-495. doi: 10.12030/j.cjee.201806048 -


 下载:
下载:


