-
随着我国经济的快速发展以及居民生活质量的提升,城市生活垃圾的产生量迅速增长,截至2016年,我国城市生活垃圾的清运量已达2.04×10⁸ t,且仍在持续增长[1]。为了对城市生活垃圾进行高效处理处置,对其进行分类是首要处理步骤。上海市早在2000年就被列为国家首批生活垃圾分类试点城市之一[2],且在2019年7月1日率先正式实行《上海市生活垃圾管理条例》[3](简称《条例》)。《条例》要求对生活垃圾进行强制分类处理,主要分为干垃圾、湿垃圾、可回收垃圾和有害垃圾。在这些垃圾中,湿垃圾的主要成分为餐厨垃圾,餐厨垃圾具有产量高(年产量约为6.0×10⁷ t[4])、有机质(尤其是油脂)含量高、含水率高、易生化、热值低和处理难度大等特点[5],易对城市环境和居民的健康产生严重的影响。对湿垃圾的高效处理处置是我国亟待解决的难题。
《条例》实行之前,上海市普陀区甘泉街道提出了干湿垃圾分类处理的新模式——湿垃圾源头减量处理模式,即干垃圾进行焚烧,湿垃圾由小区垃圾分类站用食物垃圾粉碎处理器打碎后进行固液分相处理,挤压分相后,残渣就地发酵进行资源化利用,滤液经下水道排至污水处理厂进行处理。区别于传统混收混运模式与其他餐厨垃圾的末端处理方法,试点小区配备了将湿垃圾进行就地粉碎、排入下水道的装置,能够有效在源头减少垃圾清运量,同时对滤渣使用一体化小型设备进行就地好氧堆肥,以尽可能地对湿垃圾进行有效利用。
为了评估该新模式的可行性,本研究以上海市普陀区政府设置的甘泉街道3个小区为试点,探究了在湿垃圾源头减量处理后,该模式相比于传统混收混运模式,在垃圾处理处置全链条净碳排放量、垃圾含水率、焚烧发电量、城市固体垃圾清运量等方面的变化。本研究通过对2种不同垃圾处理模式进行对比,为我国垃圾分类与处理处置提供必要的数据支撑。
全文HTML
-
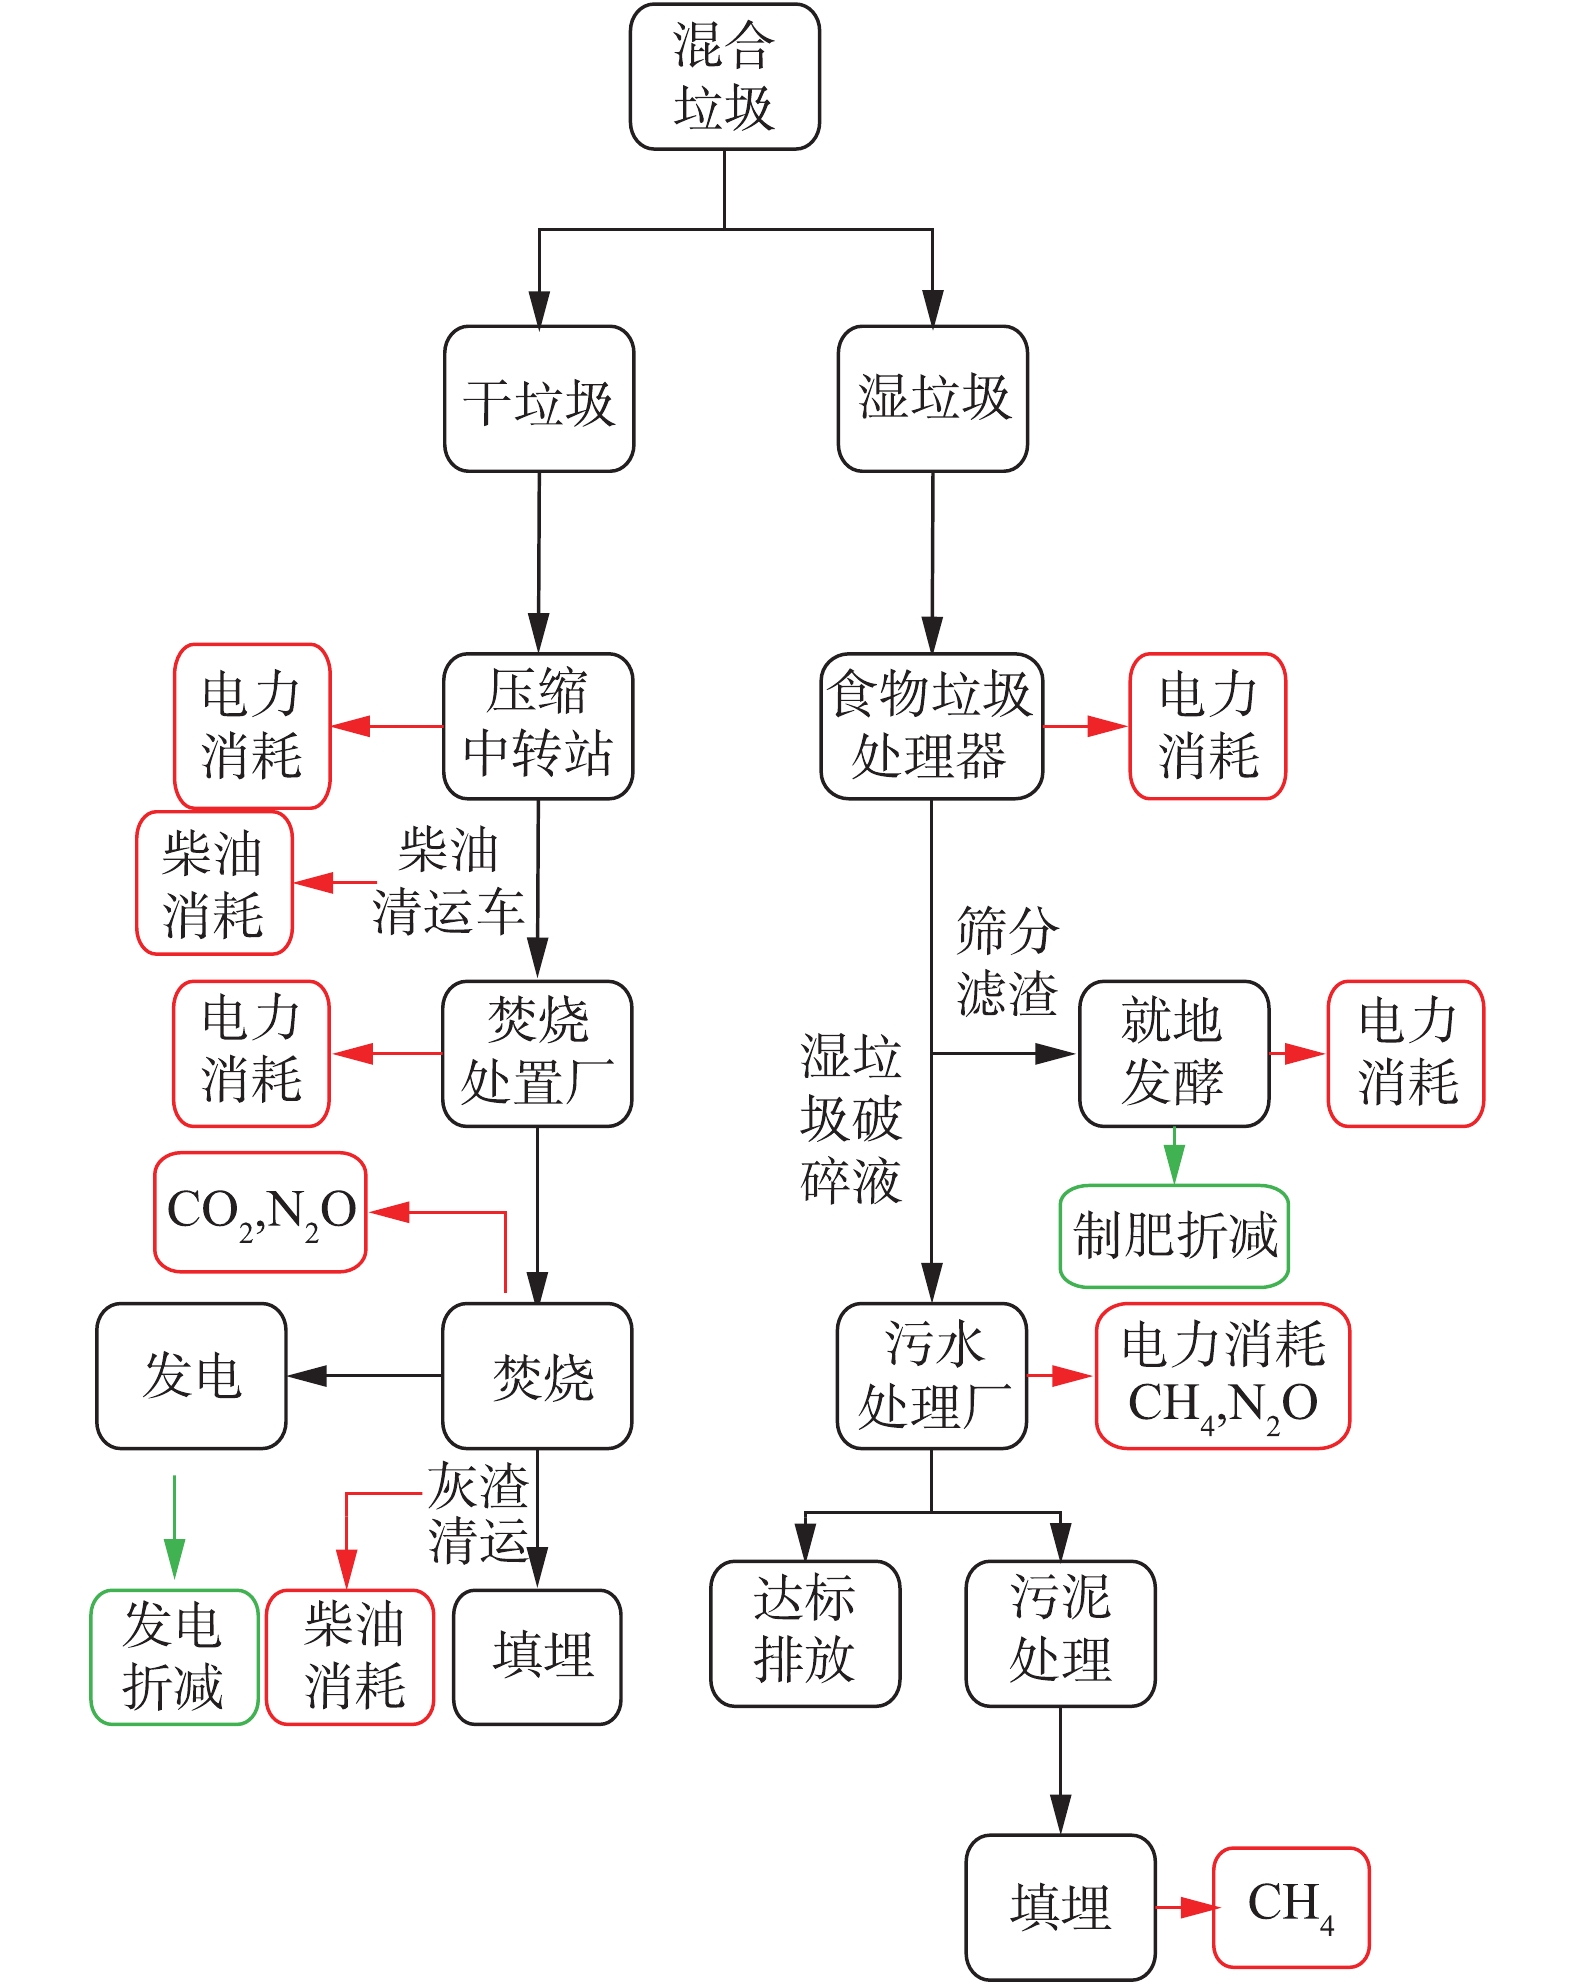
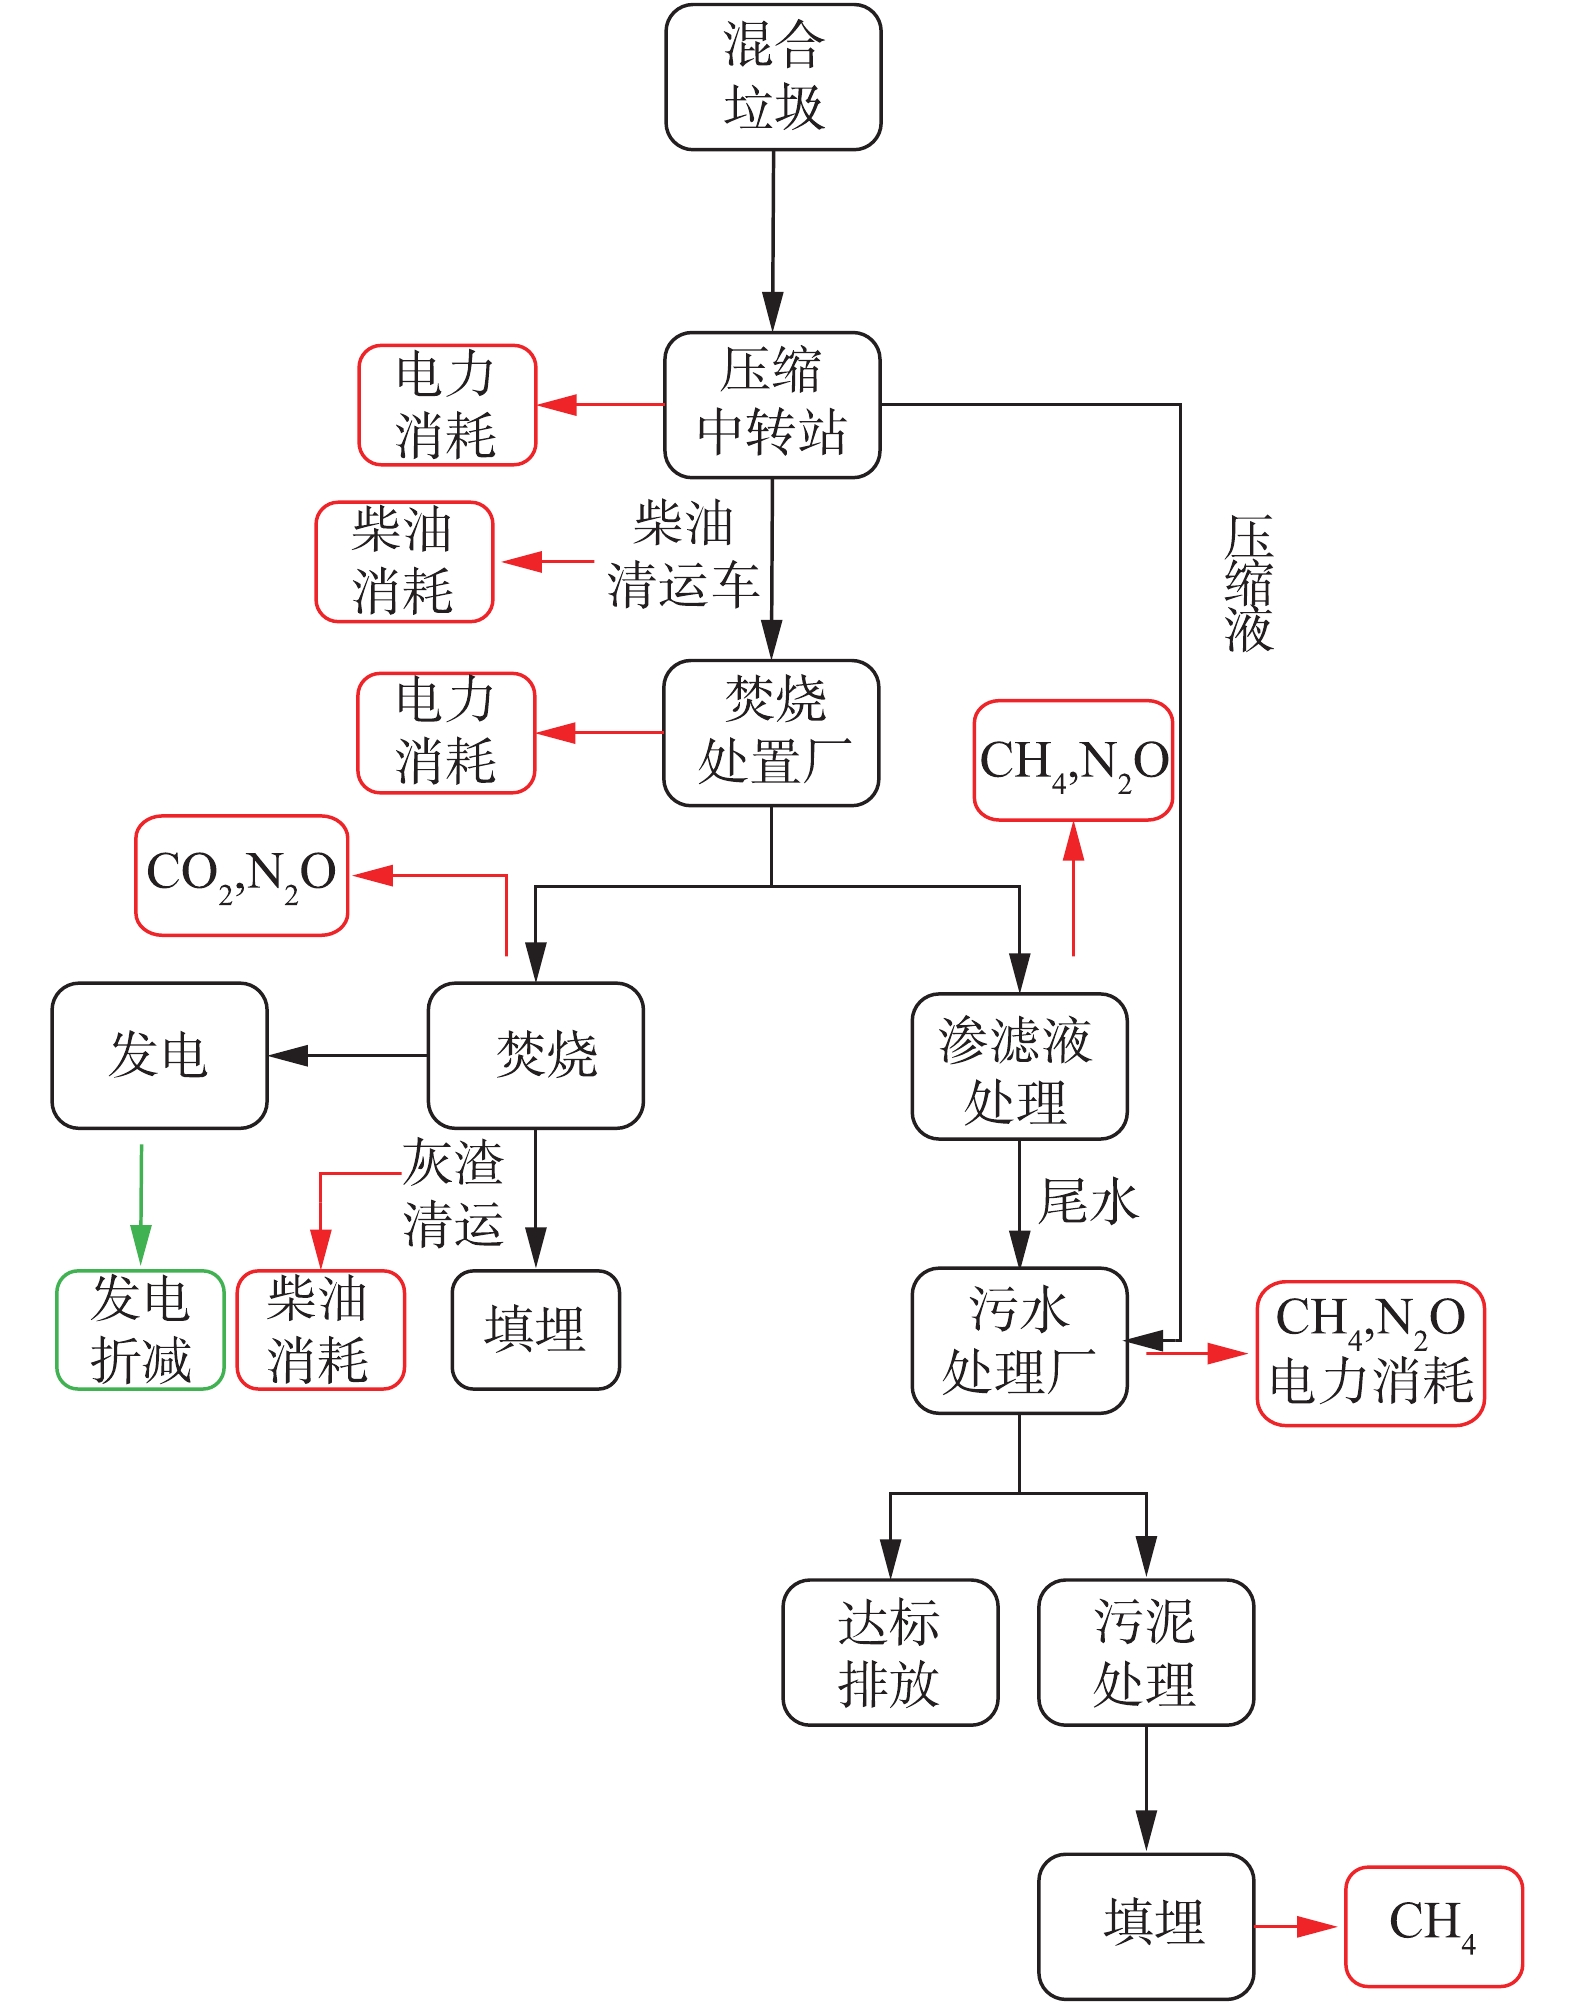
图1和图2分别为传统混收混运模式和湿垃圾源头减量处理模式对应的全链条系统清单。由图1和图2可以明显看出,干湿分离处理模式前后的不同特点。不同于传统混收混运模式,湿垃圾源头减量处理模式在源头上将干湿垃圾分离,干垃圾进行焚烧处理,而湿垃圾采用试点小区安装的食物垃圾处理器将湿垃圾进行粉碎处理,碎渣就地进行一体化堆肥处理,用于代替有机肥。通过对比可以较为清晰地看出,湿组分源头减量垃圾处理模式能更为充分地将湿垃圾进行源头减量,并且由于干湿垃圾的分离,清运过程未产生污水,对城市固体垃圾的运输具有积极影响,但是处理步骤较为复杂,且由于湿垃圾破碎的过程伴随着大量污水的产生,因此,对污水厂负荷有一定的影响[6]。
-
2种处理模式下的运输垃圾均使用柴油清运车进行运输,运输过程中默认垃圾不产生碳排放,因此,此过程的碳排放主要为清运车消耗柴油间接产生的碳排放,其计算方法参照IPCC指南(2006)建立的二氧化碳排放公式(如式(1)所示)。
式中:Dt为总CO2排放量,kg;i为第i种能源;εi为第i种能源的CO2排放因子,kg·L−1;Di为第i种能源消费量,L。
王星星[7]经过研究发现,消耗单位能源产生的CO2排放量如下:汽油的CO2排放因子为2.26 kg·L−1;柴油的CO2排放因子为3.16 kg·L−1;生物质的CO2排放因子为1.97 kg·L−1。
此过程主要包括在2种模式中将干垃圾从压缩中转站运输至焚烧处理厂以及将焚烧灰渣运输至填埋场过程耗油产生的碳排放。
丌鹏玉等[8]的研究发现,城市污水厂在处理污水时,CH4的主要释放源包括厌氧池、好氧池、缺氧池和二沉池。本次污水厂处理污水计算方法根据《省级温室气体清单编制指南》(简称《指南》)及IPCC指南(2006),处理生活污水产生的甲烷气体计算方法如式(2)所示。
式中:
ECH4 为甲烷排放量,kg;T为污水中有机物总量(以BOD5计),kg·d−1;B0为甲烷最大产生能力,即单位质量BOD可产生的甲烷量;M为甲烷修正因子。根据《指南》,华东地区BOD/COD的推荐值为0.43,生活污水中1 kg BOD产生的甲烷量(B0)推荐值为0.6 kg,M取全国平均值0.165。污水处理厂在处理污水时,在进行好氧和脱氮过程中均会产生N2O气体[9],因此,忽略氮在各个反应池的中间变化过程,以进水为起点,出水为终点,进行N2O的核算。N2O是生物脱氮过程的中间产物,主要受温度、pH、DO等条件影响[10]。N2O的排放量无法通过化学计算式进行计算,因此,采用IPCC系数法计算,N2O计算方法如式(3)所示。
式中:
EN2O 为N2O排放量,kg·d−1; Qin为污水进水量,m3·d−1;Nin为进水总氮浓度,mg·d−1;Nout为出水总氮浓度,mg·d−1;Ei为第i种脱氮工艺的N2O-N排放因子,本次计算以传统硝化反硝化为取值标准,为0.035。根据污水厂污水进出水的TN含量,可得出污水厂处理各节点产生污水时产生的N2O排放量。根据IPCC指南(2006),在污水处理阶段产生的CO2为生物成因,不计入清单总量中。因此,忽略此过程中CO2的产生量。在此过程中产生的污水包括压缩中转站产生的压缩液污水、垃圾渗滤液污水、渗滤液尾水、湿垃圾破碎液污水以及资源再生中心脱水产生的污水。各类污水处理过程中进出水水质如表1所示。
在污水处理过程中,需要从外界加入化学药剂来协助污水处理过程的顺利完成。其中包括污水絮凝过程加入的FeCl3、污泥浓缩过程加入的PAM、污泥稳定过程加入的石灰等,这些药品的生产、运输环节会产生能源和碳消耗,从而引起碳排放[14]。计算方法如式(4)所示。
式中:
ECO2 为CO2排放量,kg;K为药剂的消耗量,kg;E1为药剂引起的二氧化碳当量排放系数。消耗1 kg石灰相当于排放1.74 kg CO2,消耗1 kg PAM相当于排放20 kg CO2,消耗1 kg消毒剂相当于排放1.4 kg CO2。药剂投加量一般按照产生污泥干固体重量的百分比计,如FeCl3投加量为5%~10% DS,石灰投加量为20%~40% DS,PAM投加量为0.1%~0.3% DS。因此,在计算药剂投加量时根据干污泥产量进行投加。
垃圾焚烧发电引起的碳排放主要有:生活垃圾中矿物质碳焚烧产生的碳排放被称为化石成因的碳排放,应纳入CO2排放总量;生物垃圾中生物质碳燃烧产生的CO2是生物成因的,被认为可以不被纳入国家CO2排放总量估算清单中。废弃物焚烧产生的二氧化碳排放量估算如式(5)所示。
式中:
ECO2 为CO2排放量,kg;Wi为各组分垃圾的质量(以湿基计),kg·d−1;Ci为垃圾各组分碳含量比例;Fi为垃圾各组分中矿物碳在碳总量中的比例;E为焚烧炉燃烧效率,推荐生活垃圾燃烧效率为100%;44/12为CO2/C分子质量比。垃圾焚烧过程中会产生烟气、飞灰、底渣。处理1 t生活垃圾产生的飞灰、底渣会分别为0.2~0.9 kg CO2和1.1~3.9 kg CO2[15],烟气处理过程中添加活性炭,耗量较小,且相关数据库未给出活性炭的温室气体排放系数,故忽略处理过程中的温室气体排放。
垃圾经过中转站挤出部分压缩液,在焚烧厂垃圾堆仓放置5~7 d后,滤出渗滤液,进入焚烧系统的垃圾产生的热量计算方法如式(6)所示。
式中:Q为焚烧垃圾产生的热量,kJ;Ei为对应垃圾组分的干基高位热值,kJ·kg−1;Wi为对应垃圾组分的处理量,kg;Q水为垃圾中水分蒸发吸收的热量,kJ。
实际上,在垃圾焚烧阶段,烟气经过主燃室、再燃室后再到余热锅炉产生蒸汽,高温高压蒸汽再被输送到气轮发电机组冲转机组发电,并将能量转化为电能,在这个能量的转换过程中,能量损失是相当大的。火力发电厂的热能利用率一般为20%~30%。垃圾焚烧发电厂由于机组容量小,垃圾的热值比火力发电厂的燃料低很多,因此,垃圾焚烧发电厂的热能利用率更低,一般为18%~26%[16]。本次计算设定热能利用率为20%。
根据王磊[17]的调研发现,污水厂去除1 kg BOD5产生的干污泥量平均值为1.34 kg,一般污泥经过脱水后含水率达到60%,即可进入填埋场进行填埋[18],污泥填埋过程中主要产生CH4。CH4排放量估算方法如式(7)所示。
式中:Dm为可分解DOC质量,kg;W为沉积的污泥质量,kg;D为沉积年份的可降解有机碳比例;Df为可分解的DOC比例;M2为有氧分解的CH4修正因子。
同时,IPCC指南(2006)给出的CH4排放量的计算方法如式(8)所示。
式中:
ECH4 为CH4产生量,kg;F为产生的垃圾填埋气体中的CH4比例;16/12为CH4/C分子质量比。污泥中的可降解有机碳含量取决于废水处理方法[19],对于生活污泥缺省值为5%,本研究采用的值为35%。根据IPCC指南(2006),Df的推荐缺省值是0.5,F缺省值为0.5,甲烷校正因子选用已管理级-厌氧级别,M2为1.0。
与燃烧前的垃圾相比,焚烧后仍有30%的质量留在灰渣中。其中底渣占灰渣总量的80%,飞灰占灰渣的20%。飞灰、底渣填埋过程中会排放其他间接温室气体,在处理1 t生活垃圾过程中,飞灰和底渣在填埋过程中产生的CO2排放量分别为10~50 kg[20]和5~18 kg[21]。
在垃圾处理过程中,各处理设备及装置的耗电量所产生的碳排放计算公式如式(9)所示。
式中:W为处理量,m3;R为单位处理过程的电耗,kWh·m−3;E3为由电力引起的碳排放的排放因子,kg·(kWh)−1。在计算E3时可参考表2中的数据[22]。
食物处理器处理湿垃圾之后会产生残渣及污水,若残渣随污水一起进入污水管网系统,会长时间堆积在下水道中,影响排水。因此,通过筛网将滤渣和污水分离,滤渣和不能粉碎的湿垃圾进行就地好氧发酵制肥。目前,大多采用一体化设备,搅拌比较充分且不产生CH4、N2O等气体。堆肥过程产生的CO2认为是生物成因,故不列入计算清单内[23]。
因此,堆肥阶段产生的碳排放量主要来自于一体化设备消耗的电量,同时堆肥产生的肥料可以代替化肥进行使用。由餐厨垃圾产生的有机肥等同尿素量,计算方法如式(10)所示。
式中:Q为湿垃圾产生有机肥等同的尿素量,kg;Q0为进行堆肥的有机物含量,kg,经调研,含量为进料的88.6%;θ为堆肥产率,调研结果为5%;CN为堆肥产品中氮元素含量,为3.08%;M尿素/MN为尿素与氮分子质量比;ρ为有效利用率,取70%。
产生的碳汇量计算方法如式(11)所示。
式中:
ECO2 为CO2排放量,kg;a为尿素的煤耗系数,取1.55;A为标准煤的排放因子,取值为2.493;b为尿素的电耗系数,取值为0.45 kWh·kg−1;E为电力引起的CO2排放因子,取值为0.804 6 kg·(kWh)−1。
1.1. 系统边界的确定
1.2. 系统清单的计算方法
-
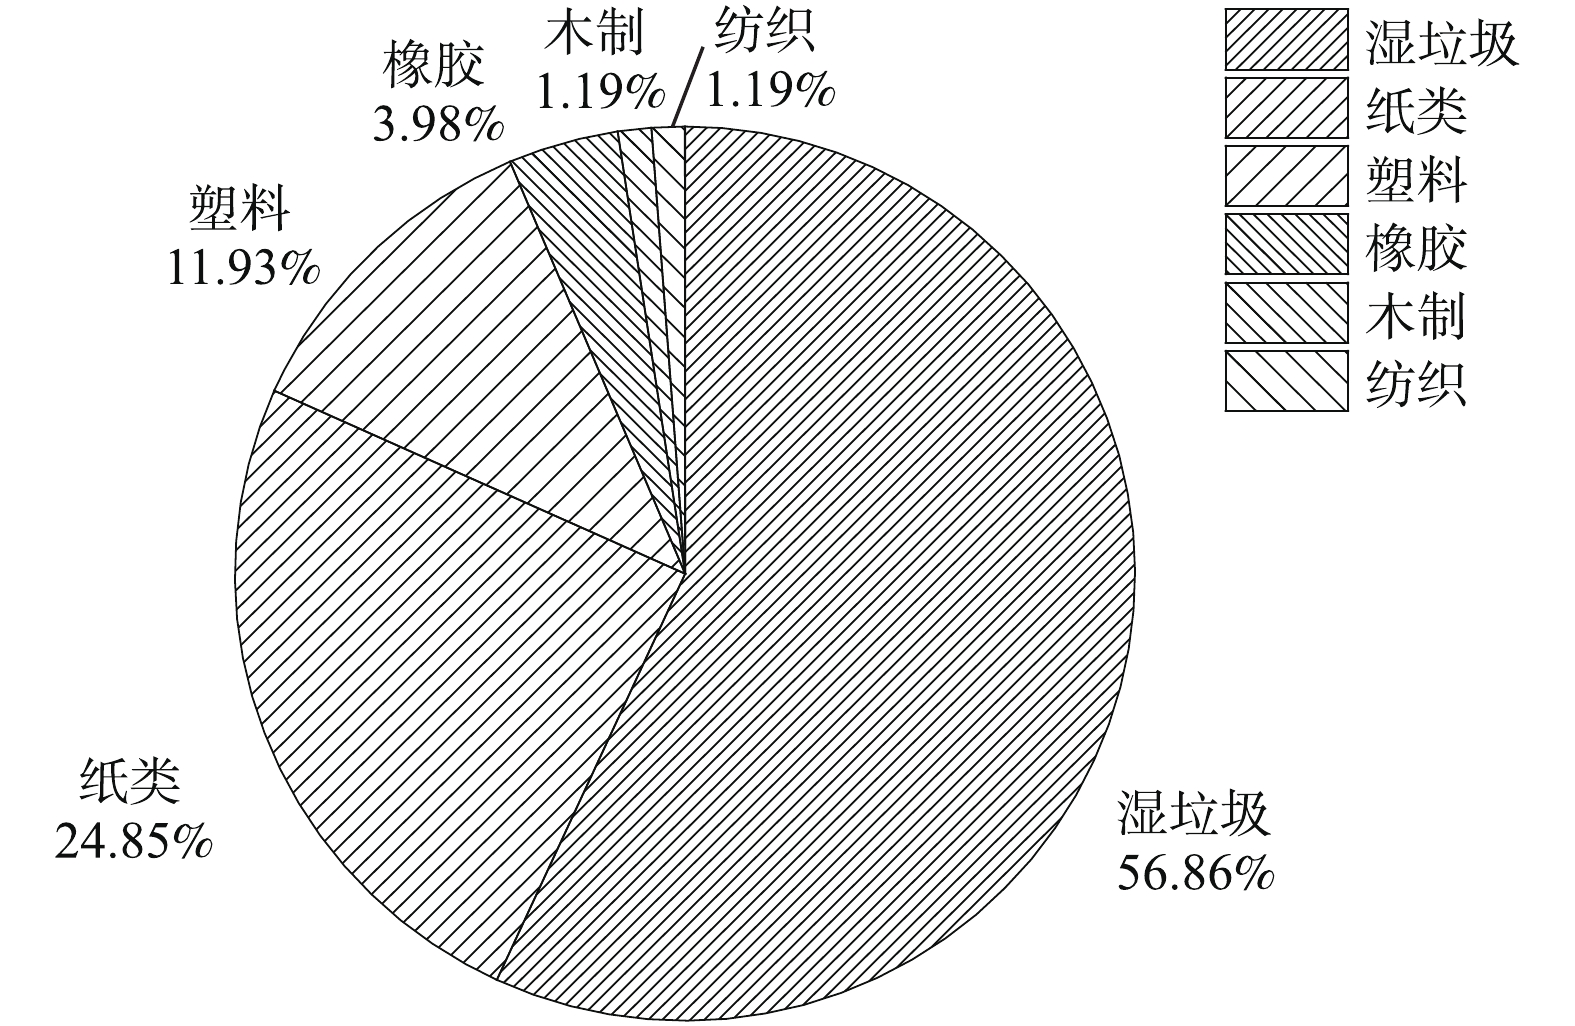
为得到相对精确的居民生活垃圾产生量和组分分布,对甘泉街道3个小区进行了基本的人口调研及其垃圾分类的统计。3个试点社区共2 365户,社区A有612户,社区B有120户,社区C有1 633户。首先将试点小区居民的所有生活垃圾经过破袋分类,垃圾组分图如图3所示。可以看出,上海市试点小区居民生活垃圾中主要成分为湿垃圾,占比达到56.86%;其次的生活垃圾主要为纸类、塑料、橡胶等。而湿垃圾由于难分离,导致在生活垃圾中难以被彻底分离,对湿垃圾源头减量存在一定影响;且小区中湿垃圾主要为厨余垃圾,具有相当高的含水率,若不能将其有效地与干垃圾进行分离处理,对城市清运与环境卫生存在一定压力。
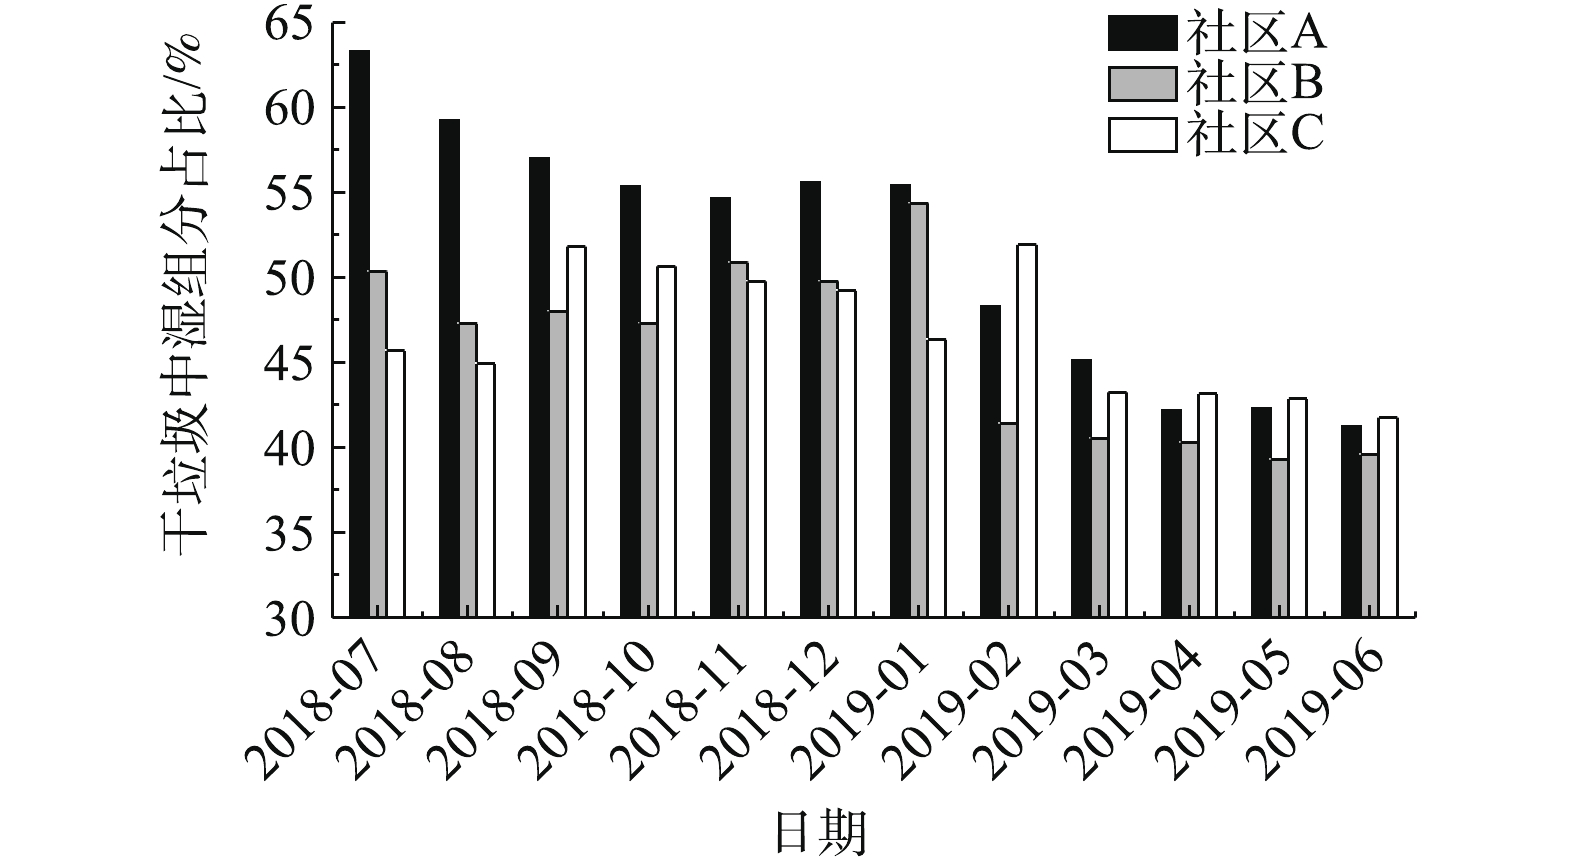
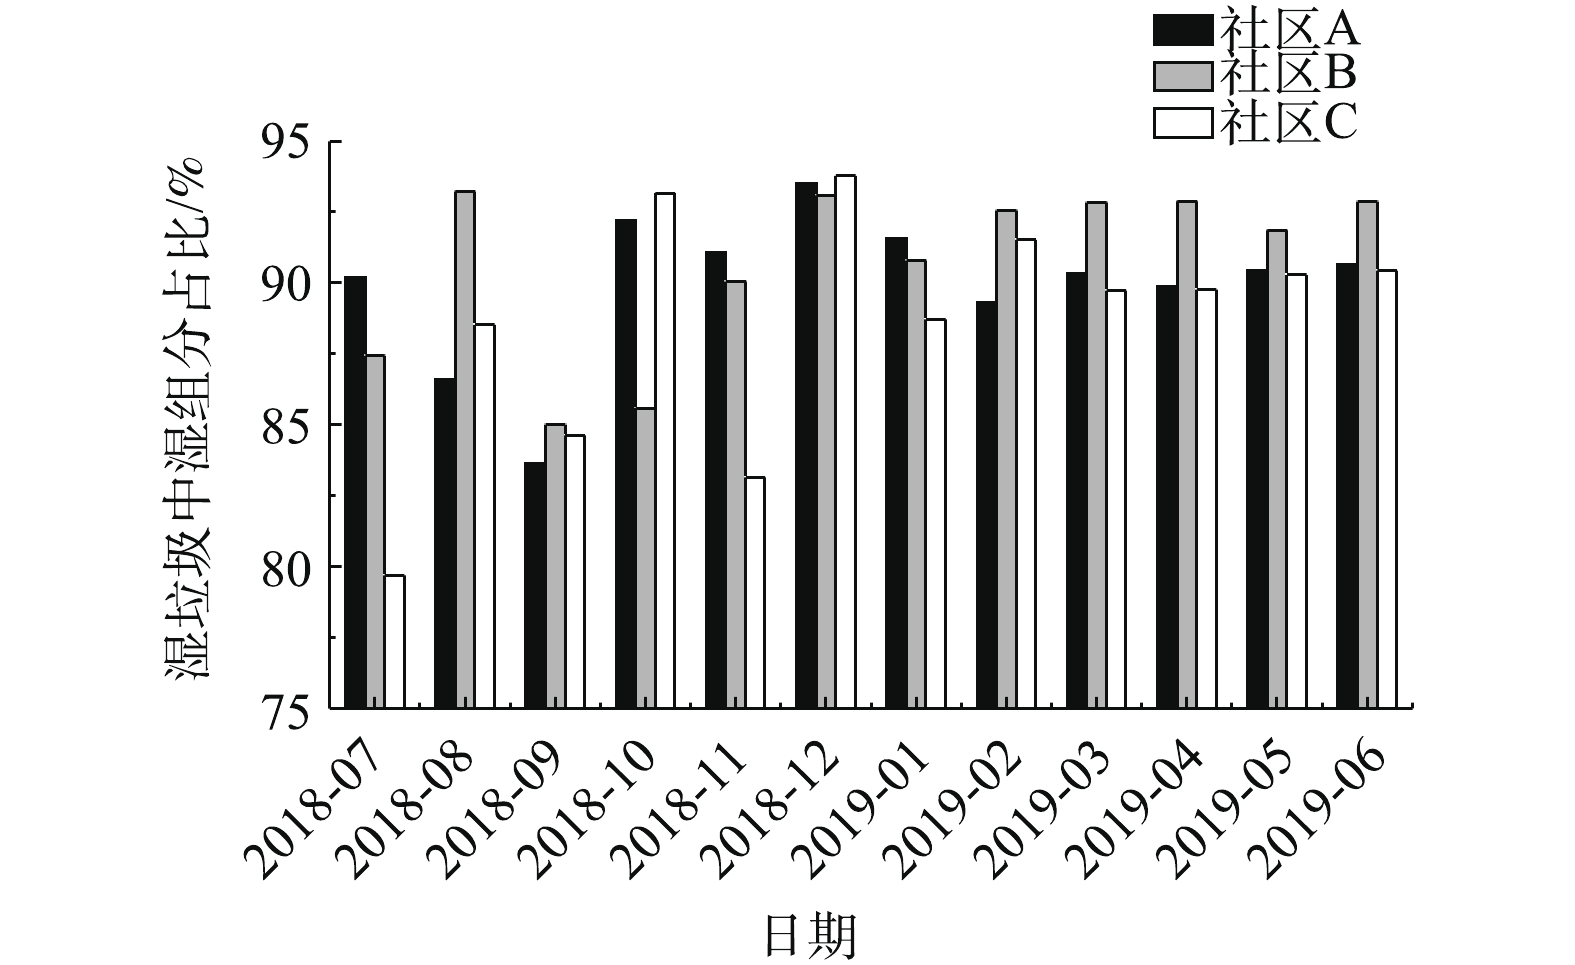
经垃圾分类后,对试点小区干湿垃圾桶中的垃圾组分分别进行了分析。图4为3个试点小区居民的干垃圾中湿组分的占比变化趋势,图5为湿垃圾中湿组分的占比变化趋势。由图4和图5可知,经过垃圾分类的宣传教育,上海市居民湿垃圾分类比较彻底。由图5可知,小区居民在经过干湿垃圾分类的宣传中取得的进步,在湿垃圾中湿组分平均约占其质量由原先的85.8%提高至90%,对厨余垃圾中干湿分类意识有了大幅度的进步。由图4可看出,收集的干垃圾中湿组分从平均约占其质量的53%降至40%,由于湿垃圾自身具有难分离性和高含水率,故使得干垃圾中的湿组分仍占有一定的比例。
-
各小区均只设1个垃圾投放点,每个投放点分别设置了干、湿垃圾桶。通过对3个试点小区进行为期1年的调研,截至2019年6月,试点小区居民干垃圾中干组分日产生量为473 kg,湿组分日产生量为315.33 kg;湿垃圾中干组分日产生量为40.11 kg,湿组分日产生量为361 kg,其中再次分离出来的湿组分(361 kg)全部通过食物垃圾粉碎处理器处理。
-
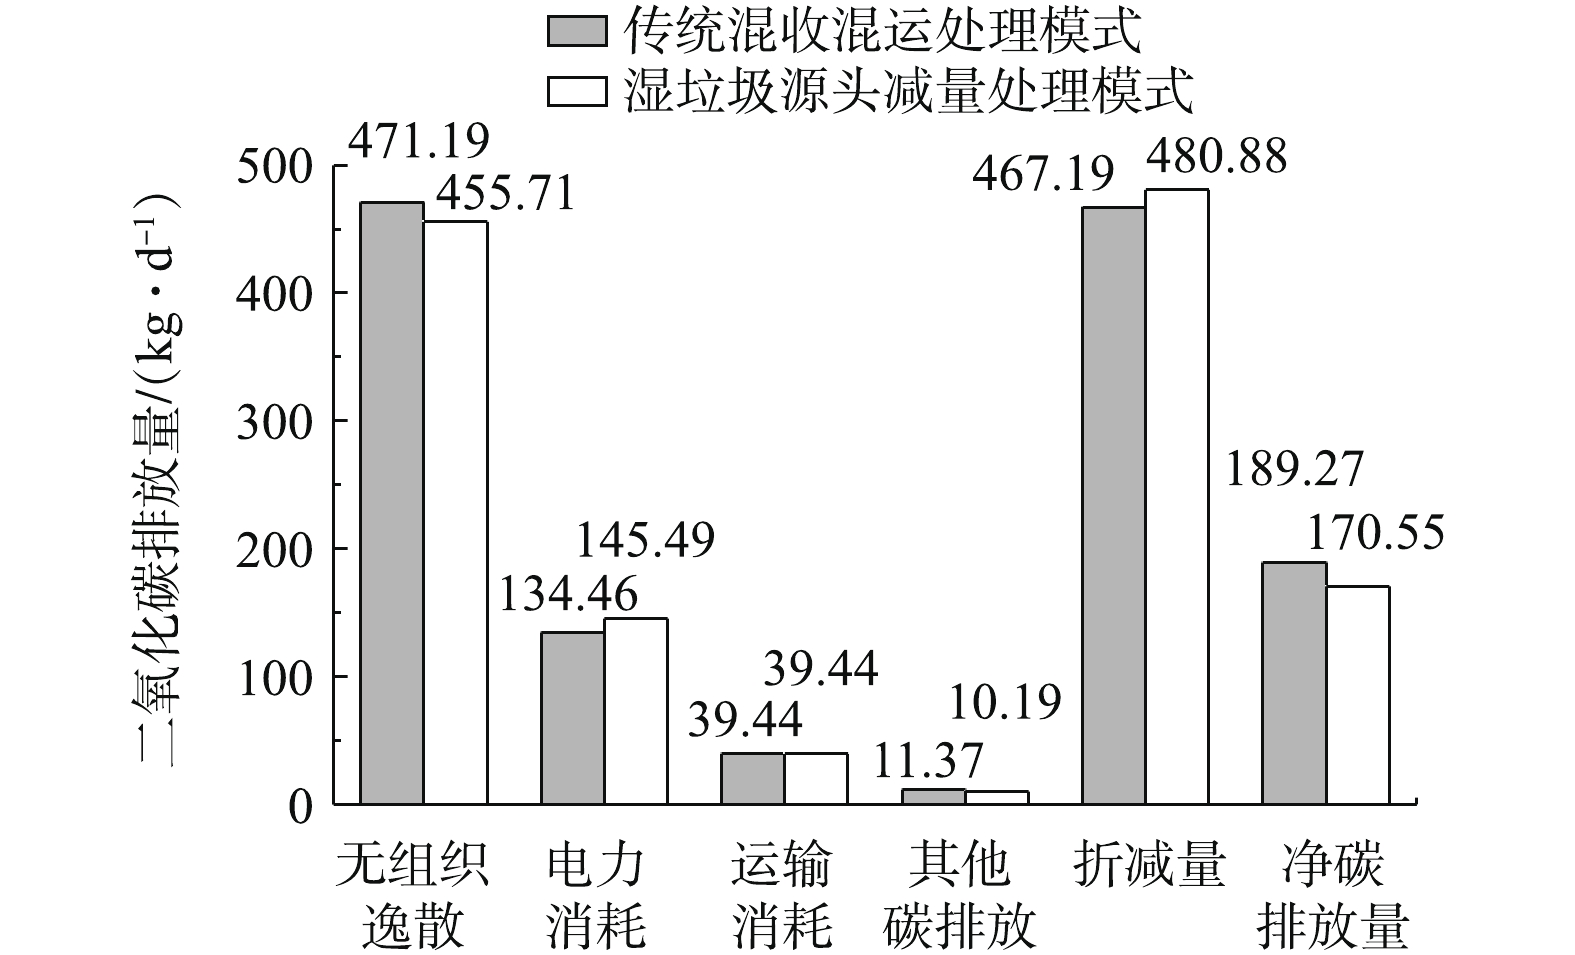
2种垃圾处理处置全链条净碳排放量计算结果如图6所示。从净排放的角度分析,湿垃圾源头减量处理模式的净碳排放量低于传统混收混运模式。其中,污水处理、污泥填埋、垃圾焚烧过程产生的CO2、CH4、N2O等温室气体的无组织逸散为碳排放的最主要因素,占全链条碳排放总量的70% 左右。除此之外,处理过程中各类设备电量消耗也占有很大一部分比例。传统混收混运的垃圾处理模式在碳排放总量高于湿垃圾源头减量处理模式,并且后者的发电、好氧制肥等碳汇折减量更多,这在计算碳减排潜力上具有重要意义。
虽然湿垃圾源头减量处理模式在整体上的碳排放低于传统混收混运模式,但并非在每个环节都低于后者。如图6所示,在湿垃圾源头减量处理模式下的电力消耗和其他碳排放略有增加。不同于传统混收混运模式对干湿垃圾进行无差别的焚烧,将干湿垃圾进行分类并湿垃圾源头减量处理增加了对湿垃圾的处理系统,即在各个试点小区安装了一处食物垃圾处理站,包括对湿垃圾的粉碎处理和将碎渣进行就地好氧堆肥的装置。这增加湿垃圾处理时电量消耗。此外,对湿垃圾的粉碎需要加水冲洗,这也增加了碳排放。
尽管2种模式下运输消耗产生的碳排放在图6中一致,但在实际运输过程中,湿垃圾源头减量处理模式可带来大量湿组分的分离,使清运重量与清运次数减少,因而能够降低清运车的油耗,从而减少运输过程中的碳排放。
湿垃圾源头减量处理模式使大量高含水率的湿垃圾从干垃圾清运系统中分离,使清运过程中中转站压缩液和垃圾堆仓中渗滤液的产量相比于传统混收混运模式大幅降低。这些压缩液和渗滤液在污水处理过程中会产生CH4和N2O,无组织逸散时产生的温室效应远高于CO2。尽管湿垃圾源头减量模式在分相过程中会产生污水,但是经过实测发现,其化学需氧量总量为5.96 kg·d−1,低于压缩液与渗滤液化学需氧量(8.11 kg·d−1)。因此,在无组织逸散方面,湿垃圾源头减量处理模式的碳排放量少于传统混收混运模式。
对湿垃圾粉碎分相后的滤渣进行就地一体化好氧堆肥,产出的有机肥能代替化肥进行土地利用,这能减少化肥的使用,从而减少化肥在生产过程中产生的碳排放。在干垃圾焚烧发电阶段,湿垃圾的分离去除使含水率降低、热值升高,不仅不需要额外的辅助燃料的使用,而且焚烧的发电量并不少于传统垃圾焚烧发电量。
-
2种垃圾处理模式干湿垃圾清运量、垃圾含水率、发电折减量之间的对比如表3所示。在湿垃圾源头减量处理模式下进入干垃圾清运系统的垃圾清运量比传统混收混运垃圾处理模式减少约30.35%,对减少城市固体垃圾清运减量、缓减城市道路压力具有重要意义。垃圾含水率低于40%则默认不主动产生污水,因此,湿垃圾源头减量处理模式的垃圾含水率不产生变化。将垃圾进行干湿分离、源头减量,可使原有垃圾中的水分进一步去除,焚烧垃圾的整体热值得到了提高。因此,尽管垃圾量减少了约30%,但垃圾焚烧发电量并未减少,以上海市垃圾产量2.1×10⁴ t·d−1计,可多发电1.64×10⁵ kWh·d−1。
2.1. 试点小区垃圾成分及分类情况分析
2.2. 居民生活垃圾产生量分析
2.3. 净碳排放量计算结果
2.4. 垃圾含水率与发电量分析
-
1)通过垃圾分类宣传教育,上海市居民湿垃圾分类比较彻底,湿垃圾中干组分仅占约10%,为湿垃圾的分类处理奠定了良好的基础;但是由于湿垃圾的难分离性,在干垃圾桶中湿组分仍占40%。
2)基于固液分相的湿垃圾源头减量处理模式,相比于传统混收混运,原生垃圾可实现上网多发电7.8 kWh·t−1,同时减少CO2排放量为1.57×10⁻² t。
3)湿垃圾源头减量处理模式具有较为显著的碳减排潜力,并且对减少生活垃圾清运量、降低垃圾整体含水率、提高焚烧垃圾的热值具有重要意义,对我国生活垃圾分类、湿垃圾源头减量具有重要的参考价值。


 下载:
下载:
