-
抗凝血灭鼠剂被广泛用于控制共生啮齿动物[1],其中杀鼠醚因其持久性、生物累积性和毒性,近年来引起了国际上多个组织的关注[2-3]. 暴露在水生环境中、饮用被污染的水或食用含有杀鼠醚残留的食物会对人体健康乃至整个生态系统产生不利影响. 目前,杀鼠醚的检测方法主要包括高效液相色谱法[3]、气相色谱法[4]、薄层色谱法[5]、高效液相色谱-质谱法[6]和电喷雾电离串联质谱法[7]. 然而,这些方法都有一定的局限性,对样品纯度有严格的要求,需要繁琐的前处理步骤,对操作人员的技能要求较高[8]. 同时由于仪器体积较大,不适用于现场分析[9]. 因此,迫切需要建立一种杀鼠醚的现场快速检测方法.
表面增强拉曼光谱(surface-enhanced Raman spectroscopy,SERS)可以提供简单、快速和无损的检测,该技术具有高灵敏度和独特的光谱指纹,并且不受水分子的干扰,可以很好地适用于复杂的样品检测分析[10]. 目前,SERS技术已被应用于土壤[1]、水果和蔬菜[11]样品中的常规农药检测,但仍缺乏快速检测抗凝血杀鼠剂的相关报道.
本文建立了一种简单快速的SERS方法,以纳米金作为活性基底,结合便携式拉曼光谱仪,实现了环境水中杀鼠醚的快速现场检测(图1). 与传统方法相比,该方法灵敏度高,检出限低,回收率良好,仅需3 min即可完成整个检测过程,有望成为现场应急分析的有效手段.
-
材料 氯金酸(99.99%)购自中国上海阿拉丁化工有限公司;柠檬酸三钠(99.99%)购自国药化学试剂(上海)有限公司;杀鼠醚(99.4%)购自Dr. Ehrenstorfer(中国北京);聚沉剂硫酸镁(99.7%)、氯化钙(99.7%)、氯化钾(99.8%)、氯化钠(99.7%)、硝酸铝(99.7%)、硝酸镁(99.7%)购自国药化学试剂有限公司;乙酸乙酯(99.9%)、二氯甲烷(99.5%)、乙腈(99.9%)、正己烷(99.5%)、环己烷(99.5%)购自天津科美尔化学试剂有限公司,三氯乙烷(95%)购自上海振兴第二化工厂;实验用水为经Milli-Q净化系统制备的去离子水(~18.2 MΩ cm). 环境水样采自济南市黑虎泉.
仪器 便携式拉曼光谱仪(QE Pro,海洋光学,美国);岛津2600紫外-可见光(UV-Vis)光谱仪(岛津株式会社,京都,日本);透射电子显微镜(TEM; JEM-CXII, JEOL Ltd.,东京,日本).
-
纳米金的制备 根据先前的研究,用柠檬酸三钠化学还原氯金酸制备纳米金[12]. 将1 mL 1%的氯金酸加入到99 mL去离子水中,以600 r·min−1的转度搅拌,并加热至沸腾. 随后,加入1 mL 1%的柠檬酸钠溶液. 混合溶液在剧烈搅拌下继续煮沸35 min,使其发生反应,溶液很快变成黑色,然后逐渐合成为砖红色的纳米金胶体溶液.
杀鼠醚溶液的制备 将固体杀鼠醚溶解在乙醇中,配制2 mg·mL−1的杀鼠醚标准储备液. 然后用水稀释储备液配制成标准系列溶液,浓度分别为0.025、0.05、0.1、0.25、0.5、1、2.5、5 μg·mL−1. 杀鼠醚的环境水样采用标准添加法制备,浓度为0.025—5 μg·mL−1.
-
为了优化SERS信号,本研究并比较了6种盐(氯化钾、氯化钠、硝酸镁、硫酸镁、氯化钙和硝酸铝)对Au NPs的聚集效应. 首先,50 μL杀鼠醚水溶液(1 μg·mL−1)与940 μL Au NPs混合;然后加入10 μL的盐溶液,充分混合5 s,诱导聚沉. 使用配有785 nm波长激光器的便携式拉曼光谱仪采集信号,激光功率设置为500 mW,积分时间为20 s. 选择可以诱导最佳聚集效果的盐作为后续实验的聚沉盐. 通过比较不同浓度盐溶液(0.1、0.25、0.5、1、2 mol·L−1)对信号增强效果的影响,确定最佳聚沉条件. 随后采集连续60 min的SERS信号,选取信号强度稳定的时间点作为聚沉时间.
-
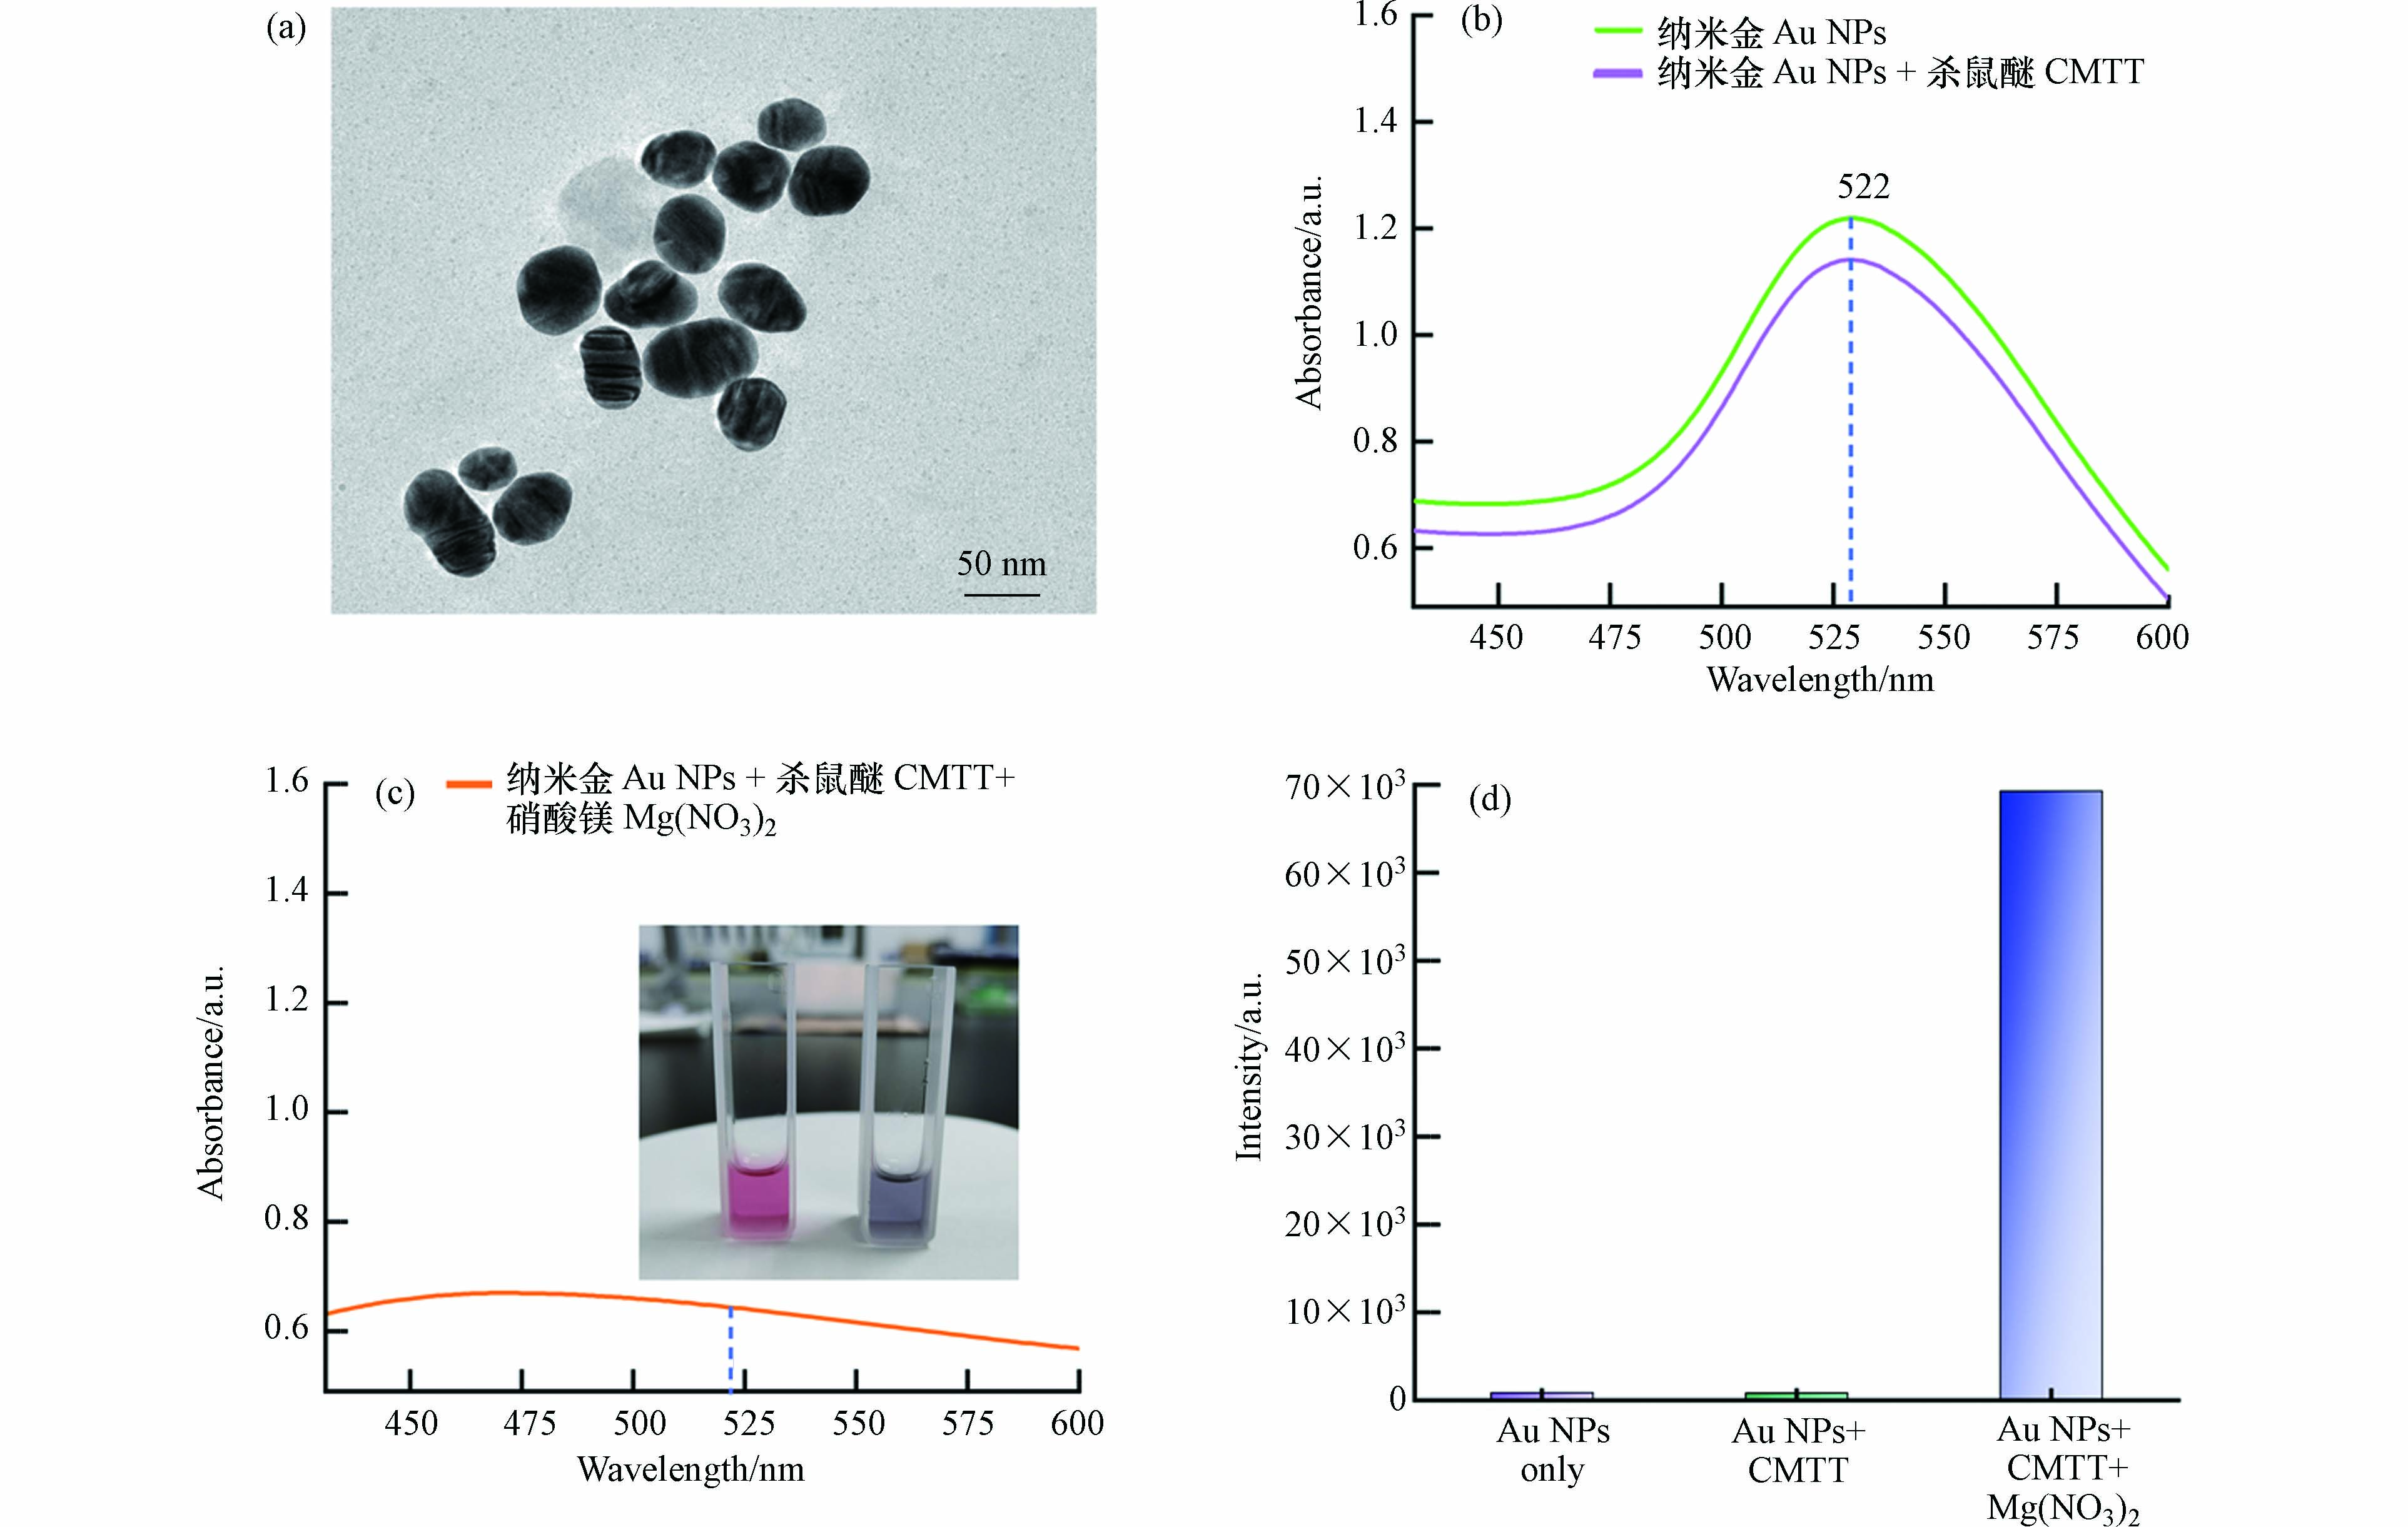
透射电子显微镜结果显示,纳米金的粒径为45—60 nm(图2a).
紫外-可见光谱显示纳米金溶液的吸收峰位于522 nm(图2b). 将1 μg·mL−1杀鼠醚加入50 μL溶液中,未见明显变化. 相比之下,加入10 μL 0.5 mol·L−1硝酸镁溶液会导致吸收峰显著下降,溶液颜色从砖红色变为紫灰色(图2c插图),表明纳米颗粒发生了团聚[13]. 紫外可见光谱对应的拉曼和SERS信号见图2c和图2d.
-
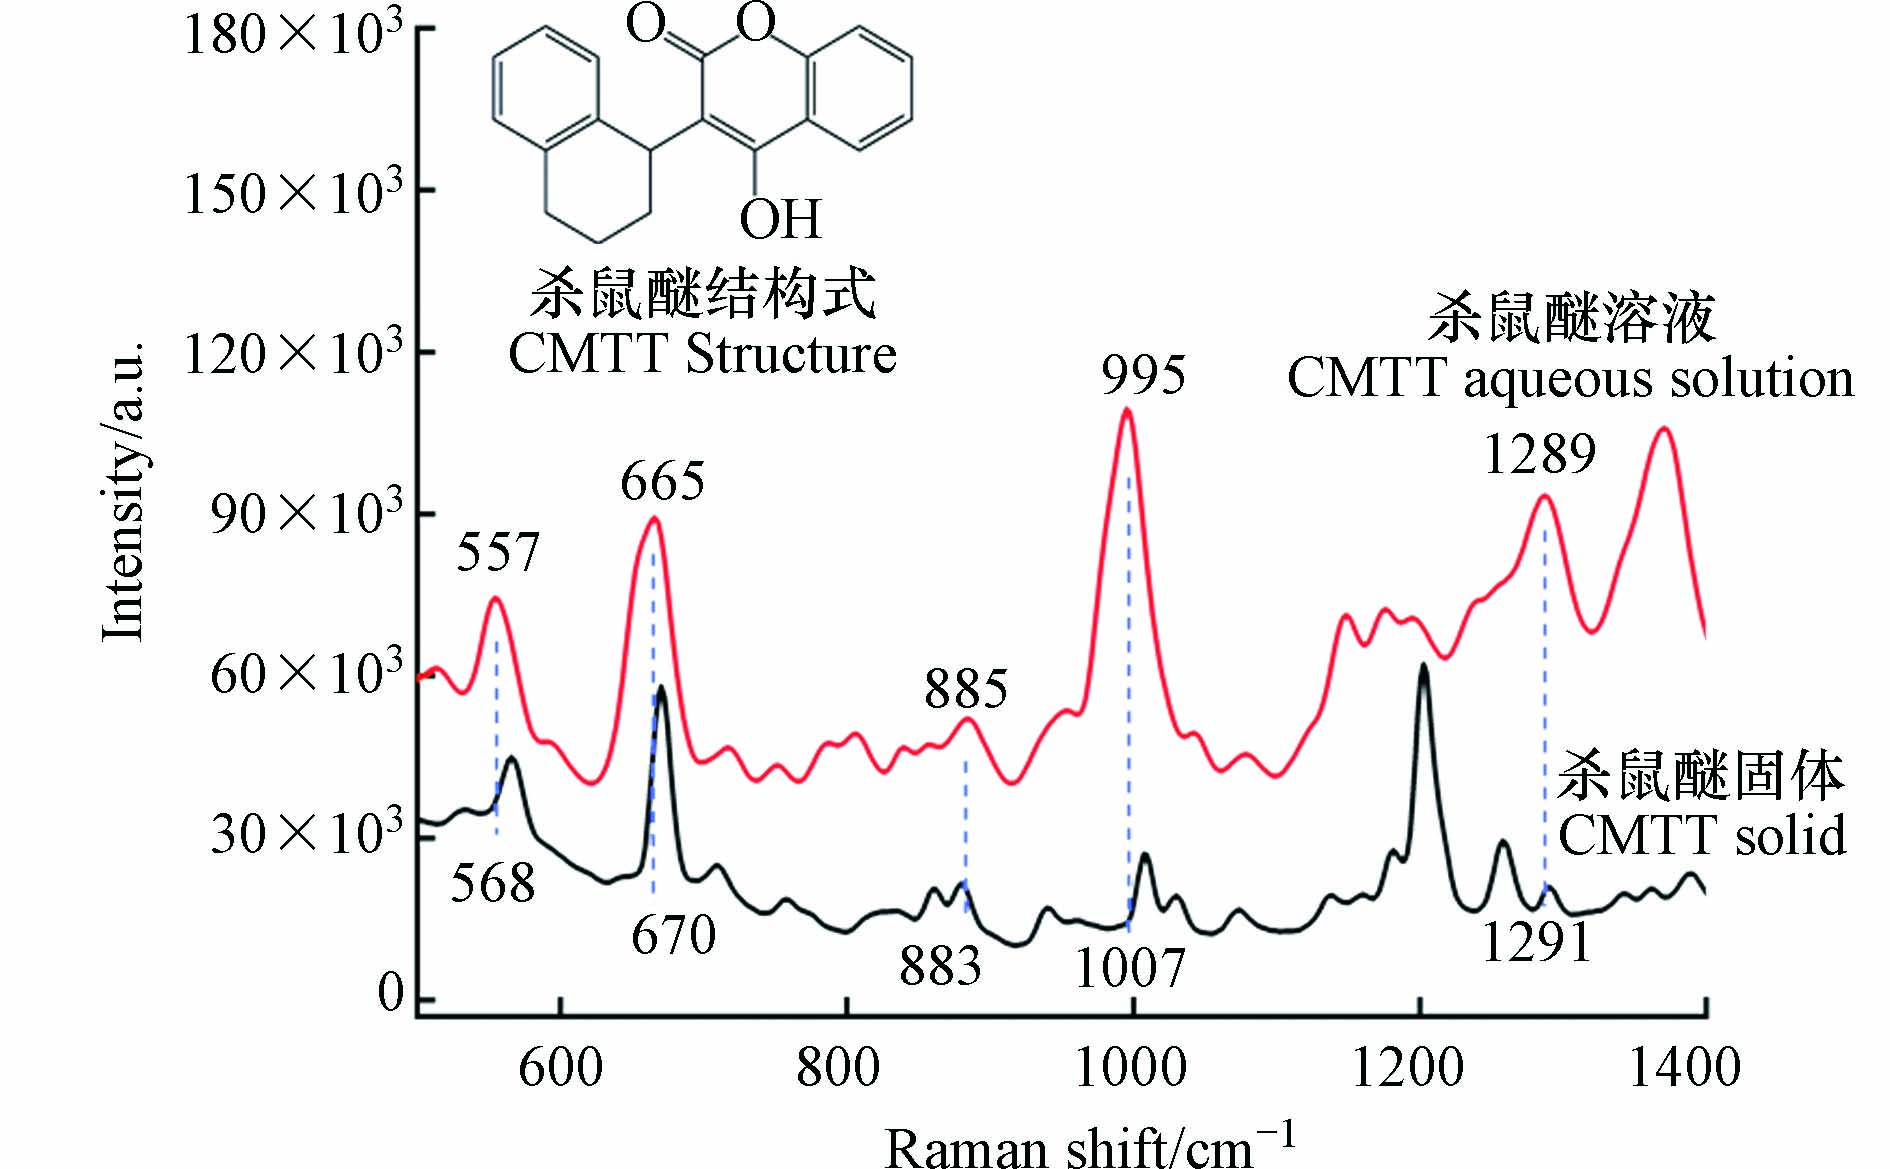
采用便携式拉曼光谱仪采集杀鼠醚固体的拉曼光谱和1 μg·mL−1杀鼠醚溶液的SERS光谱. 杀鼠醚由香豆素与四水萘连接形成(图3结构式). 香豆素具有活性的羟基官能团,可以通过化学反应生成各种结构的衍生物. 且在杀鼠醚结构中存在着孤对电子,既能与金属离子配位,又能参与氢键的形成. 因此,环境变化也会引起杀鼠醚结构的轻微变化,图3显示了杀鼠醚固体及其溶液间的位移(图3). 在杀鼠醚溶液中,固体样品在670 cm−1和1007 cm−1处的两个不同的SERS光谱带分别移动到665 cm−1和995 cm−1. 其他几处特征峰也发生了变化,表明杀鼠醚在溶液中的构型发生了改变. 但几个特征峰的出现仍然表明杀鼠醚的存在. 665 cm−1处的特征峰归属于芳香环中的C—C—C[14],而995 cm−1处的特征峰由C—H振动引起[15],557 cm−1的SERS谱带主要与苯环呼吸模式有关[16],885 cm−1的SERS谱带归因于CH2模式[17],1289 cm−1处主要是由于C—H弯曲模式[16]. 在本研究中,选取SERS信号强度最佳、峰型独立且清晰的995 cm−1处的SERS信号作为定量信号.
-
盐离子的加入导致纳米金聚沉,并在相邻纳米颗粒之间形成热点. 基底的性能往往会受到聚沉程度和聚沉时间的影响[18-19]. 为此,本研究对聚沉盐类型、聚沉盐浓度以及聚沉时间等实验参数进行了优化,以提高检测的灵敏性.
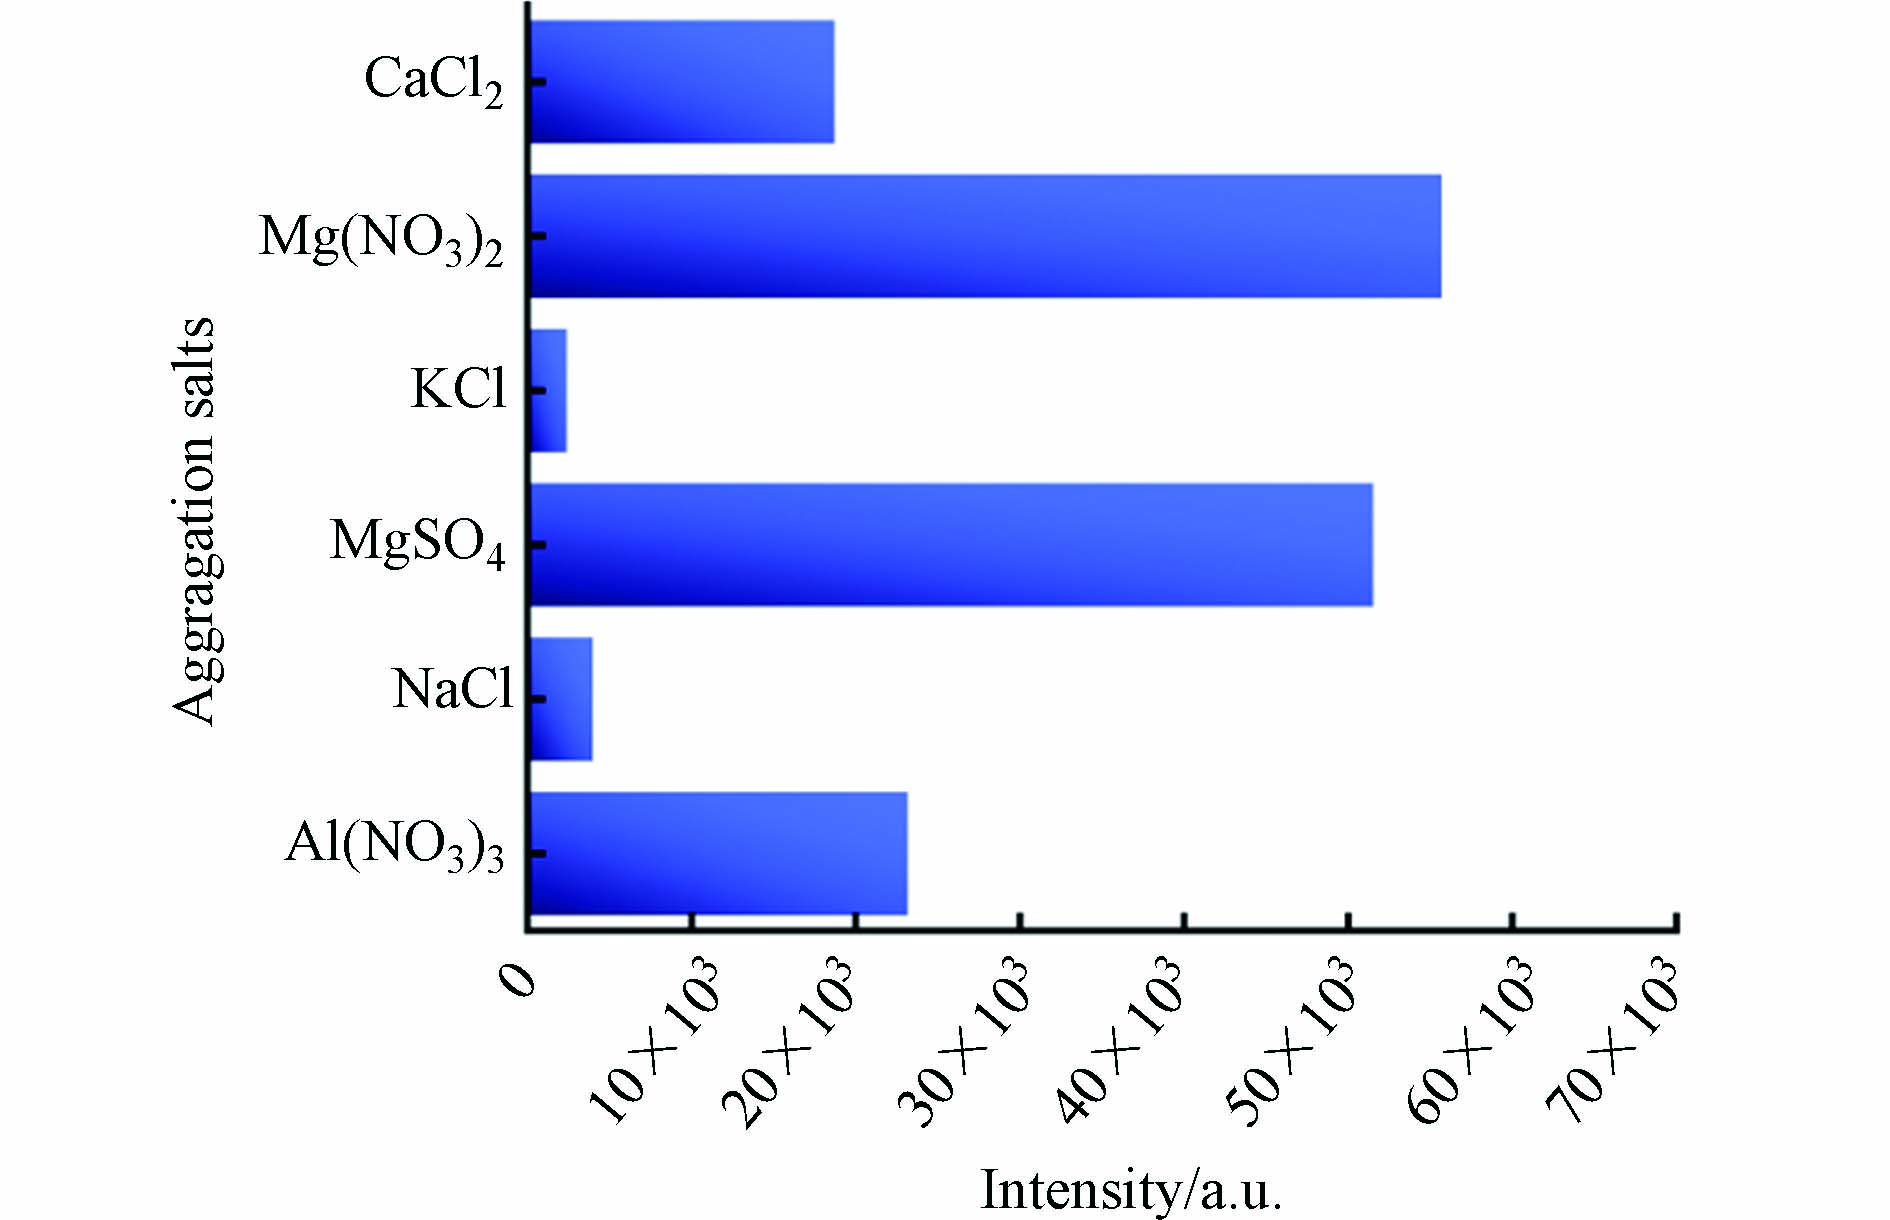
聚沉盐种类的影响 比较了6种浓度相同(0.5 mol·L−1)的聚沉盐对1 μg·mL−1杀鼠醚的SERS强度影响(995 cm−1). 结果表明,硝酸镁对信号的增强作用最为显著,其增强作用顺序为硝酸镁>硫酸镁>硝酸铝>氯化钙>氯化钠>氯化钾(图4). 先前的研究表明,二价和三价阳离子比一价阳离子能更有效地诱导纳米颗粒的聚沉[20]. 纳米金胶体溶液由于其表面电荷相同且相互排斥而保持稳定. 这种胶体粒子只能在吸附离子和组成吸附层的一些异性离子中带电并稳定. 当向胶体中加入盐时,阳离子或阴离子的浓度增加,导致最初分布在扩散层的异性离子被挤压到吸附层[21]. 这导致扩散层变薄,最终降低了zeta电位的稳定性[22]. 随后,粒子之间的斥力减弱从而引起团聚[23]. 当胶体粒子聚集成更大的粒子时,热点产生,导致表面增强共振,进一步增强拉曼信号[24-25]. 通过上述结果,本研究选择硝酸镁作为聚沉剂用于后续的实验.
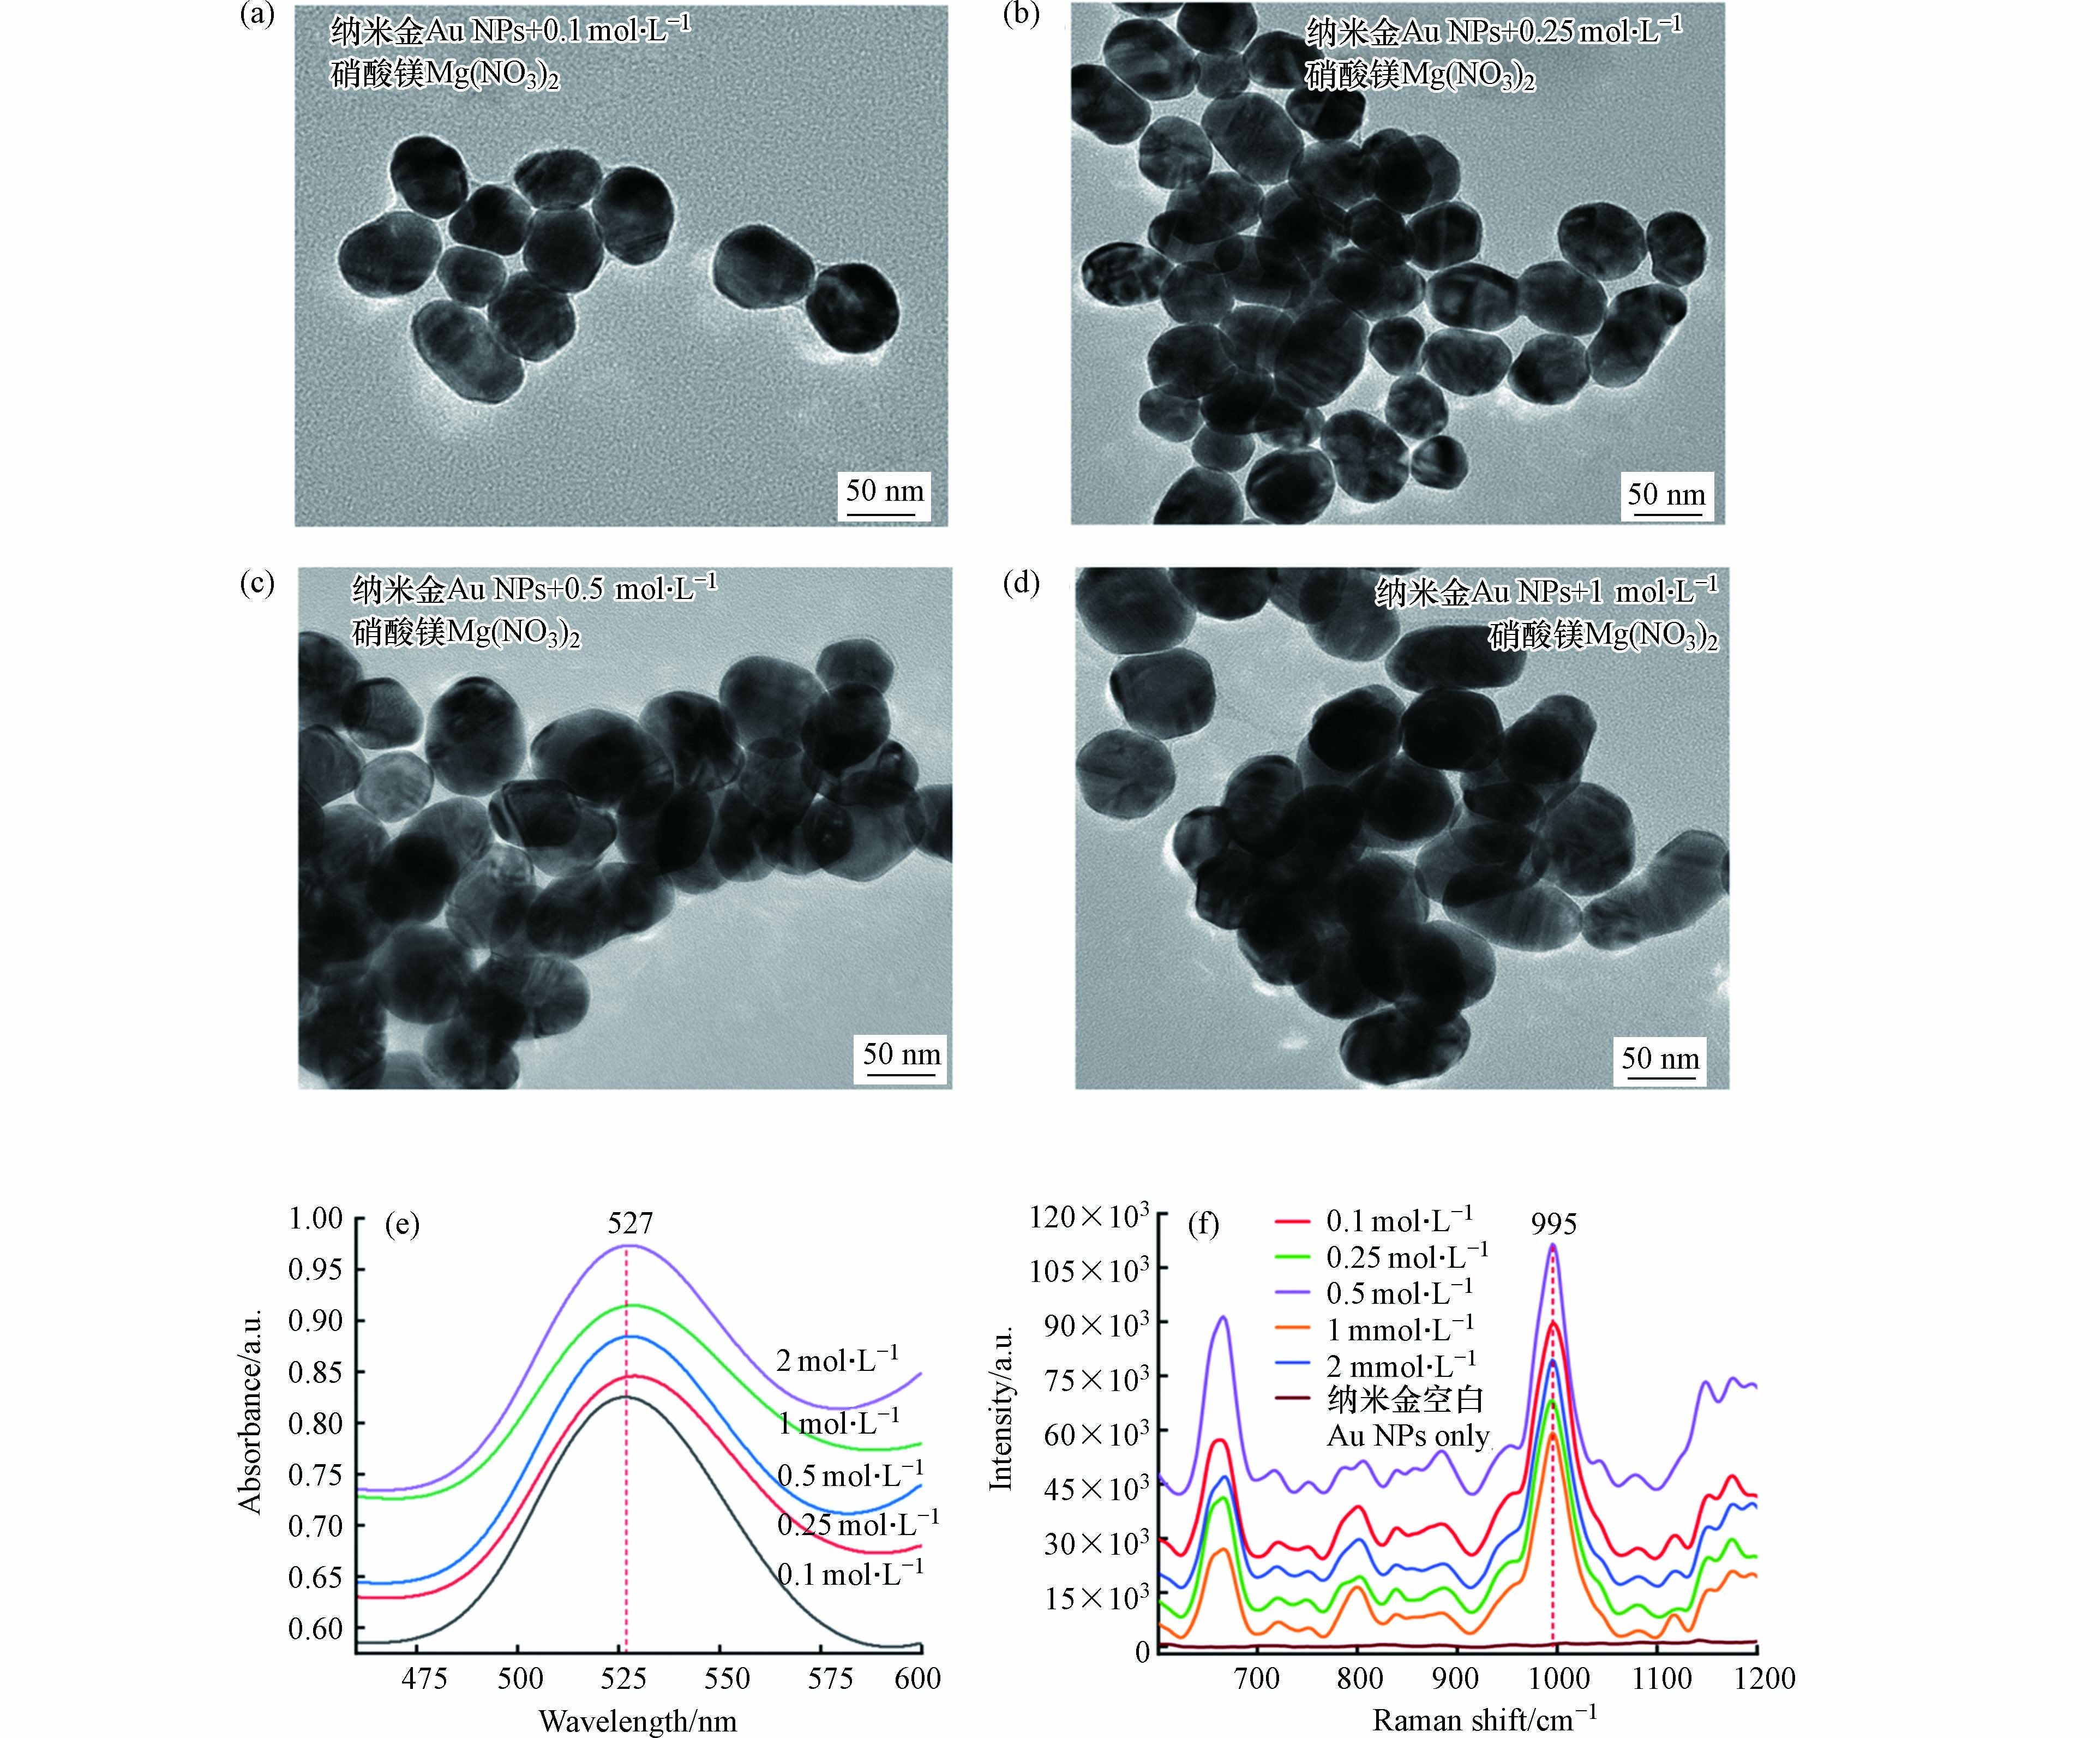
聚沉盐浓度的影响 图5a—5d为不同浓度硝酸镁诱导纳米金聚沉后的TEM图像. 加入聚沉盐后,纳米颗粒间隙变小并融合、团聚. 且随加入聚沉剂浓度的增加,纳米颗粒团聚现象越明显. 如图所示,低浓度的硝酸镁导致纳米金聚集不足,而较高浓度的硝酸镁则会导致过度聚沉[26],这两者都会使得信号增强效果不佳.
本研究比较了5个浓度(0.1、0.25、0.5、1、2 mol·L−1)的硝酸镁对纳米金胶体溶液聚沉的程度,以及对995 cm−1处的特征峰信号强度信号增强的影响. 图5e显示了不同浓度的硝酸镁诱导纳米金聚沉后的紫外-可见光谱变化. 图5f显示,0.5 mol·L−1的硝酸镁可以诱导产生最强的SERS信号. 因此,本研究采用0.5 mol·L−1硝酸镁溶液作为聚沉剂.
图6a记录了使用0.5 mol·L−1硝酸镁诱导聚沉后连续30 min的紫外-可见光谱变化图,从图中可以看出吸光度强度随时间变化不大,说明加入0.5 mol·L−1硝酸镁聚沉后,溶液体系较为稳定.
聚沉时间对SERS信号的影响 本研究记录了加入聚沉剂后的SERS信号时间变化趋势(60 min). 结果显示,SERS信号在1 min内即可达到最大值,随后缓慢下降,在第3—30 min保持相对稳定. 因此,以3 min为最佳聚沉时间(图6b). 根据之前的一项研究[27],在上述优化的条件下,平均增强因子计算为1.29×10⁵. 具体计算公式如下:
AEF = (ISERS/CSERS)/(IRS/CRS)
其中,IRS代表的是非SERS条件下浓度为CRS的待测物溶液的拉曼强度,ISERS代表的是SERS基底上相同待测物的拉曼强度,浓度CSERS可能不同.
-
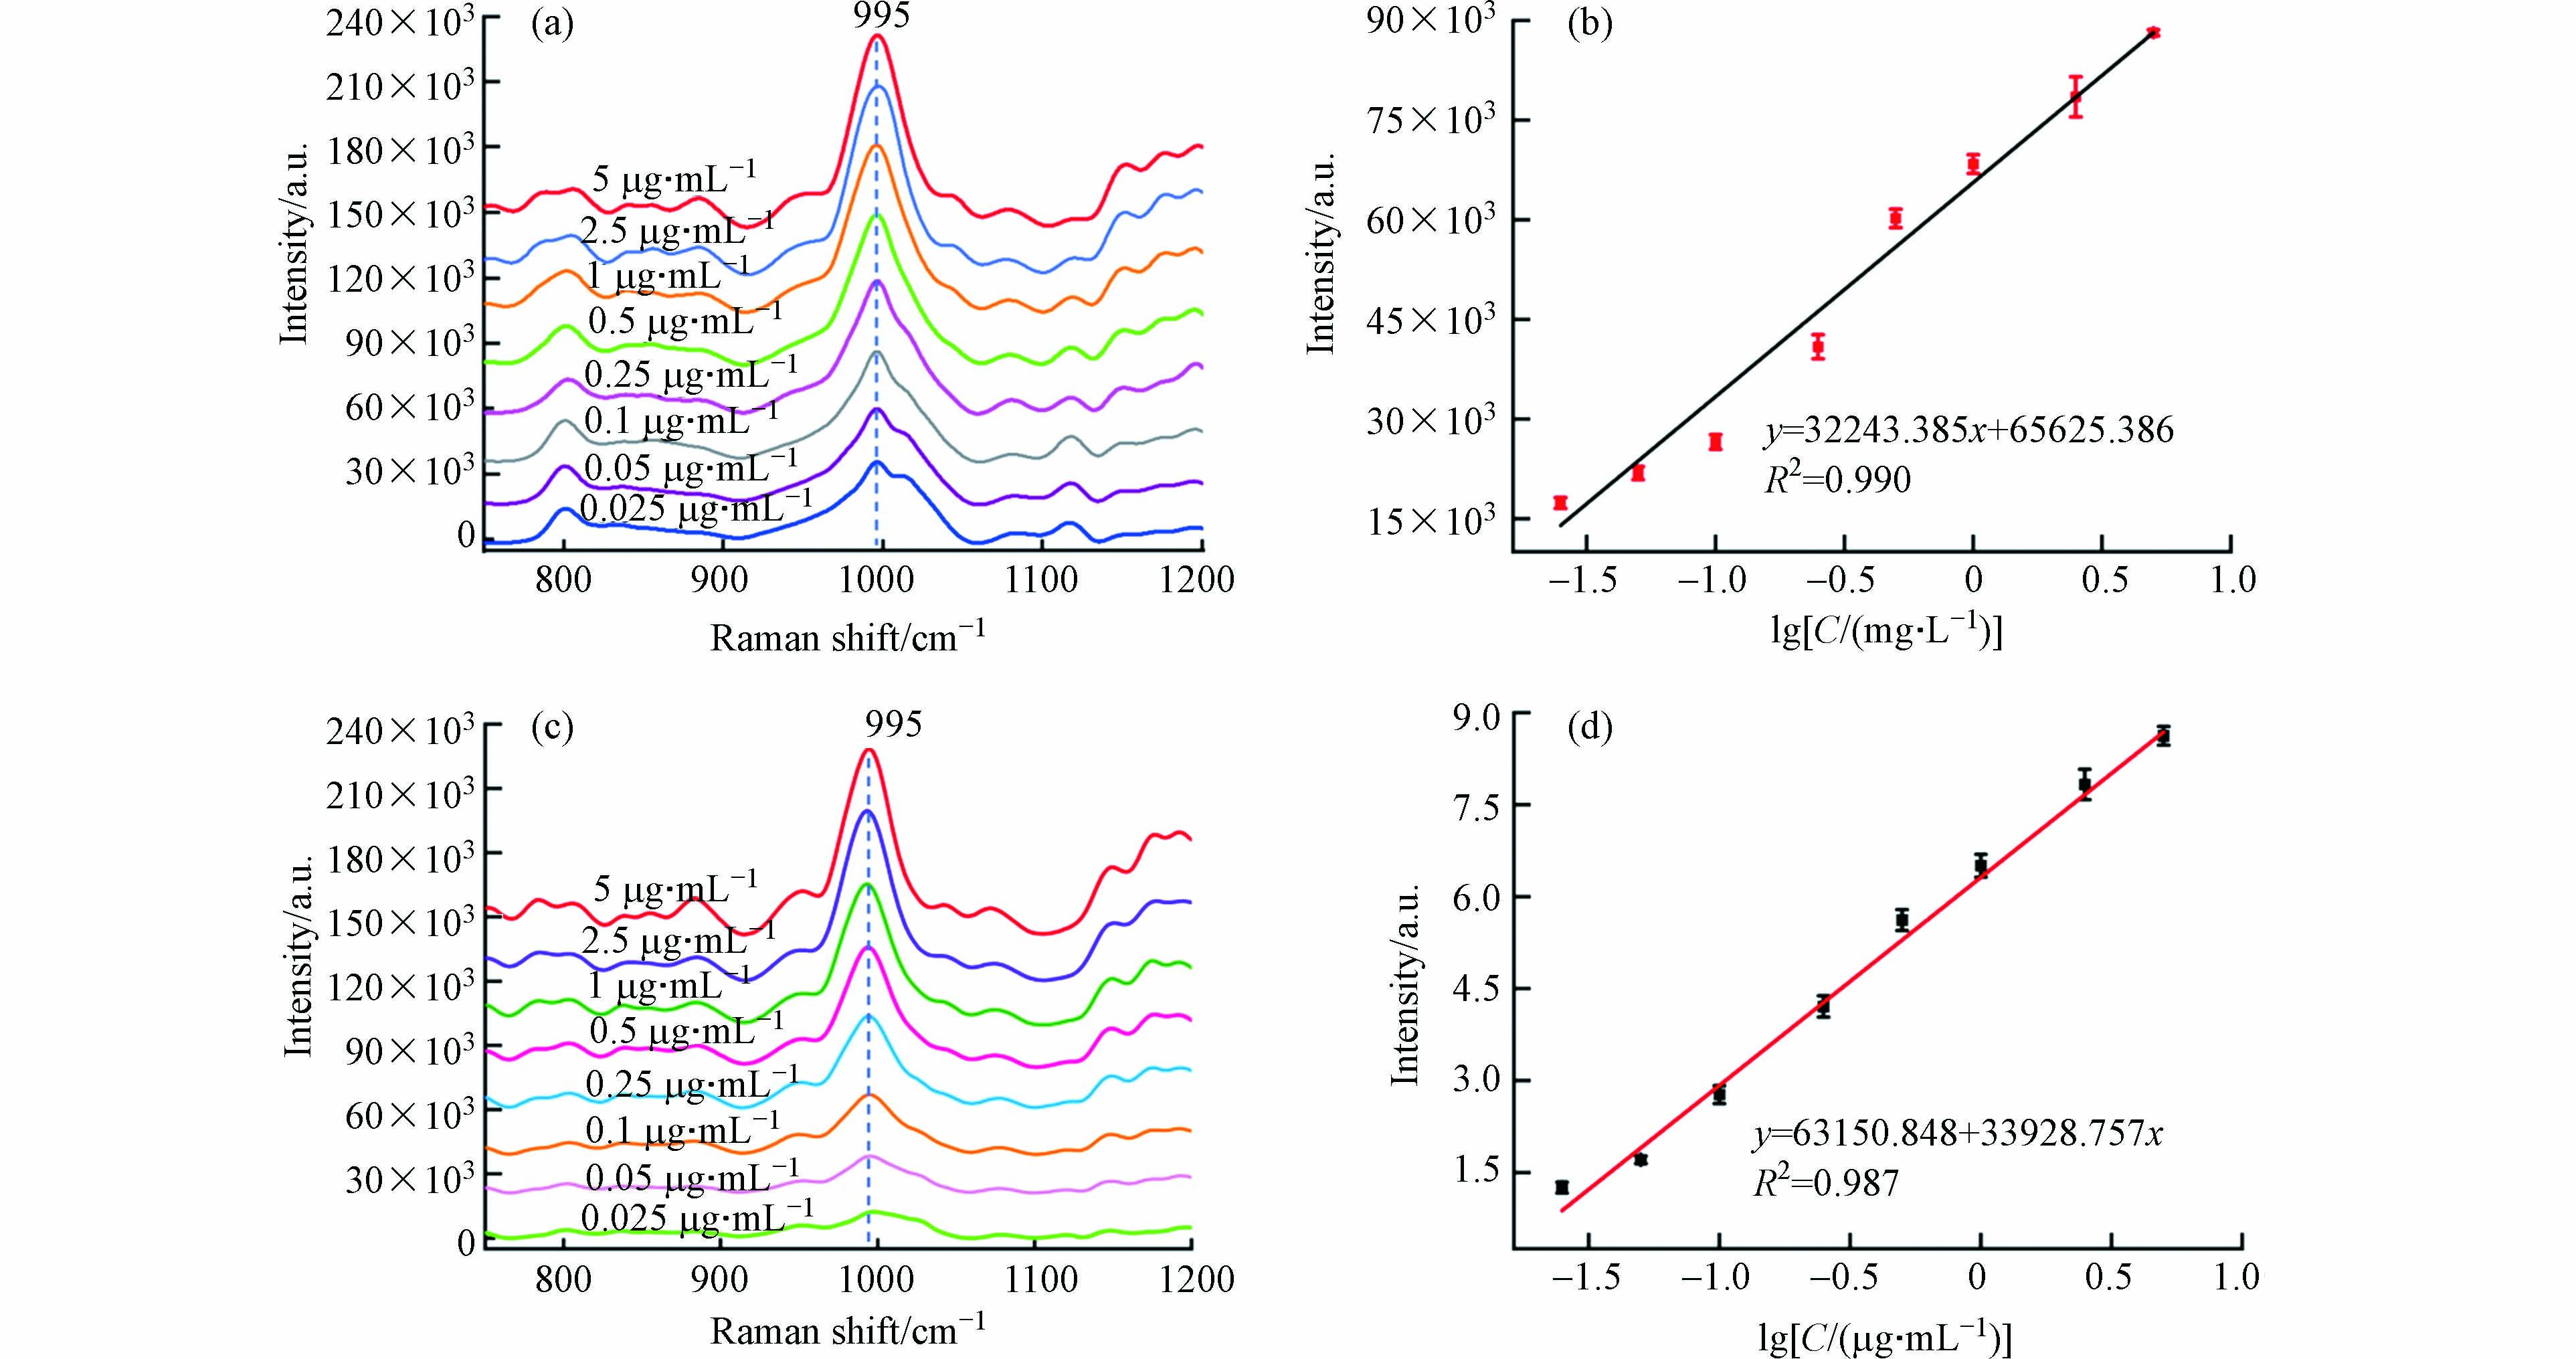
在纳米金中加入不同浓度梯度的杀鼠醚溶液,使用便携式拉曼光谱仪进行SERS检测. 图7a显示,杀鼠醚最显著的SERS峰位于995 cm−1处,该特征峰的强度随着浓度的增加显著增加. 图7b显示了995 cm−1处拉曼光谱强度与对数浓度的定量校准曲线. 在0.025—5 μg·mL−1范围内,杀鼠醚溶液浓度与SERS信号值呈明显的线性关系(R2 = 0.990),可以满足定量检测要求.
-
为了验证所提出的SERS方法的可行性和实用性,在加标的真实环境水中进行了杀鼠醚检测. 使用便携式拉曼光谱仪可以直接采集杀鼠醚的信号,无需样品预处理,3 min内即可完成定性和定量检测. 995 cm−1处的SERS信号强度随着杀鼠醚浓度的增加而增加,与标准水溶液中的趋势相似(图7c),并且两者之间线性关系良好(图7d).
-
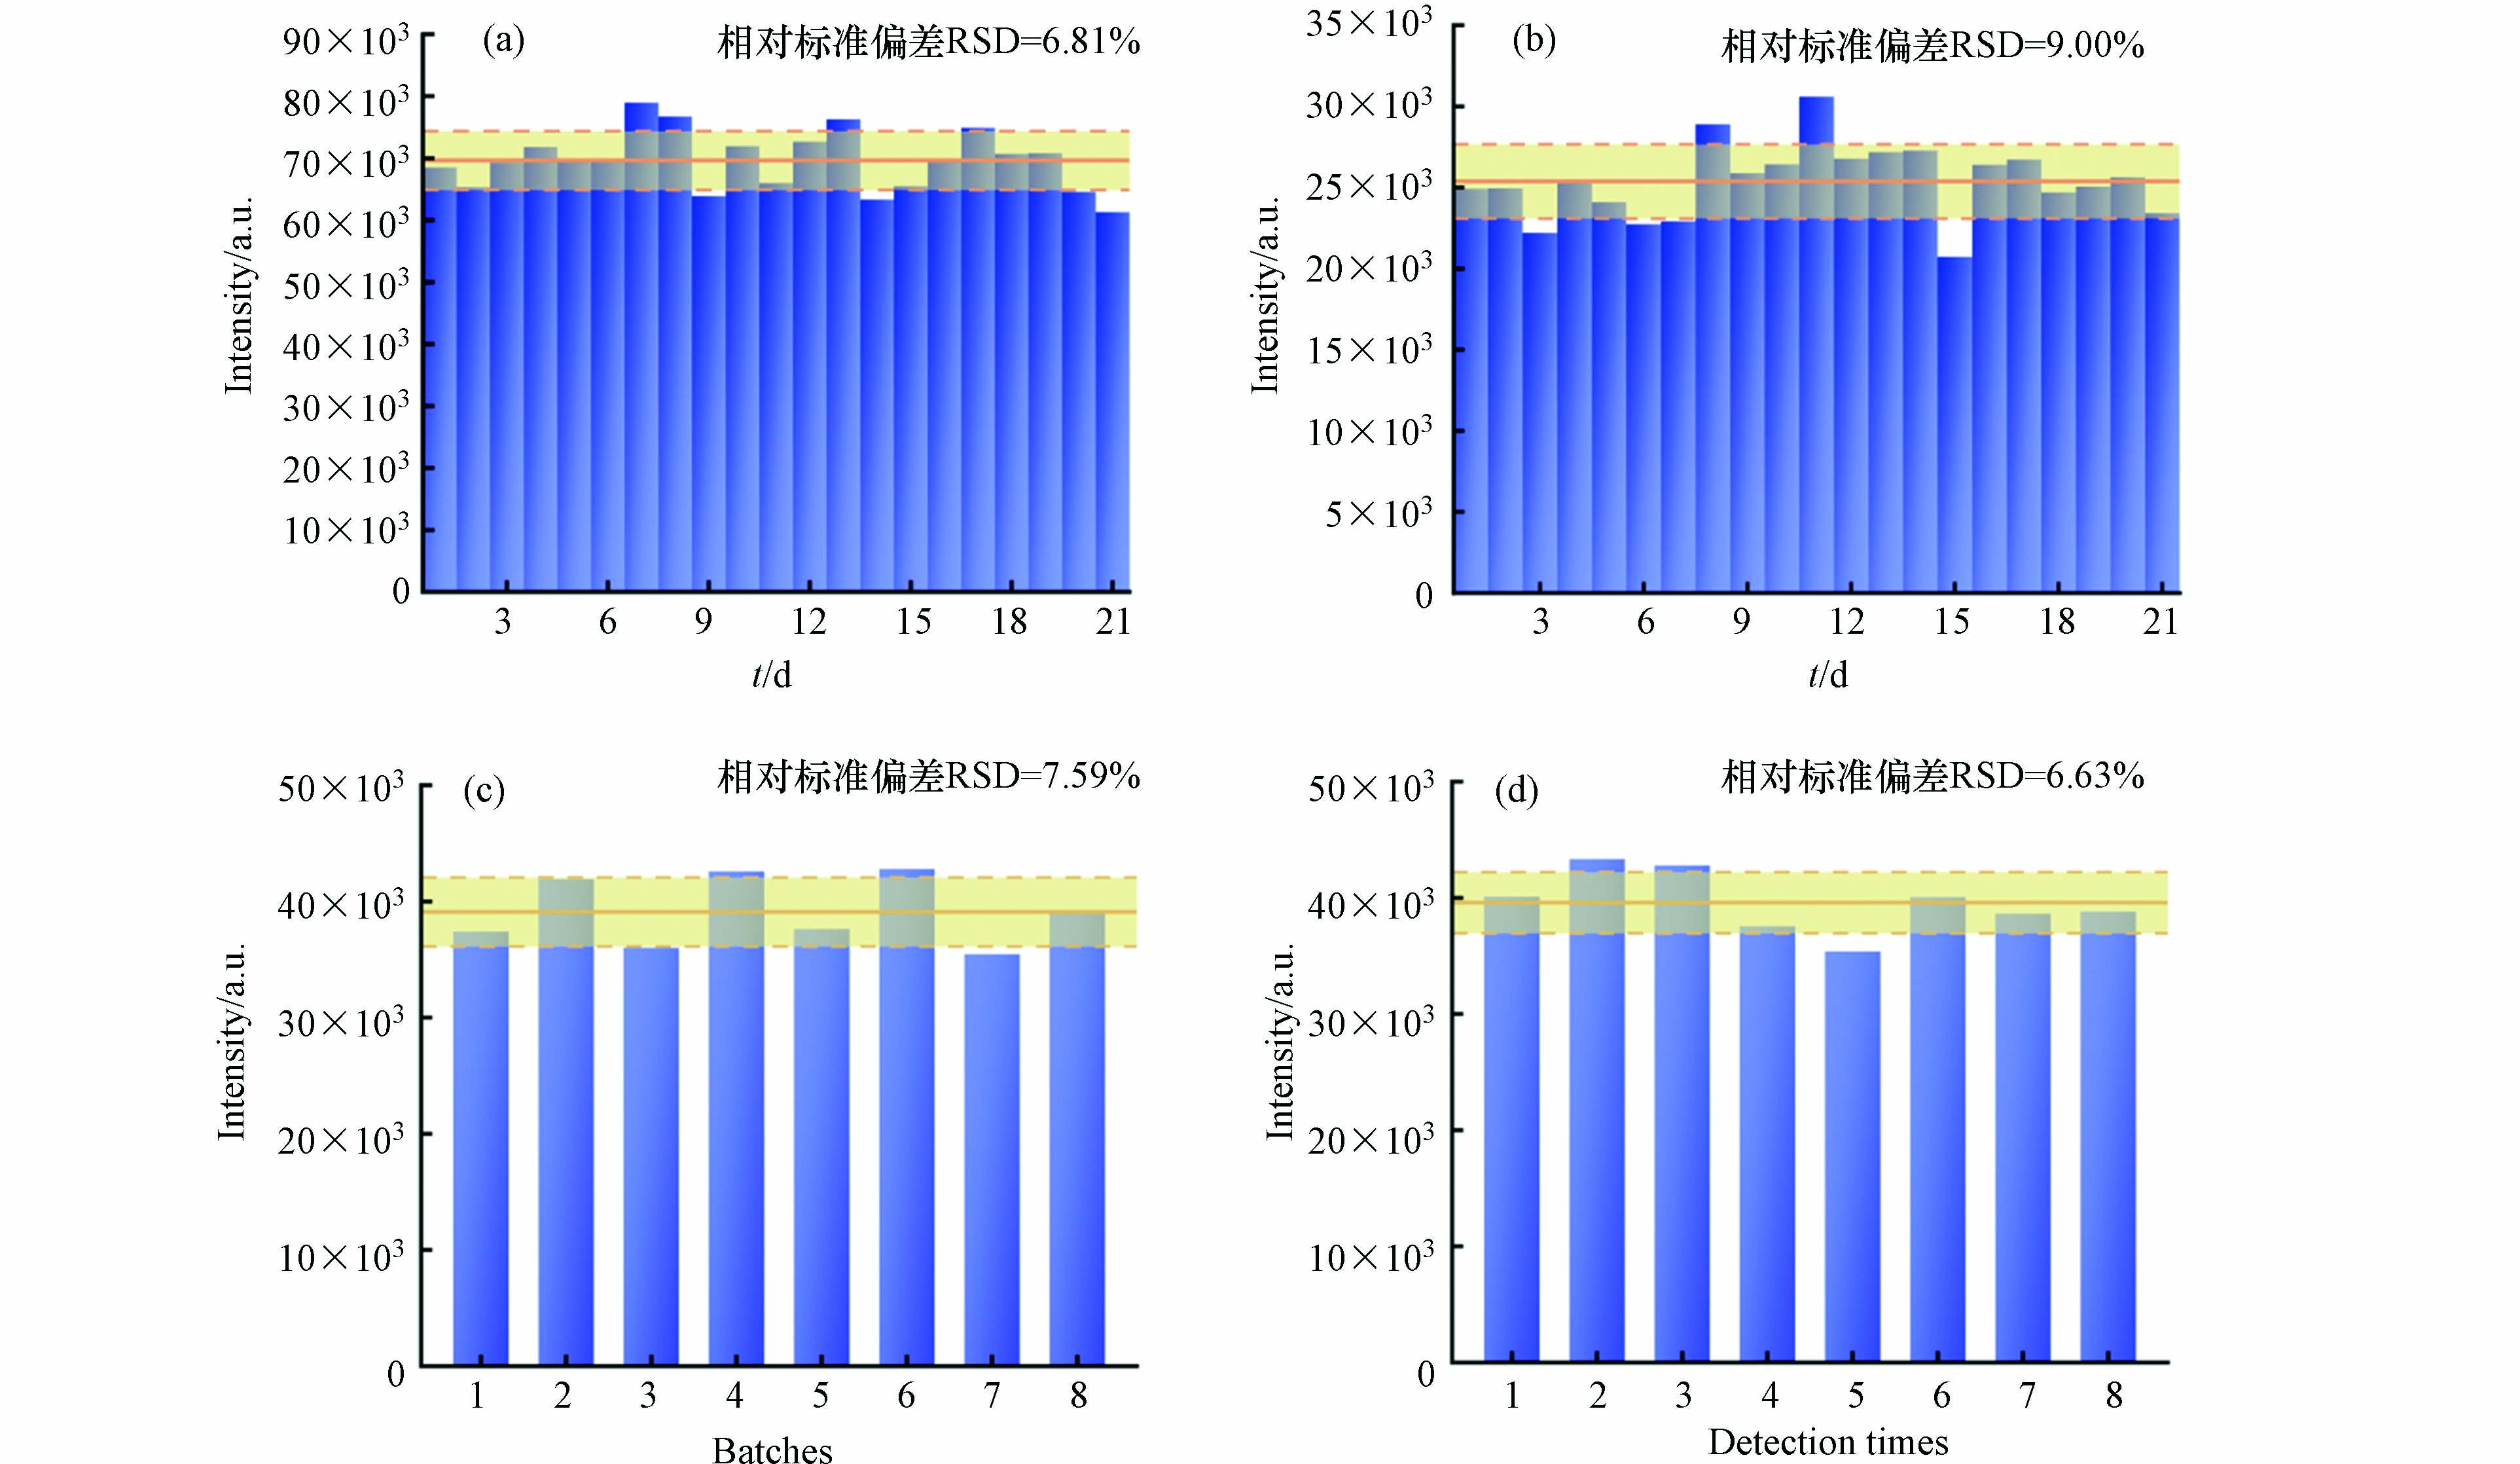
获得重复稳定的SERS信号是评估基底性能的关键参数. 本研究选择浓度为0.05 μg·mL−1和1 μg·mL−1的杀鼠醚溶液,采用同批次的SERS基底,在不同时间内进行了21次平行实验. 由图8a和图8b可知,1 μg·mL−1和0.05 μg·mL−1对应的相对标准偏差(Relative standard deviation,RSD)分别为6.81%和9.00%. 这些结果表明,该基底可以提供高重复性的结果. 此外,为了确定所制备基底在实际加标水中的重现性,比较了8个不同批次和同一批次使用该基底的检测效果,发现RSD均在10%以内(图8c—8d),良好的重复性和重现性有助于保证该SERS方法的稳定性.
-
用建立的SERS方法对环境水中杀鼠醚的加标回收率及检出限进行了测定. 制备已知浓度的加标杀鼠醚溶液,以模拟受污染水中杀鼠醚的含量. 测得水中平均回收率为90.2%—98.2%,相对标准偏差为2.69%—6.40% (n=8)(表1). 按照常规计算方法[28],计算出本方法在真实水样中的检出限为1.53 ng·mL−1. 结果表明,该方法可作为环境水中杀鼠醚现场检测的一种有效手段.
-
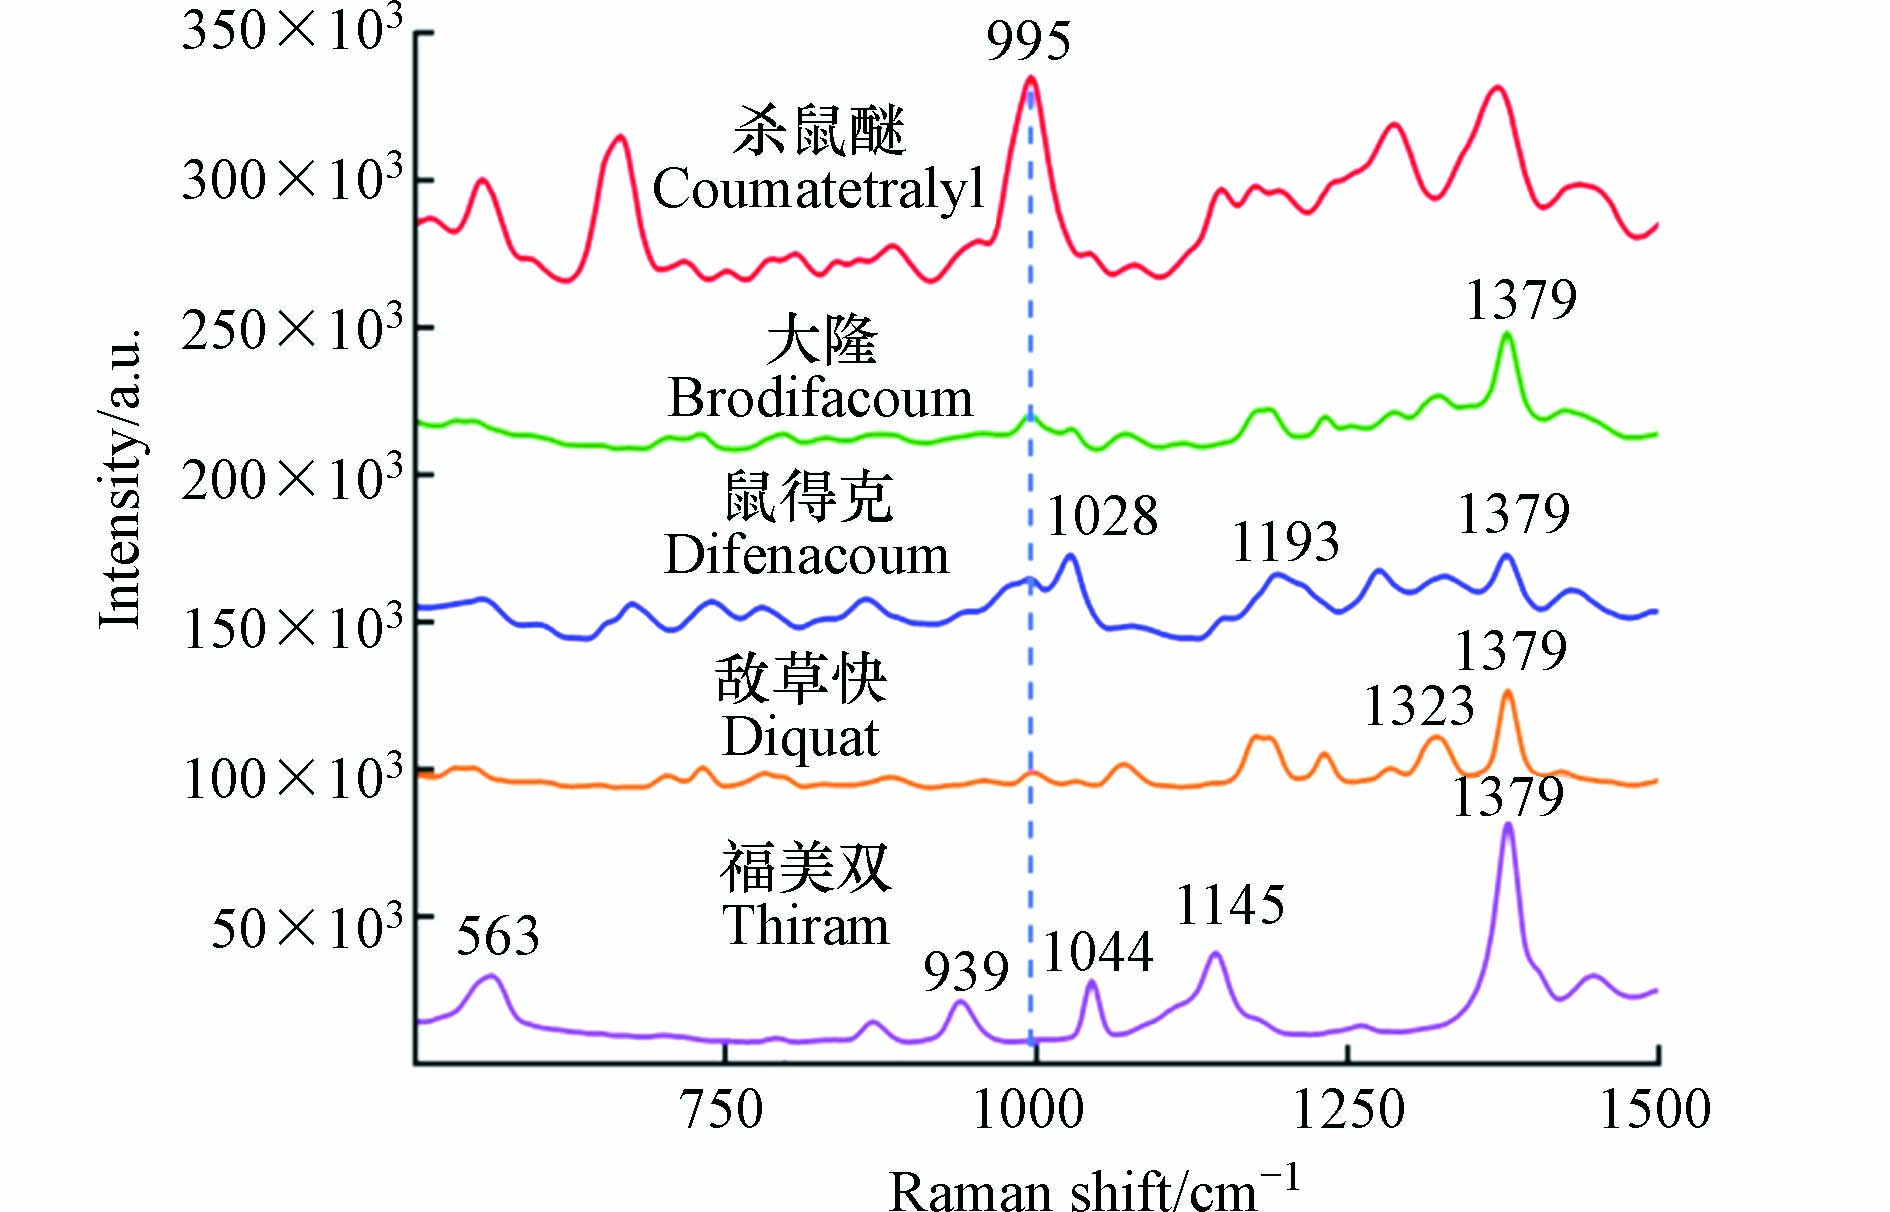
环境水中可能存在其他种类的混合农药残留,因此通过对几种潜在共存的农药(大隆、鼠得克、敌草快和福美双)进行SERS检测(图9),评估了在本方法对杀鼠醚的选择性. 结果显示,几类农药的SERS谱带各不相同,展示了拉曼技术获取化合物指纹谱的优点,信号来源如表2所示[29-30]. 同时,由于其他物质在995 cm−1处均未出现明显的SERS信号,因此不会对杀鼠醚的定量检测造成影响. 由于杀鼠醚所产生的SERS峰强度最高,说明本研究制备的纳米金基底对杀鼠醚具有良好的信号增强效果.
-
本文建立了一种快速的定性和定量检测环境水中杀鼠醚的SERS方法. 通过对实验条件进行优化,该技术测得环境水中的检出限为1.53 ng·mL−1,加标回收率为90.2%—98.2%,相对标椎偏差在2.69%—6.40%之间. 本方法简单、快速,仅需3 min即可完成检测,仪器可便携,不受场地限制. 此高灵敏度、高特异性的检测方法可以为杀鼠醚环境水污染事故的现场应急分析提供一种便捷的检测手段.
基于表面增强拉曼光谱技术的环境水样中杀鼠醚的现场快速检测方法
Rapid on-site detection of coumatetralyl in environmental water based on surface-enhanced Raman spectroscopy
-
摘要: 杀鼠醚在水环境中的蓄积可对生态系统造成破坏,并对人体健康产生不利影响. 本文利用表面增强拉曼光谱(SERS)技术,构建环境水中杀鼠醚的简单、快速定性及定量检测分析方法. 采用化学合成法制备了粒径为45—60 nm的纳米金作为SERS活性基底,以便携式拉曼光谱仪作为检测平台,实现了3 min内完成环境水中杀鼠醚的检测. 通过对实验条件进行优化,该方法的检出限低至1.53 ng·mL−1,加标回收率为90.2%—98.2%. 在浓度为0.025—5 μg·mL−1范围内,杀鼠醚浓度与SERS信号强度间呈现出良好的线性关系,R2 = 0.990. 与传统方法相比,该方法操作简单、快速、成本低廉,为水中杀鼠醚的现场检测分析提供了可靠的新选择.Abstract: The accumulation of coumatetralyl (CMTT) in the aquatic environment has caused damage to the ecosystem and adversely affected human health. In this paper, a simple and rapid qualitative and quantitative analysis of CMTT in environmental water was carried out using surface-enhanced Raman spectroscopy (SERS). Gold nanoparticles with a particle size of 45—60 nm were prepared by chemical synthesis method and used as SERS substrate. Combined with a portable Raman spectrometer, the whole detection process could be completed within 3 minutes. By optimizing the experimental conditions, the detection limit of this method was 1.53 ng·mL−1, and the recovery was 90.2%—98.2%. In the range of 0.025—5 μg·mL−1, the response between the concentration of CMTT and SERS signal intensity showed a clear linear dependence, R2 = 0.990. Compared with the traditional method, this method was simple, rapid and low-cost, providing a reliable application scenario for detecting and analyzing CMTT in water.
-
全氟化合物(perfluoroalkyl substances,PFASs)是一类碳原子连接的氢原子全部被氟原子取代的有机化合物,因其优良的理化性能,被广泛用于化工、皮革和医药等工业及日常生活领域中[1]. 近年来已在大气、水和土壤等[2-4]环境介质及生物体中[5]被广泛检出. 现有的研究已经充分证明PFASs具有内分泌毒性、致癌性、神经毒性及生殖毒性等毒理效应,对环境和生物均存在潜在风险[6-7],因此2009年和2019年,全氟辛烷磺酸(perfluorooctane sulfonate,PFOS)及其盐类、全氟辛酸(perfluorooctanoic acid,PFOA)先后被列入《斯德哥尔摩公约》并加以限制生产和使用. 然而由于经济和生产需求,PFASs的生产逐步转移到亚洲,尤其是中国[8]. PFASs一旦进入环境后能够随着大气发生长距离迁移,到达海拔较高的地区发生“高山冷凝效应”,从而导致高海拔地区成为污染物的“接收器”[9].
现有的研究证实,树木能够有效截留大气中的有机污染物[10],对有机污染物的全球迁移及分布有重要影响[11-12]. 近年来,树木年轮因其分布广泛、样本易得、连续性强等特点,已经作为环境监测的一种手段[13]. 已有学者利用树木年轮作为指示研究大气环境中的多环芳烃、多溴联苯醚等持久性有机污染物(persistent organic pollutants, POPs)[14-15]的迁移及污染特征. 然而,PFASs不同于传统的持久性有机污染物,具有高表面活性、水溶性强等特点,能否用树木年轮来指示大气中的PFASs,并且对其污染历史进行反演,目前尚不清楚. 因此,有必要展开相关研究,探讨树木年轮对大气中PFASs的指示及污染历史重建,以期为偏远地区PFASs的生态风险评估提供科学依据. 目前公认的PFASs在全球的蓄积库为海洋沉积物,而森林植被占陆地面积的31%[16],若对PFASs有富集,其蓄积量不能忽视. 然而目前鲜有研究报道PFASs在森林中的蓄积能力,因此,本研究以横断山区雅砻江下游的云南松(Pinus yunnanensis)年轮为研究对象,分析其PFASs的污染特征与来源,反演PFASs在该地区的污染历史,并计算PFASs在云南松树干中的积累量,明确森林植被对PFASs迁移蓄积的重要性.
1. 材料与方法(Materials and methods)
1.1 研究区域概况
横断山区位于青藏高原东南部,覆盖四川、西藏、青海、云南等省区,总面积达50余万km2,由一系列南北走向的高大山脉和深切河谷组成[17]. 研究区域位于横断山区南部,雅砻江下游河谷地带,气候为干湿分明的亚热带气候,垂直方向的变化明显,植被以云南松为主. 该地人口密度小、地区社会经济不发达,因而本地污染源较少,能够反映污染物通过大气长距离迁移对该地区的影响. 云南松属乔木,是我国西南地区的特有树种,平均高达5—20 m,胸径70—150 cm,横断山区云南松常见树龄为30年左右,适用于对PFASs的历史重建分析[18].
1.2 样品采集
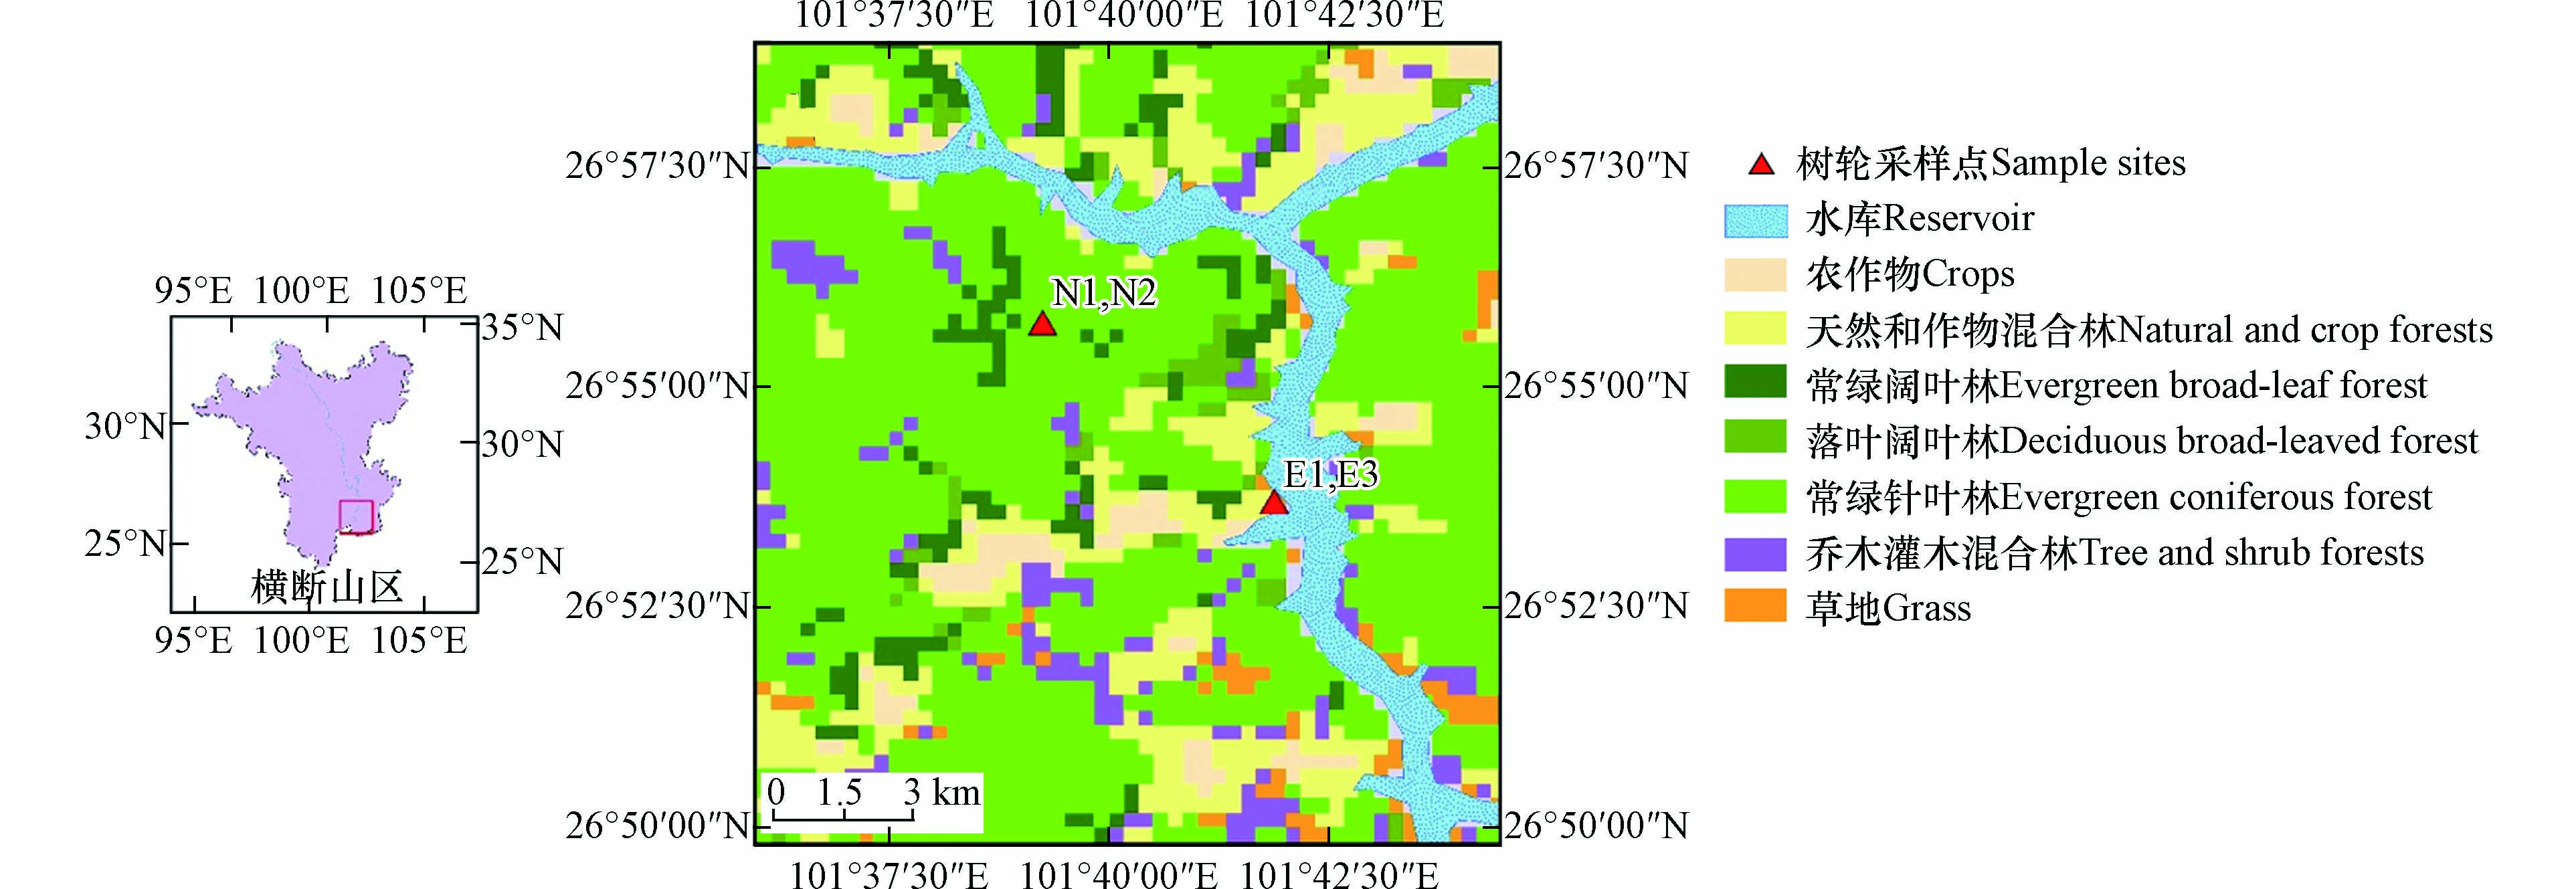
采样地点位于雅砻江河谷二滩水电站库区周边山坡,位于四川省攀枝花境内(101°30′54″E,26°54′7″N). 为避免污染,采样所使用的工具均提前用超纯水和甲醇清洗并干燥,采用内径为5.15 mm的生长锥钻取树芯样,采集位置为距离地面1.3 m处树干位置,分别于2017年8月和2018年1月采集3个(E1、E2、E3)和2个(N1、N2)年轮样品,采样点位置及周边植被情况见图1.
将采集的云南松树芯样品装入聚丙烯采样袋中带回实验室,进行捆绑处理后风干、打磨,通过LINTAB年轮仪测量年轮宽度,利用COFECHA程序辅助交叉定年(排除伪轮、缺轮的影响),实现已知年龄和未知年龄的年轮衔接,最终精确定出每个年轮的生长年份. 树芯基本信息见表1.
表 1 树芯样本信息Table 1. The information of tree core samples树芯Tree cores 位置Location 海拔/mAltitude 胸围/cmDBH 树干高度/mTree height 定年Dating 经度Longitude 纬度Latitude E1 101°41′E 26°53′N 1300 76 12 1993—2012 E2 1300 76 12 1992—2011 E3 1300 73 9 1993—2010 N1 101°39′E 26°55′N 2045 101 16 1992—2011 N2 2045 97 15 1991—2010 1.3 实验材料及试剂
甲醇(色谱纯/99.8%,成都市科龙化工试剂厂)、氨水(25%,成都市科龙化工试剂厂)、Milli-Q超纯水.
实验所用标准样品为高纯度混合标准品PFAC-MXB(Wellington公司),含有全氟羧酸类和全氟磺酸类化合物. 其中,羧酸类包括:全氟丁酸(perfluorobutanoic acid,PFBA)、全氟戊酸(perfluoropentanoic acid,PFPeA)、全氟己酸(perfluorohexanoic acid,PFHxA)、全氟庚酸(perfluoroheptanoic acid,PFHpA)、全氟辛酸(perfluorooctanoic acid,PFOA)、全氟壬酸(perfluorononanoic acid,PFNA)、全氟癸酸(perfluorodecanoic acid,PFDA)、全氟十一酸(perfluoroundecanoic acid,PFUnDA)和全氟十二酸(perfluorododecanoic acid,PFDoDA). 磺酸类包括:全氟丁烷磺酸(perfluorobutanesulfonic acid,PFBS)、全氟己烷磺酸(perfluorohexanesulfonic acid,PFHxS)和全氟辛烷磺酸(perfluorooctanesulfonic acid,PFOS). PFAC-MXA为高纯度混合碳同位素标记品(Wellington公司),包括:13C4-PFBA、13C2-PFHxA、13C4-PFOA、13C5-PFNA、13C2-PFDA、13C2-PFUnDA、13C2-PFDoDA、13O2-PFHxS和13C4-PFOS.
1.4 样品前处理
由于一年的年轮生物量较少,处理起来误差较大,因此将年轮样品从1991—2012年以每两年为一个样品进行切割. 样品的萃取及净化方法参照Jin等[19]处理树皮中PFASs的方法,并在此基础上进行优化. 树木年轮经真空冷冻干燥后研磨粉碎,称取0.1 g左右至15 mL聚丙烯离心管中,加入2 ng内标,涡旋混合均匀后静置过夜. 加入5 mL甲醇,涡旋30 s,超声30 min,以250 r·min−1振荡1 h,再以3000 r·min−1离心10 min,提取上清液至新的15 mL PP管中. 重复上述过程2次,将3次上清液合并,温和氮吹至5 mL后用Envi-Carb固相萃取小柱(500 mg/6 mL)净化. 过柱前分别用5 mL 0.1%氨水甲醇溶液、5 mL超纯水、5 mL甲醇对固相萃取柱进行活化,活化完成后将样品溶液以每秒1滴的流速过萃取柱并用新的15 mL PP管收集流出液,然后使用5 mL甲醇洗脱收集残留在固相萃取柱上的PFASs,两部分溶液合并后氮吹至1 mL转移至样品瓶中,于4 ℃保存,待测.
1.5 仪器分析
实验采用超高效液相色谱串联三重四极杆质谱仪(1290-6470),C18色谱柱(Zorbax SB-C18,2.1 mm×50 mm,1.8 μm). 色谱条件:柱温35 ℃,进样量5 μL,流动相采用5 mmol·L−1乙酸铵溶液(A相)和甲醇(B相),流速0.4 mL·min−1. 流动相梯度洗脱程序:0.00—0.10 min,A相比例为90%;0.10—6.00 min,A相比例由90%降为5%;6.00—8.00 min,A相比例为5%;后运行2 min. 质谱条件:电喷雾离子源;负离子模式(ESI);多反应离子检测(MRM)模式分析;雾化气压力0.24 MPa;电喷雾电压3000 V;干燥气温度250 ℃.
1.6 质量控制与保证
本研究采用内标法定量,标准曲线浓度为0、0.5、1、2、5、20、40 ng·mL−1,线性关系r > 0.99. 为降低实验背景及误差,样品在前处理过程中均避免接触和使用玻璃以及聚四氟乙烯容器. 样品前处理过程中每10个样品设置1个方法空白;测定时,每10个样品设置1个溶剂空白. 回收率实验设置两个不同浓度(2 ng·g−1,20 ng·g−1),每个浓度水平3个平行,方法回收率为72.5%—100.7%(表2),满足实验要求.
表 2 PFASs在年轮中的检出限及回收率Table 2. Detection limits and recoveries of PFASs in tree rings目标物 Objects 检出限/(ng·g−1) MDL 回收率/% Recovery(Avg±SD) 加标2 ng Add standard 2 ng 加标20 ng Add standard 20 ng PFBA 0.003 98.0±1.1 96.1±0.3 PFPeA 0.007 78.9±10.3 74.5±3.0 PFHxA 0.022 100.7±0.6 89.2±1.7 PFHpA 0.002 98.1±4.9 96.5±8.7 PFOA 0.012 98.2±3.2 88.8±1.0 PFNA 0.004 97.0±1.6 86.2±0.5 PFDA 0.011 100.4±1.7 90.1±1.8 PFUnDA 0.006 98.5±5.4 86.2±1.9 PFDoDA 0.006 98.0±1.8 87.5±1.5 PFBS 0.012 76.3±6.8 72.5±8.1 PFHxS 0.008 99.3±5.9 98.9±1.4 PFOS 0.005 97.1±1.8 92.0±1.1 对于没有在空白样品中检测出的PFASs,其方法检出限(MDLs)为3倍信噪比时对应的浓度;对于在空白样品中检测到的PFASs,其MDLs值为空白样品中浓度的均值加上3倍的标准偏差. 在处理数据时,检测值低于MDLs值时,用MDLs值除以
√2 1.7 PFASs积累量
本研究参照王荣芬[20]的方法对单位面积云南松树干中PFASs的积累量进行计算,具体方法如下:采用木材密度法即平均材积与木材密度的乘积计算得到云南松树干的生物量,平均材积根据样方内云南松树干高度和胸径在标准立木材积表[21]中查得后取平均值,木材密度采用树芯重量与树芯体积之比的平均值;然后根据树芯中PFASs的平均含量计算出单株云南松树干中PFASs的平均积累量. 再根据样方大小和样方内云南松密度计算单位平方千米内云南松树干对PFASs的储量,结果可为横断山区森林系统对PFASs的蓄积提供基础数据,计算公式如下:
M=ˉw⋅ˉN⋅n=ˉw⋅[¯(mπ⋅r2⋅R)⋅ˉV]⋅n (1) 公式(1)中,M为单位面积云南松树干中PFASs储量(g·km−2),
−w −N −V 2. 结果与讨论(Results and discussion)
2.1 年轮中PFASs的污染特征及来源解析
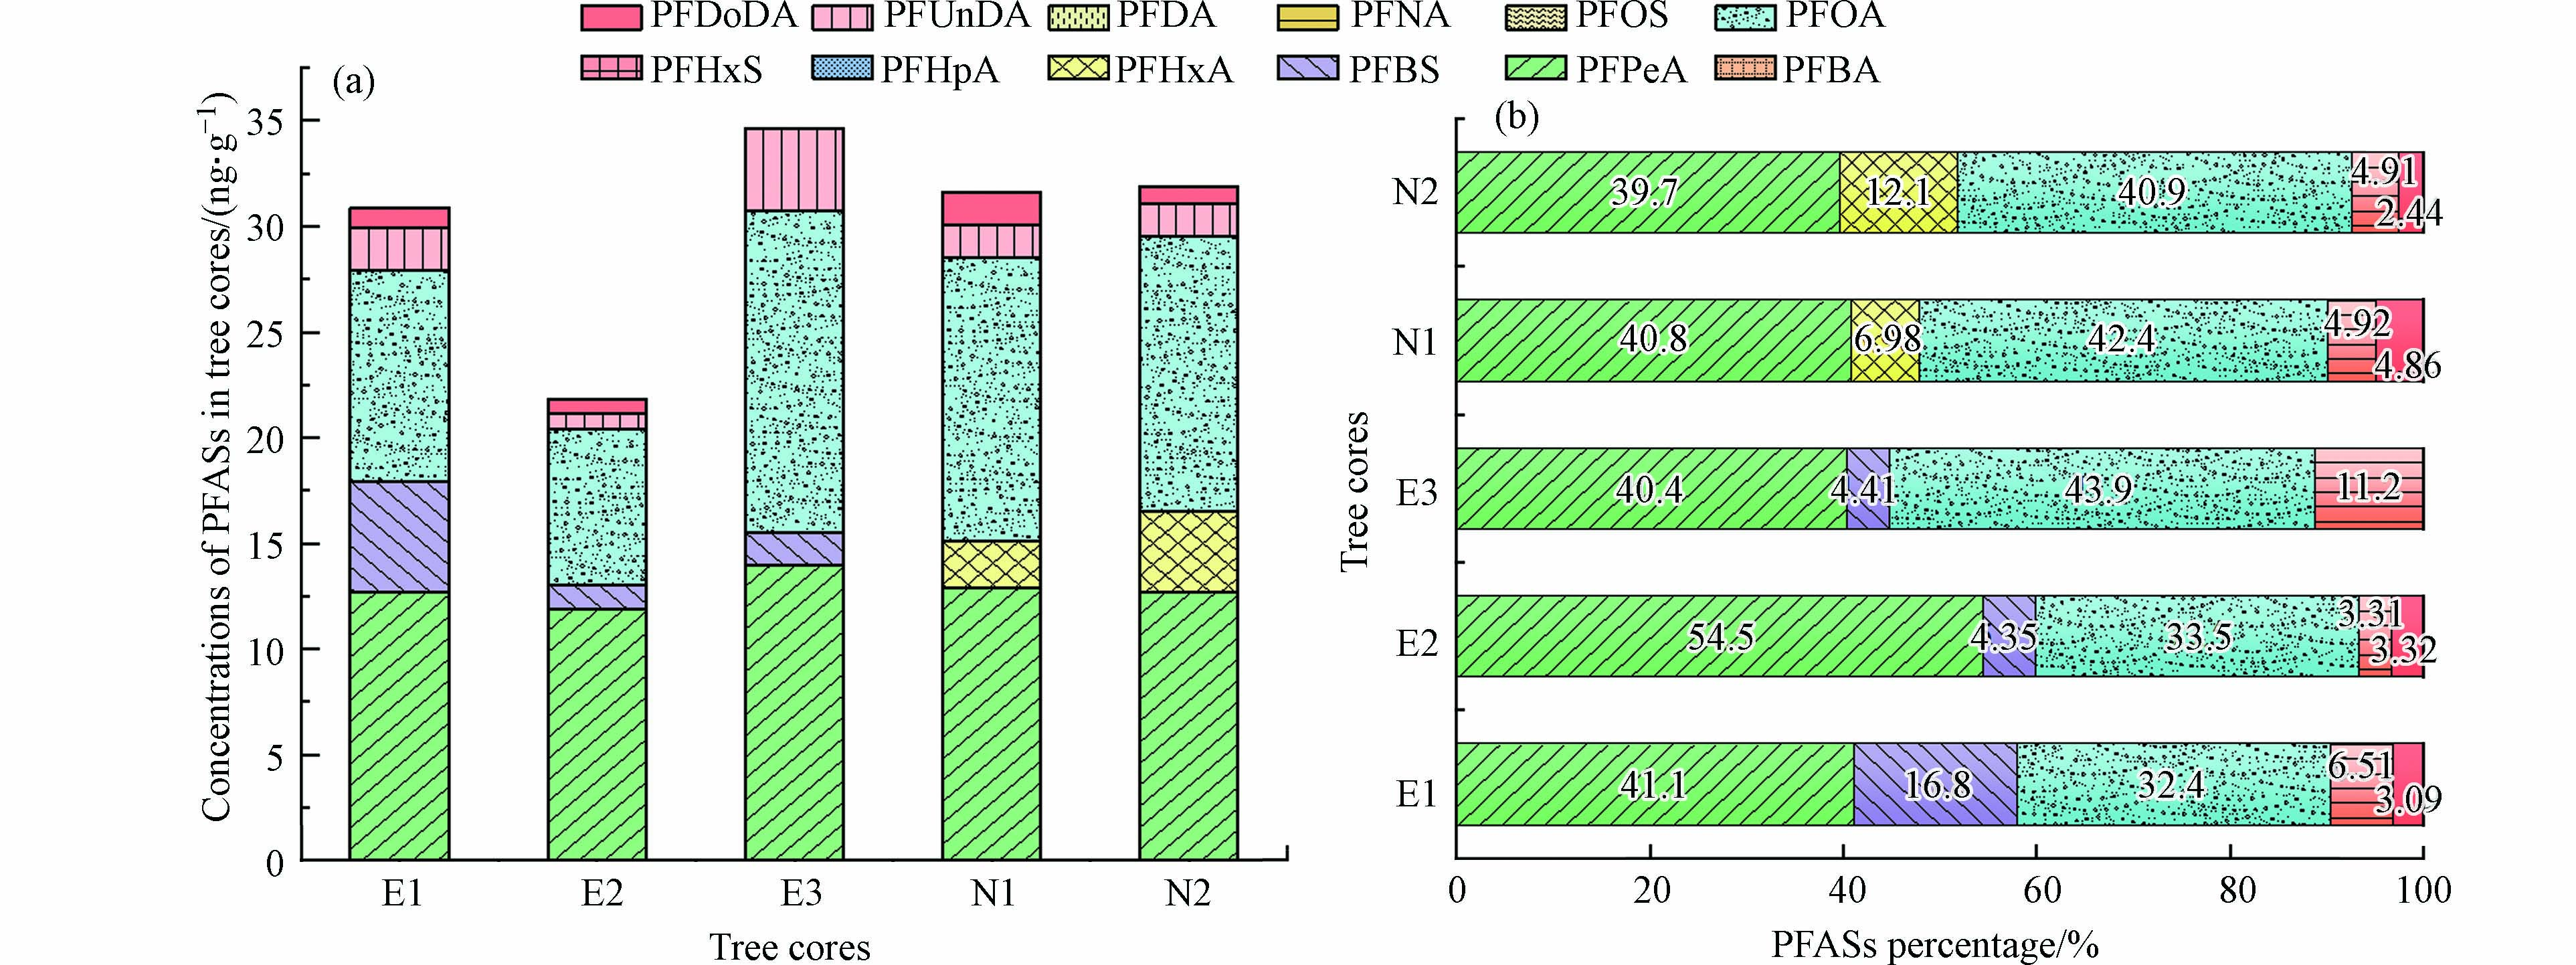
5个树芯样品中检出率最高的单体物质为PFOA和PFPeA,分别为91.8%和89.8%;其次为PFUnDA (22.4%)> PFBS(12.2%)> PFDoDA(10.2%)> PFHxA(6.12%);PFBA、PFHxS、PFHpA、PFOS、PFDA和PFNA均未检出. ΣPFASs浓度范围为nd—75.7 ng·g−1,平均值为30.9 ng·g−1,其中浓度最高的物质是PFPeA,平均值为12.7 ng·g−1;其次为PFOA,平均值为12.5 ng·g−1;然后依次为PFUnDA(1.99 ng·g−1)>PFHxA(1.43 ng·g−1)> PFBS(1.33 ng·g−1)> PFDoDA(0.95 ng·g−1),PFOA和PFPeA的浓度显著高于其余单体浓度. 5个树芯样品中ΣPFASs浓度分别为E1(31.0 ng·g−1)、E2(21.9 ng·g−1)、E3(34.6 ng·g−1)、N1(31.7 ng·g−1)和 N2(31.9 ng·g−1)(图2),平均浓度为(30.2±4.4 )ng·g−1. 魏明翠等[22]研究氟化学工业园周边树叶和树皮样品中的PFASs,得到树叶中ΣPFASs范围为4.90—185 ng·g−1,树皮中∑PFASs范围为0.240—95.4 ng·g−1;Shan等[23]以江苏省受污染地区的樟脑树叶为研究对象,测定树叶中PFASs浓度范围为10—276 ng·g−1. 与受污染地区植物的树叶及树皮中PFASs浓度相比,雅砻江下游云南松年轮样品中PFASs浓度约低1个数量级,此结果与研究地区的人口密度和工业发展程度相吻合. 此外,E为海拔1300 m的树木年轮((28.5±5.4)ng·g−1),N为海拔2045 m的树木年轮((31.8±0.1)ng·g−1),二者ΣPFASs浓度无显著差异. Taniyasu等[24]测定日本偏远山区与周边城市降雪中PFASs的浓度发现其与海拔高度无关;而Wang等[25]测定了山区中不同海拔高度的土壤中PFASs浓度,发现PFOA浓度随海拔高度增加而升高. 说明PFASs浓度的影响因素较复杂,即使是同一研究区域,也可能因样本不同、样本性质、周围环境等因素出现差异.
PFASs各单体在年轮中比例特征如图2所示,总体上PFASs的比例特征较为一致,均以短碳链和PFOA为主,其中PFPeA和PFOA占比分别高达54.5%和43.9%. PFOA作为树木年轮中PFASs的主要贡献者之一,和Jin等[19]及魏明翠等[22]的研究结果一致. E点年轮中均有检出PFBS,占比最高为16.8%;N点年轮中均检出了PFHxA,占比最高为12.1%,说明分别存在PFBS和PFHxA的污染来源. 在所有树芯中,长碳链的PFDoDA和PFUnDA基本上均被检出,占比最高分别为4.86%和11.2%.
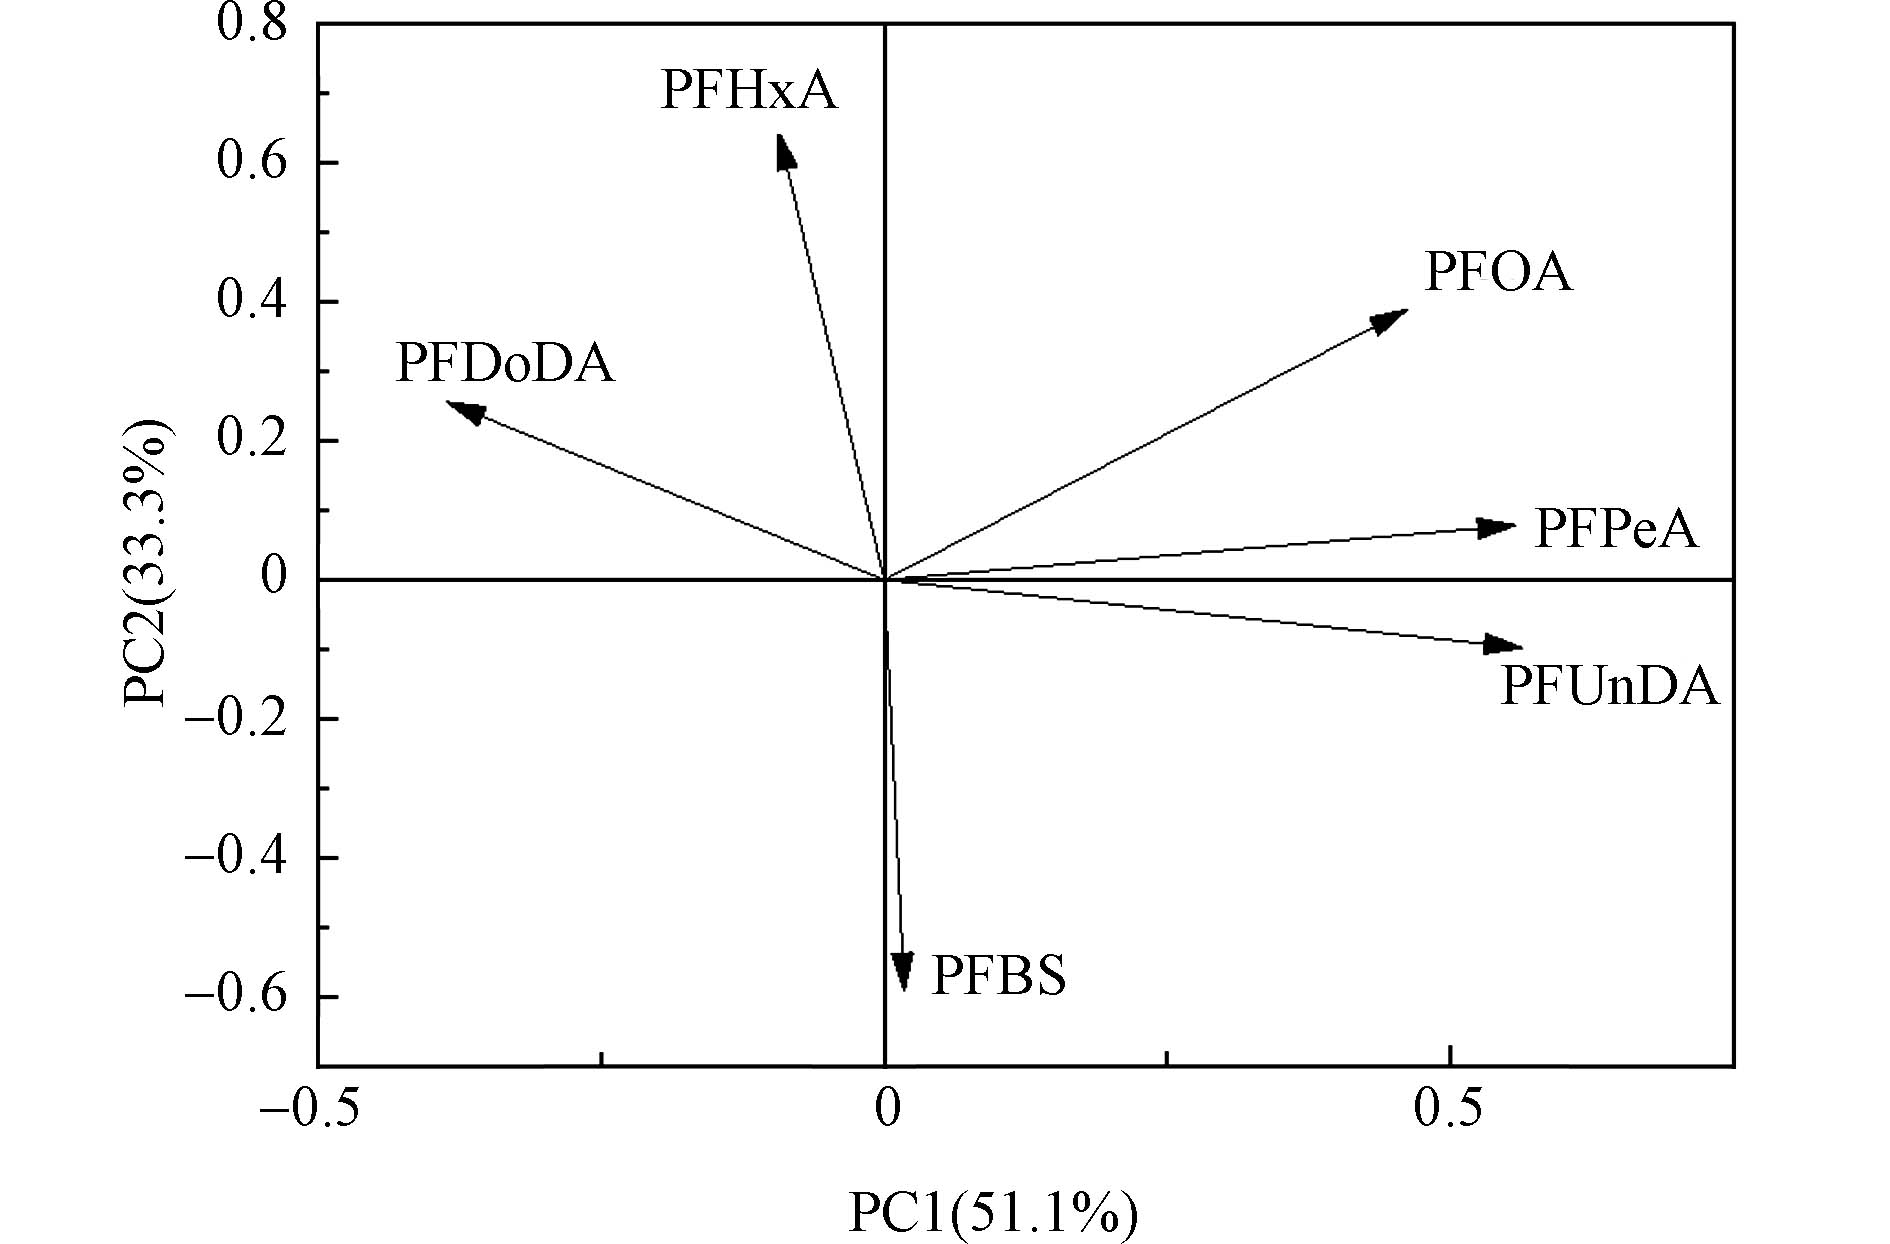
采用主成分分析法对云南松年轮中检出的6种PFASs解析,得到主成分分析图(图3),筛选出2个特征值 > 1的因子,累计方差贡献率达到84.4%. 其中,因子1可以解释年轮中51.1%的PFASs来源,PFUnDA、PFPeA和PFOA具有较高载荷值,分别为0.990、0.973和0.800;因子2可以解释年轮中33.3%的PFASs来源,PFHxA具有较高载荷值(0.911). 由于研究区域远离工业区,周围人类活动较少,说明该区域树木年轮中的PFASs大部分来自于大气远距离传输,PFASs到达偏远地区通常有两个传输途径:第一种为直接路径,PFASs因其较低的挥发性,能随大气和洋流直接在全球范围内进行迁移;第二种为间接途径,PFASs前体物质具有较强的挥发性或半挥发性,可随大气迁移后经过干湿沉降、降解进入偏远地区[26-28]. 研究表明,全氟烷磺酰胺(FASA)和全氟烷磺酰胺乙醇(FASE)可以转化为PFCAs和PFSAs[29],氟调醇(FTOHs)可以通过非生物或生物方式转化为PFCAs[30-31]. 相比于挥发性较强的PFASs前体物的长距离迁移,PFASs吸附到颗粒物上的迁移能力较弱,因此,树木年轮中较高浓度的PFASs可能是其前体物长距离迁移至横断山区河谷发生转化导致的. 横断山区地处川西高原,海拔较高,PFASs及其前体物可通过“蚱蜢跳效应”和“高山冷凝效应”逐步实现从大气到地表的迁移并在高海拔地区累积[32]. 因而森林成为偏远地区PFASs的“蓄积库”,应展开进一步研究,估算横断山区森林系统对PFASs的积累量,为高海拔地区的森林生态安全提供基础数据.
2.2 PFPeA和PFOA的历史重建
PFPeA与PFOA在E3、N1及N2中的检出率较高,因此,可以通过这3个树芯的年轮探讨PFPeA与PFOA在该区域的污染历史. 如图4所示,PFPeA在E3中1993—2008年的年轮间均有检出,其浓度随时间先降低后升高;在N1和N2中1992—2010年的年轮间均有检出,浓度随时间的变化没有规律性. PFOA在3个树芯年轮的1993—2010年均有检出,整体有升高趋势,尤其是2006年以后上升趋势较为明显,可能是因为全球将氟调聚物作为中间体广泛应用于生产的兴起,而氟调聚物的大气长距离迁移和光化学转化被认为是偏远地区环境中PFCAs主要来源[33].
数据结果显示PFPeA自1991年始就有检出,而PFPeA的生产及使用约从2000年后开始,与其生产使用历史存在明显差异,这可能是前体物的转化导致或者存在横向迁移. 物质的横向迁移表现为在年轮中的含量变化比实际污染历史相位超前或不存在年代变化规律[34],PFASs性质随碳链长度不同存在差异,可能导致不同的物质在年轮中存在不同程度的横向迁移. 另一方面,皮尔逊相关性分析发现PFPeA和PFOA存在显著相关性(r=0.887,P=0.045),PCA分析中也聚为一类,说明两者来源相似,进一步证明云南松年轮中的PFASs来源于大气中前体物的转化. 这也就说明年轮中PFASs的含量变化不符合其生产使用历史且无规律性主要是由于相关前体物的影响. 研究表明,FTOHs可通过生物转化和非生物转化的方式生成PFPeA和PFOA,在微生物接种实验中8:2 FTOH和6:2 FTOH均可以转化为PFPeA和PFOA[35];Ellis等[30]将4:2 FTOH、6:2 FTOH、8:2 FTOH等3种FTOHs在光化学烟雾箱中进行降解反应,结果检测到PFOA及其它代谢产物. 说明FTOHs能够经生物降解和光化学转化生成PFCAs,这些产物以及PFASs颗粒物可通过植物根系和叶片吸收向植物体内传输. 另外PFASs前体物可在植物体内经生物代谢转化为PFASs,如6:2 FTOH和8:2 FTOH能被大豆根吸收向茎和叶传输并逐级代谢生成PFPeA、PFOA及其他代谢产物[36-37]. 因此,在利用树木年轮对PFASs进行历史重建可能会受自身横向迁移以及前体物转化的影响,不能直接用于PFASs的历史反演.
2.3 云南松树干中PFASs积累量
实验数据显示,高低海拔树芯中PFASs平均含量
−w −N 3. 结论(Conclusion)
(1)横断山区河谷云南松年轮中共6种PFASs被检出,ΣPFASs浓度范围为nd—75.7 ng·g−1,检出率最高的物质是PFOA(91.8%)和PFPeA(89.8%),二者占比分别高达43.9%和54.5%. 主成分分析结果表明以PFOA、PFPeA、PFUnDA和PFHxA为主要标志物的2个主成分可以解释该地区年轮中84.4%的PFASs来源,主要来源于PFASs及其前体物的大气长距离迁移.
(2)年轮中PFPeA含量随时间变化不符合其生产使用历史,主要是因为前体物发生了生物转化和光化学转化,因此不能直接用于PFASs历史重建,要考虑相关前体物的影响.
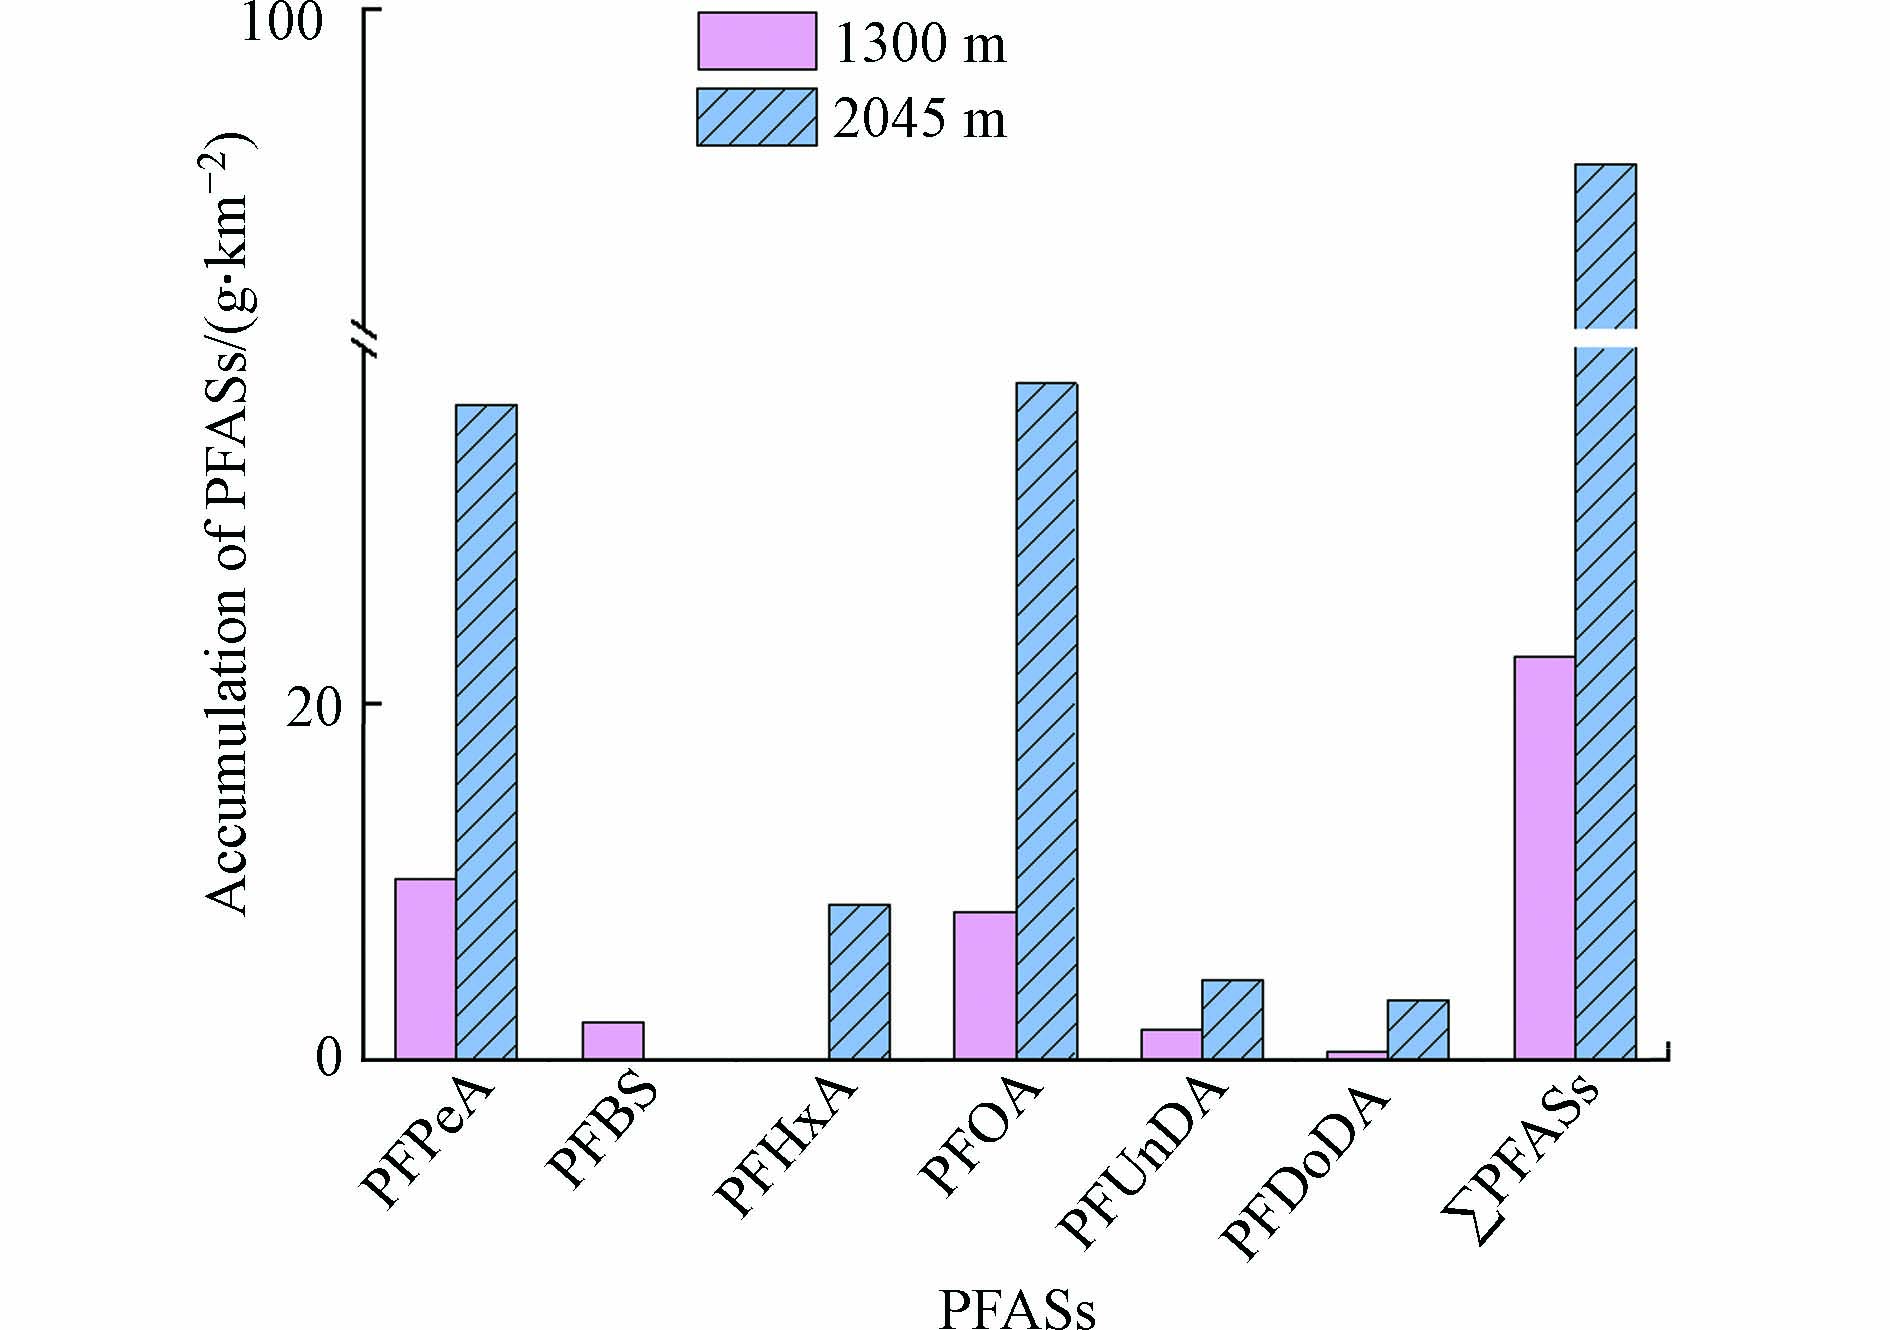
(3)单位平方千米内云南松树干对PFASs的积累量已高达克级别,高、低海拔分别为91.3 g·km−2和22.6 g·km−2,说明云南松是PFASs的蓄积库之一,应该引起进一步的关注.
-
图 2 (a)本研究制备的纳米金透射电镜图;(b)纳米金、1 μg·mL−1杀鼠醚混合纳米金的紫外-可见光谱;(c)将1 μg·mL−1杀鼠醚与纳米金混合液加入硝酸镁聚沉后的紫外-可见光谱(插图显示纳米金胶体聚沉前后的颜色变化);(d) (b)和(c)对应溶液的SERS强度
Figure 2. (a) TEM image of Gold nanoparticles (Au NPs) prepared in this study; (b) UV-Vis spectra of colloidal Au NPs, Au NPs mixed with 1 μg·mL−1 CMTT; (c) UV-Vis spectra of aggregated Au NPs after adding 10 μL of 0.5 mol·L−1 Mg(NO3)2 (The inset shows the color change of Au NPs before and after aggregation); (d) SERS intensity of the solutions corresponding to (b) and (c)
图 5 加入0.1 mol·L−1(a)、0.25 mol·L−1(b)、0.5 mol·L−1(c)、1 mol·L−1(d)硝酸镁聚沉后纳米金的TEM图像;(e) 加入不同浓度硝酸镁聚沉纳米金的紫外-可见光谱;(f)不同浓度的硝酸镁对995 cm−1处的SERS强度影响
Figure 5. TEM image of Au NPs after adding 0.1 mol·L−1 (a), 0.25 mol·L−1 (b), 0.5 mol·L−1 (c) and 1 mol·L−1 (d) Mg(NO3)2; (e) UV-Vis spectra of Au NPs with different concentrations of Mg(NO3)2; (f) SERS intensity at 995 cm−1 induced by different concentrations of Mg(NO3)2
图 7 (a)不同浓度杀鼠醚溶液的SERS检测;(b)杀鼠醚SERS峰强度随浓度变化的曲线;(c)水样中不同浓度杀鼠醚的SERS检测;(d)水样中杀鼠醚SERS峰强度随浓度变化的曲线
Figure 7. (a) SERS detection of CMTT aqueous solution with different concentrations; Calibration curve for different CMTT; (c) SERS detection of CMTT with different concentrations in water samples; Calibration curve for different CMTT in water samples
图 8 使用同批次纳米金在21 d内测定(a)1 μg·mL−1和(b)0.05 μg·mL−1杀鼠醚在995 cm−1处的SERS强度;(c)8个不同批次纳米金检测加标水样中0.25 μg·mL−1杀鼠醚在995 cm−1处的SERS强度;(d)同批次纳米金检测加标水样中0.25 μg·mL−1杀鼠醚在995 cm−1处的SERS强度
Figure 8. SERS intensity at 995 cm−1 of (a) 1 and (b) 0.05 μg·mL−1 CMTT acquired over 21 d using the same batch of Au NPs; (c) SERS intensity at 995 cm−1 of 0.25 μg·mL−1 CMTT in spiked water using eight batches of Au NPs; (d) SERS intensity at 995 cm−1 of 0.25 μg·mL−1 CMTT in spiked water generated by the same batch of Au NPs
表 1 环境水中不同浓度杀鼠醚的平均回收率
Table 1. Average recoveries of different CMTT concentrations in spiked environmental water
加标量/(μg·mL−1)Added 回收量±标准差/(μg·mL−1)Found ± SD 回收率/%Recovery 相对标准偏差/%RSD 0.50 0.48 ± 0.12 96.4 6.40 1.00 0.90 ± 0.12 90.2 2.86 2.50 2.46 ± 0.36 98.2 2.69 表 2 各农药对应SERS谱带的分配
Table 2. The Assignation of SERS spectral bands corresponding to each pesticide
表面增强拉曼光谱位移/cm−1SERS shift 归属结构Assignation 563 C—C—C弯曲振动 939 C—O/C—H弯曲振动 1028 C—O弯曲振动/C—C拉伸振动 1044 C—O弯曲振动/C—C拉伸振动 1145 H—C—H弯曲振动/CH2扭转 1193 C—H平面弯曲 1323 H—C—H/CH3/CH2/CH弯曲振动 1379 H—C—H/CH2扭转 -
[1] GONG T X, HUANG Y F, WEI Z J, et al. Magnetic assembled 3D SERS substrate for sensitive detection of pesticide residue in soil [J]. Nanotechnology, 2020, 31(20): 205501. doi: 10.1088/1361-6528/ab72b7 [2] WALTHER B, ENNEN H, GEDUHN A, et al. Effects of anticoagulant rodenticide poisoning on spatial behavior of farm dwelling Norway rats [J]. Science of the Total Environment, 2021, 787: 147520. doi: 10.1016/j.scitotenv.2021.147520 [3] REGNERY J, FRIESEN A, GEDUHN A, et al. Rating the risks of anticoagulant rodenticides in the aquatic environment: A review [J]. Environmental Chemistry Letters, 2019, 17(1): 215-240. doi: 10.1007/s10311-018-0788-6 [4] BERGRATH S, CASTILLO-VARGAS J S, KOC N J, et al. Suspected seizure—Survival of a lethal dose of the rodenticide alpha-chloralose [J]. Der Anaesthesist, 2019, 68(12): 843-847. doi: 10.1007/s00101-019-00692-7 [5] de BAIRROS A V, DIAS D, BEZERRA A, et al. An analytical strategy for the identification of carbamates, toxic alkaloids, phenobarbital and warfarin in stomach contents from suspected poisoned animals by thin-layer chromatography/ultraviolet detection [J]. Toxicology Mechanisms and Methods, 2019, 29(7): 518-530. doi: 10.1080/15376516.2019.1619213 [6] ELMEROS M, LASSEN P, BOSSI R, et al. Exposure of stone marten (Martes foina) and polecat (Mustela putorius) to anticoagulant rodenticides: Effects of regulatory restrictions of rodenticide use [J]. Science of the Total Environment, 2018, 612: 1358-1364. doi: 10.1016/j.scitotenv.2017.09.034 [7] SELJETUN K O, SANDVIK M, VINDENES V, et al. Comparison of anticoagulant rodenticide concentrations in liver and feces from apparently healthy red foxes [J]. Journal of Veterinary Diagnostic Investigation, 2020, 32(4): 560-564. doi: 10.1177/1040638720927365 [8] OKONIEWSKI R, NEELY S, DENN M, et al. Rapid method for the detection of rodenticides in contaminated foods [J]. Journal of Chromatography B, 2021, 1186: 123005. doi: 10.1016/j.jchromb.2021.123005 [9] VALVERDE I, ESPÍN S, GÓMEZ-RAMÍREZ P, et al. Wildlife poisoning: A novel scoring system and review of analytical methods for anticoagulant rodenticide determination [J]. Ecotoxicology, 2021, 30(5): 767-782. doi: 10.1007/s10646-021-02411-8 [10] FANG W, ZHANG B, HAN F Y, et al. On-site and quantitative detection of trace methamphetamine in urine/serum samples with a surface-enhanced Raman scattering-active microcavity and rapid pretreatment device [J]. Analytical Chemistry, 2020, 92(19): 13539-13549. doi: 10.1021/acs.analchem.0c03041 [11] CHEN J, HUANG M Z, KONG L L, et al. Jellylike flexible nanocellulose SERS substrate for rapid in situ non-invasive pesticide detection in fruits/vegetables [J]. Carbohydrate Polymers, 2019, 205: 596-600. doi: 10.1016/j.carbpol.2018.10.059 [12] MA Y M, LIU H L, MAO M, et al. Surface-enhanced Raman spectroscopy on liquid interfacial nanoparticle arrays for multiplex detecting drugs in urine [J]. Analytical Chemistry, 2016, 88(16): 8145-8151. doi: 10.1021/acs.analchem.6b01884 [13] MOSTOWTT T, MUNOZ J, McCORD B. An evaluation of monovalent, divalent, and trivalent cations as aggregating agents for surface enhanced Raman spectroscopy (SERS) analysis of synthetic cannabinoids [J]. The Analyst, 2019, 144(21): 6404-6414. doi: 10.1039/C9AN01309A [14] HIDI I J, JAHN M, WEBER K, et al. Lab-on-a-chip-surface enhanced Raman scattering combined with the standard addition method: Toward the quantification of nitroxoline in spiked human urine samples [J]. Analytical Chemistry, 2016, 88(18): 9173-9180. doi: 10.1021/acs.analchem.6b02316 [15] ZHANG Y, LI L F, GAO Y, et al. Nitrosonaphthol reaction-assisted SERS assay for selective determination of 5-hydroxyindole-3-acetic acid in human urine [J]. Analytica Chimica Acta, 2020, 1134: 34-40. doi: 10.1016/j.aca.2020.08.020 [16] MARY Y S, RAJU K, YILDIZ I, et al. FT-IR, FT-Raman, SERS and computational study of 5-ethylsulphonyl-2-(o-chlorobenzyl)benzoxazole [J]. Spectrochimica Acta. Part A, Molecular and Biomolecular Spectroscopy, 2012, 96: 617-625. doi: 10.1016/j.saa.2012.07.006 [17] RAJ A, SHEENA MARY Y, YOHANNAN PANICKER C, et al. IR, Raman, SERS and computational study of 2-(benzylsulfanyl)-3, 5-dinitrobenzoic acid [J]. Spectrochimica Acta Part A:Molecular and Biomolecular Spectroscopy, 2013, 113: 28-36. doi: 10.1016/j.saa.2013.04.096 [18] CHAN M Y, LENG W N, VIKESLAND P J. Surface-enhanced Raman spectroscopy characterization of salt-induced aggregation of gold nanoparticles [J]. ChemPhysChem, 2018, 19(1): 24-28. doi: 10.1002/cphc.201700798 [19] SUBAIHI A, ALMANQUR L, MUHAMADALI H, et al. Rapid, accurate, and quantitative detection of propranolol in multiple human biofluids via surface-enhanced Raman scattering [J]. Analytical Chemistry, 2016, 88(22): 10884-10892. doi: 10.1021/acs.analchem.6b02041 [20] LEE M J, LIM S H, HA J M, et al. Green synthesis of high-purity mesoporous gold sponges using self-assembly of gold nanoparticles induced by thiolated poly(ethylene glycol) [J]. Langmuir:the ACS Journal of Surfaces and Colloids, 2016, 32(23): 5937-5945. doi: 10.1021/acs.langmuir.6b01197 [21] ROGER K, BOTET R, CABANE B. Coalescence of repelling colloidal droplets: A route to monodisperse populations [J]. Langmuir:the ACS Journal of Surfaces and Colloids, 2013, 29(19): 5689-5700. doi: 10.1021/la400498j [22] FAN M K, ANDRADE G F S, BROLO A G. A review on recent advances in the applications of surface-enhanced Raman scattering in analytical chemistry [J]. Analytica Chimica Acta, 2020, 1097: 1-29. doi: 10.1016/j.aca.2019.11.049 [23] LI X, LENHART J J, WALKER H W. Aggregation kinetics and dissolution of coated silver nanoparticles [J]. Langmuir:the ACS Journal of Surfaces and Colloids, 2012, 28(2): 1095-1104. doi: 10.1021/la202328n [24] WESTLEY C, XU Y, CARNELL A J, et al. Label-free surface enhanced Raman scattering approach for high-throughput screening of biocatalysts [J]. Analytical Chemistry, 2016, 88(11): 5898-5903. doi: 10.1021/acs.analchem.6b00813 [25] ZHU W, WEN B Y, JIE L J, et al. Rapid and low-cost quantitative detection of creatinine in human urine with a portable Raman spectrometer [J]. Biosensors and Bioelectronics, 2020, 154: 112067. doi: 10.1016/j.bios.2020.112067 [26] WANG C J, SHANG M, WEI H Y, et al. Specific and sensitive on-site detection of Cr(VI) by surface-enhanced Raman spectroscopy [J]. Sensors and Actuators B:Chemical, 2021, 346: 130594. doi: 10.1016/j.snb.2021.130594 [27] WEN P, YANG F, GE C, et al. Self-assembled nano-Ag/Au@Au film composite SERS substrates show high uniformity and high enhancement factor for creatinine detection [J]. Nanotechnology, 2021, 32(39): 395502. doi: 10.1088/1361-6528/ac0ddd [28] ZHANG M L, PAN J L, XU X Y, et al. Gold-trisoctahedra-coated capillary-based SERS platform for microsampling and sensitive detection of trace fentanyl [J]. Analytical Chemistry, 2022, 94(11): 4850-4858. doi: 10.1021/acs.analchem.2c00157 [29] KRYSA M, SZYMAŃSKA-CHARGOT M, ZDUNEK A. FT-IR and FT-Raman fingerprints of flavonoids - A review [J]. Food Chemistry, 2022, 393: 133430. doi: 10.1016/j.foodchem.2022.133430 [30] LEMMA T, de BARROS SOUZA F, TELLEZ SOTO C A, et al. An FT-Raman, FT-IR, and quantum chemical investigation of stanozolol and oxandrolone [J]. Biosensors, 2017, 8(1): 2. doi: 10.3390/bios8010002 -


 下载:
下载:


