-
大气颗粒物PM2.5与气候变化、人体健康、生态环境等密切相关[1]. 三亚市(18°18′N,109°31′E)位于海南岛的最南端,地处低纬度,属热带海洋性季风气候区. 随着海南自由贸易港建设进展加快、国际旅游岛对外开放和海南热带气候等区位优势,海南人口激增与经济快速发展,空气质量的压力越来越大[2],三亚市政府和国内外游客也日益重视PM2.5的健康效应.
三亚PM2.5研究报道较少,与之关联的是南海大气化学研究. 前人研究如下:三亚PM2.5中OC和EC [3-4];PM2.5光学特征[5-6];PM2.5的潜在源定性分析[4,7];PMF模型定量源解析[8]. 海口CMB模型源解析[9-10];南海PMF模型源解析[11-12];南海有机气溶胶分子标识物和同位素示踪来源[13-15];上述源解析很少单用微量元素. 受体模型PMF源解析优点在于灵活性(不需源谱)和操作性(模型软件化和源个数“眼球法”),缺点在于共线源问题和源解析结果时空差异大[16]. 基于PMF的优缺点,在实际运用中,呈现两种局面:一方面是接受PMF优点,广泛应用,同时,单用微量元素组分进行源解析,多与PM2.5中重金属健康效应结合 [17-18];另一方面是将受体模型、源清单法和源过程法等方法结合,进行多种源解析,相互验证解决PMF不足 [19]. 本文基于微量元素数据及其健康评价,采用PMF源解析第一情况,其不足在于微量元素标识物的共线源问题,优势在于微量元素相对于有机组分来说,其变化程度小. 三亚市PM2.5微量元素的源解析尚鲜见报道,研究PM2.5中微量元素污染特征及健康评价具有十分重要的意义.
本文通过离线滤膜样品采集得到三亚市PM2.5微量元素数据,结合富集因子分析,表征三亚市PM2.5微量元素的化学特征;使用受体PMF模型进行源解析,定量估算微量元素排放源对三亚市PM2.5的贡献比例;利用暴露评估模型,评价PM2.5中微量元素的健康效应. 此论文为三亚市PM2.5的空气质量监测及防治提供思路及措施.
-
本研究样品采集地点位于三亚市吉阳区热带海洋学院实验楼8栋楼顶大气颗粒物采样室. 采样时间选用2019年6月(代表夏季)和10月(秋季)、12月(冬季)作为季节性代表进行采样. 每天1个样,每个滤膜样品每天收集大气颗粒物至少20 h,每月30个样品,共计90个样品. 样品采集使用仪器为mini-volume便携式大气颗粒物PM2.5采样器,流量是5 L·min−1,该仪器已得USEPA(美国环保局)认可,选择特氟龙滤膜收集元素组分.
-
本实验样品分析地点是在中科院地球与环境研究所化学与物理重点实验室,使用X射线荧光光谱仪对特氟龙膜上气溶胶所含的26种元素(Na、Mg、Al、Si、P、S、Cl、K、Ca、Sc、Ti、V、Cr、Mn、Fe、Co、Ni、Cu、Zn、Ga、As、Se、Br、Sr、Ba、Pb)进行了分析测定. 仪器采用美国Micro Matter公司的薄膜滤纸作为标准物质建立工作曲线;采用NIST SRM 2783号标准物质进行质量控制,每8个样品任意挑选1个做复检. 检查各个元素的浓度测量值,并给出最终结果. 结合采样面积和采样流量,将初始浓度转化为最终的大气质量浓度单位. 样品分析过程中的质量保证/质量控制详见文献 [20].
-
元素富集因子法简称“富集因子法”(Enrichment Factor,EF). 用以表示大气颗粒物中元素的富集程度,并判断和评价颗粒物中元素来源(自然来源和人为来源)的因子. 根据前人研究,元素的富集因子<10,主要来源为自然源;元素的富集因子>10,则认为其受到人为污染源的影响,富集因子越高,其受人为活动影响越大[1]. 富集因子EF的定义如下:
式中,Cx是指研究中感兴趣的元素浓度,Cr为参考元素的浓度,分子的含义是样品中待测元素与参考元素的浓度比值,分母的含义为参考质中待元素与参考元素的浓度比值.
-
PMF法(Positive Matrix Factorization)是美国环保署EPA确定的区域环境污染评价的重要方法之一[21]. PMF法不依赖于排放源的排放条件、气象、地形等数据,能够定量确定污染源的类型和贡献比例 [19]. 受体模型PMF法的原理为:假设有p种来源、来源类型或来源区域影响一个受体,对观测得到的大气颗粒物中各种组分的浓度按照各因素的影响进行线性拟合. 数学表达式如下:
式中,Xij是受体第i天第j种组分的浓度;gik是第k种因素在第i天对受体的贡献;fkj是组分j在第k种因素中所占的部分;eij是第i天第j种组分的残余部分. EPA PMF的任务就是最小化总方差,即Q值最小.
式中,Sij是第i天第j种组分的不确定性,用户可以根据公式(4)和(5)确定每个Xij的不确定性,当化学组分浓度小于最低检测限(MDL)时,不确定度用公式(4)计算;当化学组分浓度大于最低检测限(MDL)时,不确定度用公式(5)计算,式中Error Fraction 的计算基于重复样测试结果计算,MDL 组分分析设备都会有该数据.
本研究采用美国环保署认可的 EPA PMF 5.0 模型软件进行分析运算,以采样点位共计90个 PM2.5 样品中的26个微量组分浓度及其不确定性作为输入文件. 根据各因子的特征来解释污染源类型和贡献大小 (下载地址:http://www.epa.gov/air-research/positive-matrix-factorization-model-environmental-data-analyses).
-
本文选取9种重金属元素(As、Cr、Ni、Al、Cu、Mn、Pb、Se、Zn)进行健康评价. 依据美国环保署综合风险信息数据库和国际癌症研究机构的研究结论,大气细颗粒物重金属中的As、Cr、Ni属于致癌性物质,Al、Cu、Mn、Pb、Se、Zn属于非致癌性物质 [22-23]. 经呼吸途径暴露的健康风险评价公式如下:
其中,R为人群超额危险度,无量纲;LADD(life average daily dose)为致癌物质终身日均暴露剂量[μg·(kg·d)−1];ADD(average daily dose)为非致癌物质日均暴露剂量[μg·(kg·d)−1];AL(average life)为人均寿命参数,取常量70;SF(slope factor)为致癌化学物质的致癌斜率因子[(kg·d)·μg−1;RfD(reference dose)为参考剂量[μg·(kg·d)−1];SF与RfD获得自美国环保署颁布的化学物质人体健康效应评价文件(HEA)(https://www.epa.gov/),见表1.
暴露剂量率计算方法为:
其中,C(concentration)为污染物浓度(μg·m−3);IR(inhalation rate)为呼吸速率参数(m3·d−1);ED(exposure duration)为暴露持续时间(d);BW(body weight)为体重(kg);AT(averaging time)为平均暴露时间(d);经呼吸途径进入人体的暴露剂量参数来自美国环保署( https://www.epa.gov/),其中成年男性与女性的IR与BW来自生态环境部(https://www.mee.gov.cn/),见表2.
-
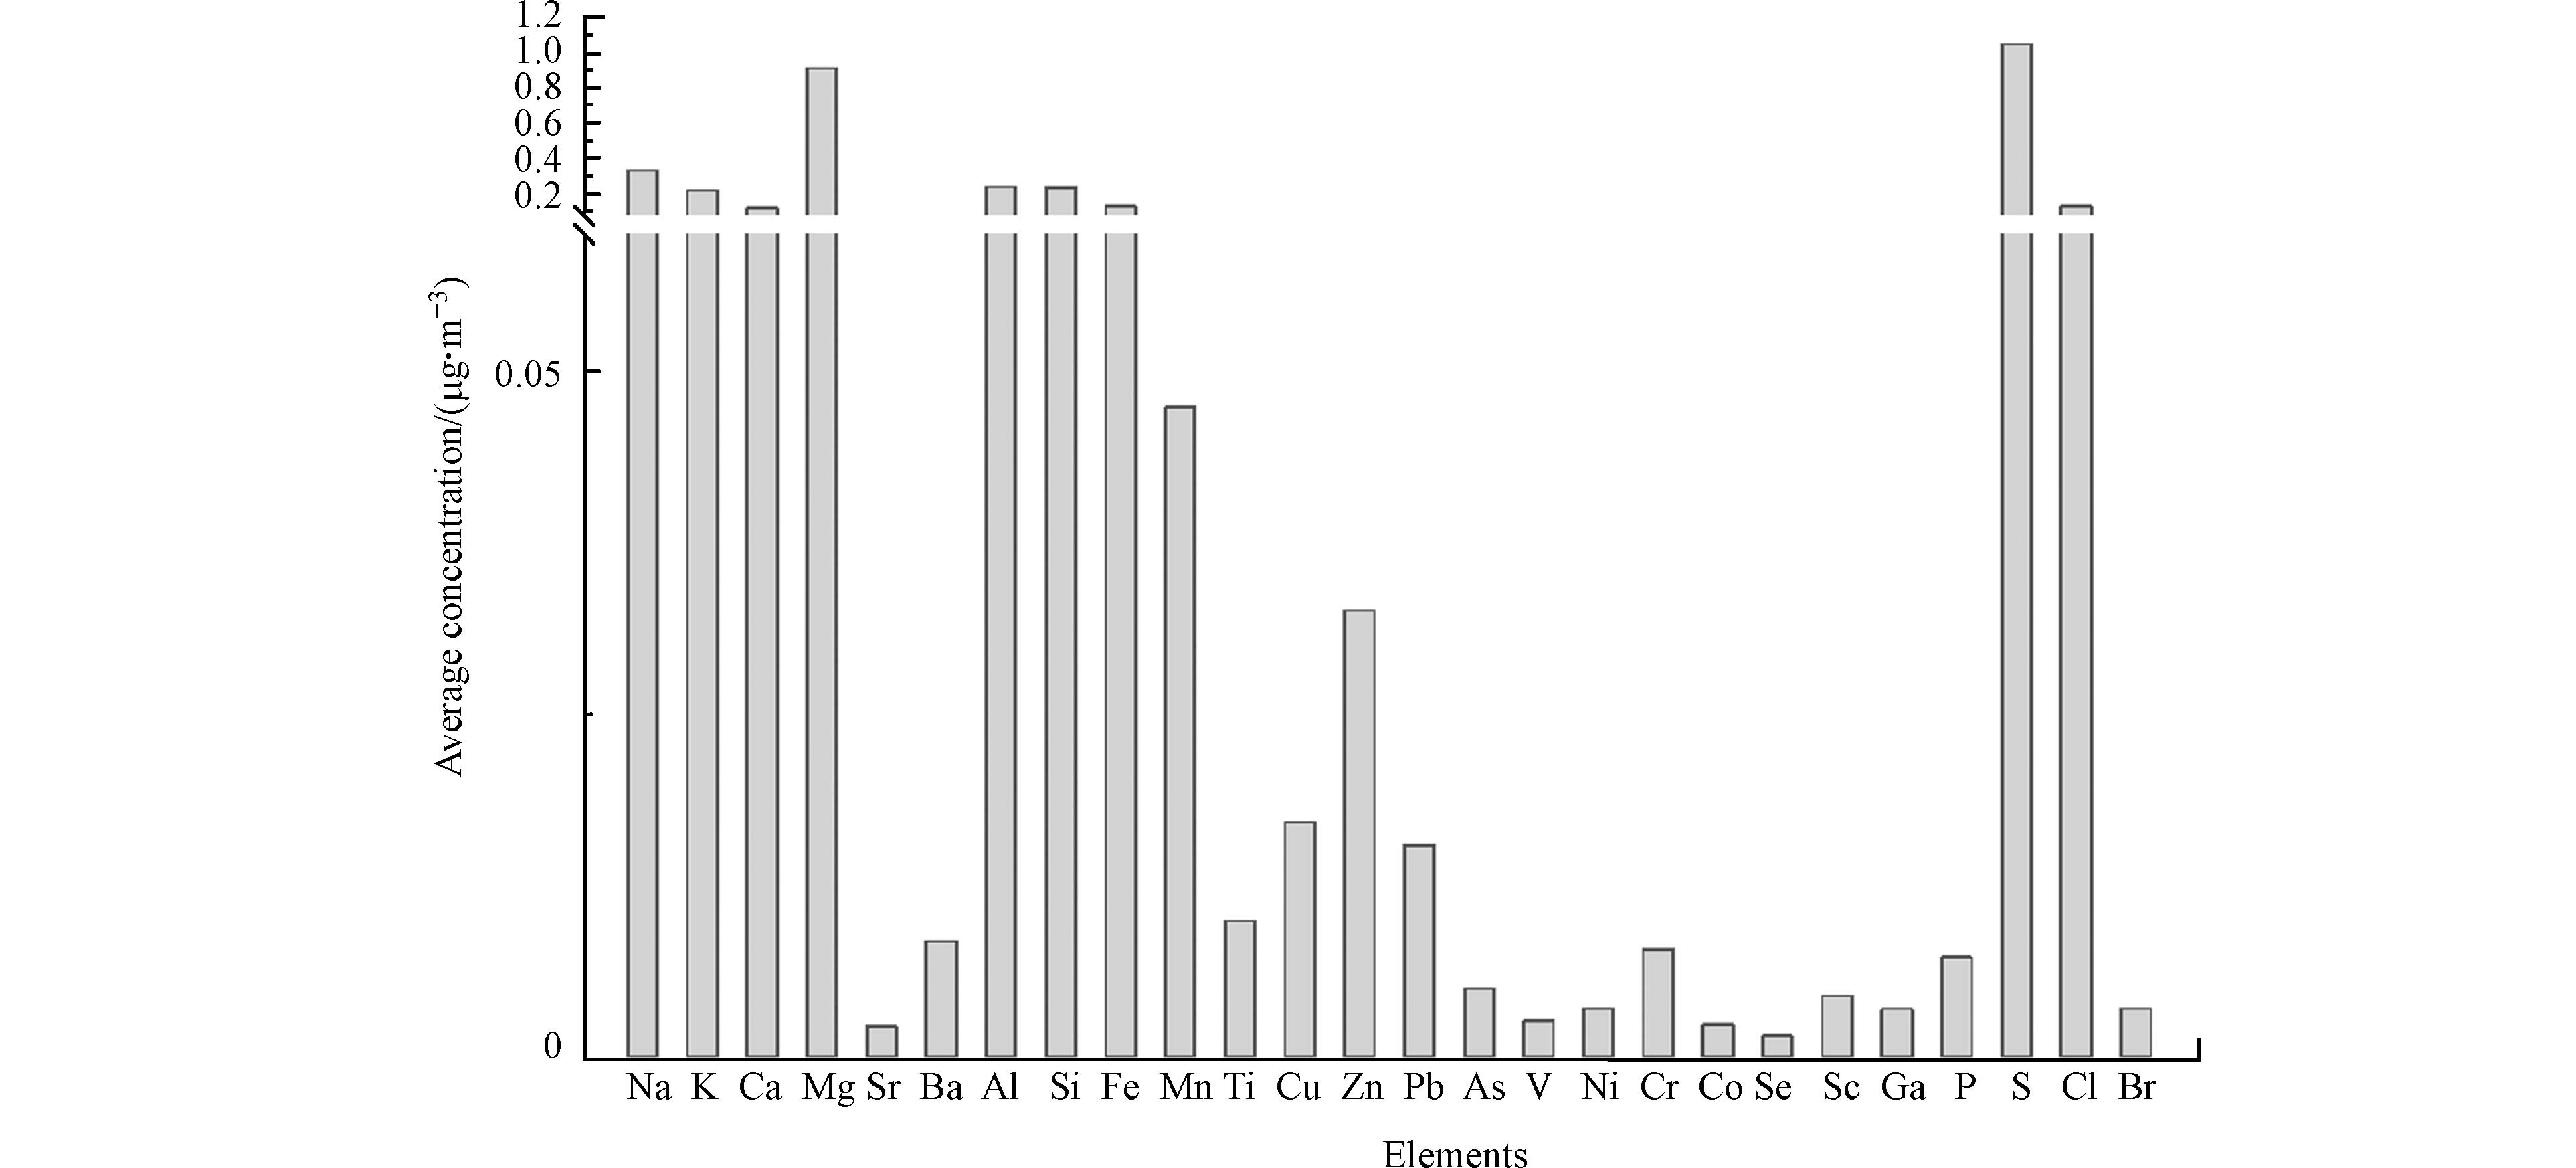
26种微量元素平均浓度见图1. 从图1可知,S(1.040 μg·m−3)、Mg(0.906 μg·m−3)、Na(0.325 μg·m−3)、Al(0.235 μg·m−3)、Si(0.228 μg·m−3)、K(0.214 μg·m−3)、Fe(0.126 μg·m−3)、Ca(0.112 μg·m−3)等元素含量较高. Na和K是碱金属元素,Ca和Mg是碱土金属元素,Al、Si和Fe是造岩元素或土壤中主量元素,Mg含量排序第二,表明样品受土壤排放源影响大. S是非金属元素,来源于含硫矿物燃烧,含量排序第一,表明三亚市大气颗粒物PM2.5已受人为源的影响[3-4,7-8].
表3 是PM2.5中7种重金属元素浓度均值. 由表3可知,三亚市重金属元素的年均质量浓度排序为:Zn>Cu>Pb>Cr>As>Ni>Se. Zn的质量浓度最高,其中致癌性重金属Cr(7.70×10⁻³ μg·m−3)已超过《环境空气质量标准》(GB 3095—2012)中规定标准限值2.50×10⁻⁵ μg·m−3. 大气Zn排放源较多,除受电镀、冶金、化工等工业影响外,还与机动车辆橡胶轮胎磨损、垃圾焚烧、含锌矿石的开采等多种因素有关[24];Cr广泛应用于汽车零件,铝合金和钛合金等制品、轮胎摩擦产生的粉尘也含有Cr元素[25],研究表明,受海洋气候影响,滨海城市Cr高于内陆城市. 三亚是国际旅游城市,高速公路和景区常见大陆各省车辆,加之行车道路环境的不熟悉,高浓度的Zn和致癌性重金属Cr可能与车辆橡胶轮胎磨损有关;同时,海南岛处于季风交互地带,受大陆污染影响严重[4,7-8],这也是三亚重金属Cr超标原因之一.
-
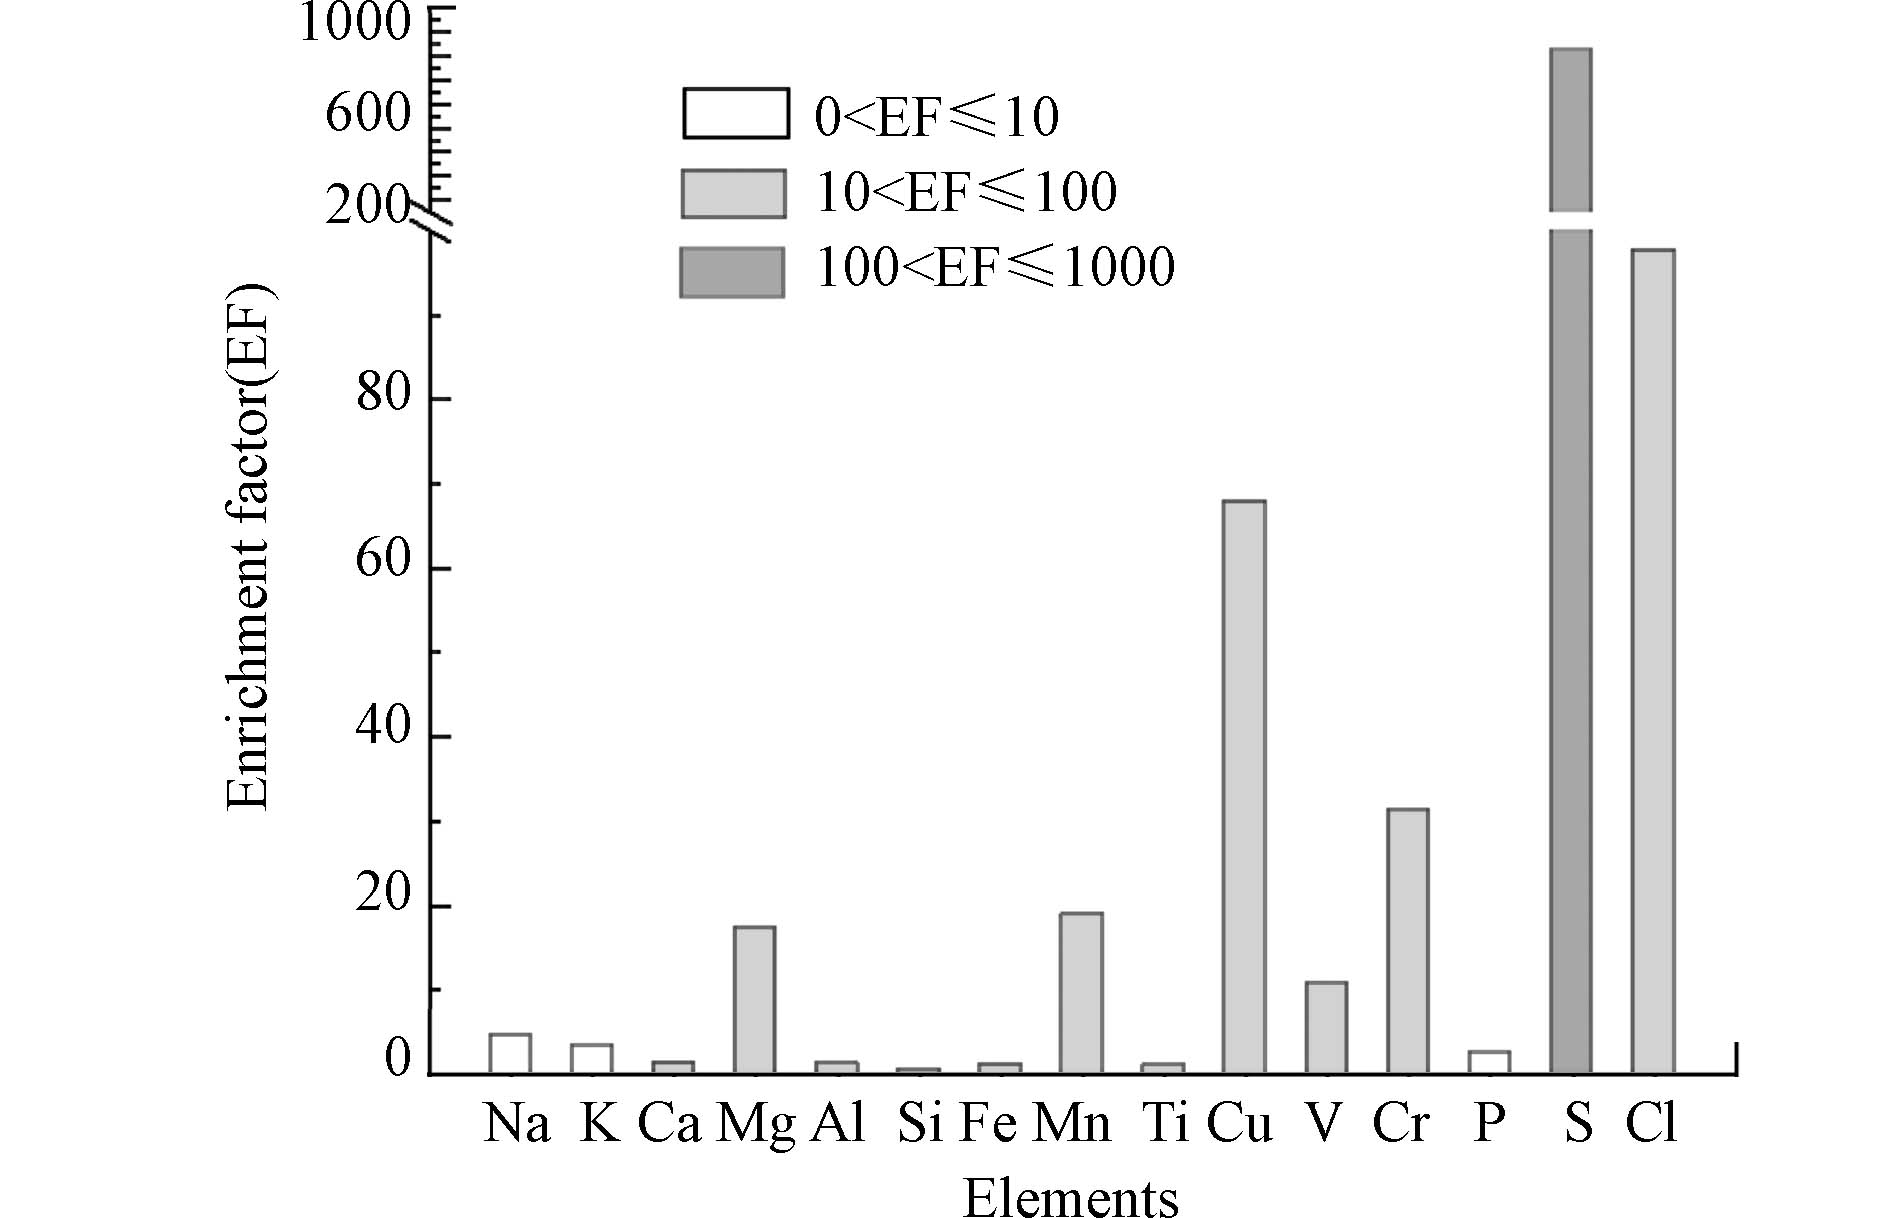
以Fe为参考物质,对Na、Mg、Al、Si、P、S、Cl、K、Ca、Ti、V、Cr、Mn、Fe、Cu等15种元素进行富集因子分析,分析结果如图2. 由图2可知,S(825.46)、Cl(97.67)、Cu(67.87)、Cr(31.21)、Mn(18.80)、Mg(17.20)、V(10.57)均出现较高的EF值,其中S的富集因子高达825.46,表明这些元素已经明显受到人为活动的影响,与前人研究三亚PM2.5空气质量结果一致[4,7-8]. 三亚市PM2.5主要来源是海洋源、工业源和交通源等,故S、Cl、Cu等元素富集因子较高.
-
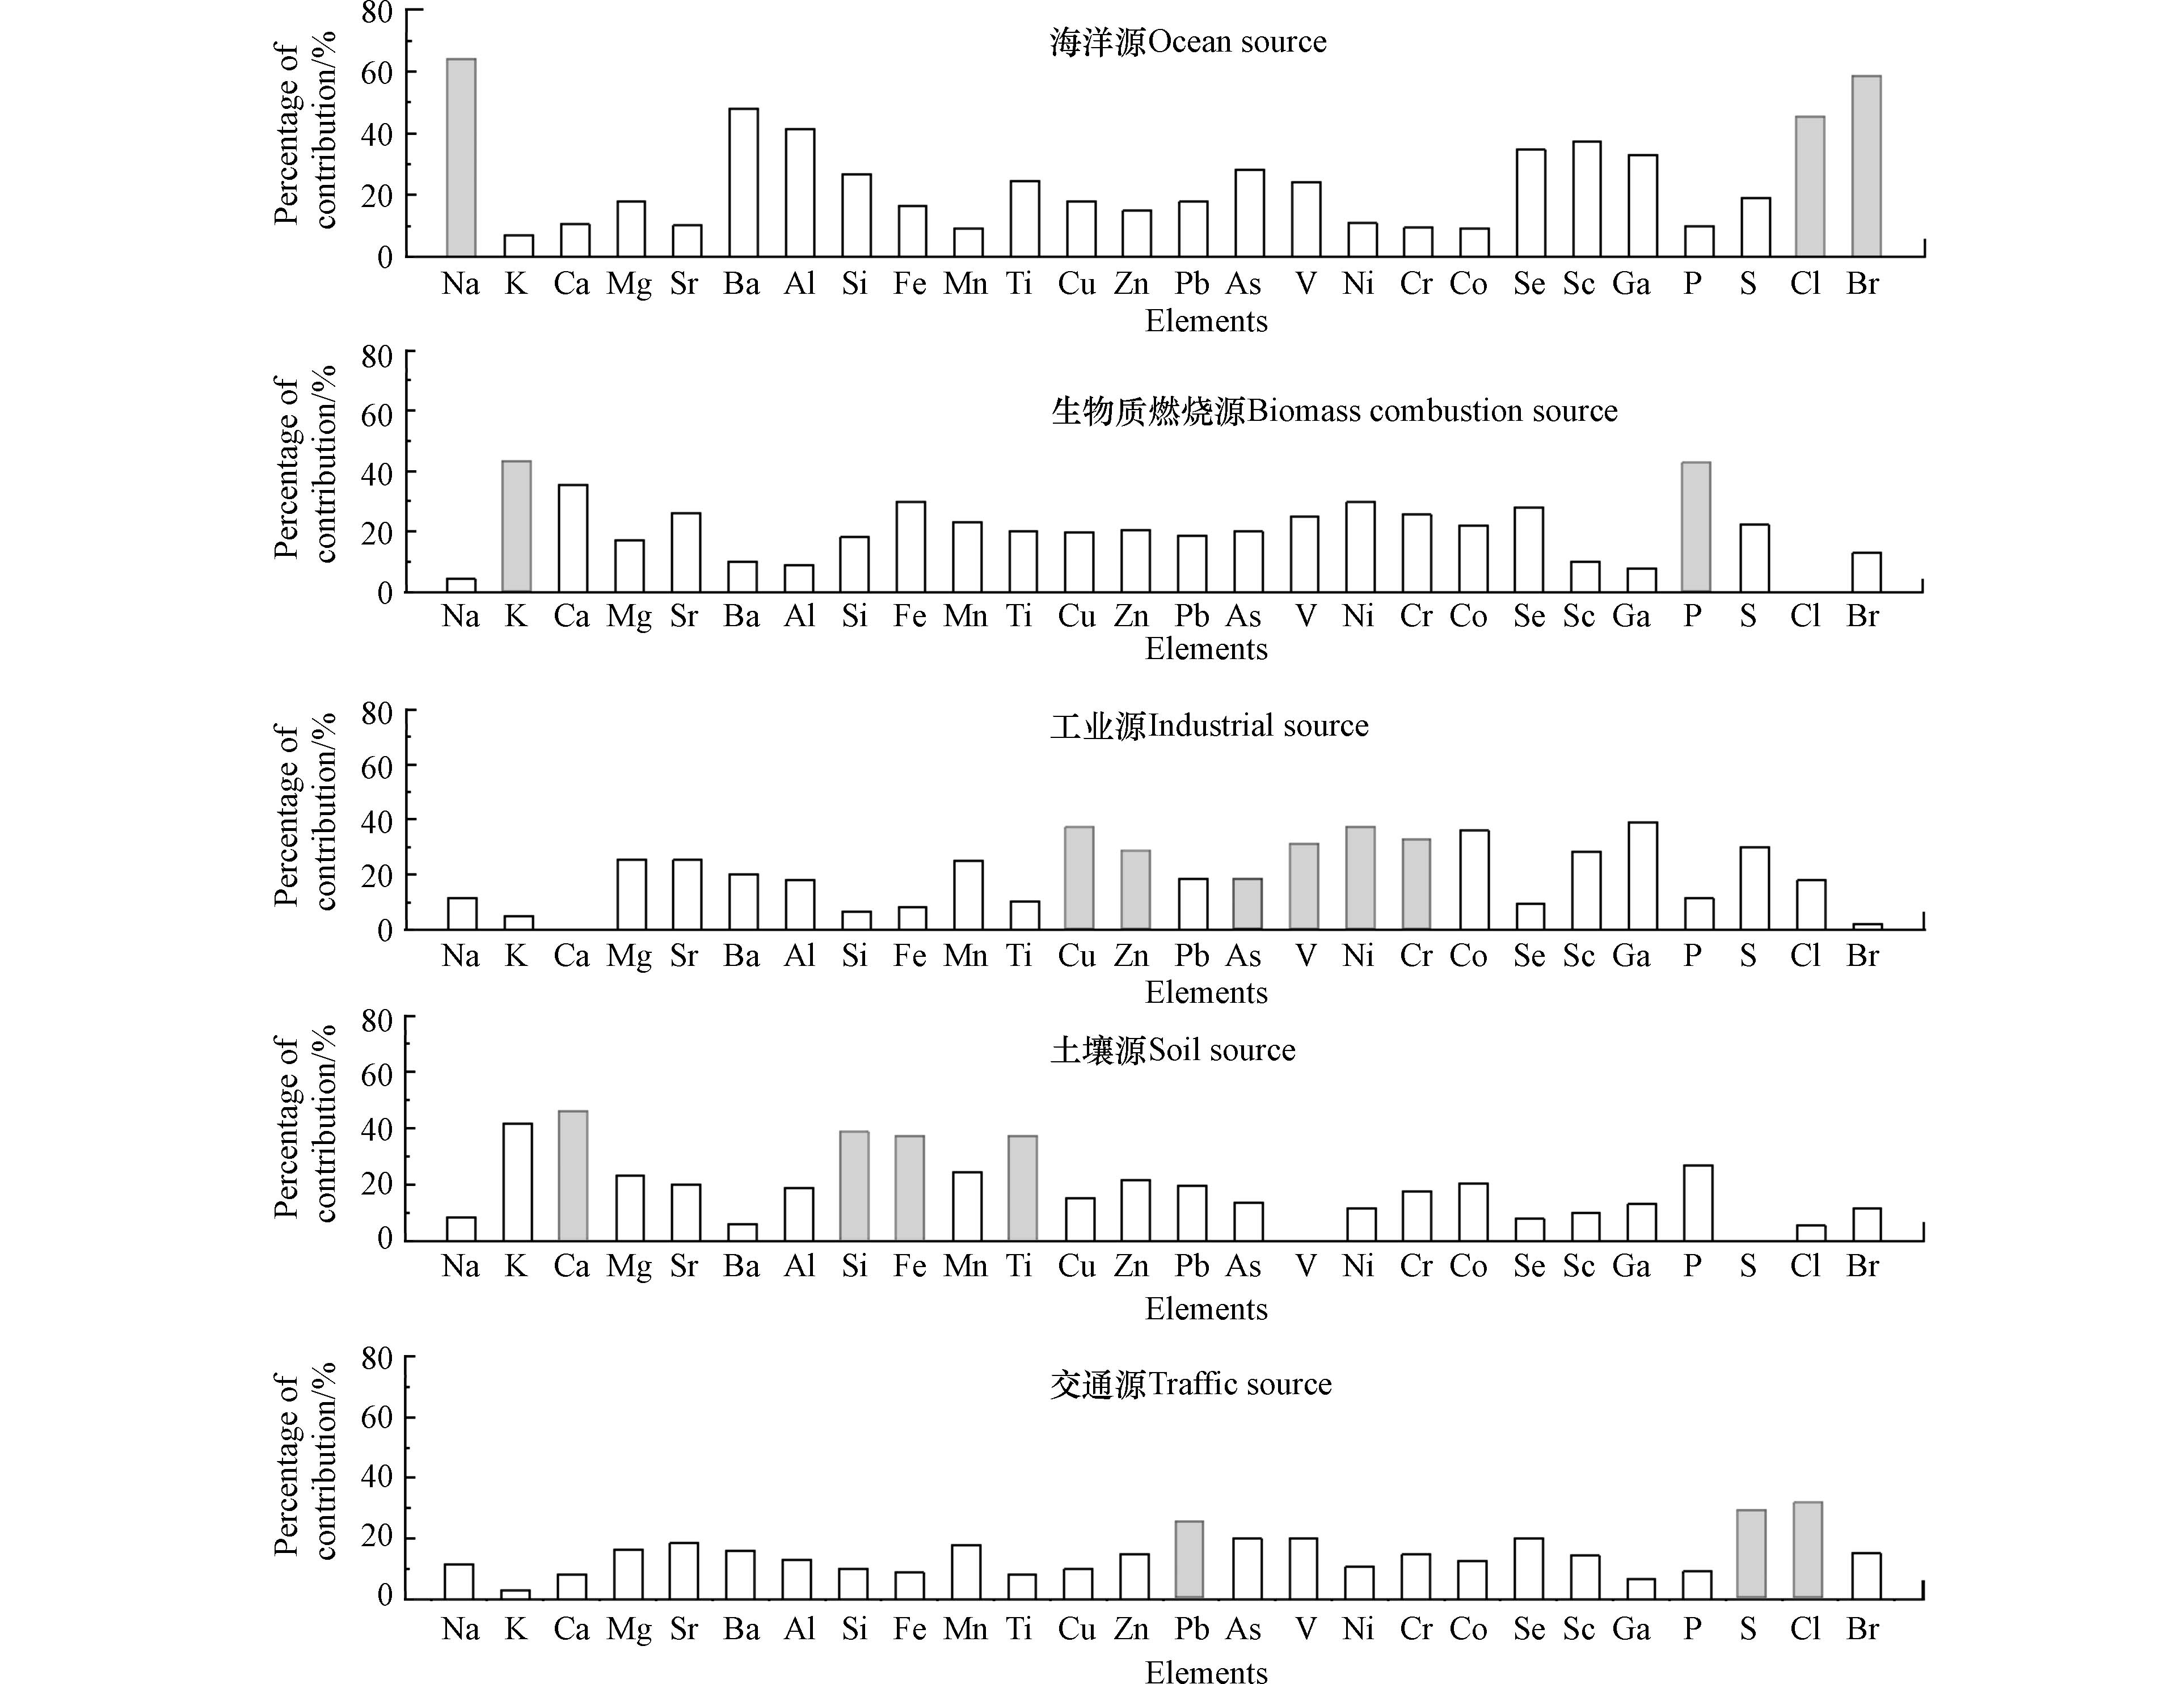
为了确定因子(源)数量,分别对模型进行了迭代运算,通过比较分析,最终确定5个因子最为合理(“眼球法”) [21]. 5个因子的贡献比例如图3所示.
本研究根据前人文献及研究,交通源用Pb、Zn等来指示,K来指示生物质燃烧源,Na来指示海洋源[1], Mn、Si、Ca、Fe来指示土壤源,V、Cu、Zn来指示工业源[16]. 对照相关因子浓度贡献占比及其时间序列,第1个因子是海洋源:标识物为Na、Cl和Br,Na是碱金属元素,Cl和Br是海洋卤族元素;第2个因子是生物质燃烧源:标识物为K、P,二者是植物生长的营养元素;第3个因子是工业源,标识物为Cu、Zn、V、Ni、Cr,这些都是重金属元素;第4个因子为土壤源,标识物为Ca、Si、Fe、Ti,其中,Ca是碱土金属,剩余的都是造岩元素,也是土壤的主量元素;第5个因子是交通源,标识物为S、Pb、Cl,其中,S和Pb是交通燃烧源的指纹,Cl是海洋源和燃烧源(如生物质燃烧、机动车燃烧和燃煤燃烧)的标识物 [26-28]. 虽然Cl是作物生长发育不可或缺的一种元素,是构成作物生长所必须的16种元素之一,可归属于生物质燃烧源,但限于Cl元素的共线源问题和PMF模型“眼球法”识别源个数的主观性,综合考虑,本文将Cl归属于交通源排放.
图4是三亚市PM2.5源解析结果,5种排放源大小比例分别是:海洋源(24.9%)>生物质燃烧源(20.8%)>工业源(20.5%)>土壤源(19%)>交通源(14.8%). 结果表明,三亚比邻南海,海洋表层微生物或植物是第一自然排放源,与前人研究结果一致[6-7];海南岛属热带气候,森林覆盖率达80%,生物质燃烧多以谷物秸秆、烤槟榔、枯枝落叶等燃烧排放为主 [29],生物质燃烧是第二排放源;工业源为第三排放源;土壤源为第四贡献源;交通源是第五贡献源.
表4是南海周边国家利用受体模型对PM(TSP、PM10、PM2.5)进行源解析的结果比较. 结果表明如下:1) 滨海城市中海盐贡献占比<10%, 如马来西亚八打灵海盐(7.4%),在贫营养化的三沙永兴岛,海盐占比高达46.6%;在离大陆最近的城市海口,海盐占比低达3%,这一现象说明海盐贡献比例与采样点离岸距离有梯度变化特征 [30]. 2) 滨海城市的主要人为排放源受制于城市经济发展程度,如三亚旅游国际岛,交通源占比高达37.9%;海口是海南省会城市,经济综合发展,交通源占比17.5%;中国台湾省高雄,港口贸易发达,船舶排放占比15.6%;马来西亚八打灵市工业发达,制造业(12%)+混合冶炼工业和道路扬尘(5.6)+冶金工业(5.1%)+ 矿物尘(7.2%),工业源的贡献比例高达30%;菲律宾马尼拉市是工业欠发达,以基础工业为主,如燃煤(17.4%),工业(17.7%),机动车(12.6%)等,工业源的贡献比例更高达50% [30-31]. 3) 二次无机气溶胶由于是二次生成,在滨海城市中,随着工业污染占比高,其贡献比呈现下降趋势,比例范围在20%—30%. 如海南省三沙市二次无机气溶胶(30.1%);海南省海口SO42-(9.5%);马来西亚八打灵二次无机气溶胶(28.5%);中国台湾省高雄港二次无机气溶胶(24%);菲律宾马尼拉二次气溶胶(21.3%)等 [30-31]. 4) 二次无机气溶胶是有SO42-、NO3-和NH4+组成(简称SNA),在PMF模型源解析中,中国大陆学者将其归为二次污染物,但溯源对应不了经济产业部门,而东南亚学者将标识物SO42-基本归为工业燃煤源;NO3-归为交通源;NH4+归为农业源,这是PMF源解析结果差异之一 [21]. 5) 具体确定生物质燃烧源的贡献比,如通用K+标识物外,应加上左旋葡萄糖等有机分子标识物,因为K+还来源于土壤等[16].
-
根据经呼吸途径暴露的健康风险评价模型[18],分别计算出的PM2.5重金属元素对儿童、成年女性和成年男性的平均超额危险度见表5. 9种重金属元素的年均超额危险度在5.40×10⁻¹²—7.63×10⁻⁷之间,均低于人群可接受危险水平标准1.00×10⁻⁶ [32];9种重金属元素对3类人群经呼吸途径暴露的健康风险均为Cr > As > Ni > Al > Mn > Pb > Cu > Zn > Se,致癌性物质As、Cr、Ni年均超额危险度数量级为10−7—10−9,远高于非致癌性物质Al、Cu、Mn、Pb、Se、Zn在量级为10−9—10-12的年均超额危险度;结合表3可看出,Cr元素质量浓度超标,造成Cr的年均超额危险度接近人群可接受危险水平标准. 得出三亚市大气颗粒物PM2.5重金属元素对人群基本无健康风险,但致癌性元素Cr浓度超过国家标准,并且对人群具有潜在的危害. 较之前人研究结果[17],三亚市年均超额危险度量级更低,三亚人口较少,且无采暖季节,海陆风盛行导致扩散条件好,污染物不容易累积[3].
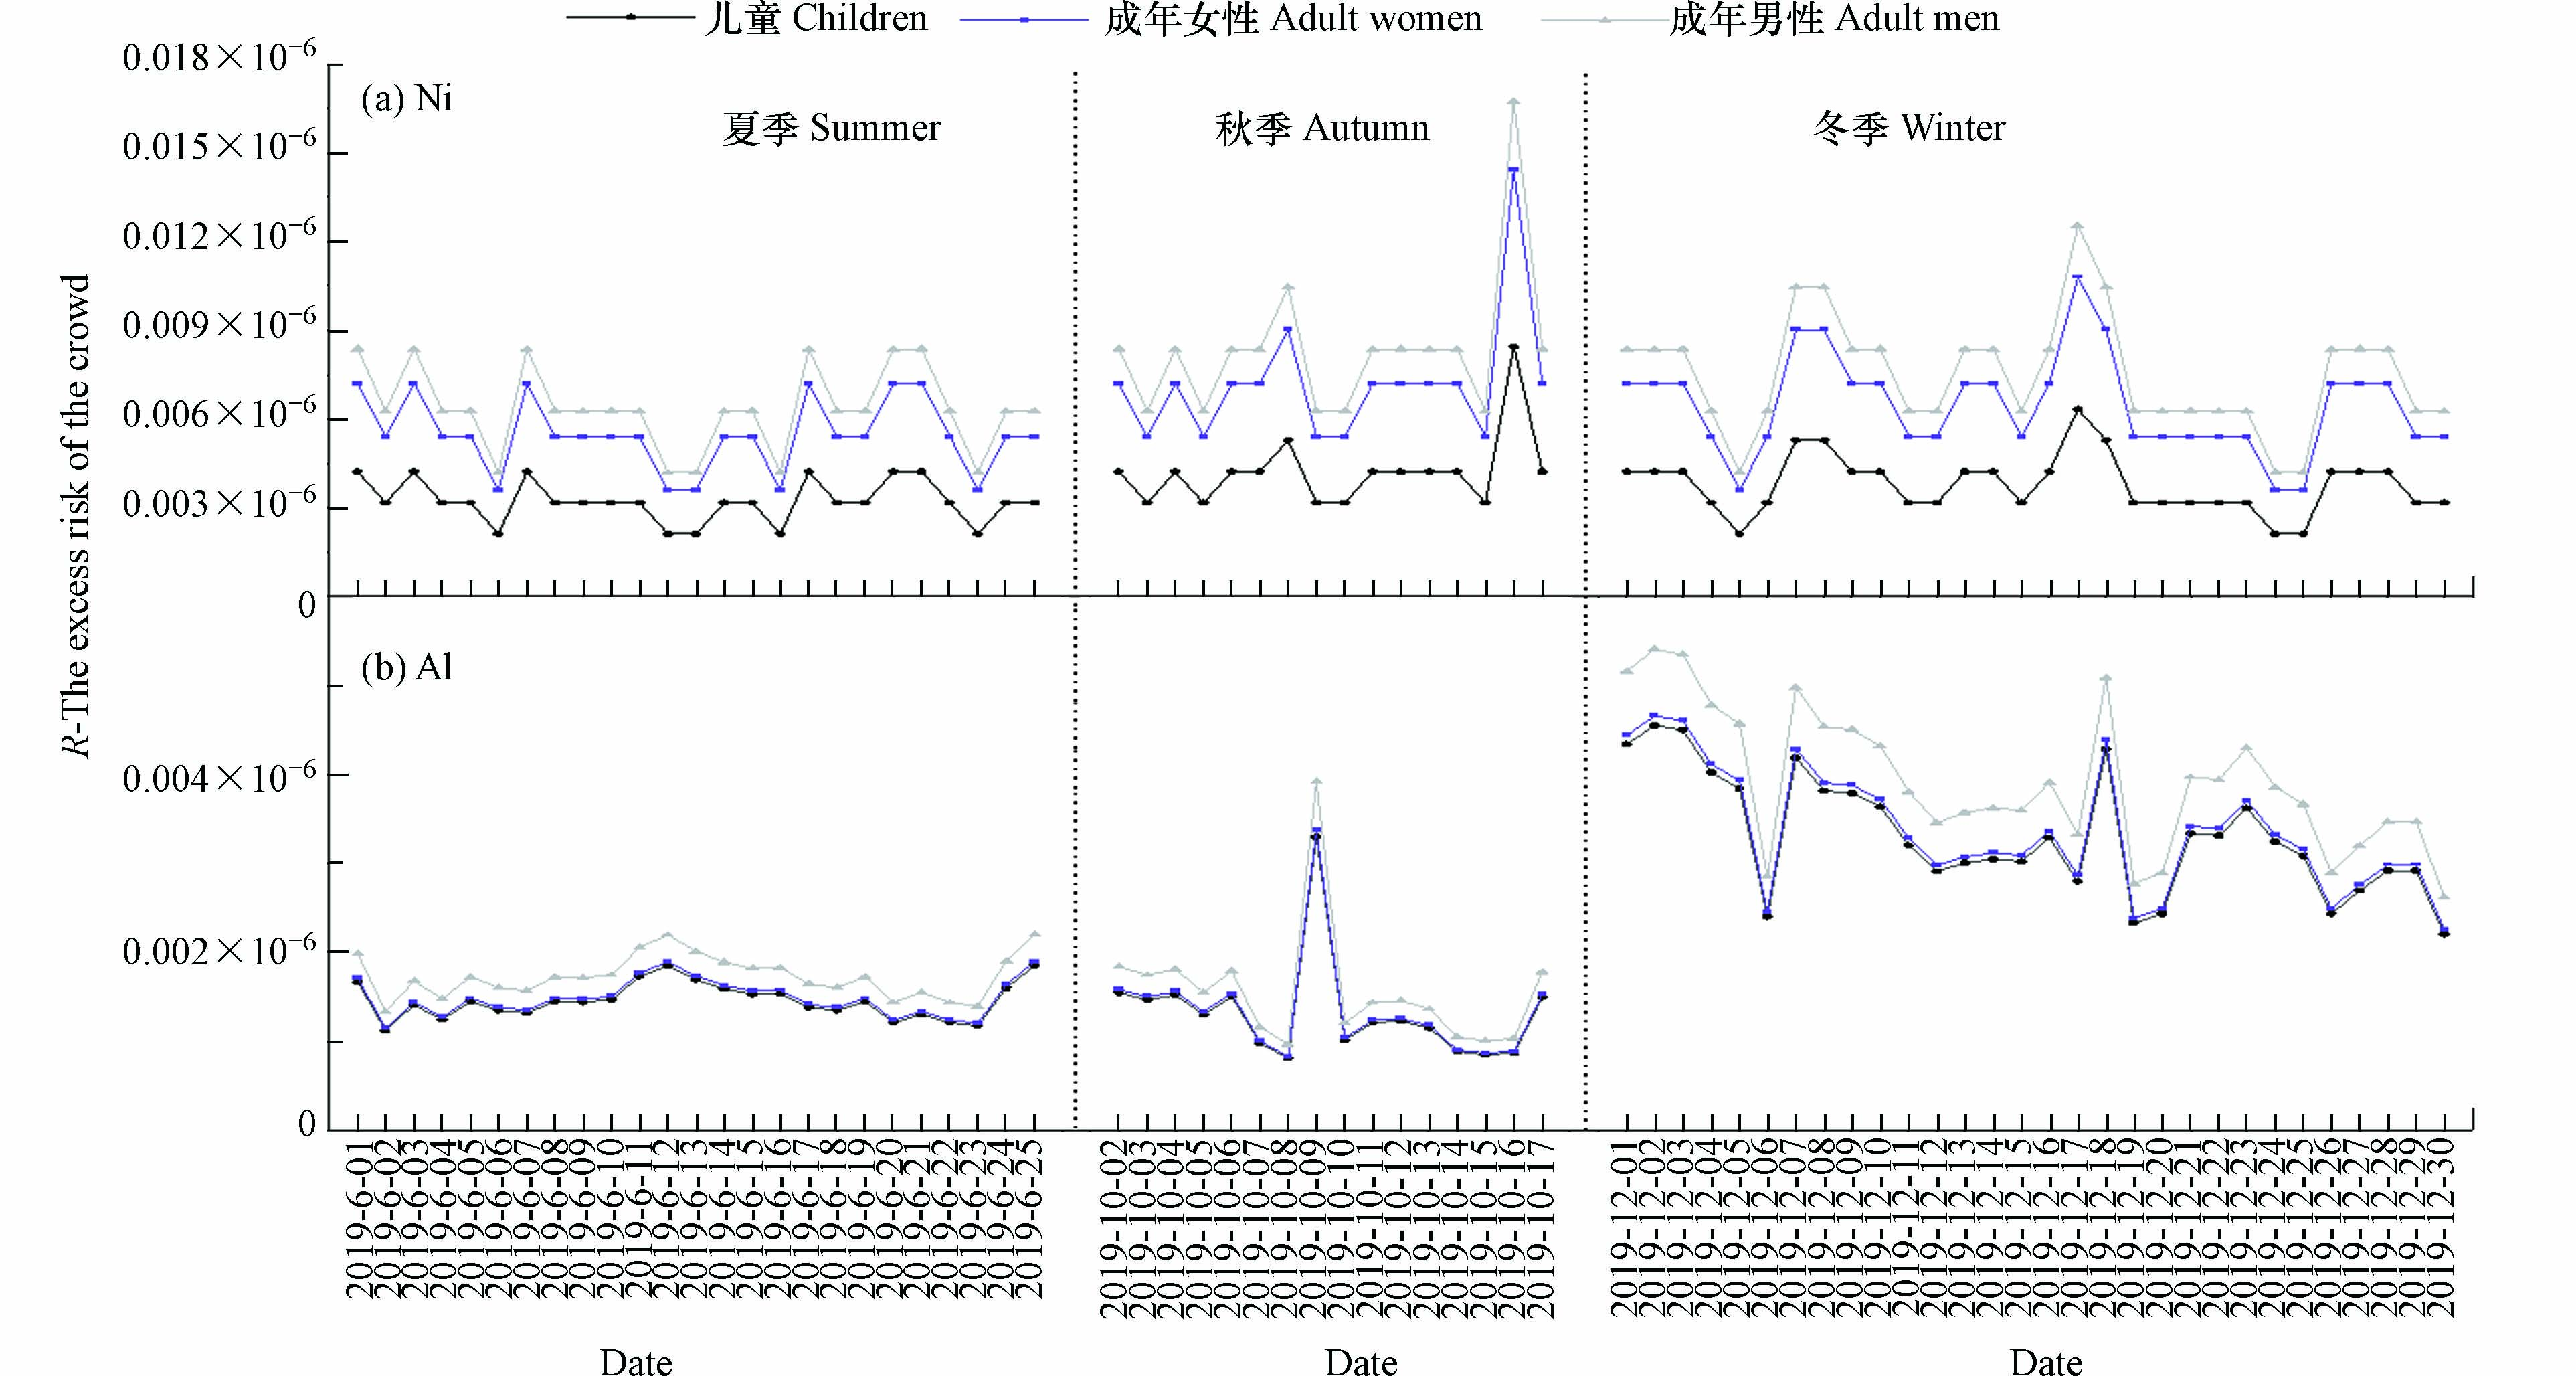
各选取一种代表性致癌性重金属元素和非致癌性重金属元素代入健康风险评价公式,得出每日人群超额危险度见图5. 致癌性重金属代表元素Ni对儿童、成年女性、成年男性人群超额危险度分别为3.68×10⁻⁹、6.27×10⁻⁹、7.28×10⁻⁹;非致癌性重金属Al对儿童、成年女性、成年男性人群超额危险度分别为2.21×10⁻⁹、2.26×10⁻⁹、2.62×10⁻⁹,结合图5得出不同人群的健康风险评价结果为:成年男性>成年女性>儿童,与山东省枣庄市研究结果一致[17].
-
(1)26种微量元素中S、Mg、Na、Al、Si、K、Fe、Ca元素平均质量浓度较高,其中,重金属元素Zn的质量浓度最高,致癌性重金属Cr已经超过标准限值,S的富集因子高达825.46.
(2)PMF源解析结果为海洋源(24.9%)>生物质燃烧源(20.8%)>工业源(20.5%)>土壤源(19%)>交通源(14.8%);对比南海周边滨海城市PMF,结果表明,海盐贡献比例与采样点离岸距离有梯度变化特征;滨海城市的主要排放源受制于城市主导经济产业发展;二次无机气溶胶的贡献与工业源的比例呈反比,取决于SNA标识物的分配;除K+作为生物质标识物外,应加上左旋葡萄糖等有机分子标识物.
(3)三亚市大气颗粒物PM2.5重金属污染对不同人群的影响为:成年男子>成年女子>儿童;不同季节影响为冬季>秋季>夏季:9种重金属元素对3类人群经呼吸途径暴露的健康风险均为Cr > As > Ni > Al > Mn > Pb > Cu > Zn > Se,其年均超额危险度均低于可接受危险水平标准.
2019年三亚市PM2.5微量元素的源解析和健康评价
Source analysis and health assessment of PM2.5 trace elements in Sanya City in 2019
-
摘要: 本研究通过滤膜采样分析得到三亚市PM2.5微量元素数据,结合富集因子,表征化学特征;使用PMF模型进行源解析,定量估算各排放源的贡献比例,并与南海周边城市源解析比较;根据暴露评估模型评估健康效应. 结果表明,三亚市致癌性重金属Cr(7.70×10⁻³ μg·m−3)已经超过标准限值(2.50×10⁻⁵ μg·m−3),S的富集因子高达825.46,表明三亚PM2.5受S元素污染严重;源排放贡献大小比例分别为:海洋源(24.9%)>生物质燃烧源(20.8%)>工业源(20.5%)>土壤源(19%)>交通源(14.8%),源解析结果比较得知,海盐贡献比例与采样点离岸距离有梯度变化特征;滨海城市的主要人为排放源受制于城市经济发展程度;二次无机气溶胶的贡献与工业源的比例呈反比,取决于SAN SNA标识物的配分;重金属污染对三亚不同人群的影响大小顺序为:成年男子>成年女子>儿童;9种重金属元素对 3 类人群经呼吸途径暴露的健康风险均为Cr>As>Ni>Al>Mn>Pb>Cu>Zn>Se.Abstract: This study used membrane filter sampling to collect PM2.5 trace element data of Sanya, China. Enrichment factor analysis and chemical characterization were used with a positive matrix factorization model to conduct source apportionment. The contribution proportions of each emission source were quantified and compared with the source apportionment results of coastal cities of South China Sea. According to an exposure assessment model, the effects of the elements on health was evaluated. The results revealed that the carcinogenic heavy metal Cr (7.70×10⁻³ μg·m−3)at Sanya exceeded the threshold of 2.50×10⁻⁵ μg·m−3. The enrichment factor of S reached as high as 825.46, implying that the PM2.5 in Sanya was severely polluted by S. The contribution proportions of emission sources ranking from high to low were the ocean (24.9%) > biomass combustion (20.8%) > industry (20.5%) > soil (19%) > traffic (14.8%). The source apportionment results revealed that the contribution proportion of sea salt exhibited gradient changes in relation to the distance of the sampling location to the coast. The main anthropogenic emissions of coastal cities were subject to the level of economic development of individual cities. The contribution proportions of secondary inorganic aerosols were inversely proportional to that of industrial emission sources, depending on the ratios of SNA markers. The level of influence of heavy metal pollution on different populations in Sanya was highest on adult man, followed by adult women and children. The risks of the 3 populations exposed to 9 heavy metals through respiratory tracts were Cr > As > Ni > Al > Mn > Pb > Cu > Zn > Se.
-
Key words:
- Sanya /
- PM2.5 /
- trace elements /
- source apportionment /
- health assessment.
-
城市具有环境界面多样、污染物迁移归趋过程复杂等特征,正面对着全球变暖和区域环境恶化的严峻挑战. 城市土地覆被正快速被人工不透水面(建筑屋顶、路面等)所取代,形成了“城市第二自然地理格局”[1]. 不透水面改变了城市水文、能量分布和非点源污染负载,是城市环境系统最重要的环境介质之一[2-3]. 多环芳烃(polycyclic aromatic hydrocarbons, PAHs)广泛分布于城市环境系统中,其具有的“致癌、致畸、致突变”效应和持续输入特征,对城市生态和居民健康构成了极大的威胁. 目前,关于城市环境系统中PAHs的研究多聚焦在大气气溶胶[4]、城市植被[5]、道路灰尘[6]、水体[7]和降水[8]等环境介质,并已检测出较高质量浓度水平的PAHs富集.
Gustafson等发现城市大气中半挥发性有机污染物质量浓度随温度的升高呈指数增加,认为污染物可能来源于被污染的路面[9]. Diamond等发现了典型不透水面(玻璃)表面有机膜存在的证据,认为玻璃可以吸附大气中半挥发性有机污染物[10]. 随后,Diamond等利用多介质逸度模型对城市环境系统中半挥发性有机污染物的迁移归趋过程进行了模拟,发现不透水面的存在增加了污染物在环境中的停留时间[11],认为不透水面是PAHs主要的“汇”[12],而汽车尾气和本地短距离传输的污染物是不透水面PAHs的主要来源[13]. 此外,不透水面的存在增强了PAHs在城市环境系统中的可迁移性,通过大气-不透水面-水体系统增加了水体中PAHs的含量,造成地表水的污染[14]. 玻璃表面已检测出较高质量浓度的有机污染物,如美国“911”恐怖袭击现场玻璃表面PAHs质量浓度高达154 μg·m-2[15],上海市金山工业区玻璃表面PAHs质量浓度达87.8 μg·m-2[16]. 当环境条件改变时,玻璃表面富集的PAHs又会释放到室内空气中,居民日常生活和工作与玻璃直接接触也较频繁,这样不可避免的暴露于PAHs风险之中. 基于此,本研究选择上海市公园绿地玻璃为研究介质,了解玻璃表面PAHs富集水平和组分特征,进一步对污染源进行分析,以期为城市多介质PAHs研究提供理论和数据支撑.
1. 材料与方法(Materials and methods)
1.1 样品采集
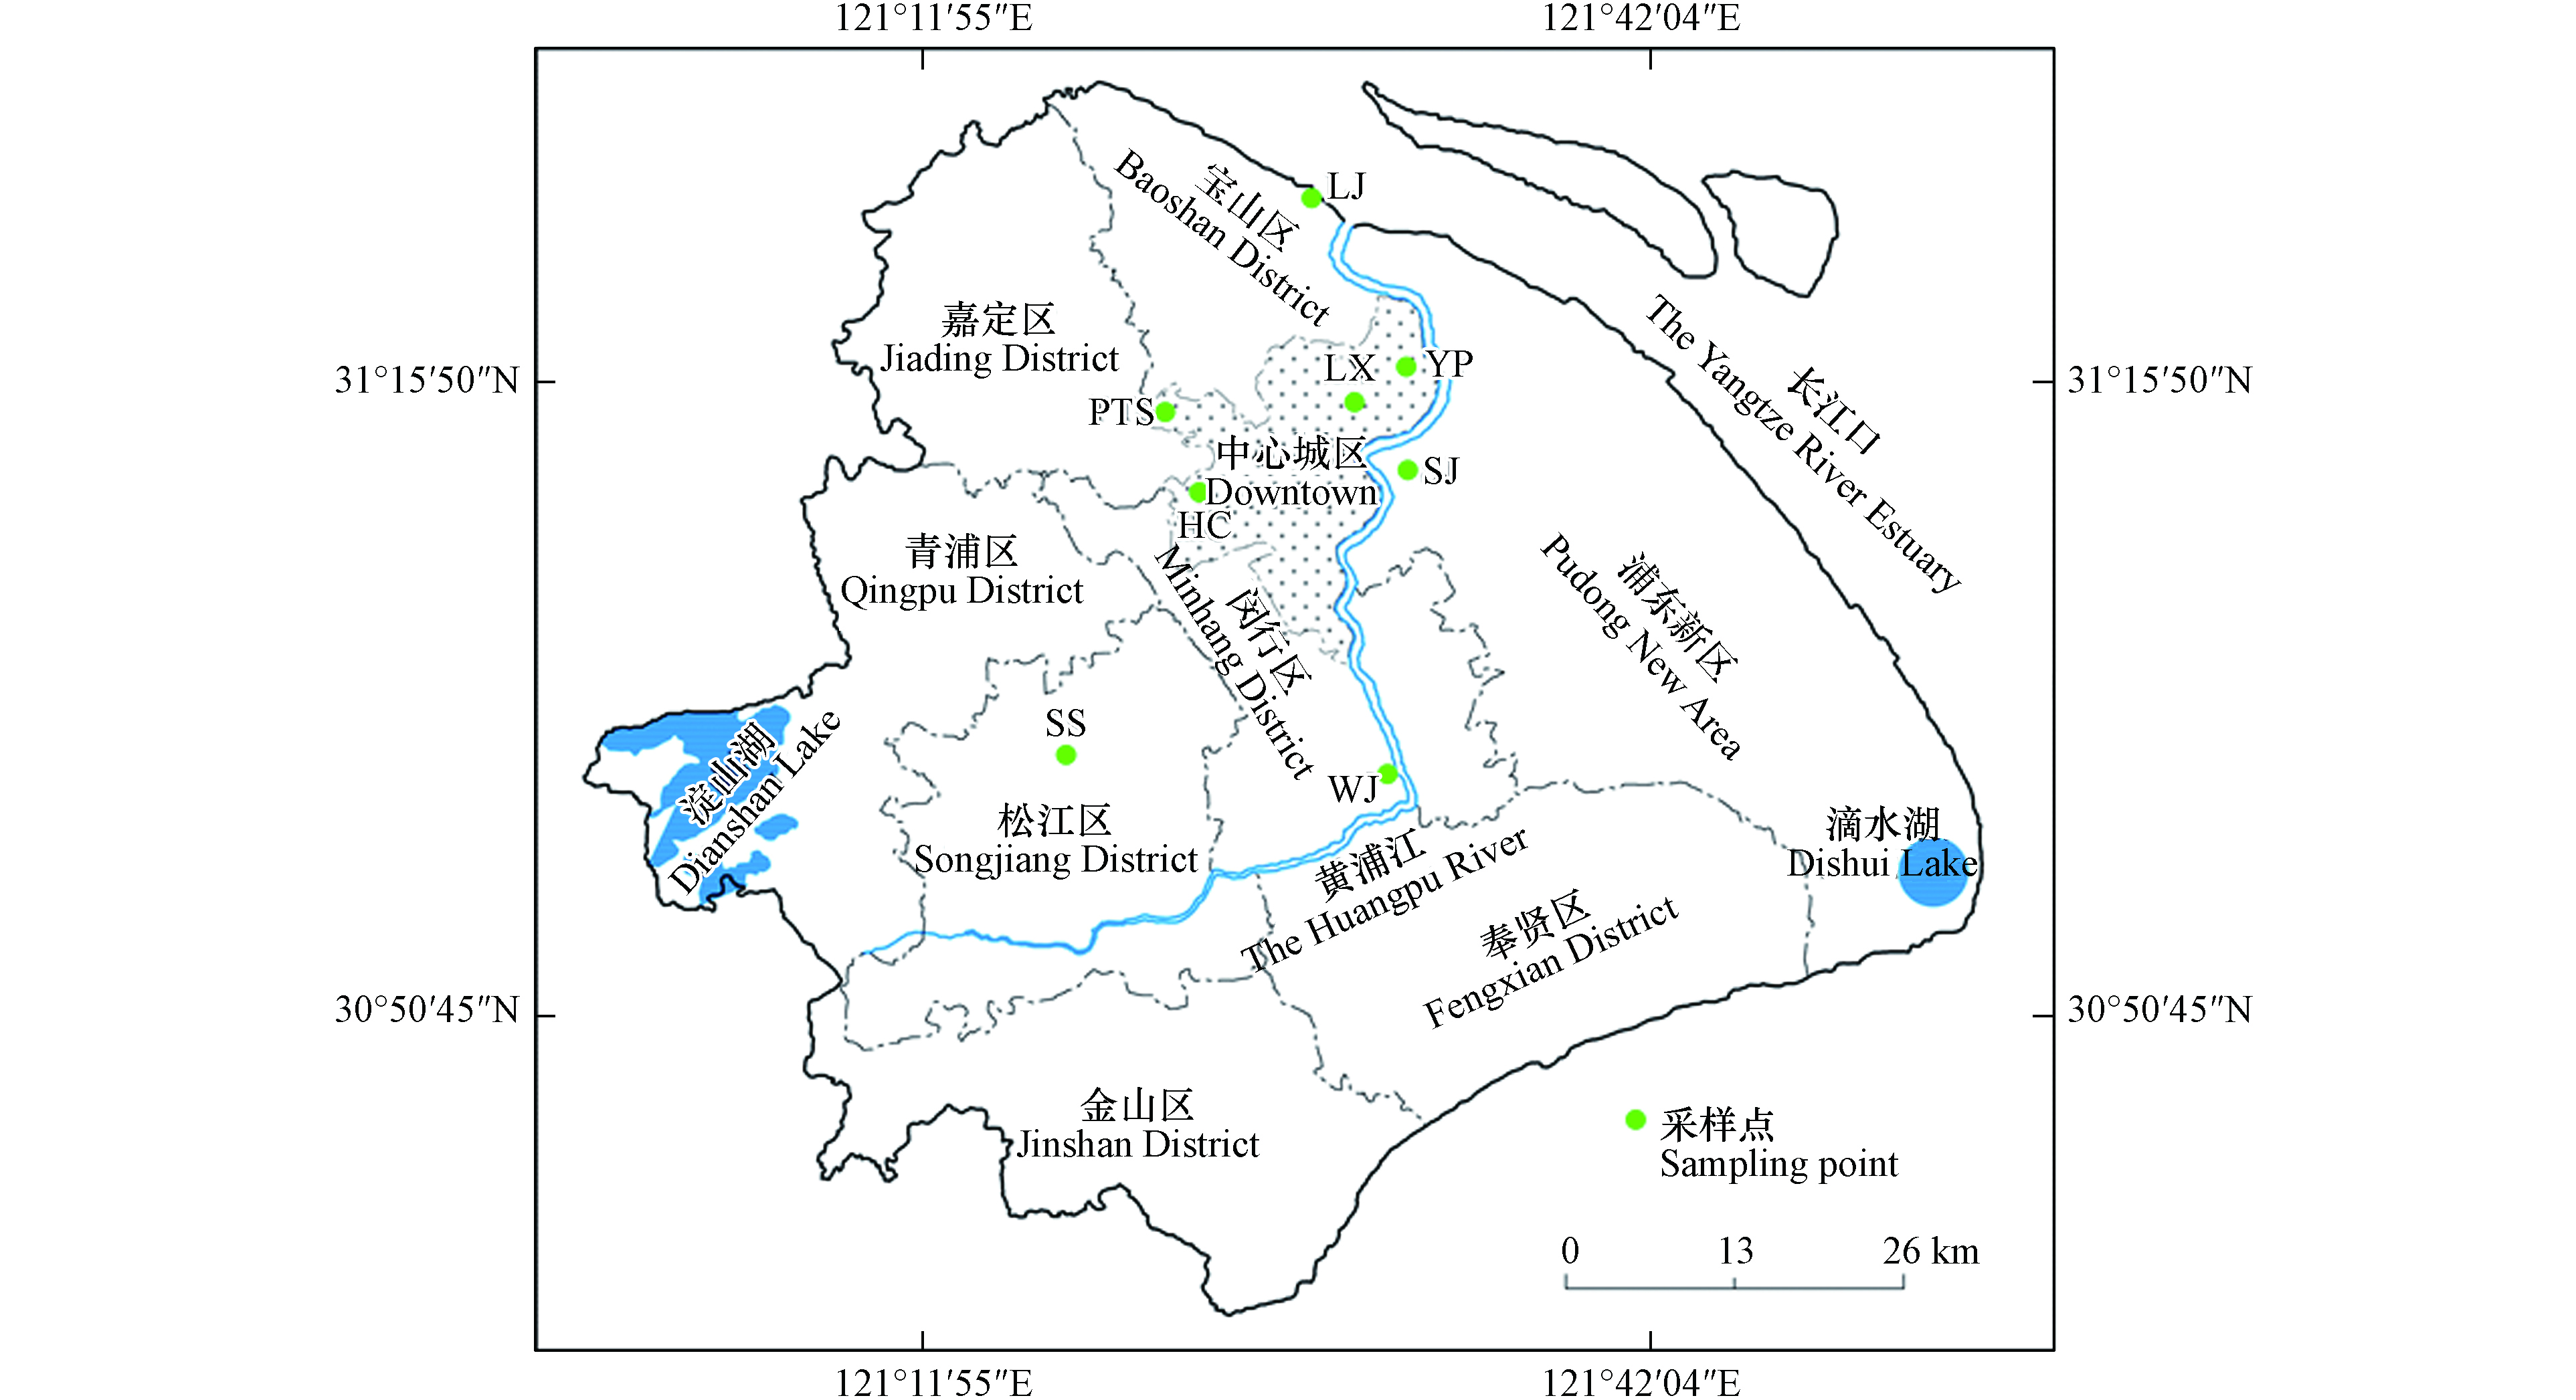
本研究共选择了8个代表性公园绿地,其中杨浦公园(YP)、鲁迅公园(LX)、华漕公园(HC)和普陀体育公园(PTS)位于上海市中心城区,主要满足于附近居民日常休闲需要;世纪公园(SJ)靠近陆家嘴商务区,为4A级旅游景区,汽车流量大;临江公园(LJ)和吴泾公园(WJ)分别位于宝山工业区和吴泾工业区附近,为附近居民日常休闲活动场所;佘山森林公园(SS)位于上海市松江区,为远郊区旅游景区,工业排放和汽车尾气对其影响较小(图1). 考虑降雨时采样点附近草本植物叶片喷溅对玻璃表面PAHs累积的影响和采样的方便性,选择不受降雨冲刷影响且高于地面约2 m左右的玻璃作为采样对象. 根据玻璃大小确定采样面积,保证采样区域距玻璃边框10 cm以上,以免玻璃边框密封材料污染样品. 由于采样玻璃表面PAHs的累积时间不确定,用低尘擦拭纸沾取二氯甲烷将玻璃擦拭干净,然后每隔3个月擦拭玻璃表面采集样品1次,共采集4次,分别代表春季、夏季、秋季和冬季. 采样时,用已净化的低尘擦拭纸(Kimwipes,购于美国kimberly clark公司)沾取二氯甲烷定面积擦拭玻璃表面,采集好的样品用铝箔包好装于自封袋中. 每个采样点采集2个样品,共计64个. 为检验大气中气相PAHs对采样过程的影响,同时采集野外空白样品,用镊子夹取低尘擦拭纸沾取二氯甲烷后在空气中挥动至风干后用铝箔包好,所有样品带回实验室-20℃保存待分析.
1.2 样品处理与分析
样品冷冻风干后称重,加适量铜粉和无水硫酸钠一并填装于滤纸槽中,加入氘代回收率内标物(购于德国Dr. Ehrenstorfer公司),用丙酮和二氯甲烷混合溶剂(120 mL,体积比1:1)在索式抽提器中以4次·h−1的速率连续回流抽提20 h,将抽提液旋转蒸发至约1 mL,用25 mL正己烷进行溶剂置换后再蒸发至1 mL,过硅胶-氧化铝层析柱去除杂质(体积比2∶1,湿法填装),用15 mL正己烷和70 mL混合溶剂(二氯甲烷和正己烷体积比为3∶7)分别淋洗出烷烃和芳烃组分,含芳烃组分浓缩定容至1mL上机分析. 利用气相色谱-质谱联用仪(Agilent, 7890A/5975C, 美国Agilent公司)分析16种优控PAHs(萘(Na)、苊(Acy)、二氢苊(Ace)、芴(Fluo)、菲(Phe)、蒽(An)、荧蒽(Fl)、芘(Pyr)、苯并[a]蒽(BaA)、䓛(Chry)、苯并[b]荧蒽(BbF)、苯并[k]荧蒽(BkF)、苯并[a]芘(BaP)、茚并[1,2,3-cd]芘(InP)、二苯并[a,h]蒽(DahA)、苯并[ghi]苝(BghiP)). 色谱柱为DB-5聚硅氧烷聚合物色谱柱(30 m×0.25 mm×0.25 μm). 升温程序为色谱柱在55 ℃维持2 min,然后以20 ℃·min−1速率升温到280 ℃,以10 ℃·min−1 速率升温到310 ℃,维持5 min. 载气为高纯He,流速1 mL·min−1. 扫描模式:SIM模式.
1.3 质量保证与质量控制
部分空白样品检出Na和Phe(含量低于样品实际含量的3%),方法空白实验无PAHs被检出,16种PAHs加标空白回收率为70%—110%. 氘代内标物回收率为:萘-d8:79.8%—95.1%,二氢苊-d10:79.85%—95.73%,菲-d10:74.83%—98.89%,䓛-d12:77.8%—106.2%,苝-d12:80.1%—101.65%.
1.4 数据处理与制图
玻璃表面PAHs质量浓度有两种表达方式:面积归一化和质量归一化. 计算公式如下:(1)面积归一化质量浓度(ANMC)=C/A(单位为ng·m−2,C为每个采样点2个样品的平均质量浓度,A为采样面积,采样时用刻度尺标出采样范围,一般为30 cm×30 cm);(2)质量归一化质量浓度(MNMC)=C/M(单位为ng·g−1,C为每个采样点2个样品的平均质量浓度,M为采样前后低尘擦拭纸质量差)[15]. 应用毒性当量因子(TEFs)计算PAHs的毒性当量(TEQ),计算公式如下:TEQ=(Ci×TEFs),Ci为单体PAH的浓度,TEFs为毒性当量因子[17]. 运用Freehand,Origin 7.5软件进行绘图.
2. 结果与讨论(Results and discussion)
2.1 PAHs质量浓度水平与组成特征
公园绿地玻璃表面PAHs面积归一化质量浓度如表1所示,16种PAHs在春季和夏季的检出率为100%;YP采样点InP、DahA和BghiP,SJ和LJ采样点Acy在秋季低于检出限,而YP、LX、HC、LJ和WJ采样点Acy在冬季低于检出限. 从季节平均质量浓度看,玻璃表面Phe最高(66.9—111.6 ng·m−2),不同季节质量浓度占比在14%—22%之间,其次为Fl(质量浓度在51.3—78.8 ng·m−2之间,占比为9%—17%)和Pyr(质量浓度在32.4—60.7 ng·m−2之间,占比为5%—14%),而DahA最低(质量浓度在2.8—16.4 ng·m−2之间,占比为1%—3%),说明玻璃表面更易吸附大气中的中低环数PAHs,使得高环PAHs的质量浓度较低. 这一结果与上海市大气干湿沉降样品中PAHs富集特征相似,Phe、Fl和Pyr的占比最高[4].
表 1 公园绿地玻璃表面PAHs质量浓度水平(ng·m−2)Table 1. Mass concentration level of PAHs on the glass surface of the park green space(ng·m−2)PAHs YP LX HC PTS SJ LJ SS WJ Na 20.4—113.0 9.1—50.6 31.5—80.8 11.0—40.3 51.6—147.4 14.9—75.5 12.4—71.0 25.3—92.0 Acy 0.0—23.7 0.0—25.2 0.0—25.3 2.3—23.1 0.0—48.6 0.0—67.0 1.5—21.0 0.0—23.4 Ace 2.0—38.2 2.8—20.6 1.9—43.9 2.8—46.0 2.7—42.7 1.5—72.7 1.8—40.5 4.4—52.6 Fluo 20.4—35.1 6.3—26.1 9.8—29.1 5.3—28.0 23.4—49.9 5.2—63.6 5.3—19.2 11.9—28.8 Phe 71.3—121.9 56.3—78.9 56.7—116.8 27.2—118.2 106.0—152.9 11.6—176.5 31.6—74.1 107.7—128.9 An 2.5—12.5 1.4—7.9 2.5—10.8 2.5—10.1 11.3—22.0 1.5—29.9 2.5—7.9 8.8—12.9 Fl 48.1—147.7 18.4—35.9 28.2—43.8 23.2—37.2 93.4—199.4 13.3—98.7 41.7—55.4 25.0—141.5 Pyr 36.0—111.9 12.1—24.1 31.0—36.9 17.7—39.1 61.3—163.7 10.7—74.4 7.7—46.7 31.4—103.3 BaA 9.1—44.6 2.4—17.5 5.8—20.0 5.0—13.3 27.2—82.5 3.4—49.5 11.7—20.7 7.6—32.8 Chry 36.0—98.8 10.0—26.5 20.6—31.9 16.1—28.5 54.2—109.8 6.5—84.7 33.7—43.0 24.3—80.5 B[b+k]F 17.1—63.3 3.7—25.3 9.0—26.6 8.7—20.3 46.0—133.5 7.5—202.1 22.3—33.9 10.3—76.3 BaP 4.8—47.9 2.0—10.0 3.2—11.3 3.6—7.4 22.2—136.0 3.0—88.3 12.6—19.0 4.8—42.8 InP 0.0—32.8 2.1—13.3 3.9—9.8 3.6—10.0 25.3—63.8 2.7—266.1 11.4—16.9 6.6—38.1 DahA 0.0—9.9 1.2—5.7 1.2—5.0 1.2—5.8 5.2—18.1 0.6—91.1 2.9—5.6 4.3—12.2 BghiP 0.0—41.4 2.8—15.2 3.3—10.9 5.0—11.5 32.2—70.5 3.4—402.5 9.7—27.2 8.6—54.2 T-PAHs 298.7—731.5 131.9—332.7 223.9—470.3 125.4—431.0 662.3—1066.7 83.6—1689.6 221.1—431.8 388.1—662.4 公园绿地玻璃表面PAHs的质量浓度范围在83.6—1689.6 ng·m−2之间(表1). 玻璃表面PAHs质量浓度在夏季最高(599.7 ng·m−2),其次秋季(533.1 ng·m−2)和春季(464.2 ng·m−2),冬季最低(351.4 ng·m−2). 在夏季,高温使得中低环数PAHs从被污染的土壤、植物叶片和路面等介质挥发到大气中,促进了玻璃表面有机膜的冷凝过程[9]. 与其它研究相比,远低于广州城区(1290 ng·m−2)[18]、上海市交通区(4007.9 ng·m−2)和商业区(3655.6 ng·m−2)[12]、巴尔的摩城区(5408 ng·m−2)[19]、多伦多城区(6100 ng·m−2)[15]和911恐怖袭击后的纽约世贸中心废墟附近玻璃表面PAHs质量浓度(38744 ng·m−2)[20],但高于多伦多农村(210 ng·m−2)[15]. 具体来看(图2),紧邻上海陆家嘴金融区的SJ玻璃表面PAHs季节平均质量浓度最高(1107.6 ng·m−2),SJ采样点附近交通流量大,PAHs更多来源于交通排放[21];其次为WJ(546.9 ng·m−2),该采样点位于黄浦江边,北面为吴泾火电厂,往来船舶尾气和火电厂燃煤是PAHs的主要来源.
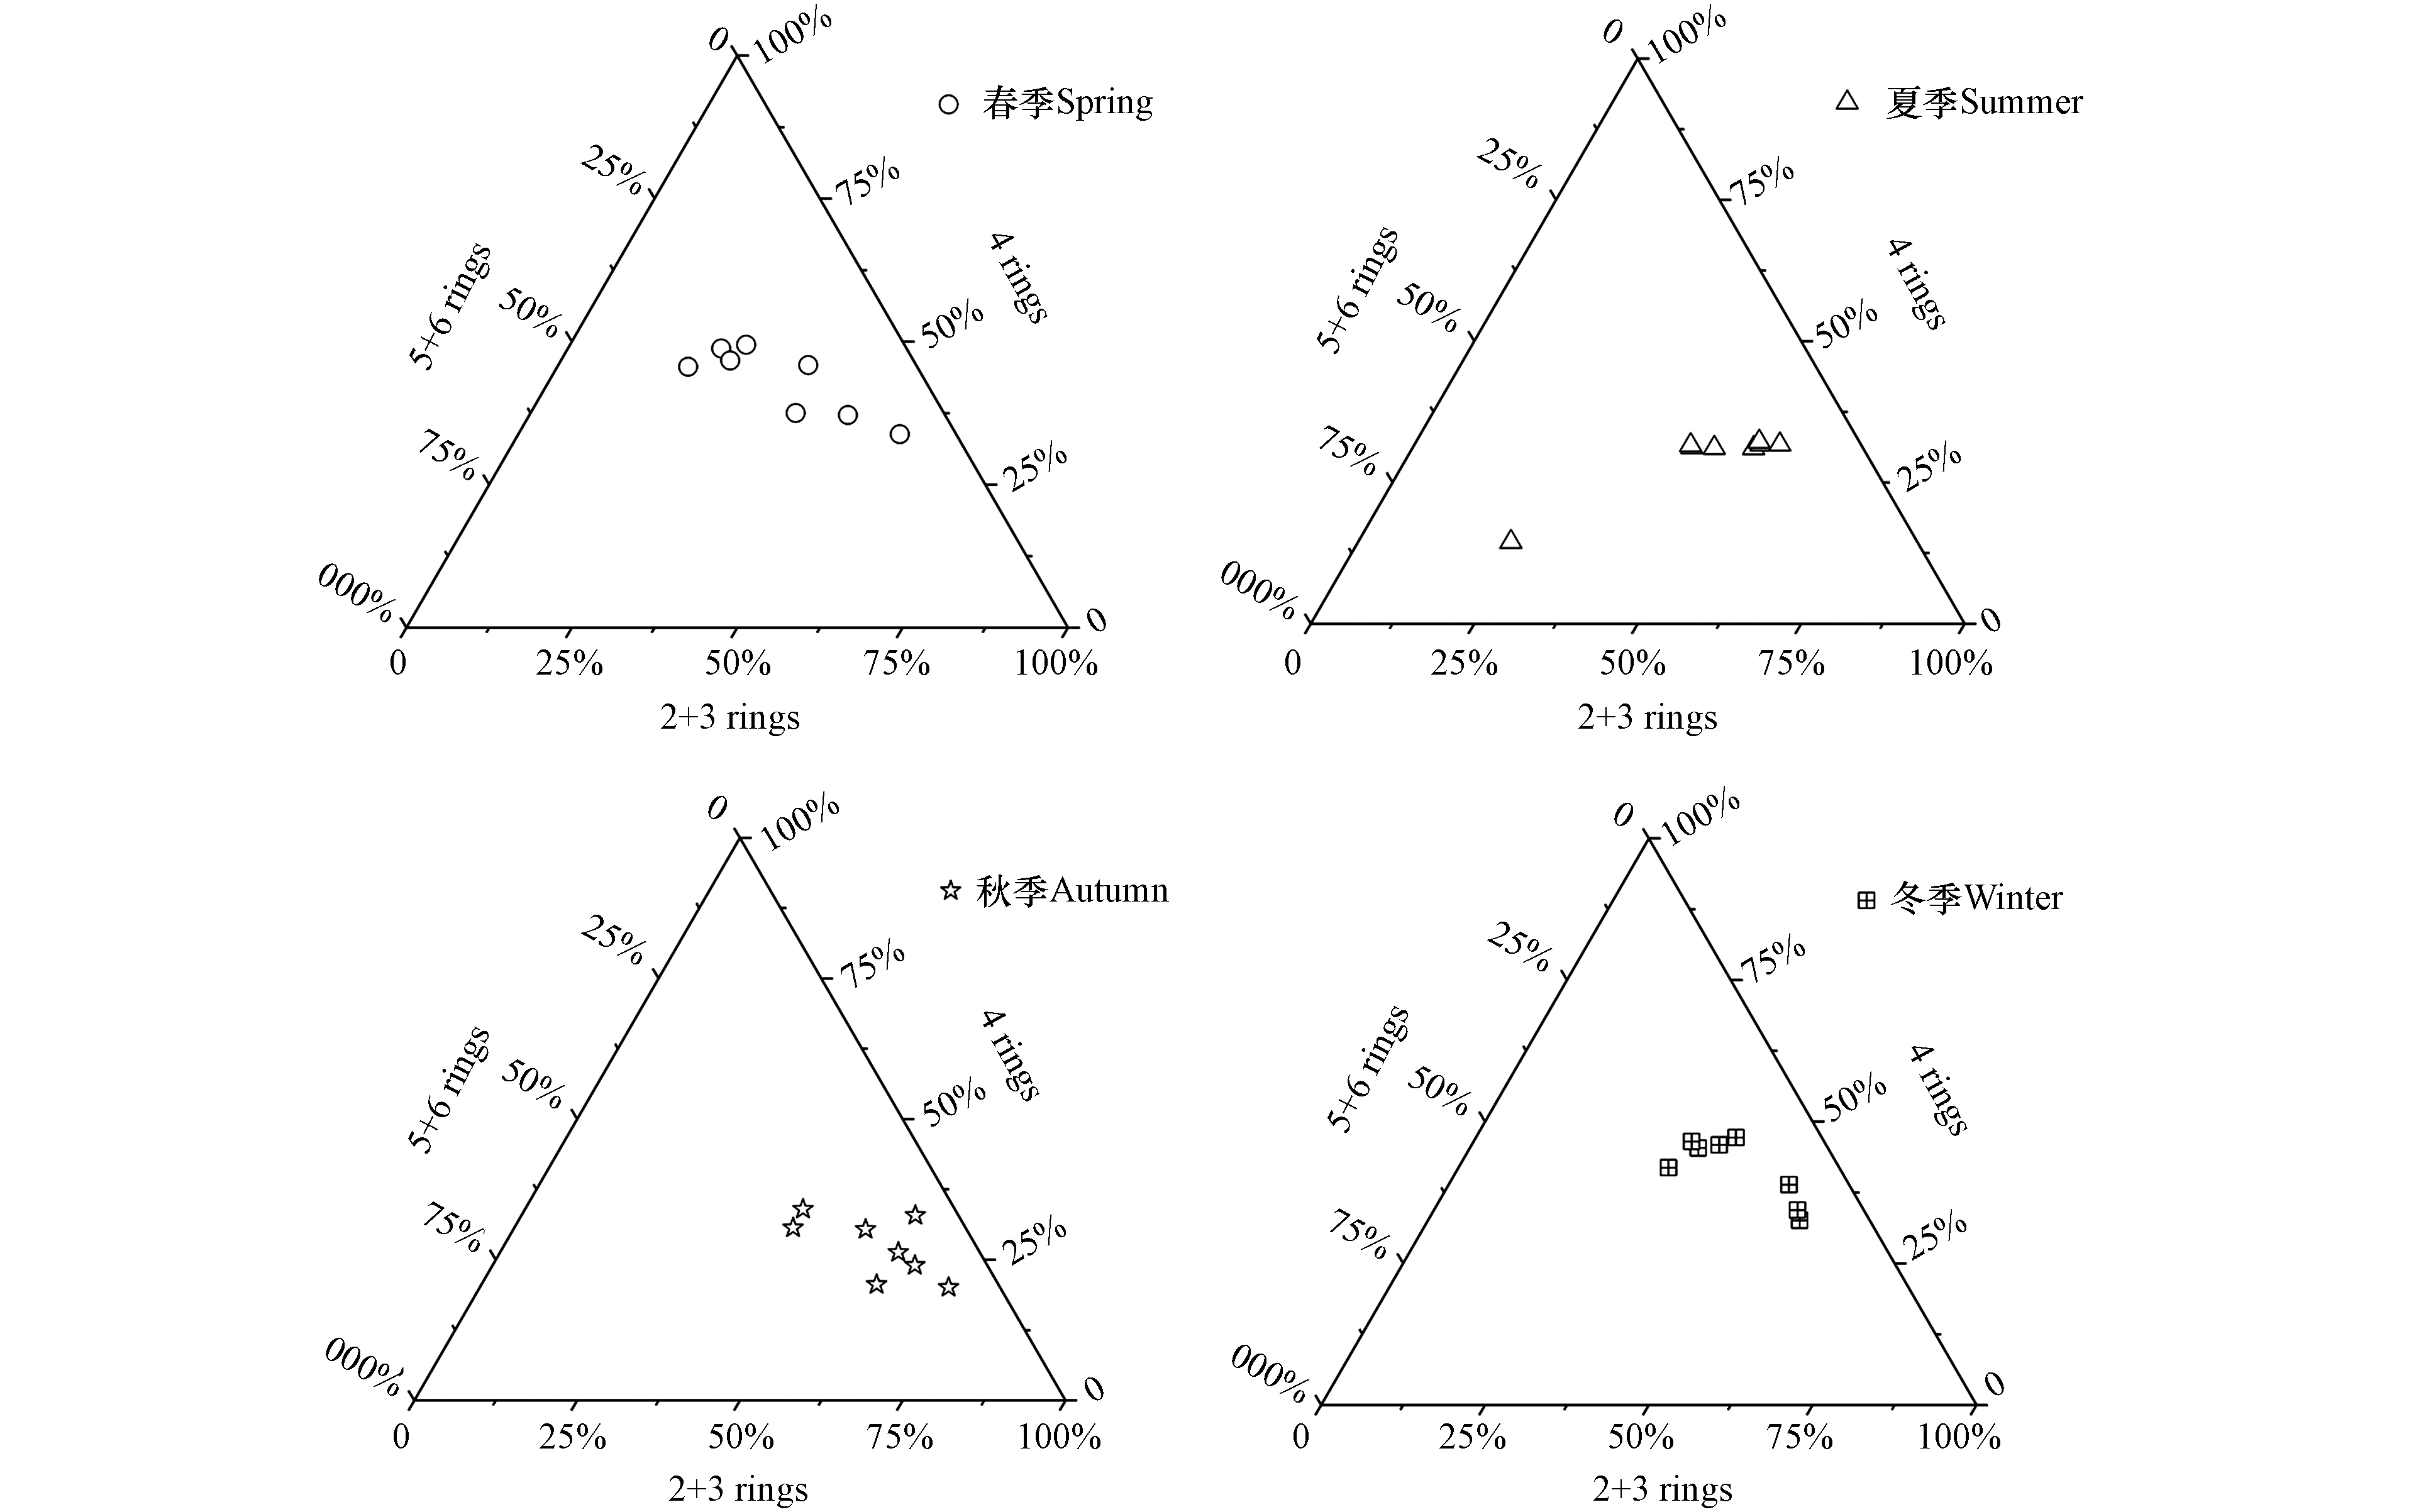
由于气-固分配系数的差异,大气中低环数PAHs以气相形式存在,而高环数PAHs以颗粒相形式存在[22]. 由图3可知,公园绿地玻璃表面PAHs组成特征季节差异明显,4环PAHs的质量浓度平均占比在春季(43%)和冬季(42%)最高;随着季节转换,2+3环PAHs质量浓度平均占比在秋季(57%)和夏季(46%)增加明显,说明大气中PAHs存在形式季节差异明显,进一步影响玻璃表面PAHs吸附过程,这种富集模式表征了城市大气颗粒物中PAHs的老化[15];而5+6环PAHs质量浓度平均占比在夏季(24%)>春季(22%)>秋季(15%)=冬季(15%). 总体上,玻璃表面以2+3环和4环PAHs为主,这与Toronto、香港和广州玻璃表面PAHs组成相似[15,18]. 从单体PAH来看,春季和冬季以Phe、Fl和Pyr为主,夏季以Phe和BghiP为主,而秋季以Phe、Na和Fl为主.
2.2 PAHs溯源分析
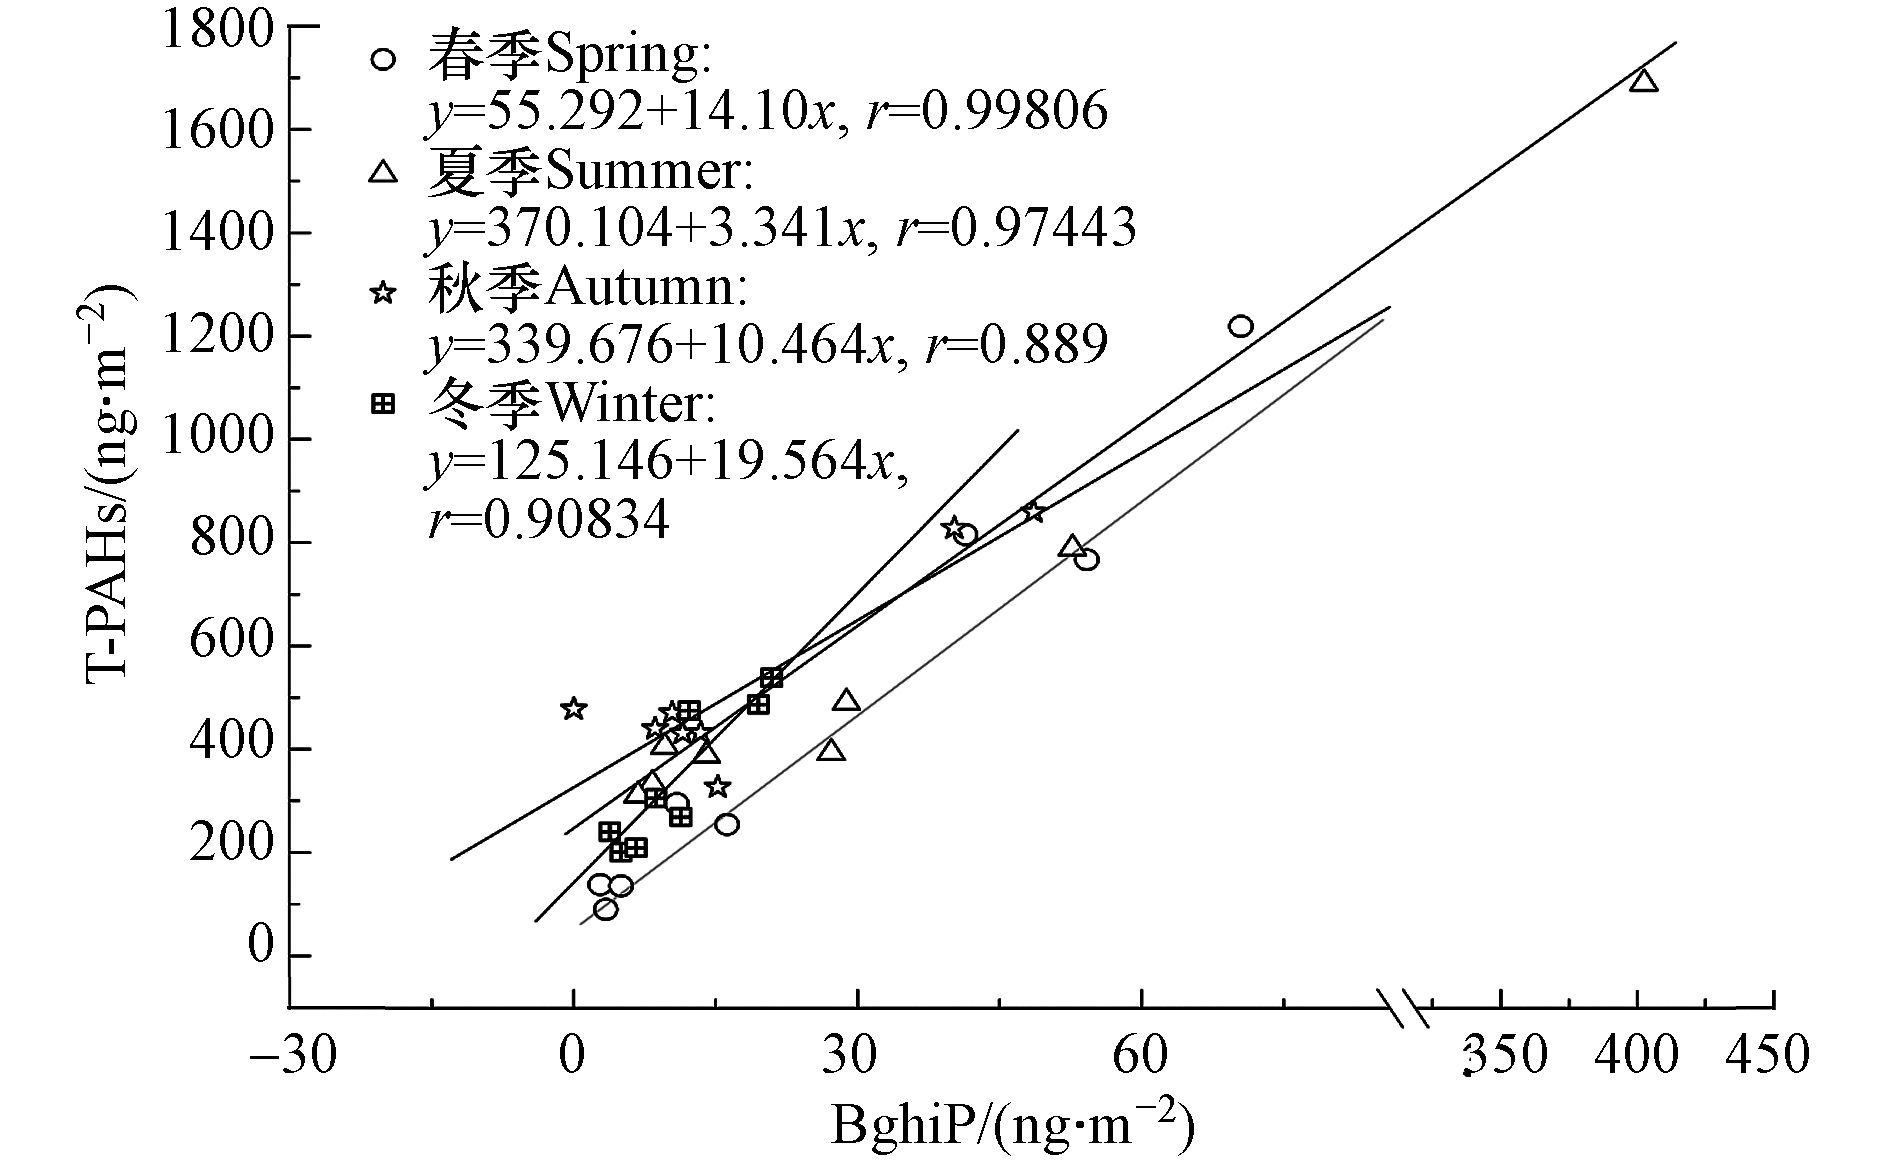
汽车尾气、工业排放和居民生活排放是城市环境系统中PAHs的主要来源[23~25]. 上海市路网稠密、汽车保有量大,汽车尾气对环境中PAHs的贡献不容忽视,而汽车尾气中气相有机物又是玻璃表面有机膜形成的主要物质[13]. 上海地区源成分谱研究表明,柴油车(卡车和客车)尾气中Na、Phe和Fl占比最高,而汽油车尾气中BaP、BghiP和Pyr占比最高[26]. 朱利中等研究认为,BghiP是汽油引擎或柴油内燃机的主要排放物[23],因此,BghiP与T-PAHs之间相关性常被作为城市PAHs的判源指标. 如图4所示,不同季节玻璃表面BghiP与T-PAHs之间均存在很强的正相关关系,春季的相关系数(r=0.99806)>夏季(r=0.97443)>冬季(r=0.90834)>秋季(r=0.889),说明汽车尾气是公园绿地玻璃表面PAHs的主要贡献源.
PAHs同分异构体的热稳定性不同,可利用同分异构体比值判断PAHs来源类型[27]. An/(Phe+An)和Fl/(Fl+Pyr)、InP/(InP+BghiP)和BaA/(BaA+Chry)异构体比值常被用作环境介质中PAHs的判源指标[28]. 不同研究区域环境参数差异较大,使得PAHs在迁移归趋过程中的降解转化不同,所以利用其它研究区异构体比值得出的判源结果可能存在偏差. 本研究利用上海市PAHs污染源成分谱数据对玻璃表面PAHs进行源解析研究[26]. 如图5所示,从An/(Phe+An)和Fl/(Fl+Pyr)异构体比值来看,春季PAHs异构体比值与柴油车,降尘、裸露表土和油烟中PAHs成分谱相近,夏季PAHs异构体比值与柴油车、裸露表土和烧烤PAHs成分谱相似,而秋季和冬季PAHs异构体比值主要与裸露表土和降尘PAHs成分谱相似,可以看出不同季节玻璃表面PAHs污染源存在差异,但主要污染源相对稳定,即为汽车尾气和扬尘源(降尘和裸露表土),而夏季户外烧烤对PAHs有一定的贡献. 从InP/(InP+BghiP)和BaA/(BaA+Chry)异构体比值来看,春季PAHs异构体比值与秸秆燃烧物、草木灰、裸露表土和工业区路面尘、降尘相似,夏季主要与油烟、汽车修理厂表土和草木灰相似,秋季和冬季与秸秆燃烧物和裸露表土相似,说明玻璃表面PAHs在春季、秋季和冬季可能更多来源于扬尘源(裸露表土)和秸秆焚烧,油烟和修理厂表土挥发出的气相PAHs在夏季的贡献较为明显. 相较于其它环境介质(土壤、水体和大气颗粒物等),吸附在玻璃表面的PAHs在光照和气温发生变化时更易发生光降解[12],所以玻璃表面PAHs的溯源还需结合其它判源方法进一步研究.
 图 5 不同季节玻璃表面PAHs特征比值Figure 5. Characteristic ratio of PAHs on glass surface in different seasons1. 柴油车(客车)Diesel vehicle(bus),2. 油烟Lampblack,3. 裸露表土1 Exposed topsoil 1,4. 柴油车(卡车)Diesel vehicle(truck),5. 烧烤Barbecue,6. 宝山区降尘Dust fall(Baoshan),7. 秸秆燃烧物Straw incineration,8. 工地开挖土方1 Site earthwork 1,9. 汽车修理厂表土Topsoil of garage,10. 草木灰Plant ash,11. 宝山区路面尘Road dust(Baoshan),12. 工地开挖土方2 Site earthwork 2,13. 金山区路面尘Road dust(Jinshan),14. 裸露表土2 Exposed topsoil 2
2.3 PAHs毒性当量
在城市环境中,PAHs以气相或颗粒相吸附在玻璃表面,居民日常生活不可避免的暴露于PAHs风险之中,所以开展玻璃表面PAHs的毒性当量评估非常必要. BaP毒性当量浓度(toxic equivalent quantity, TEQ)已被广泛地应用于评估PAHs的潜在风险,通过毒性当量因子(toxic equivalence factors, TEFs)将不同毒性的PAHs质量浓度转化为生物毒理学数据,进而了解PAHs的潜在风险[17]. 有关玻璃表面PAHs研究开展较晚且资料较少,对玻璃表面PAHs进行质量归一化处理后的7种致癌性PAHs(BaA、Chry、B[b]F、B[k]F、BaP、InP和DahA)的质量浓度范围为58.3—1311.8 ng·g−1. 计算后的TEQ浓度为夏季(466.6 ng·g−1)>春季(361.0 ng·g−1)>秋季(262.9 ng·g−1)>冬季(214.6 ng·g−1),与上海市文教区(490 ng·g−1)和商业区(261 ng·g−1)玻璃表面TEQ浓度相当[12];但远低于上海市PM2.5中PAHs的TEQ浓度[4];也低于上海市路边土壤中TEQ浓度(892 ng·g−1),与绿化带(401 ng·g−1)、商业区(341 ng·g−1)和公园(324 ng·g−1)土壤中TEQ浓度相当[29];高于上海市不同功能区香樟树叶片中PAHs的TEQ浓度值[30]. BaP、DahA和B[b+k]F是玻璃表面主要的致癌单体PAH,共计占TEQ浓度的80%—91%,其中BaP的TEQ浓度占比高达50%—62%.
3. 结论(Conclusion)
(1)玻璃表面PAHs质量浓度在83.6—1689.6 ng·m−2之间. 在夏季最高(599.7 ng·m−2),冬季最低(351.4 ng·m−2). SJ玻璃表面PAHs平均质量浓度最高(1107.6 ng·m−2),可能受控于附近繁忙的交通排放. 单体PAH中Phe的质量浓度最高(66.9—111.6 ng·m−2),其次为Fl(51.3—78.8 ng·m−2),DahA的质量浓度最低(2.8—16.4 ng·m−2). 玻璃表面以2+3环和4环PAHs为主,4环PAHs在春季和冬季占比最高;2+3环PAHs在秋季和夏季占比最高.
(2)BghiP与T-PAHs之间相关系数呈春季(r=0.99806)>夏季(r=0.97443)>冬季(r=0.90834)>秋季(r=0.889). An/(Phe+An)和Fl/(Fl+Pyr)异构体比值表明主要污染源相对稳定,即为汽车尾气和扬尘源(降尘和裸露表土);而InP/(InP+BghiP)和BaA/(BaA+Chry)异构体比值说明玻璃表面PAHs在春季、秋季和冬季可能更多来源于扬尘源(裸露表土)和秸秆焚烧,油烟和汽车修理厂表土挥发的气相PAHs对夏季PAHs的贡献较明显.
(3)质量归一化处理后,TEQ浓度呈现出夏季(466.6 ng·g−1)>春季(361.0 ng·g−1)>秋季(262.9 ng·g−1)>冬季(214.6 ng·g−1). BaP、DahA和B[b+k]F是玻璃表面主要的致癌单体PAH,共计占TEQ浓度的80%—91%,其中BaP的TEQ浓度占比高达50%—62%.
-
表 1 经呼吸进入人体的暴露参数
Table 1. Exposure parameters of breathing into human body
重金属元素Heavy metal element 性质Characteristic 致癌因子/((kg·d)· μg−1)SF 参考剂量/(μg·(kg·d) −1)RfD As 致癌 2.01×10⁻² — Cd 致癌 8.40×10⁻³ — Ni 致癌 1.19×10⁻³ — Al 非致癌 — 4.00×10⁻¹ Cu 非致癌 — 2.00 Mn 非致癌 — 3.00×10⁻¹ Pb 非致癌 — 4.30×10⁻¹ Se 非致癌 — 1.00 Zn 非致癌 — 1.00×10⁻² 表 2 重金属经呼吸进人体的剂量-反应参数
Table 2. Dose-response parameters of heavy metals breathing into human body
人群Crowd 呼吸速率/(m3·d−1)IR 体重/kgBW 暴露持续时间/dED 致癌暴露时间/dAT-Carcinogenesis 非致癌暴露时间/dAT-Non-carcinogens 儿童 8.70 36.00 18.00 70.00 18.00 成年女性 14.17 57.30 30.00 70.00 30.00 成年男性 19.02 66.20 30.00 70.00 30.00 表 3 三亚市PM2.5重金属元素的质量浓度
Table 3. Mass concentration of PM2.5 heavy metal elements in Sanya
元素Element 2019年均值/(μg·m−3)2019 mean 6月均值/(μg·m−3)June mean 10月均值/(μg·m−3)October mean 12月均值/(μg·m−3)December mean 标准限值/(μg·m−3)Standard limit As 4.30×10⁻³ — 4.00×10⁻⁴ 4.90×10⁻³ 6.00×10⁻³ Cr 7.70×10⁻³ 7.60×10⁻³ 8.50×10⁻³ 7.40×10⁻³ 2.50×10⁻⁵ Ni 3.50×10⁻³ 3.00×10⁻³ 4.00×10⁻³ 3.60×10⁻³ — Cu 1.74×10⁻² 1.44×10⁻² 1.64×10⁻² 2.04×10⁻² — Pb 1.53×10⁻² 1.19×10⁻² 1.75×10⁻² 1.68×10⁻³ 5.00×10⁻¹ Se 1.60×10⁻³ 1.00×10⁻³ 1.80×10⁻³ 2.00×10⁻³ — Zn 3.23×10⁻² 2.04×10⁻² 3.79×10⁻² 3.92×10⁻² — 表 4 南海周边大气颗粒物PM受体模型源解析比较表
Table 4. Comparison of source analysis of PM receptor models around the South China Sea
采样点Sampling site 粒径Size 采样时间Date 模型Model 源解析结果Source analysis results 参考文献References 中国海南省三亚市 PM2.5(n=34) 2012, 1.6 — 2.8; 2013.6.6—7.25 PMF 1.生物质燃烧(23.2%);2.机动车(37.9%); 3.燃煤(22.6%); 4.其他(16.3%); [8] PM2.5(n=90) 2019, 6 — 2019,12 PMF 1. 海洋源(24.9%); 2. 生物质燃烧源(20.8%); 3. 工业源(20.5%); 4. 土壤源(19%); 5. 交通源(14.8%) 本研究 中国海南省三沙市 TSP(n=73) 2014.3—2015.2 PMF 1. 海盐(46.6%); 2. 土壤尘(11.9%); 3. 二次无机气溶胶(30.1%); 4. 海洋排放(11%) [11] 中国海南省海口市 PM2.5(n=38) 2011.12.26 — 2012.6.3; 2012.4.17—26 CMB 1. 扬尘(14.9%); 2. 机动车尾气(17.5%); 3. SO42-(9.5%); 4. 海盐(3%); [9] PM10(n=76) 1. 扬尘(23.6%); 2. 机动车尾气(35%); 3. SO42-(15.7%); 4. 海盐(8%); 中国台湾省高雄港 PM2.5(n=28) 2018.5— 2019.1 PMF 1. 船舶排放(15.6%);2. 二次无机气溶胶(24%);3. 机动车尾气(12.2%);4. 海盐(20.7%);5. 海盐和生物质燃烧(14.4%);6. 重油, 生物质燃烧(13.2%) [30] 菲律宾马尼拉 PM2.5(n=28) 2018.5— 2019.1 PMF 1. 道路扬尘, 燃煤(17.4%);2. 船舶排放, 机动车(19.1%);3. 工业(17.7%);4. 机动车(12.6%);5. 二次气溶胶,土壤, 生物质燃烧(21.3%);6. 海盐, 生物质燃烧(11.8%) [30] 马来西亚八打灵 PM2.5(n=247) 2017.1.11—2018.2.19 PMF 1. 混合冶炼工业和道路扬尘(5.6);2. 矿物尘(7.2%);3. 海盐(7.4%);4. 冶金工业(5.1%);5. 农业(19.2%);6. 制造业 (12%);7. 二次无机气溶胶,交通 (28.5%);8.生物质燃烧(15.2%) [31] 表 5 三亚市大气PM2.5中重金属元素经呼吸途径对人群的年均超额危险度
Table 5. Average annual excess risk of heavy metal elements in atmospheric PM2.5 in Sanya City to the population through respiratory pathway
元素Elements 年均超额危险度R(无量纲) Annual excess risk R(No unit) 儿童Child 成年女性Adult women 成年男性Adult men As 7.64×10⁻⁸ 1.30×10⁻⁷ 1.51×10⁻⁷ Cr 3.85×10⁻⁷ 6.57×10⁻⁷ 7.63×10⁻⁷ Ni 3.68×10⁻⁹ 6.27×10⁻⁹ 7.28×10⁻⁹ Al 2.21×10⁻⁹ 2.26×10⁻⁹ 2.62×10⁻⁹ Cu 3.01×10⁻¹¹ 3.08×10⁻¹¹ 3.58×10⁻¹¹ Mn 5.46×10⁻¹⁰ 5.58×10⁻¹⁰ 6.49×10⁻¹⁰ Pb 1.23×10⁻¹⁰ 1.26×10⁻¹⁰ 1.46×10⁻¹⁰ Se 5.40×10⁻¹² 5.52×10⁻¹² 6.42×10⁻¹² Zn 1.12×10⁻¹¹ 1.14×10⁻¹¹ 1.33×10⁻¹¹ -
[1] 曹军骥. PM2.5与环境[M]. 北京: 科学出版社, 2014. CAO J J. PM2.5 and environment[M]. Beijing: Science Press, 2014 (in Chinese) .
[2] 周元. 努力建设以人民为中心的海南自贸港[N]. 海南日报, 2021-07-27(A02). ZHOU Y. Strive to build people-centered Hainan Free Trade Port[N]. Hainan Daily, 2021 /7 /27 / A02 edition (in Chinese).
[3] 周家茂, 赵由之, 刘随心, 等. 三亚冬季大气PM2.5及碳气溶胶特征与来源分析 [J]. 地球环境学报, 2012, 3(5): 1060-1065. ZHOU J M, ZHAO Y Z, LIU S X, et al. Characteristic and source identifications of PM2.5 and carbonaceous aerosol at Sanya durning 2011 winter [J]. Journal of Earth Environment, 2012, 3(5): 1060-1065(in Chinese).
[4] ZHOU J M, HO S, CAO J J, et al. Chemical characterization of PM2.5 from a southern coastal city of China: Applications of modeling and chemical tracers in demonstration of regional transport [J]. Environmental Science and Pollution Research International, 2018, 25(21): 20591-20605. doi: 10.1007/s11356-018-2238-1 [5] TIAN J, WANG Q Y, HAN Y M, et al. Contributions of aerosol composition and sources to particulate optical properties in a southern coastal city of China [J]. Atmospheric Research, 2020, 235: 104744. doi: 10.1016/j.atmosres.2019.104744 [6] WANG Q Y, LIU H K, WANG P, et al. Optical source apportionment and radiative effect of light-absorbing carbonaceous aerosols in a tropical marine monsoon climate zone: The importance of ship emissions [J]. Atmospheric Chemistry and Physics, 2020, 20(24): 15537-15549. doi: 10.5194/acp-20-15537-2020 [7] WANG P, HAN C, ZHAO Y Z, et al. Characterization of PM2.5 mass concentration in the onshore of Sanya, China [J]. Journal of Atmospheric Science Research, 2020, 3(2): 32-38. [8] WANG J Z, HO S, CAO J J, et al. Characteristics and major sources of carbonaceous aerosols in PM2.5 from Sanya, China [J]. The Science of the Total Environment, 2015, 530/531: 110-119. doi: 10.1016/j.scitotenv.2015.05.005 [9] FANG X Z, BI X H, XU H, et al. Source apportionment of ambient PM10 and PM2.5 in Haikou, China [J]. Atmospheric Research, 2017, 190: 1-9. doi: 10.1016/j.atmosres.2017.01.021 [10] LIU B S, ZHANG J Y, WANG L, et al. Characteristics and sources of the fine carbonaceous aerosols in Haikou, China [J]. Atmospheric Research, 2018, 199: 103-112. doi: 10.1016/j.atmosres.2017.08.022 [11] XIAO H W, XIAO H Y, LUO L, et al. Atmospheric aerosol compositions over the South China Sea: Temporal variability and source apportionment [J]. Atmospheric Chemistry and Physics, 2017, 17(4): 3199-3214. doi: 10.5194/acp-17-3199-2017 [12] GENG X F, MO Y Z, LI J, et al. Source apportionment of water-soluble brown carbon in aerosols over the northern South China Sea: Influence from land outflow, SOA formation and marine emission [J]. Atmospheric Environment, 2020, 229: 117484. doi: 10.1016/j.atmosenv.2020.117484 [13] SONG J W, ZHANG Y Y, ZHANG Y L, et al. A case study on the characterization of non-methane hydrocarbons over the South China Sea: Implication of land-sea air exchange [J]. The Science of the Total Environment, 2020, 717: 134754. doi: 10.1016/j.scitotenv.2019.134754 [14] ZHANG Y L, LI J, ZHANG G, et al. Radiocarbon-based source apportionment of carbonaceous aerosols at a regional background site on Hainan Island, South China [J]. Environmental Science & Technology, 2014, 48(5): 2651-2659. [15] XIAO H W, XIE L H, LONG A M, et al. Use of isotopic compositions of nitrate in TSP to identify sources and chemistry in South China Sea [J]. Atmospheric Environment, 2015, 109: 70-78. doi: 10.1016/j.atmosenv.2015.03.006 [16] 郑玫, 张延君, 闫才青, 等. 中国PM2.5来源解析方法综述 [J]. 北京大学学报(自然科学版), 2014, 50(6): 1141-1154. ZHENG M, ZHANG Y J, YAN C Q, et al. Review of PM2.5 source apportionment methods in China [J]. Acta Scientiarum Naturalium Universitatis Pekinensis, 2014, 50(6): 1141-1154(in Chinese).
[17] 魏青, 陈文怡, 金麟先. 枣庄市大气PM2.5重金属元素健康风险评价及污染来源解析 [J]. 中国粉体技术, 2020, 26(6): 69-78. WEI Q, CHEN W Y, JIN L X. Health risk assessment and source analysis of heavy metal elements in PM2.5 in Zaozhuang City [J]. China Powder Science and Technology, 2020, 26(6): 69-78(in Chinese).
[18] 单慧, 欧阳钏, 柯鸿阳, 等. 西北地区典型城市PM2.5中重金属污染特征及健康风险评价 [J]. 中国公共卫生, 2022, 38(4): 476-480. doi: 10.11847/zgggws1127718 SHAN H, OUYANG C, KE H Y, et al. Heavy metals in PM2.5 in four metropolitan cities in Northwest China: Pollution characteristics and health risk assessment [J]. Chinese Journal of Public Health, 2022, 38(4): 476-480(in Chinese). doi: 10.11847/zgggws1127718
[19] CAO J J, WU F, CHOW J C, et al. Characterization and source apportionment of atmospheric organic and elemental carbon during fall and winter of 2003 in Xi'an, China [J]. Atmospheric Chemistry and Physics, 2005, 5(11): 3127-3137. doi: 10.5194/acp-5-3127-2005 [20] WU F, ZHANG D Z, CAO J J, et al. Soil-derived sulfate in atmospheric dust particles at Taklimakan desert [J]. Geophysical Research Letters, 2012, 39(24): L24803. [21] ANTONY CHEN L W, CAO J J. PM2.5 source apportionment using a hybrid environmental receptor model [J]. Environmental Science & Technology, 2018, 52(11): 6357-6369. [22] USA EPA. Integrated risk information system [DB/OL] [2019-02-03]https://www.epa.gov/research-states/integrated-risk-information-system-iris-webinar-archive. [23] ATSDR. Agency for Toxic Substances and Disease Registry[DB/OL]. [2019-02-03] . [24] 范逸飞, 陈秀玲, 方滋婧, 等. 漳州市城市公园灰尘重金属来源及健康风险评价 [J]. 地球环境学报, 2021, 12(1): 104-120. FAN Y F, CHEN X L, FANG Z J, et al. Heavy metal sources and health risk assessment of dust in Zhangzhou urban parks [J]. Journal of Earth Environment, 2021, 12(1): 104-120(in Chinese).
[25] 郑乃嘉, 谭吉华, 段菁春, 等. 大气颗粒物水溶性重金属元素研究进展 [J]. 环境化学, 2014, 33(12): 2109-2116. doi: 10.7524/j.issn.0254-6108.2014.12.005 ZHENG N J, TAN J H, DUAN J C, et al. Research progress on water-soluble heavy metal in atmospheric particulate mattters [J]. Environmental Chemistry, 2014, 33(12): 2109-2116(in Chinese). doi: 10.7524/j.issn.0254-6108.2014.12.005
[26] YAO X H, CHAN C K, FANG M, et al. The water-soluble ionic composition of PM2.5 in Shanghai and Beijing, China [J]. Atmospheric Environment, 2002, 36(26): 4223-4234. doi: 10.1016/S1352-2310(02)00342-4 [27] LEE Y N, WEBER R, MA Y, et al. Airborne measurement of inorganic ionic components of fine aerosol particles using the particle-into-liquid sampler coupled to ion chromatography technique during ACE-Asia and TRACE-P [J]. Journal of Geophysical Research:Atmospheres, 2003, 108(D23): 8646. doi: 10.1029/2002JD003265 [28] MA Y, WEBER R J, LEE Y N, et al. Characteristics and influence of biosmoke on the fine-particle ionic composition measured in Asian outflow during the Transport and Chemical Evolution Over the Pacific (TRACE-P) experiment[J]. Journal of Geophysical Research: Atmospheres, 2003, 108(D21),doi:10.1029/2002JD003128. [29] 海南日报. 2020 年海南省生态环境状况公报[N]. 2021 年/6 月/5 日/第A06 版. Hainan Daily. Ecological and Environmental Status Report of Hainan Province in 2020 [N] . 2021/26/25/A06 edition (in Chinese).
[30] TSENG Y L, WU C H, YUAN C S, et al. Inter-comparison of chemical characteristics and source apportionment of PM2.5 at two harbors in the Philippines and Taiwan [J]. Science of the Total Environment, 2021, 793: 148574. doi: 10.1016/j.scitotenv.2021.148574 [31] HASSAN H, LATIF M T, JUNENG L, et al. Chemical characterization and sources identification of PM2.5 in a tropical urban city during non-hazy conditions [J]. Urban Climate, 2021, 39: 100953. doi: 10.1016/j.uclim.2021.100953 [32] ROVIRA J, ROIG N, NADAL M, et al. Human health risks of formaldehyde indoor levels: An issue of concern [J]. Journal of Environmental Science and Health. Part A, Toxic/Hazardous Substances & Environmental Engineering, 2016, 51(4): 357-363. -


 下载:
下载:

