-
伴随经济的快速发展,环境问题日益突出,大气污染尤为严重 [1]. 大气污染受人类活动影响较大,当大气污染物浓度升高到一定程度,就会破坏生态系统和人类正常生存条件. 近年来,中国许多城市都受到大气污染的困扰,特别是在京津冀地区、长三角地区等经济发达地区[2]. 另外,当空气中大气污染物浓度较高时,人体可能出现呼吸系统疾病,心脑血管疾病、肺癌等[3].
新型冠状病毒肺炎(COVID-19)疫情于2020年春节前夕爆发,并快速在全国范围内传播. 2020年1月23日到1月29日,各省陆续启动公共卫生一级响应,实行全面居家隔离政策有效降低了病毒的传播几率[4]. 虽然疫情防控使经济发展受到一定影响,但大气质量得到改善[5]. 自疫情爆发以来,许多学者对居家隔离政策下的大气状况和空气质量进行了一系列研究,艾文育等[6]发现济南市NO2浓度下降幅度最大,社会活跃指数呈阶梯状下降;余锋等[7]发现关中盆地空气质量整体得到改善,除O3以外的污染物浓度均出现不同程度的下降;潘勇军等[8]发现广州市大气污染物浓度除O3外大幅度下降,O3成首要污染物.
兰州市作为中国西北地区重要的工业重镇和交通枢纽,大气污染源分布较多;再加上地形封闭,大气扩散条件较差,空气质量下降的风险较大[9]. 疫情防控为比较全面地分析研究兰州市大气污染的时空变化规律和成因创造了良好的机会,本文利用2020年、2021年监测站点数据以及卫星数据,从时间上和空间上对兰州市疫情期间大气污染物变化进行分析,并利用Pearson相关系数法分析6种大气污染物之间以及气象因素之间的关系,为今后兰州市大气污染防控工作开展提供科学依据.
-
兰州市地处中国西北地区,是甘肃省省会,下辖城关区、七里河区、西固区、安宁区、红古区的5个区,永登县、榆中县、皋兰县的3个县,总面积1.31 × 10⁴ km2 (见图1). 兰州平均海拔约为1520 m,榆中县南部和永登县西北部的落基山区海拔均超过3000 m. 黄河自西南流向东北,横穿全境,形成峡谷与盆地相间的串珠形河谷. 兰州属温带大陆性气候,年平均气温10.3 ℃,夏无酷暑,冬无严寒. 兰州市常住人口数约436万人,其中城关区常住人口数最多,占34.04%. 从2016年开始兰州市机动车保有量持续稳定增长,截止2021年,机动车保有量为116万多辆,其中私家车约占60%. 兰州市地区总产值逐年增高,第二产业常年占比30%以上,兰州市的工业主要包括石油化工产业、有色冶炼和黑色金属产业、装备制造业、建材产业、烟草和食品产业、生物医药产业等.
-
本研究所使用的空气质量数据,来自中国环境监测总站的全国城市空气质量实时发布平台,监测站点分布如图1 所示,主要监测的污染物有6种,分别是PM2.5 、PM10 、SO2、CO、NO2 和 O3,对其质量浓度进行监测,可以得到每天的空气质量状况. 行政边界矢量数据来自1∶100万全国基础地理数据库. 遥感影像数据来源于European Space Agency的Sentinal-5P卫星,是一颗于2017年10月13日发射的全球大气污染监测卫星,运行在太阳同步轨道,高度824 km,倾角98.742°,重访周期17 d,每日覆盖全球各地,成像分辨率达7 km ×3.5 km,直接利用其L2数据产品,获取2020年、2021年各阶段的气溶胶、NO2、SO2、CO、O3的空间浓度分布情况.
-
根据我国发布的《抗击新冠肺炎疫情的中国行动》,将2020年1—4月兰州市疫情防控时期分为4个阶段:疫情传播前期(第一阶段),1月1日—1月19日;全面抗疫阶段(第二阶段),1月20日—2月20日;社会生产恢复阶段(第三阶段),2月21日—3月17日;防疫稳固阶段(第四阶段),3月18日—4 月18日. 首先,将2020年兰州市PM2.5、PM10、NO2、SO2、CO、O3的质量浓度沿抗疫时间尺度进行分析;其次,对6种大气污染物的空间分布特征进行分析;另外,利用spss对各种污染物进行Pearson相关分析. 最后,对兰州市2021年10月突发疫情防控阶段的大气污染物浓度变化情况进行分析;根据兰州市发布的相关防疫政策,将2020年10月兰州市疫情防控时期分为两个阶段:10月2日—10月25日作为防控前期,10月26日—11月18日作为应急防控期;在10月26日以后,兰州市大量高校封校、中小学停课,部分小区实行封闭管理,人类活动减少,并在11月18日以后逐渐回复正常.
-
2020疫情期间,PM2.5、NO2、SO2、CO质量浓度均呈下降趋势,而PM10、O3呈上升状态(见图2),并且与2018、2019年同时期的变化趋势保持一致. 其中,PM2.5与NO2质量浓度在进入全面抗疫阶段(第二阶段)后,下降幅度最大,PM2.5由61.63 μg·m−3下降到49 μg·m−3,下降了20.49%,而NO2由67.52 μg·m−3下降到49.03 μg·m−3,下降了27.38%. CO、SO2平均浓度随着疫情的发展,一直保持下降趋势,CO、SO2浓度整体从2018年开始逐年递减,2020年二者浓度均比历年低;PM10平均浓度在进入全面抗疫阶段(第二阶段)后,有小幅度下降,仅下降了7.98%,PM10受气候影响较大,兰州市地处西北,多大风沙尘天气,再加上处于采暖期,排放较大,冬季大气扩散条件差,造成PM10浓度保持上升趋势. O3平均浓度随着疫情发展,一直保持上升状态,并且在进入第二阶段后,浓度提升幅度最大,提升了近76.25%(见表1). 另外,2020年疫情防控期间与2018、2019年同期相比,O3浓度变化最大,上升了34.2%,其次是SO2浓度,下降了26.8%;PM10与CO平均浓度变化幅度也较明显,分别下降了15%、17.8%(见表2).
-
气溶胶颗粒包含PM2.5、PM10, 可利用气溶胶光学厚度(AOD)来反映PM2.5、PM10的平均浓度的空间分布特征. 由图3可知,兰州市2020年疫情期间AOD整体偏高,低浓度区域面积较小,高浓度区域面积分布较广,在红古区、西固区、安宁区、城关区、七里河区以及榆中县西侧等人口密集区变化幅度较大。在进入全面抗疫阶段(第二阶段)后,高浓度区域面积明显减小,在防疫稳固阶段(第四阶段)恢复正常. 兰州市地处西北,风沙源物质丰富,春季地面植被覆盖不足,大风沙尘天气偏多[10],另外疫情期间,北方处于采暖期,各种污染物排放增多,加上冬季大气扩散条件差[11],逆温效应多,所以就造成PM2.5、PM10浓度在冬季偏高.
由图4可知,兰州市NO2浓度空间分布呈现中部高, 边缘低, NO2质量浓度高的区域面积并不大, 主要集中在5个主城区人口密集处. 在进入全面抗疫阶段(第二阶段)后, 推行居家隔离政策, 社会正常运转受到干扰, 交通受阻,工厂大规模停工[6],NO2浓度大面积减少。虽然高浓度集中在城关区、安宁区、七里河区北边, 但相较于管控前, NO2浓度明显降低. 随着确诊病例逐渐减少, 工厂陆续开工, 社会生活逐步恢复, 人为排放量逐步回升[6]. 由图5可知,2019年同期阶段, 没有疫情影响, 人为因素并未发生显著变化, 引起NO2浓度变化的主要原因为气象条件[12], 浓度分布特征由主城区人口密集处向周围递减. 2020全面抗疫阶段(第二阶段)与2019年同期对比,NO2浓度受人类活动影响比较大. 由图6可知,CO浓度分布与NO2相似,人类活动所使用的燃料,在不完全燃烧时,均可产生CO[13],CO主要集中在西固区、安宁区、城关区、七里河区等人口密集地区,边缘人烟稀少地区CO浓度较低. 另外,交通污染源也是CO重要来源[10],所以在进入第二阶段后,居民出行减少,CO浓度得到下降,高浓度区域面积明显减小.
兰州市SO2浓度空间分布较均匀,西侧比东侧略高(见图7),在第一阶段(疫情传播前期),兰州市整体SO2浓度偏高,在进入第二阶段(全面抗疫阶段)后,SO2浓度高浓度减少,分布得更均匀,整体平均浓度略有下降. 兰州拥有兰化、兰炼等企业,工业排放问题较突出,历年兰州SO2浓度在1月、12月最高[14],在第二阶段,大量工厂停产,排放的SO2减少,但是SO2浓度并没有大幅度下降,而是从第三阶段开始下降,在第四阶段SO2浓度最低,因为冬季温度低,大气扩散条件差,产生的大量SO2并不能快速的扩散.
臭氧一直是大气污染物里比较特别的存在,短时间内受人为影响不大,大气臭氧总含量随高度、纬度、季节、天气条件变化而变化. 大气臭氧在大气层中进行着循环式流动,低纬地区的平流层(特别是赤道)在太阳紫外线辐射的作用下,形成一个臭氧源区,随着大气环流向高纬地区传输. 另外,研究表明,青藏高原在夏季时被热力作用的南亚高压所控制,进行大量的对流活动,垂直方向上气流速度较大,可以将对流层低空臭氧输送到平流层,随着大气环流向低海拔地区传输[15].
臭氧受辐射影响较大,温度越高,浓度越高,一般在夏季达到峰值[16]. 由图8 可知,兰州市臭氧浓度随着纬度的升高而增加、随着海拔的递增而减少,呈现出“西南低、东北高”的分布特征. 随着疫情的发展,从1月1日—4月18日,温度逐渐上升,臭氧整体平均浓度上升,低浓度区域面积减小,短暂的人类活动并未使臭氧浓度发生较大变化.
-
2021年10月18日,甘肃兰州出现新冠阳性,10名被检者立即转入兰州市肺科医院进行隔离管控;主城区立即启动应急大规模核酸检测;这次疫情事发突然,涉及地区广泛,政府于10月25日发布通告,自10月26日起,在兰州的所有党政机关、人民团体、企事业单位、社会组织等实行居家办公办学模式,广大干部职工和市民非必要坚决不外出,部分中高风险小区实行封闭管理.
自2019年武汉新冠疫情以来,这是兰州实行的第二次大规模居家隔离政策. 对兰州市6种大气污染物浓度进行每日监测,从2021年10月18日起,至2021年11月23日(见图9). 将2021年兰州应急防控时期与2020年同期对比,由统计结果可知,除O3以外,PM2.5、PM10、SO2、NO2、CO整体在2021年均比2020年低(见表3),且变化趋势基本保持一致;其中在11月5日出现的降温并伴随大风的天气,使得大气污染物得到扩散,PM2.5、PM10、SO2、NO2、CO浓度均下降,与2020年同期不一致,并在11月16日前浓度比2020年同期低得多. 在这次应急防控期间,工厂保持“不停工不停产”,使得SO2浓度并未受到较大影响,从2021年10月18日开始,到11月3日,保持稳定趋势,从11月4日开始,保持上升趋势.
-
2021年应急防控时期,人类活动中的汽车尾气排放大幅度减少,对大气污染物中的NO2、CO影响最大,利用卫星数据对2021年10月兰州市应急防控时期NO2、CO浓度作空间分布图(见图10). 由结果可知,CO、NO2浓度大幅度下降,NO2高浓度区域面积减少最多,除城关区、安宁区,其余主城区NO2浓度明显减少,NO2高浓度范围由城关区、安宁区等人口密集地区向四周边缘地区缩减;CO分布面积未明显减小,但是整体浓度明显降低,在实行居家办公办学后,人口密集的主城区CO浓度明显减少,由于工厂并未停工,西固区等核心工业区的CO仍大量存在.
-
各种大气污染物之间存在一定的联系,并且它们与气象因素之间也存在一定联系,对它们之间进行相关性分析尤为重要. 利用SPSS对兰州市6种大气污染物在2020年四个阶段的浓度数据以及对应阶段的气象因素进行Pearson相关分析,分析结果见表4、表5. 通常把Pearson相关系数中0—0.2分为无相关,0.2—0.4分为弱相关,0.4—0.6分为相关,0.6—0.8分为强相关,0.8—1.0分为极相关[17].
由分析结果可知,PM2.5与PM10、CO、NO2、SO2均呈正相关,与O3呈负相关;其中PM2.5与CO、NO2、SO2均呈强相关,相关系数分别为0.781、0.672、0.639,说明PM2.5、CO、NO2、SO2具有同源性,PM2.5浓度与CO、NO2、SO2浓度变化具有协同性,另外SO2、NO2是气溶胶的重要前体物,所以NO2、SO2也可反映PM2.5的来源[18]. CO与NO2、SO2表现出极强的正相关,相关系数为0.864、0.829,证明CO与NO2、SO2有着极强的协同性;CO与NO2主要集中在人口密集的主城区,人类汽车尾气排放可生成大量的CO、NO2;另外,SO2与NO2也呈正相关,相关系数为0.757,SO2主要来自化石燃料燃烧,所以工厂排放等人类活动影响二者浓度变化. O3与PM2.5、PM10、NO2、SO2、CO均呈负相关,O3受太阳辐射影响较大,当大气中颗粒物含量上升,紫外线辐射减少,不利于O3的生成,O3浓度随之下降[19]. 气象因素对大气环境也会造成影响,由表5可知,平均温度与PM2.5、PM10、NO2、SO2、CO、O3均呈现相关性;其中O3与温度呈现强相关性,相关系数为0.703,温度升高有利于加强对流层光化学反应,促进O3的生成[20];另外,平均温度与PM2.5、PM10、NO2、SO2、CO均呈负相关,温度升高,大气热力条件加强,加速大气运动,使得大气扩散条件增强,有利于扩散大气污染物,降低区域内污染物浓度[21]. 湿度与PM2.5、PM10、NO2、SO2、CO、O3均呈负相关,其中湿度与O3表现极强的负相关,相关系数为0.671,当空气中湿度增加,水蒸气饱和度较高,空气中水汽所含的自由基H、OH等能够迅速将O3分解为O2,从而降低O3浓度[22],同时影响PM2.5、PM10、NO2、SO2、CO等污染物的生成. 风速与PM2.5、PM10、NO2、SO2、CO均呈负相关,仅与O3呈正相关;风速对污染物的传输具有重要影响,可以反映污染物的清除效率[23],在风速较高时,大气污染颗粒物得以扩散,PM2.5、PM10、NO2、SO2、CO浓度降低,另外风速高,有利于光化学反应的进行,O3得以生成,浓度提高,但是当风速过高时,不利于O3前体物的堆积,O3的浓度反而降低. 而且,由表5可知,气压对于兰州市的6种污染物的影响较小.
-
疫情期作为一个特殊的“减排期”,对区域的大气污染产生了明显的改善效果. 本文基于监测站点数据和卫星遥感数据,运用了数学统计和空间分析等方法对兰州市疫情期间的大气污染物浓度变化进行了分析,得出如下结论:
(1)2020年新冠疫情爆发期间,兰州市PM2.5、NO2浓度在进入第二阶段下降幅度最大,SO2含量较2018、2019年减少最多. 同时O3浓度呈阶梯式上升,成为疫情期间首要污染物;PM10浓度在进入第二阶段有小幅度下降,后又呈上升状态.
(2)2020年疫情期间不同污染物的空间分布变化也存在差异. PM2.5与PM10始终呈“西北高东南低”;NO2与CO浓度主要集中在主城区人口密集处,与2018、2019年NO2、CO同期比较,平均浓度分别下降了5.95%和17.8%,高浓度区域面积随着汽车使用量减少而明显减少,二者受人类活动影响较大. SO2高浓度区域面积随着大量工厂停工而减少;O3浓度一直随着纬度的升高而增加,随海拔的升高而减小,受人类影响较小.
(3)CO与NO2、SO2相关性极强,表明兰州市大气污染物中CO、SO2、NO2的来源相似,与工厂排污、汽车尾气排放密切联系. PM2.5与CO也要较强相关性,说明兰州市大气污染中PM2.5与CO的贡献具有协同性. 气象因素中,温度、湿度、风速对大气污染影响较大,与PM2.5、PM10、NO2、CO、SO2均呈负相关;温度、风速与O3呈正相关,湿度与O3呈负相关.
(4)2021年10月实行的居家政策,使人类活动减少,NO2、CO大幅度减少,分布范围缩小,也导致PM2.5浓度大幅度下降;另外,由于一些主要的大型工业企业并未停工,SO2浓度与PM10、O3一致,并未明显下降.
COVID-19疫情期间兰州市大气污染时空变化分析
Spatial-temporal changes of air pollution in Lanzhou during the outbreak of COVID-19
-
摘要: 2020年新冠病毒席卷全球,我国政府采取一系列政策和措施进行防控,减少了污染排放,这个特殊时期为研究人类活动对大气污染的影响提供了良好机会. 本文结合了监测站点数据、卫星遥感数据以及气象资料等,从时间和空间上对兰州市疫情期间大气污染物浓度变化进行分析,并利用Pearson相关系数法分析了6种大气污染物(PM2.5、PM10、SO2、NO2、CO、O3)之间以及与气象因素(温度、湿度、风速、气压)之间的相关性,同时分析了2021年10月兰州突发疫情下,大气污染物浓度变化,并与2020年作对比. 结果表明:(1)2020年疫情防控期间NO2、CO、PM2.5、SO2等的浓度下降明显,其中PM2.5在进入全面抗疫阶段后,下降幅度最大,达到20.5%,NO2、CO次之,大多是在主城区人口密集地区;(2)SO2浓度与历年同期相比,下降幅度最大,达到26.8%,受工业影响较大;(3)CO、NO2、SO2三者具有强相关性,变化趋势保持一致;NO2、SO2浓度变化影响着PM2.5浓度;O3与5种大气污染物均呈负相关,其他5种大气污染物浓度升高时,太阳辐射减少,抑制O3的生成,O3浓度随之下降;(4)气象因素也影响着大气污染物浓度;温度与PM2.5、PM10、SO2、NO2、CO均呈负相关,与O3呈强正相关;湿度与6种大气污染物均呈负相关;风速与PM2.5、PM10、SO2、NO2、CO均呈负相关,与O3呈正相关,但是当风速过高时,也会使O3浓度下降. (5)2021年10月突发疫情防控期间,NO2、CO大幅度下降,PM2.5也受影响,PM10与O3并未有太大变化,而由于工厂并未停工,SO2浓度并未受太大影响.
-
关键词:
- 兰州市 /
- 大气污染物 /
- 时空变化 /
- COVID-19 /
- Pearson相关系数
Abstract: In 2020, the Corona Virus Disease 2019(COVID-19) swept the world. The Chinese government has adopted a series of policies and measures for pandemic prevention and control, which further reduced the discharge of air pollutants. This special period provides a good opportunity for studying the impact of human activities on air pollution. Based on the in situ Data, satellite remote sensing data and meteorological data, this paper analyzed the change of air pollutant concentration in Lanzhou during this period from the perspective of time and space. The Pearson correlation coefficient method was used to analyze the correlations among 6 kinds of air pollutants and the correlation between these pollutants and the meteorological factors. In addition, the variation of air pollutant concentration during the outbreak of COVID-19 in Lanzhou in October 2021 was analyzed and compared with the situation in 2020. The results show that :(1) in 2020, the concentration of NO2, CO, PM2.5 and SO2 decreased significantly. Especially for the concentration of PM2.5, it dropped by 20.5%, which was followed by the decrease of NO2 and CO concentration that mostly distributed in urban areas with dense population. (2) Compared with the situation of the same period in previous years, the concentration of SO2 decreased by 26.8%, which was greatly affected by industry. (3) CO, NO2 and SO2 presents strongly correlation with each other, and their variation trends are consistent. The change of NO2 and SO2 concentration affects the concentration of PM2.5. In addition, O3 is negatively correlated with the other 5 kinds of air pollutants. When the concentration of the other 5 pollutants increases, the solar radiation decreases, which restrains the concentration of O3. (4) The meteorological factors also affect the concentration of these air pollutants. Temperature is negatively correlated with the concentration of PM2.5, PM10, SO2, NO2 and CO, and presents strongly positively correlation with the concentration of O3. Humidity is negatively correlated with all these air pollutants. Wind speed is negatively correlated with the concentration of PM2.5, PM10, SO2, NO2 and CO, and positively correlated with O3 concentration. However, when wind speed is too high, the concentration of O3 also decreases. (5) During the outbreak of COVID-19 in October 2021, the concentration of NO2 and CO decreased significantly, and the PM2.5 concentration was also affected. However, the concentration of PM10 and O3 presented little change. SO2 concentration was not affected significantly, since factories were still working. -
伴随经济的快速发展,环境问题日益突出,大气污染尤为严重 [1]. 大气污染受人类活动影响较大,当大气污染物浓度升高到一定程度,就会破坏生态系统和人类正常生存条件. 近年来,中国许多城市都受到大气污染的困扰,特别是在京津冀地区、长三角地区等经济发达地区[2]. 另外,当空气中大气污染物浓度较高时,人体可能出现呼吸系统疾病,心脑血管疾病、肺癌等[3].
新型冠状病毒肺炎(COVID-19)疫情于2020年春节前夕爆发,并快速在全国范围内传播. 2020年1月23日到1月29日,各省陆续启动公共卫生一级响应,实行全面居家隔离政策有效降低了病毒的传播几率[4]. 虽然疫情防控使经济发展受到一定影响,但大气质量得到改善[5]. 自疫情爆发以来,许多学者对居家隔离政策下的大气状况和空气质量进行了一系列研究,艾文育等[6]发现济南市NO2浓度下降幅度最大,社会活跃指数呈阶梯状下降;余锋等[7]发现关中盆地空气质量整体得到改善,除O3以外的污染物浓度均出现不同程度的下降;潘勇军等[8]发现广州市大气污染物浓度除O3外大幅度下降,O3成首要污染物.
兰州市作为中国西北地区重要的工业重镇和交通枢纽,大气污染源分布较多;再加上地形封闭,大气扩散条件较差,空气质量下降的风险较大[9]. 疫情防控为比较全面地分析研究兰州市大气污染的时空变化规律和成因创造了良好的机会,本文利用2020年、2021年监测站点数据以及卫星数据,从时间上和空间上对兰州市疫情期间大气污染物变化进行分析,并利用Pearson相关系数法分析6种大气污染物之间以及气象因素之间的关系,为今后兰州市大气污染防控工作开展提供科学依据.
1. 材料与方法(Data and methodology)
1.1 研究区概况
兰州市地处中国西北地区,是甘肃省省会,下辖城关区、七里河区、西固区、安宁区、红古区的5个区,永登县、榆中县、皋兰县的3个县,总面积1.31 × 10⁴ km2 (见图1). 兰州平均海拔约为1520 m,榆中县南部和永登县西北部的落基山区海拔均超过3000 m. 黄河自西南流向东北,横穿全境,形成峡谷与盆地相间的串珠形河谷. 兰州属温带大陆性气候,年平均气温10.3 ℃,夏无酷暑,冬无严寒. 兰州市常住人口数约436万人,其中城关区常住人口数最多,占34.04%. 从2016年开始兰州市机动车保有量持续稳定增长,截止2021年,机动车保有量为116万多辆,其中私家车约占60%. 兰州市地区总产值逐年增高,第二产业常年占比30%以上,兰州市的工业主要包括石油化工产业、有色冶炼和黑色金属产业、装备制造业、建材产业、烟草和食品产业、生物医药产业等.
1.2 数据来源
本研究所使用的空气质量数据,来自中国环境监测总站的全国城市空气质量实时发布平台,监测站点分布如图1 所示,主要监测的污染物有6种,分别是PM2.5 、PM10 、SO2、CO、NO2 和 O3,对其质量浓度进行监测,可以得到每天的空气质量状况. 行政边界矢量数据来自1∶100万全国基础地理数据库. 遥感影像数据来源于European Space Agency的Sentinal-5P卫星,是一颗于2017年10月13日发射的全球大气污染监测卫星,运行在太阳同步轨道,高度824 km,倾角98.742°,重访周期17 d,每日覆盖全球各地,成像分辨率达7 km ×3.5 km,直接利用其L2数据产品,获取2020年、2021年各阶段的气溶胶、NO2、SO2、CO、O3的空间浓度分布情况.
1.3 研究方法
根据我国发布的《抗击新冠肺炎疫情的中国行动》,将2020年1—4月兰州市疫情防控时期分为4个阶段:疫情传播前期(第一阶段),1月1日—1月19日;全面抗疫阶段(第二阶段),1月20日—2月20日;社会生产恢复阶段(第三阶段),2月21日—3月17日;防疫稳固阶段(第四阶段),3月18日—4 月18日. 首先,将2020年兰州市PM2.5、PM10、NO2、SO2、CO、O3的质量浓度沿抗疫时间尺度进行分析;其次,对6种大气污染物的空间分布特征进行分析;另外,利用spss对各种污染物进行Pearson相关分析. 最后,对兰州市2021年10月突发疫情防控阶段的大气污染物浓度变化情况进行分析;根据兰州市发布的相关防疫政策,将2020年10月兰州市疫情防控时期分为两个阶段:10月2日—10月25日作为防控前期,10月26日—11月18日作为应急防控期;在10月26日以后,兰州市大量高校封校、中小学停课,部分小区实行封闭管理,人类活动减少,并在11月18日以后逐渐回复正常.
2. 结果与讨论(Results and discussion)
2.1 疫情期间大气污染物浓度时空分布
2.1.1 2020年疫情期间大气污染物时间变化
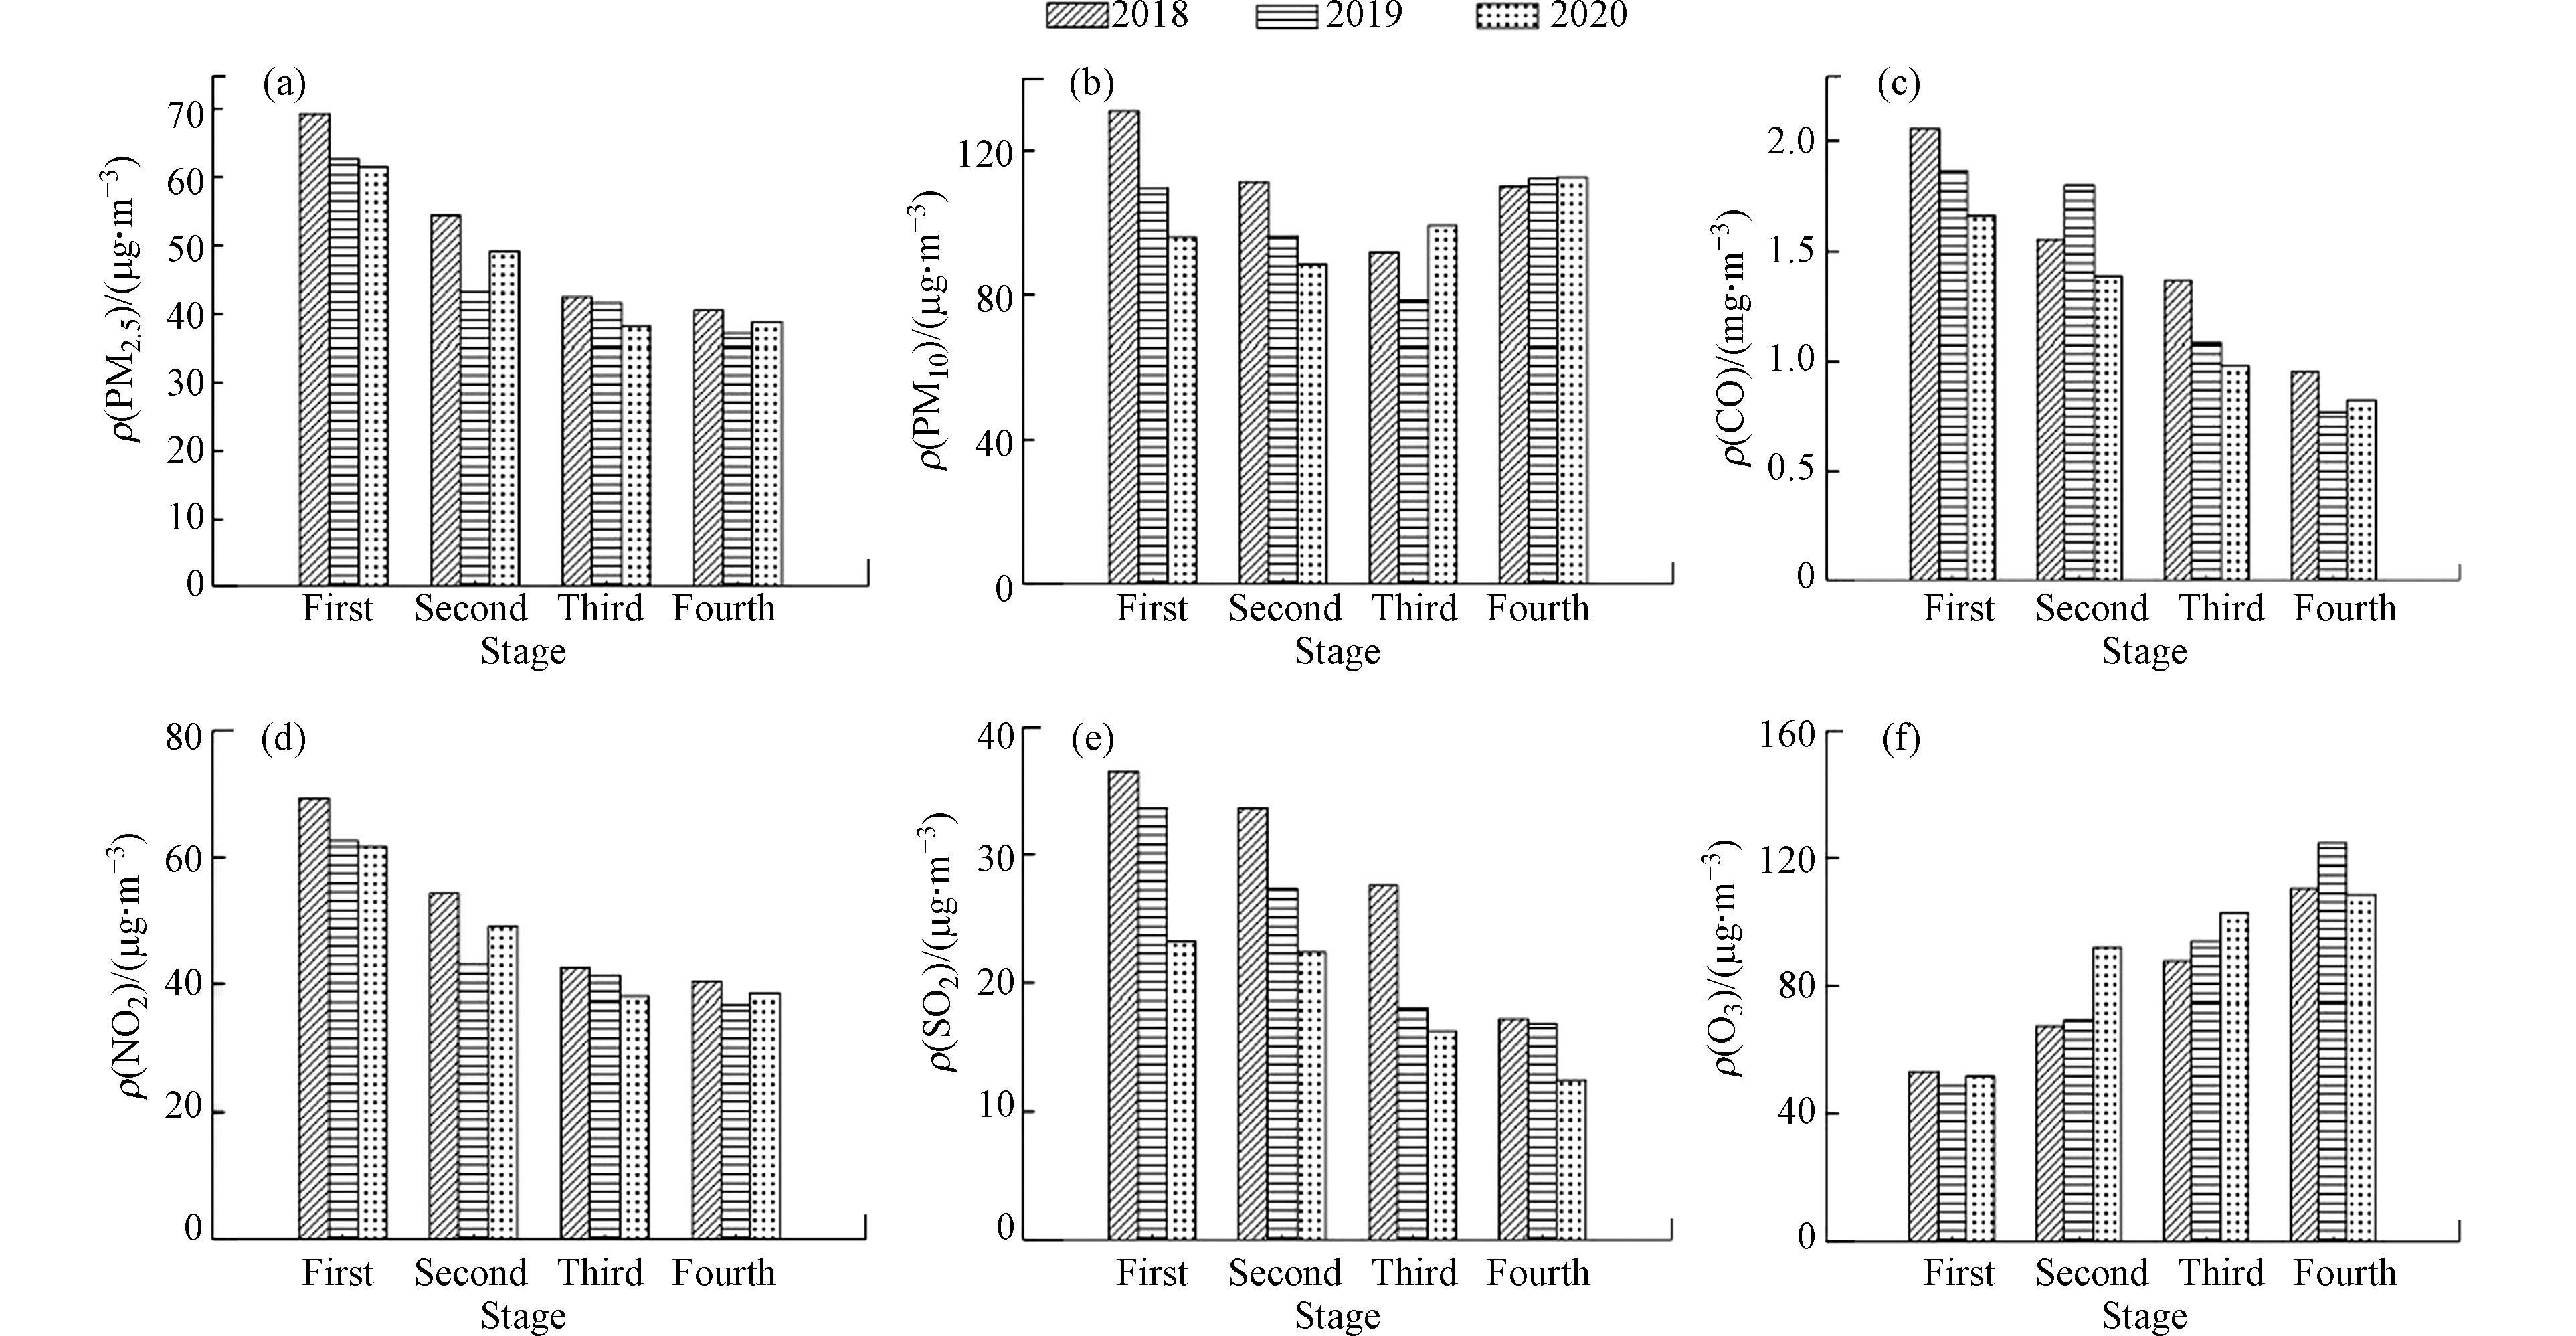
2020疫情期间,PM2.5、NO2、SO2、CO质量浓度均呈下降趋势,而PM10、O3呈上升状态(见图2),并且与2018、2019年同时期的变化趋势保持一致. 其中,PM2.5与NO2质量浓度在进入全面抗疫阶段(第二阶段)后,下降幅度最大,PM2.5由61.63 μg·m−3下降到49 μg·m−3,下降了20.49%,而NO2由67.52 μg·m−3下降到49.03 μg·m−3,下降了27.38%. CO、SO2平均浓度随着疫情的发展,一直保持下降趋势,CO、SO2浓度整体从2018年开始逐年递减,2020年二者浓度均比历年低;PM10平均浓度在进入全面抗疫阶段(第二阶段)后,有小幅度下降,仅下降了7.98%,PM10受气候影响较大,兰州市地处西北,多大风沙尘天气,再加上处于采暖期,排放较大,冬季大气扩散条件差,造成PM10浓度保持上升趋势. O3平均浓度随着疫情发展,一直保持上升状态,并且在进入第二阶段后,浓度提升幅度最大,提升了近76.25%(见表1). 另外,2020年疫情防控期间与2018、2019年同期相比,O3浓度变化最大,上升了34.2%,其次是SO2浓度,下降了26.8%;PM10与CO平均浓度变化幅度也较明显,分别下降了15%、17.8%(见表2).
表 1 2020年疫情防控时期污染物浓度变化情况Table 1. Change of pollutant concentration in four stages in 2020污染物Pollutants 第一至第二阶段Phase one to phase two 第二至第三阶段Phase two to phase three 第三至第四阶段Phase three to phase four PM2.5 −20.49% −22.14% +1.15% PM10 −7.98% +12.68 +13.04 NO2 −27.38% −2.81% −8.33% SO2 −3.95% −26.85% −23.15% CO −16.86% −28.98% −17.34% O3 +76.21% +11.61% +5.47% 注:计算公式为(后阶段-前阶段)/ 前阶段,即变化率. (阶段划分依据见研究方法). Note: The calculation formula is (latter stage - former stage)/former stage, that is, the rate of change. 表 2 2020年第二阶段(全面抗疫阶段)与2018、2019年同期污染物平均浓度比较Table 2. Comparison of the average pollutant concentration in the second phase (comprehensive containment phase) of 2020 with the same period in 2018 and 2019污染物Pollutants 第二阶段The second stage 2018、2019年同期The same period in 2018 and 2019 与2018、2019年同期比较Comparison with the same period in 2018 and 2019 PM2.5/(μg·m−3) 49 48.71 0.595% PM10/(μg·m−3) 88.1 103.75 −15.08% NO2/(μg·m−3) 49.03 52.13 −5.95% SO2/(μg·m−3) 22.34 30.52 −26.8% CO/(mg·m−3) 1.38 1.68 −17.8% O3/(μg·m−3) 92 68.55 34.2% 2.1.2 2020年疫情期间大气污染物空间分布
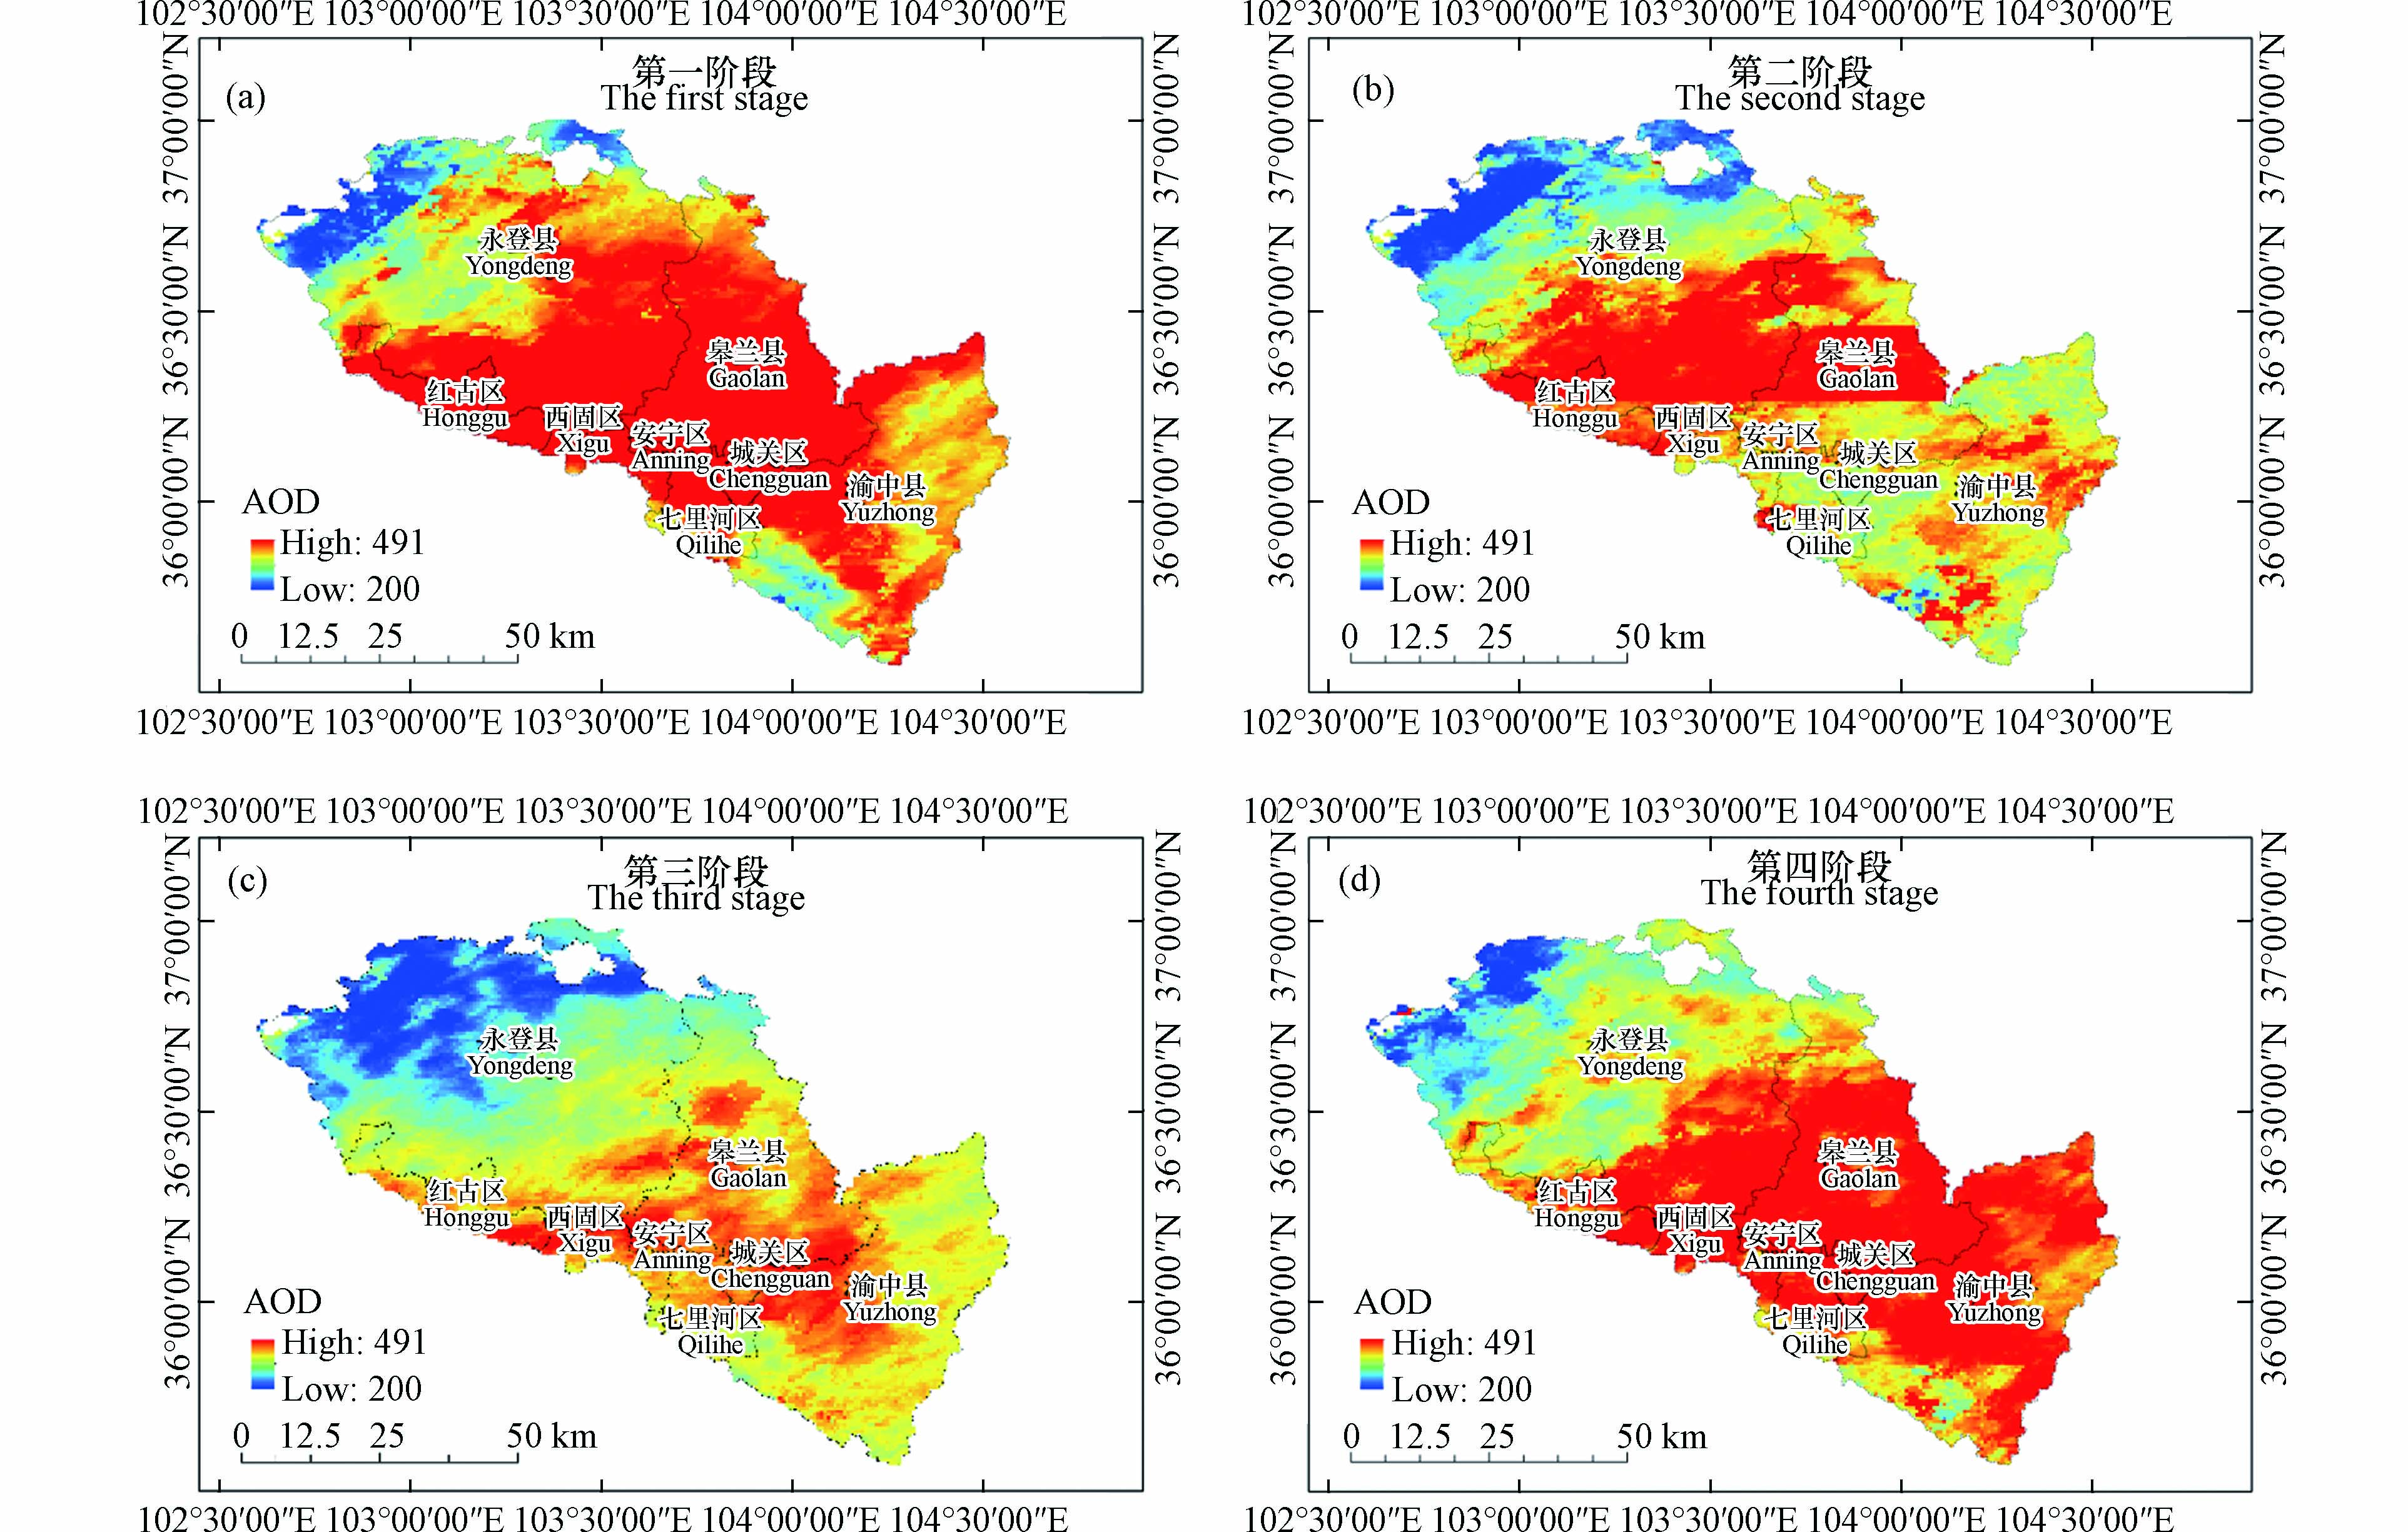
气溶胶颗粒包含PM2.5、PM10, 可利用气溶胶光学厚度(AOD)来反映PM2.5、PM10的平均浓度的空间分布特征. 由图3可知,兰州市2020年疫情期间AOD整体偏高,低浓度区域面积较小,高浓度区域面积分布较广,在红古区、西固区、安宁区、城关区、七里河区以及榆中县西侧等人口密集区变化幅度较大。在进入全面抗疫阶段(第二阶段)后,高浓度区域面积明显减小,在防疫稳固阶段(第四阶段)恢复正常. 兰州市地处西北,风沙源物质丰富,春季地面植被覆盖不足,大风沙尘天气偏多[10],另外疫情期间,北方处于采暖期,各种污染物排放增多,加上冬季大气扩散条件差[11],逆温效应多,所以就造成PM2.5、PM10浓度在冬季偏高.
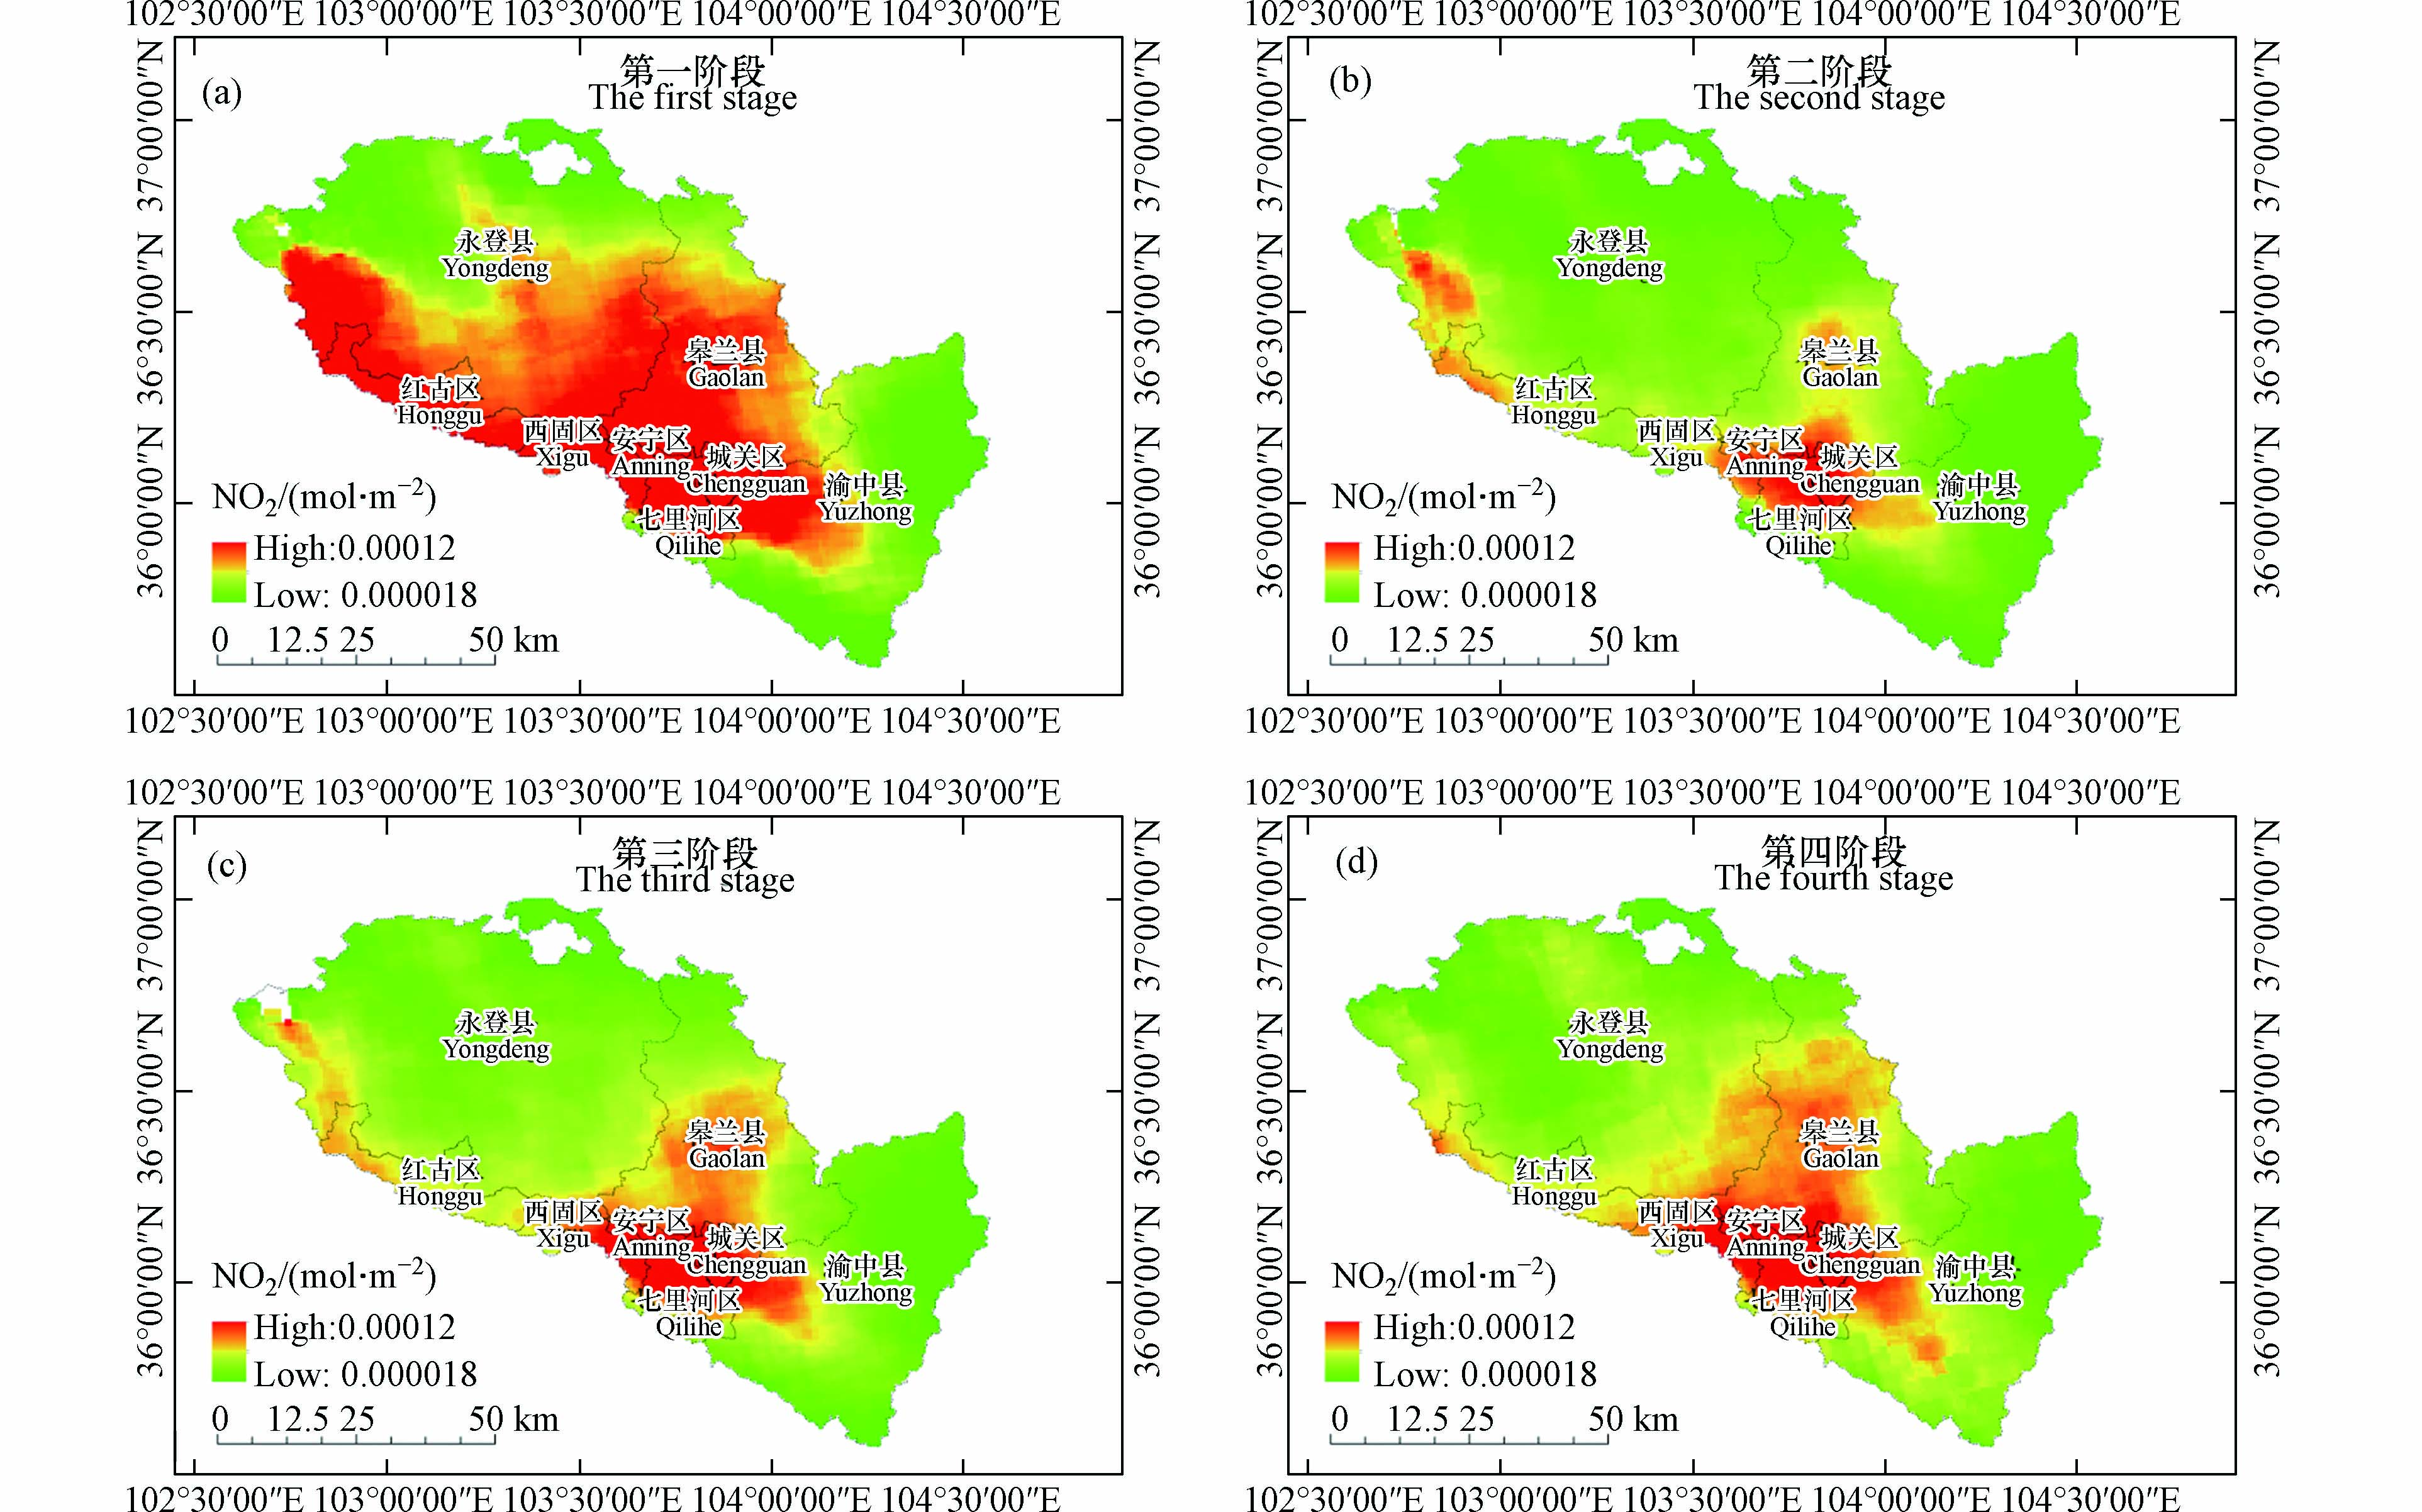
由图4可知,兰州市NO2浓度空间分布呈现中部高, 边缘低, NO2质量浓度高的区域面积并不大, 主要集中在5个主城区人口密集处. 在进入全面抗疫阶段(第二阶段)后, 推行居家隔离政策, 社会正常运转受到干扰, 交通受阻,工厂大规模停工[6],NO2浓度大面积减少。虽然高浓度集中在城关区、安宁区、七里河区北边, 但相较于管控前, NO2浓度明显降低. 随着确诊病例逐渐减少, 工厂陆续开工, 社会生活逐步恢复, 人为排放量逐步回升[6]. 由图5可知,2019年同期阶段, 没有疫情影响, 人为因素并未发生显著变化, 引起NO2浓度变化的主要原因为气象条件[12], 浓度分布特征由主城区人口密集处向周围递减. 2020全面抗疫阶段(第二阶段)与2019年同期对比,NO2浓度受人类活动影响比较大. 由图6可知,CO浓度分布与NO2相似,人类活动所使用的燃料,在不完全燃烧时,均可产生CO[13],CO主要集中在西固区、安宁区、城关区、七里河区等人口密集地区,边缘人烟稀少地区CO浓度较低. 另外,交通污染源也是CO重要来源[10],所以在进入第二阶段后,居民出行减少,CO浓度得到下降,高浓度区域面积明显减小.
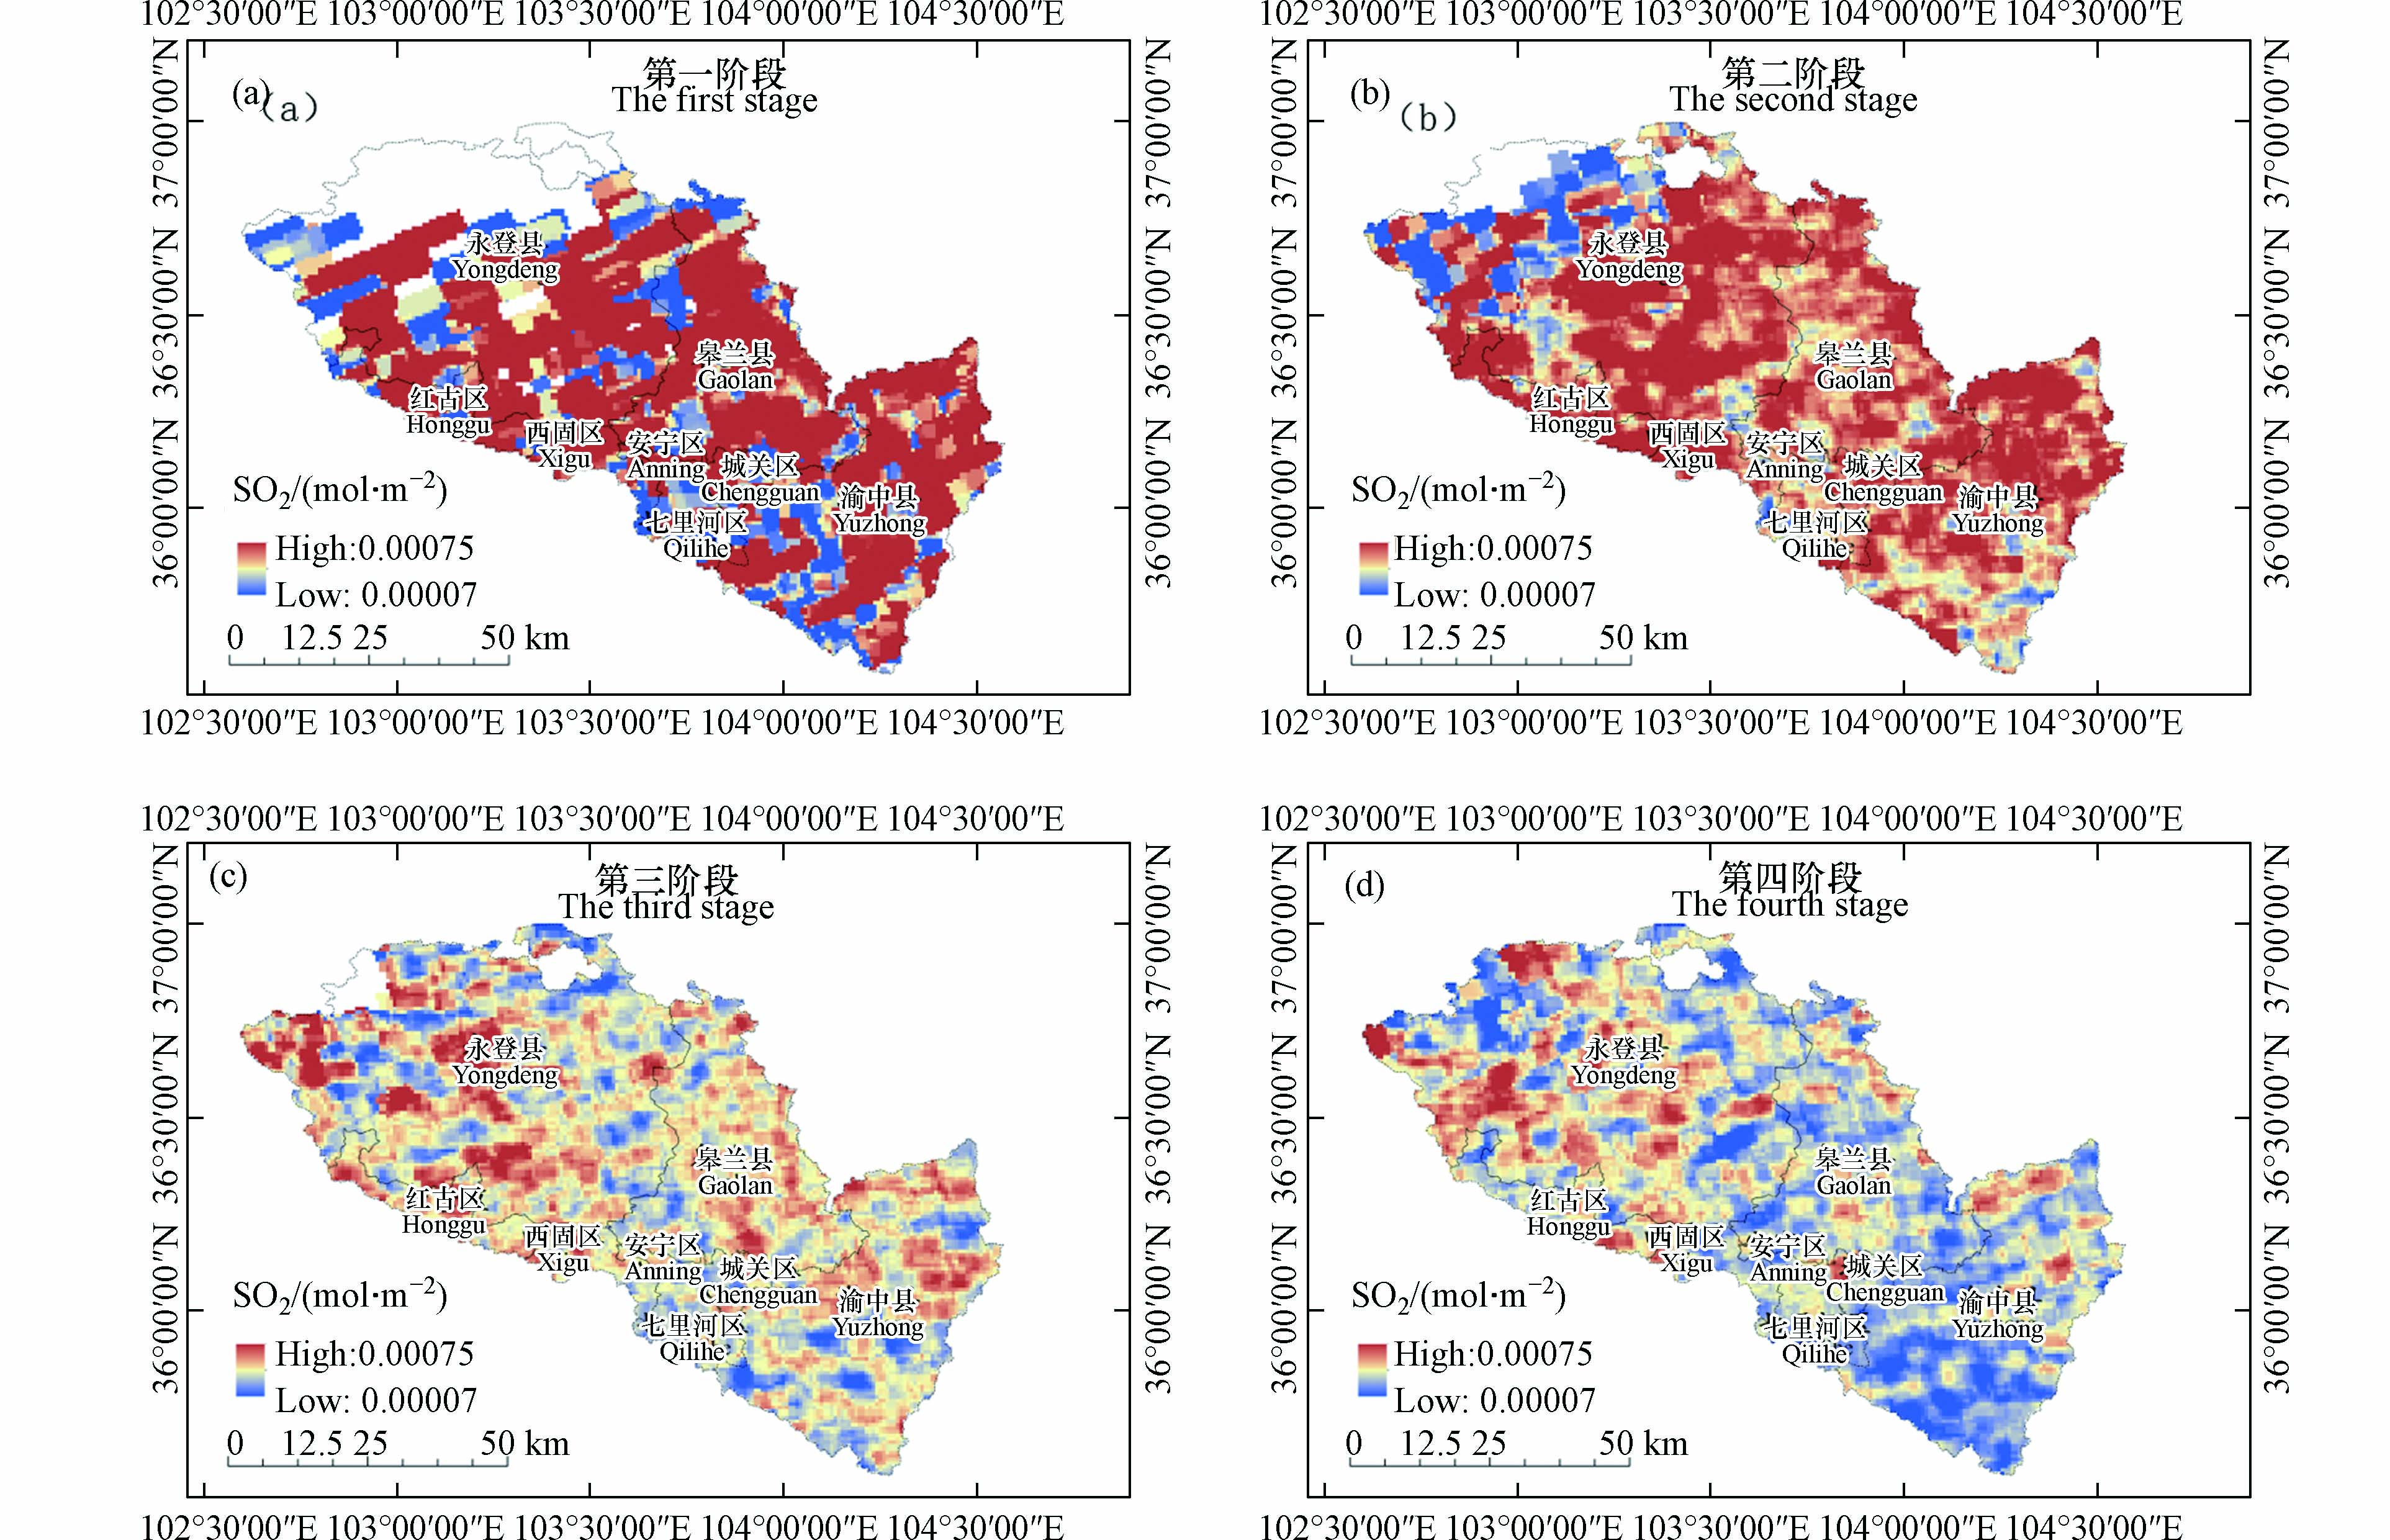
兰州市SO2浓度空间分布较均匀,西侧比东侧略高(见图7),在第一阶段(疫情传播前期),兰州市整体SO2浓度偏高,在进入第二阶段(全面抗疫阶段)后,SO2浓度高浓度减少,分布得更均匀,整体平均浓度略有下降. 兰州拥有兰化、兰炼等企业,工业排放问题较突出,历年兰州SO2浓度在1月、12月最高[14],在第二阶段,大量工厂停产,排放的SO2减少,但是SO2浓度并没有大幅度下降,而是从第三阶段开始下降,在第四阶段SO2浓度最低,因为冬季温度低,大气扩散条件差,产生的大量SO2并不能快速的扩散.
臭氧一直是大气污染物里比较特别的存在,短时间内受人为影响不大,大气臭氧总含量随高度、纬度、季节、天气条件变化而变化. 大气臭氧在大气层中进行着循环式流动,低纬地区的平流层(特别是赤道)在太阳紫外线辐射的作用下,形成一个臭氧源区,随着大气环流向高纬地区传输. 另外,研究表明,青藏高原在夏季时被热力作用的南亚高压所控制,进行大量的对流活动,垂直方向上气流速度较大,可以将对流层低空臭氧输送到平流层,随着大气环流向低海拔地区传输[15].
臭氧受辐射影响较大,温度越高,浓度越高,一般在夏季达到峰值[16]. 由图8 可知,兰州市臭氧浓度随着纬度的升高而增加、随着海拔的递增而减少,呈现出“西南低、东北高”的分布特征. 随着疫情的发展,从1月1日—4月18日,温度逐渐上升,臭氧整体平均浓度上升,低浓度区域面积减小,短暂的人类活动并未使臭氧浓度发生较大变化.
2.1.3 2021年疫情期间大气污染物时间变化
2021年10月18日,甘肃兰州出现新冠阳性,10名被检者立即转入兰州市肺科医院进行隔离管控;主城区立即启动应急大规模核酸检测;这次疫情事发突然,涉及地区广泛,政府于10月25日发布通告,自10月26日起,在兰州的所有党政机关、人民团体、企事业单位、社会组织等实行居家办公办学模式,广大干部职工和市民非必要坚决不外出,部分中高风险小区实行封闭管理.
自2019年武汉新冠疫情以来,这是兰州实行的第二次大规模居家隔离政策. 对兰州市6种大气污染物浓度进行每日监测,从2021年10月18日起,至2021年11月23日(见图9). 将2021年兰州应急防控时期与2020年同期对比,由统计结果可知,除O3以外,PM2.5、PM10、SO2、NO2、CO整体在2021年均比2020年低(见表3),且变化趋势基本保持一致;其中在11月5日出现的降温并伴随大风的天气,使得大气污染物得到扩散,PM2.5、PM10、SO2、NO2、CO浓度均下降,与2020年同期不一致,并在11月16日前浓度比2020年同期低得多. 在这次应急防控期间,工厂保持“不停工不停产”,使得SO2浓度并未受到较大影响,从2021年10月18日开始,到11月3日,保持稳定趋势,从11月4日开始,保持上升趋势.
表 3 2021年应急防控期与2020年同期污染物平均浓度比较Table 3. Comparison of the average pollutant concentration between the emergency prevention and control period in 2021 and the same period in 2020污染物Pollutants 2021年应急防控期2021 epidemic control phase 2020年同期The same period in 2020 与2020年同期比较Comparison with the same period in 2020 PM2.5/(μg·m−3) 36 43.3 −16.86% PM10/(μg·m−3) 71.38 106.25 −32.82% NO2/(μg·m−3) 44.04 61.92 −28.88% SO2/(μg·m−3) 12.29 18 −31.72% CO/(mg·m−3) 0.76 1.14 −33.33% O3/(μg·m−3) 75.5 68 11.02% 2.1.4 2021年疫情期间大气污染物空间分布
2021年应急防控时期,人类活动中的汽车尾气排放大幅度减少,对大气污染物中的NO2、CO影响最大,利用卫星数据对2021年10月兰州市应急防控时期NO2、CO浓度作空间分布图(见图10). 由结果可知,CO、NO2浓度大幅度下降,NO2高浓度区域面积减少最多,除城关区、安宁区,其余主城区NO2浓度明显减少,NO2高浓度范围由城关区、安宁区等人口密集地区向四周边缘地区缩减;CO分布面积未明显减小,但是整体浓度明显降低,在实行居家办公办学后,人口密集的主城区CO浓度明显减少,由于工厂并未停工,西固区等核心工业区的CO仍大量存在.
2.2 污染物间及与气象因素相关性分析
各种大气污染物之间存在一定的联系,并且它们与气象因素之间也存在一定联系,对它们之间进行相关性分析尤为重要. 利用SPSS对兰州市6种大气污染物在2020年四个阶段的浓度数据以及对应阶段的气象因素进行Pearson相关分析,分析结果见表4、表5. 通常把Pearson相关系数中0—0.2分为无相关,0.2—0.4分为弱相关,0.4—0.6分为相关,0.6—0.8分为强相关,0.8—1.0分为极相关[17].
表 4 6种大气污染物相关性分析Table 4. Correlation analysis of 6 kinds of air pollutants污染物Pollutants PM2.5 PM10 CO NO2 SO2 O3 PM2.5 1 0.402** 0.781** 0.672** 0.639** −0.512** PM10 1 −0.04 0.085 0.01 0.047 CO 1 0.864** 0.829** −0.481** NO2 1 0.757** −0.307** SO2 1 −0.265** O3 1 **在 0.01 级别(双尾),相关性显著;n=109. ** At level 0.01(double tail), the correlation was significant. n=109 表 5 6种大气污染物与气象因素之间相关性分析Table 5. Correlation analysis between 6 kinds of air pollutants and meteorological factors气象因素Meteorological factors PM2.5 PM10 NO2 SO2 CO O3 平均温度 −0.368** −0.275** −0.398** −0.314** −0.412** 0.703** 湿度 −0.384** −0.228* −0.133** −0.231** −0.264** −0.671** 风速 −0.176** −0.245* −0.298** −0.310** −0.326** 0.317** 气压 −0.089 −0.102 −0.212* −0.149 −0.094 −0.132 *在 0.05 级别(双尾),相关性显著;**在 0.01 级别(双尾),相关性显著;n=109. *At level 0.05(double tail), the correlation was significant. ** At level 0.01(double tail), the correlation was significant. n=109. 由分析结果可知,PM2.5与PM10、CO、NO2、SO2均呈正相关,与O3呈负相关;其中PM2.5与CO、NO2、SO2均呈强相关,相关系数分别为0.781、0.672、0.639,说明PM2.5、CO、NO2、SO2具有同源性,PM2.5浓度与CO、NO2、SO2浓度变化具有协同性,另外SO2、NO2是气溶胶的重要前体物,所以NO2、SO2也可反映PM2.5的来源[18]. CO与NO2、SO2表现出极强的正相关,相关系数为0.864、0.829,证明CO与NO2、SO2有着极强的协同性;CO与NO2主要集中在人口密集的主城区,人类汽车尾气排放可生成大量的CO、NO2;另外,SO2与NO2也呈正相关,相关系数为0.757,SO2主要来自化石燃料燃烧,所以工厂排放等人类活动影响二者浓度变化. O3与PM2.5、PM10、NO2、SO2、CO均呈负相关,O3受太阳辐射影响较大,当大气中颗粒物含量上升,紫外线辐射减少,不利于O3的生成,O3浓度随之下降[19]. 气象因素对大气环境也会造成影响,由表5可知,平均温度与PM2.5、PM10、NO2、SO2、CO、O3均呈现相关性;其中O3与温度呈现强相关性,相关系数为0.703,温度升高有利于加强对流层光化学反应,促进O3的生成[20];另外,平均温度与PM2.5、PM10、NO2、SO2、CO均呈负相关,温度升高,大气热力条件加强,加速大气运动,使得大气扩散条件增强,有利于扩散大气污染物,降低区域内污染物浓度[21]. 湿度与PM2.5、PM10、NO2、SO2、CO、O3均呈负相关,其中湿度与O3表现极强的负相关,相关系数为0.671,当空气中湿度增加,水蒸气饱和度较高,空气中水汽所含的自由基H、OH等能够迅速将O3分解为O2,从而降低O3浓度[22],同时影响PM2.5、PM10、NO2、SO2、CO等污染物的生成. 风速与PM2.5、PM10、NO2、SO2、CO均呈负相关,仅与O3呈正相关;风速对污染物的传输具有重要影响,可以反映污染物的清除效率[23],在风速较高时,大气污染颗粒物得以扩散,PM2.5、PM10、NO2、SO2、CO浓度降低,另外风速高,有利于光化学反应的进行,O3得以生成,浓度提高,但是当风速过高时,不利于O3前体物的堆积,O3的浓度反而降低. 而且,由表5可知,气压对于兰州市的6种污染物的影响较小.
3. 结论(Conclusion)
疫情期作为一个特殊的“减排期”,对区域的大气污染产生了明显的改善效果. 本文基于监测站点数据和卫星遥感数据,运用了数学统计和空间分析等方法对兰州市疫情期间的大气污染物浓度变化进行了分析,得出如下结论:
(1)2020年新冠疫情爆发期间,兰州市PM2.5、NO2浓度在进入第二阶段下降幅度最大,SO2含量较2018、2019年减少最多. 同时O3浓度呈阶梯式上升,成为疫情期间首要污染物;PM10浓度在进入第二阶段有小幅度下降,后又呈上升状态.
(2)2020年疫情期间不同污染物的空间分布变化也存在差异. PM2.5与PM10始终呈“西北高东南低”;NO2与CO浓度主要集中在主城区人口密集处,与2018、2019年NO2、CO同期比较,平均浓度分别下降了5.95%和17.8%,高浓度区域面积随着汽车使用量减少而明显减少,二者受人类活动影响较大. SO2高浓度区域面积随着大量工厂停工而减少;O3浓度一直随着纬度的升高而增加,随海拔的升高而减小,受人类影响较小.
(3)CO与NO2、SO2相关性极强,表明兰州市大气污染物中CO、SO2、NO2的来源相似,与工厂排污、汽车尾气排放密切联系. PM2.5与CO也要较强相关性,说明兰州市大气污染中PM2.5与CO的贡献具有协同性. 气象因素中,温度、湿度、风速对大气污染影响较大,与PM2.5、PM10、NO2、CO、SO2均呈负相关;温度、风速与O3呈正相关,湿度与O3呈负相关.
(4)2021年10月实行的居家政策,使人类活动减少,NO2、CO大幅度减少,分布范围缩小,也导致PM2.5浓度大幅度下降;另外,由于一些主要的大型工业企业并未停工,SO2浓度与PM10、O3一致,并未明显下降.
-
表 1 2020年疫情防控时期污染物浓度变化情况
Table 1. Change of pollutant concentration in four stages in 2020
污染物Pollutants 第一至第二阶段Phase one to phase two 第二至第三阶段Phase two to phase three 第三至第四阶段Phase three to phase four PM2.5 −20.49% −22.14% +1.15% PM10 −7.98% +12.68 +13.04 NO2 −27.38% −2.81% −8.33% SO2 −3.95% −26.85% −23.15% CO −16.86% −28.98% −17.34% O3 +76.21% +11.61% +5.47% 注:计算公式为(后阶段-前阶段)/ 前阶段,即变化率. (阶段划分依据见研究方法). Note: The calculation formula is (latter stage - former stage)/former stage, that is, the rate of change. 表 2 2020年第二阶段(全面抗疫阶段)与2018、2019年同期污染物平均浓度比较
Table 2. Comparison of the average pollutant concentration in the second phase (comprehensive containment phase) of 2020 with the same period in 2018 and 2019
污染物Pollutants 第二阶段The second stage 2018、2019年同期The same period in 2018 and 2019 与2018、2019年同期比较Comparison with the same period in 2018 and 2019 PM2.5/(μg·m−3) 49 48.71 0.595% PM10/(μg·m−3) 88.1 103.75 −15.08% NO2/(μg·m−3) 49.03 52.13 −5.95% SO2/(μg·m−3) 22.34 30.52 −26.8% CO/(mg·m−3) 1.38 1.68 −17.8% O3/(μg·m−3) 92 68.55 34.2% 表 3 2021年应急防控期与2020年同期污染物平均浓度比较
Table 3. Comparison of the average pollutant concentration between the emergency prevention and control period in 2021 and the same period in 2020
污染物Pollutants 2021年应急防控期2021 epidemic control phase 2020年同期The same period in 2020 与2020年同期比较Comparison with the same period in 2020 PM2.5/(μg·m−3) 36 43.3 −16.86% PM10/(μg·m−3) 71.38 106.25 −32.82% NO2/(μg·m−3) 44.04 61.92 −28.88% SO2/(μg·m−3) 12.29 18 −31.72% CO/(mg·m−3) 0.76 1.14 −33.33% O3/(μg·m−3) 75.5 68 11.02% 表 4 6种大气污染物相关性分析
Table 4. Correlation analysis of 6 kinds of air pollutants
污染物Pollutants PM2.5 PM10 CO NO2 SO2 O3 PM2.5 1 0.402** 0.781** 0.672** 0.639** −0.512** PM10 1 −0.04 0.085 0.01 0.047 CO 1 0.864** 0.829** −0.481** NO2 1 0.757** −0.307** SO2 1 −0.265** O3 1 **在 0.01 级别(双尾),相关性显著;n=109. ** At level 0.01(double tail), the correlation was significant. n=109 表 5 6种大气污染物与气象因素之间相关性分析
Table 5. Correlation analysis between 6 kinds of air pollutants and meteorological factors
气象因素Meteorological factors PM2.5 PM10 NO2 SO2 CO O3 平均温度 −0.368** −0.275** −0.398** −0.314** −0.412** 0.703** 湿度 −0.384** −0.228* −0.133** −0.231** −0.264** −0.671** 风速 −0.176** −0.245* −0.298** −0.310** −0.326** 0.317** 气压 −0.089 −0.102 −0.212* −0.149 −0.094 −0.132 *在 0.05 级别(双尾),相关性显著;**在 0.01 级别(双尾),相关性显著;n=109. *At level 0.05(double tail), the correlation was significant. ** At level 0.01(double tail), the correlation was significant. n=109. -
[1] 尹承美, 何建军, 于丽娟, 等. 多尺度气象条件对济南PM2.5污染的影响 [J]. 高原气象, 2019, 38(5): 1120-1128. YIN C M, HE J J, YU L J, et al. The impact of multi-scale meteorological conditions on PM2.5 pollution over Ji'nan [J]. Plateau Meteorology, 2019, 38(5): 1120-1128(in Chinese).
[2] HE J J, GONG S L, YU Y, et al. Air pollution characteristics and their relation to meteorological conditions during 2014-2015 in major Chinese cities [J]. Environmental Pollution, 2017, 223: 484-496. doi: 10.1016/j.envpol.2017.01.050 [3] 杨维, 赵文吉, 宫兆宁, 等. 北京城区可吸入颗粒物分布与呼吸系统疾病相关分析 [J]. 环境科学, 2013, 34(1): 237-243. YANG W, ZHAO W J, GONG Z N, et al. Spatial distribution of inhalable particulate and association with respiratory disease in Beijing City [J]. Environmental Science, 2013, 34(1): 237-243(in Chinese).
[4] PREM K, LIU Y, RUSSELL T W, et al. The effect of control strategies to reduce social mixing on outcomes of the COVID-19 epidemic in Wuhan, China: A modelling study [J]. The Lancet Public Health, 2020, 5(5): 261-270. doi: 10.1016/S2468-2667(20)30073-6 [5] GHAHREMANLOO M, LOPS Y, CHOI Y, et al. Impact of the COVID-19 outbreak on air pollution levels in East Asia [J]. Science of the Total Environment, 2021, 754: 142226. doi: 10.1016/j.scitotenv.2020.142226 [6] 艾文育, 吴燕杰. COVID-19疫情期间济南大气污染及社会活跃度时空变化分析 [J]. 长江信息通信, 2021, 34(4): 29-34. AI W Y, WU Y J. Analysis of air pollution and social activity change in Jinan during the COVID-19 epidemic [J]. Changjiang Information & Communications, 2021, 34(4): 29-34(in Chinese).
[7] 余锋, 李小飞, 李锦雯, 等. 新冠疫情对关中盆地空气质量的影响 [J]. 陕西科技大学学报, 2021, 39(4): 28-39. YU F, LI X F, LI J W, et al. Effects of Corona Virus Disease 2019 on air quality in Guanzhong Basin [J]. Journal of Shaanxi University of Science & Technology, 2021, 39(4): 28-39(in Chinese).
[8] 潘勇军, 高瑶瑶, 李智琦, 等. 广州市空气质量时空特征及新冠疫情的干预 [J]. 中国城市林业, 2020, 18(5): 1-6. PAN Y J, GAO Y Y, LI Z Q, et al. Spatial and temporal characteristics of air quality and intervention of the COVID-19 pandemic in Guangzhou [J]. Journal of Chinese Urban Forestry, 2020, 18(5): 1-6(in Chinese).
[9] 郭勇涛, 佘峰, 王式功, 等. 兰州市空气质量状况及与常规气象条件的关系 [J]. 干旱区资源与环境, 2011, 25(11): 100-105. GUO Y T, SHE F, WANG S G, et al. Assessment on air quality in Lanzhou and its relation with meteorological conditions [J]. Journal of Arid Land Resources and Environment, 2011, 25(11): 100-105(in Chinese).
[10] 李欢倪. 鄂尔多斯市大气污染时空变化特征及防治措施探析[D]. 呼和浩特: 内蒙古大学, 2020. LI H N. Analysis of the characteristics of air-temporal changes in Ordos City and its prevention measures[D]. Hohhot: Inner Mongolia University, 2020(in Chinese).
[11] 袁慎. 兰州市PM2.5的时空特征及气象因素分析 [J]. 经济研究导刊, 2020(4): 119-121,123. YUAN S. Analysis of space-time characteristics and meteorological factors of PM2.5in Lanzhou City [J]. Economic Research Guide, 2020(4): 119-121,123(in Chinese).
[12] 孙兆彬, 李梓铭, 廖晓农, 等. 北京大气热力和动力结构对污染物输送和扩散条件的影响 [J]. 中国环境科学, 2017, 37(5): 1693-1705. SUN Z B, LI Z M, LIAO X N, et al. Influence of Beijing atmospheric thermal and dynamics structure on pollutants transport and diffusion conditions [J]. China Environmental Science, 2017, 37(5): 1693-1705(in Chinese).
[13] 安俊琳, 李昕, 王跃思, 等. 北京气象塔夏季大气O3, NOx和CO浓度变化的观测实验 [J]. 环境科学, 2003, 24(6): 43-47. AN J L, LI X, WANG Y S, et al. Measurements of atmospheric boundary layer O3, NOx and CO in summer with Beijing 325 m meteorological tower [J]. Environmental Science, 2003, 24(6): 43-47(in Chinese).
[14] 陈瑞, 孙建云, 魏巧珍, 等. 2014—2020年兰州市大气污染物特征及变化趋势分析 [J]. 卫生研究, 2021, 50(5): 769-774. CHEN R, SUN J Y, WEI Q Z, et al. The characteristics and change trends of air pollutants in Lanzhou City from 2014 to 2020 [J]. Journal of Hygiene Research, 2021, 50(5): 769-774(in Chinese).
[15] 周秀骥, 罗超, 李维亮, 等. 中国地区臭氧总量变化与青藏高原低值中心 [J]. 科学通报, 1995, 40(15): 1396-1398. doi: 10.1360/csb1995-40-15-1396 ZHOU X J, LUO C, LI W L, et al. Total ozone variation in China and low concentration center over the Tibetan Plateau [J]. Chinese Science Bulletin, 1995, 40(15): 1396-1398(in Chinese). doi: 10.1360/csb1995-40-15-1396
[16] 吴锴, 康平, 于雷, 等. 2015—2016年中国城市臭氧浓度时空变化规律研究 [J]. 环境科学学报, 2018, 38(6): 2179-2190. WU K, KANG P, YU L, et al. Pollution status and spatio-temporal variations of ozone in China during 2015—2016 [J]. Acta Scientiae Circumstantiae, 2018, 38(6): 2179-2190(in Chinese).
[17] 吴蒙, 彭慧萍, 范绍佳, 等. 珠江三角洲区域空气质量的时空变化特征 [J]. 环境科学与技术, 2015, 38(2): 77-82. WU M, PENG H P, FAN S J, et al. Distribution characteristics of regional air quality in the Pearl River Delta [J]. Environmental Science & Technology, 2015, 38(2): 77-82(in Chinese).
[18] 佘峰. 兰州地区大气颗粒物的化学特征及沙尘天气对其影响研究[D]. 兰州: 兰州大学, 2011. SHE F. A study on chemical characteristics of particulate matters in Lanzhou area and influence of dust events on them[D]. Lanzhou: Lanzhou University, 2011(in Chinese).
[19] 马秉吉, 马玉霞, 虞志昂, 等. 气象条件对兰州市近地面臭氧质量浓度的影响 [J]. 兰州大学学报(自然科学版), 2019, 55(6): 775-780. MA B J, MA Y X, YU Z A, et al. The influence of meteorological conditions on near-surface ozone mass concentration in Lanzhou City [J]. Journal of Lanzhou University (Natural Sciences), 2019, 55(6): 775-780(in Chinese).
[20] 沈楠驰, 周丙锋, 李珊珊, 等. 2015—2019年天津市大气污染物时空变化特征及成因分析 [J]. 生态环境学报, 2020, 29(9): 1862-1873. SHEN N C, ZHOU B F, LI S S, et al. Temporal and spatial variation characteristics and origin analysis of air pollutants in Tianjin from 2015 to 2019 [J]. Ecology and Environmental Sciences, 2020, 29(9): 1862-1873(in Chinese).
[21] 杨兴川, 赵文吉, 熊秋林, 等. 2016年京津冀地区PM2.5时空分布特征及其与气象因素的关系 [J]. 生态环境学报, 2017, 26(10): 1747-1754. YANG X C, ZHAO W J, XIONG Q L, et al. Spatio-temporal distribution of PM2.5 in Beijing-Tianjin-Hebei(BTH) area in 2016 and its relationship with meteorological factors [J]. Ecology and Environmental Sciences, 2017, 26(10): 1747-1754(in Chinese).
[22] 王闯, 王帅, 杨碧波, 等. 气象条件对沈阳市环境空气臭氧浓度影响研究 [J]. 中国环境监测, 2015, 31(3): 32-37. WANG C, WANG S, YANG B B, et al. Study of the effect of meteorological conditions on the ambient air ozone concentrations in Shenyang [J]. Environmental Monitoring in China, 2015, 31(3): 32-37(in Chinese).
[23] 陈渤黎, 吴晶璐, 刘银峰, 等. 2012年-2014年常州市大气污染特征分析研究 [J]. 环境科学与管理, 2017, 42(1): 114-119. CHEN B L, WU J L, LIU Y F, et al. Analysis on characteristics of air pollution in Changzhou from 2012 to 2014 [J]. Environmental Science and Management, 2017, 42(1): 114-119(in Chinese).
-


 下载:
下载:


