-
近年来,随着大气污染防治措施的持续推进,国内在颗粒物治理方面已经取得显著成效[1],近地面O3污染问题却愈发突出,O3已成为夏秋季节城市空气质量超标的首要因子[2]. O3不仅影响气候变化,而且对农作物、环境和人体健康造成负面影响[3-6]. 近地面的O3主要由氮氧化物(NOx)和挥发性有机物(VOCs)二次反应生成,部分VOCs的化学性质活跃,进入大气后可能会导致光化学烟雾的产生[7-9],对大气质量环境和人类生产活动产生严重危害,因此加强重点O3污染区域的溯源分析和精准协同管控具有重要意义[10-12]. 国内对于O3源解析的研究主要集中于京津冀[13-14]、长三角[15-19]、珠三角[20-23]和成渝[24-25]等发达地区,对中部江淮地区等需要重点管控的区域研究较少.
对于城市O3的溯源分析主要是根据O3及其前体物监测数据,利用受体模型或者三维数值模型识别O3本地和区域来源,定量解析不同VOCs排放源类对O3生成潜势(OFP)的贡献值和分担率[26-28]. 其中,正定矩阵因子分析(PMF)和基于源清单的网格化三维数值模式多被尝试应用于国内外大气中VOCs或者O3的源解析方面[29-31];例如2014—2016年沈劲等学者通过嵌套网格空气质量预报模式(NAQPMS)对珠三角的O3污染来源解析显示,珠三角西南部在春夏季节期间的O3外地传输贡献约为50%,具有明显的跨省输送特征,该方法需要详细的区域源清单和气象资料,且模拟结果仍然存在较大的不确定性[32]. 实际工作中,研究者往往难以区分本地生成、外地传输(或者垂直下沉)对O3污染产生的分担贡献,而基于观测的盒子模型(OBM)利用观测资料作为约束条件模拟多种大气光化学过程,不依赖于源清单,研究结果相对真实地反映了大气中的光化学反应过程及其影响因素,可以模拟O3本地生成的主要过程和速率,是对其他模型难以区分传输贡献的良好补充. 例如,2010年陆克定等采用基于OBM模型评估珠三角区域醛类和亚硝酸对O3生成速率的重要影响[20];2020年,韩丽等基于OBM模型对成都O3污染过程进行了收支(本地生成和外界传输)分析,然而受限于OBM模型对行业污染来源解析的局限性,均不能明确具体行业来源,仅能从侧面判断O3控制区属性[31]. 因此,该文尝试基于最新化学反应机制(CB05参数反应)的OBM和PMF模型[7,32],综合分析和相互验证解析结果,希望可以有效降低来自排放源对分析结果的不确定性.
江淮地区是长三角区域污染相对较重的区域,该地区主要的大气环境问题是空气质量改善速度相对周边地区较慢,重污染天气尚未完全消除,PM2.5和PM10污染呈现减缓趋势的同时,O3污染呈现出加重趋势,总体上呈现以O3和PM2.5复合污染为主要特征的严峻污染形势,2016—2020年,地处江淮地区的安徽省呈现出O3超标天数皖北较多皖南较少、皖东较多皖南较少、皖东较多皖西较少、春夏高秋冬低的时空特征,夏秋季O3污染对空气质量达标天数的拉低作用逐步凸显,区域O3污染的溯源协同防控亟需技术支撑[33]. 但由于江淮地区缺乏详细的污染源清单等基础资料,源清单的不确定性大于国内其他发达区域. 三维模型的研究实践基础不足,采用OBM来诊断O3与前体物的关系具有较大的现实意义. 此外,目前尚未见对江淮地区采用OBM模型方法开展O3生成敏感性和污染来源研究的公开报道,现阶段基于多种分析方法的相关研究无论从研究代表性和研究时段等方面均存在不足.
本文选取安徽省江淮地区O3污染的典型城市(合肥、宿州、阜阳、滁州以及淮南)作为研究对象,基于最新建立的VOCs监测网络,分析区域的O3污染特征,并尝试综合PMF和OBM模型对VOCs和O3污染的溯源分析结果,探讨O3污染的区域特征和主要污染来源,希望为江淮地区及长三角区域O3和PM2.5的协同防控提供科学依据.
-
研究选取位于江淮地区的合肥、宿州、阜阳、滁州以及淮南等5个典型O3污染城市作为研究对象. 研究时段为2020年9月1—10日,9月上旬江淮地区出现了一次典型的区域性O3污染过程. O3、SO2、CO、NO、NO2和PM2.5等空气质量数据的小时值和日均值均为国控自动监测站点的审核数据,数据质量符合《环境空气质量评价技术规范(试行)》(HJ 633−2013)中对监测方法、质控审核方法、数据有效性、完整性和统计修约等质控要求,小时温度、湿度、风速等气象参数来自中国气象局气象数据共享平台,时间分辨率为1 h,具体见参考文献[34].
大气中的VOCs采用磐合Superlab2020-TT-GCMS VOCs在线监测系统(包含采样系统、低温预浓缩系统、气相色谱质谱联用仪、标准稀释气体和内标气等单元组成)分析;环境大气通过采样系统采集后进入低温除水装置(−25 ℃)除去空气中的水分,样品空气进入到浓缩系统 A 通道,在低温条件下(−25 ℃),VOCs在冷阱中被多重组合吸附剂吸附捕集,样品空气进行浓缩富集;同时系统对 B 通道进行解析(300 ℃),触发 GCMS/FID 分析,B 通道解析完后进入待机模式,等待 A 通道采样完成后,切换到 B 通道继续采样;A 冷阱然后快速加热解析(100 ℃·s−1)进入分析系统;同时对 A 通道的除水装置进行加热反吹(280 ℃),对管路进行吹扫、清洗;目标化合物经主色谱柱分离后,前端组分(乙烷、乙烯、乙炔,丙烷、丙烯)直接进入到氧化铝色谱柱进行二次的分离,然后进入火焰离子化检测仪(FID )进行分析,主色谱柱后端流出的组分(C4—C12的碳氢化合物、卤代烃、含氧化合物等)进入质谱检测器(MSD)检测;时间分辨率为1 h.
监测过程按照5个浓度水平的混合标准样品建立标准曲线,标准曲线的R2均大于0.99,且每日开展PAMS标准气(Linde electronics and specialty gases,Germany)等双通道单点浓度校准,FID组分化合物偏差范围为80%—120%,MSD 组分化合物偏差范围为70%—130%;详细监测参数、检出限和质控方法见文献[31,34-35],相关数据处理和统计分析采用SPSS18.0软件分析. 共有效监测到77种VOCs,按照化学特性划分为烷烃(25种)、烯烃(10种)、炔烃(1种)、芳香烃(12种)、卤代烃(18种)、有机硫(1种)以及含氧挥发性有机物(OVOCs)(10种)等7大类组分.
-
O3生成潜势计算采用最大增量反应活性( MIR)法估算不同VOCs的OFP[36],计算结果越大表明VOCs物种的O3生成潜势越大. 正定矩阵因子分析(PMF)采用 EPA PMF5.0开展VOCs来源解析,基本原理是利用权重计算样本中各化学组分的误差,通过最小二乘法确定主要污染源及其贡献率,其目标函数的解需尽可能小,选择最小Q(robust)值所得的运行结果为基准运行结果,所有引导程序因子均与判定因子达到85%符合[37]. OBM模型是利用实际观测资料作为约束条件来模拟研究大气光化学污染过程的一种技术,采用包含13523种有机物光化学反应的MCM机制(The Master Chemical Mechanism)模拟污染时段反应的中间产物浓度,模型反应速率常数采用CB05机理[7,20],有机物参数采用监测到的VOCs浓度,无机物参数采用O3、SO2、NO、NO2和CO,近似计算O3的光化学反应变化率P(O3),实际大气中O3的积累主要来自HO2和RO2自由基与NO的反应,使NO氧化为NO2,随后NO2光解;利用临近时刻的O3浓度变化代表O3实际变化率Pnet(O3),区域传输(包括高空处垂直传输和水平传输)速率Pt(O3)为P(O3)与Pnet(O3)的差值[31,35,38],具体方法见公式(1)和(2).
式(1)中,P(O3)、Pnet(O3)和Pt(O3)分别表示O3的光化学反应变化率、实际变化率和区域传输速率;式(2)中,k1、k2i分别是HO2+NO和RO2+NO反应生成NO2的速率常数,mi是RO2+NO经过一系列中间反应后的NO2综合产率,k3是O3光解的速率常数、k4、k5、k6分别是O3与烯烃(OLE)、HO和HO2反应去除的速率常数反应、k7是NO2与HO反应生成HNO3的速率常数;[HO2]、[RO2]、[NO]、[O1D]、[OLE]、[HO]分別是HO2、RO2、NO、O1D、OLE、HO的浓度[7,20,31].
-
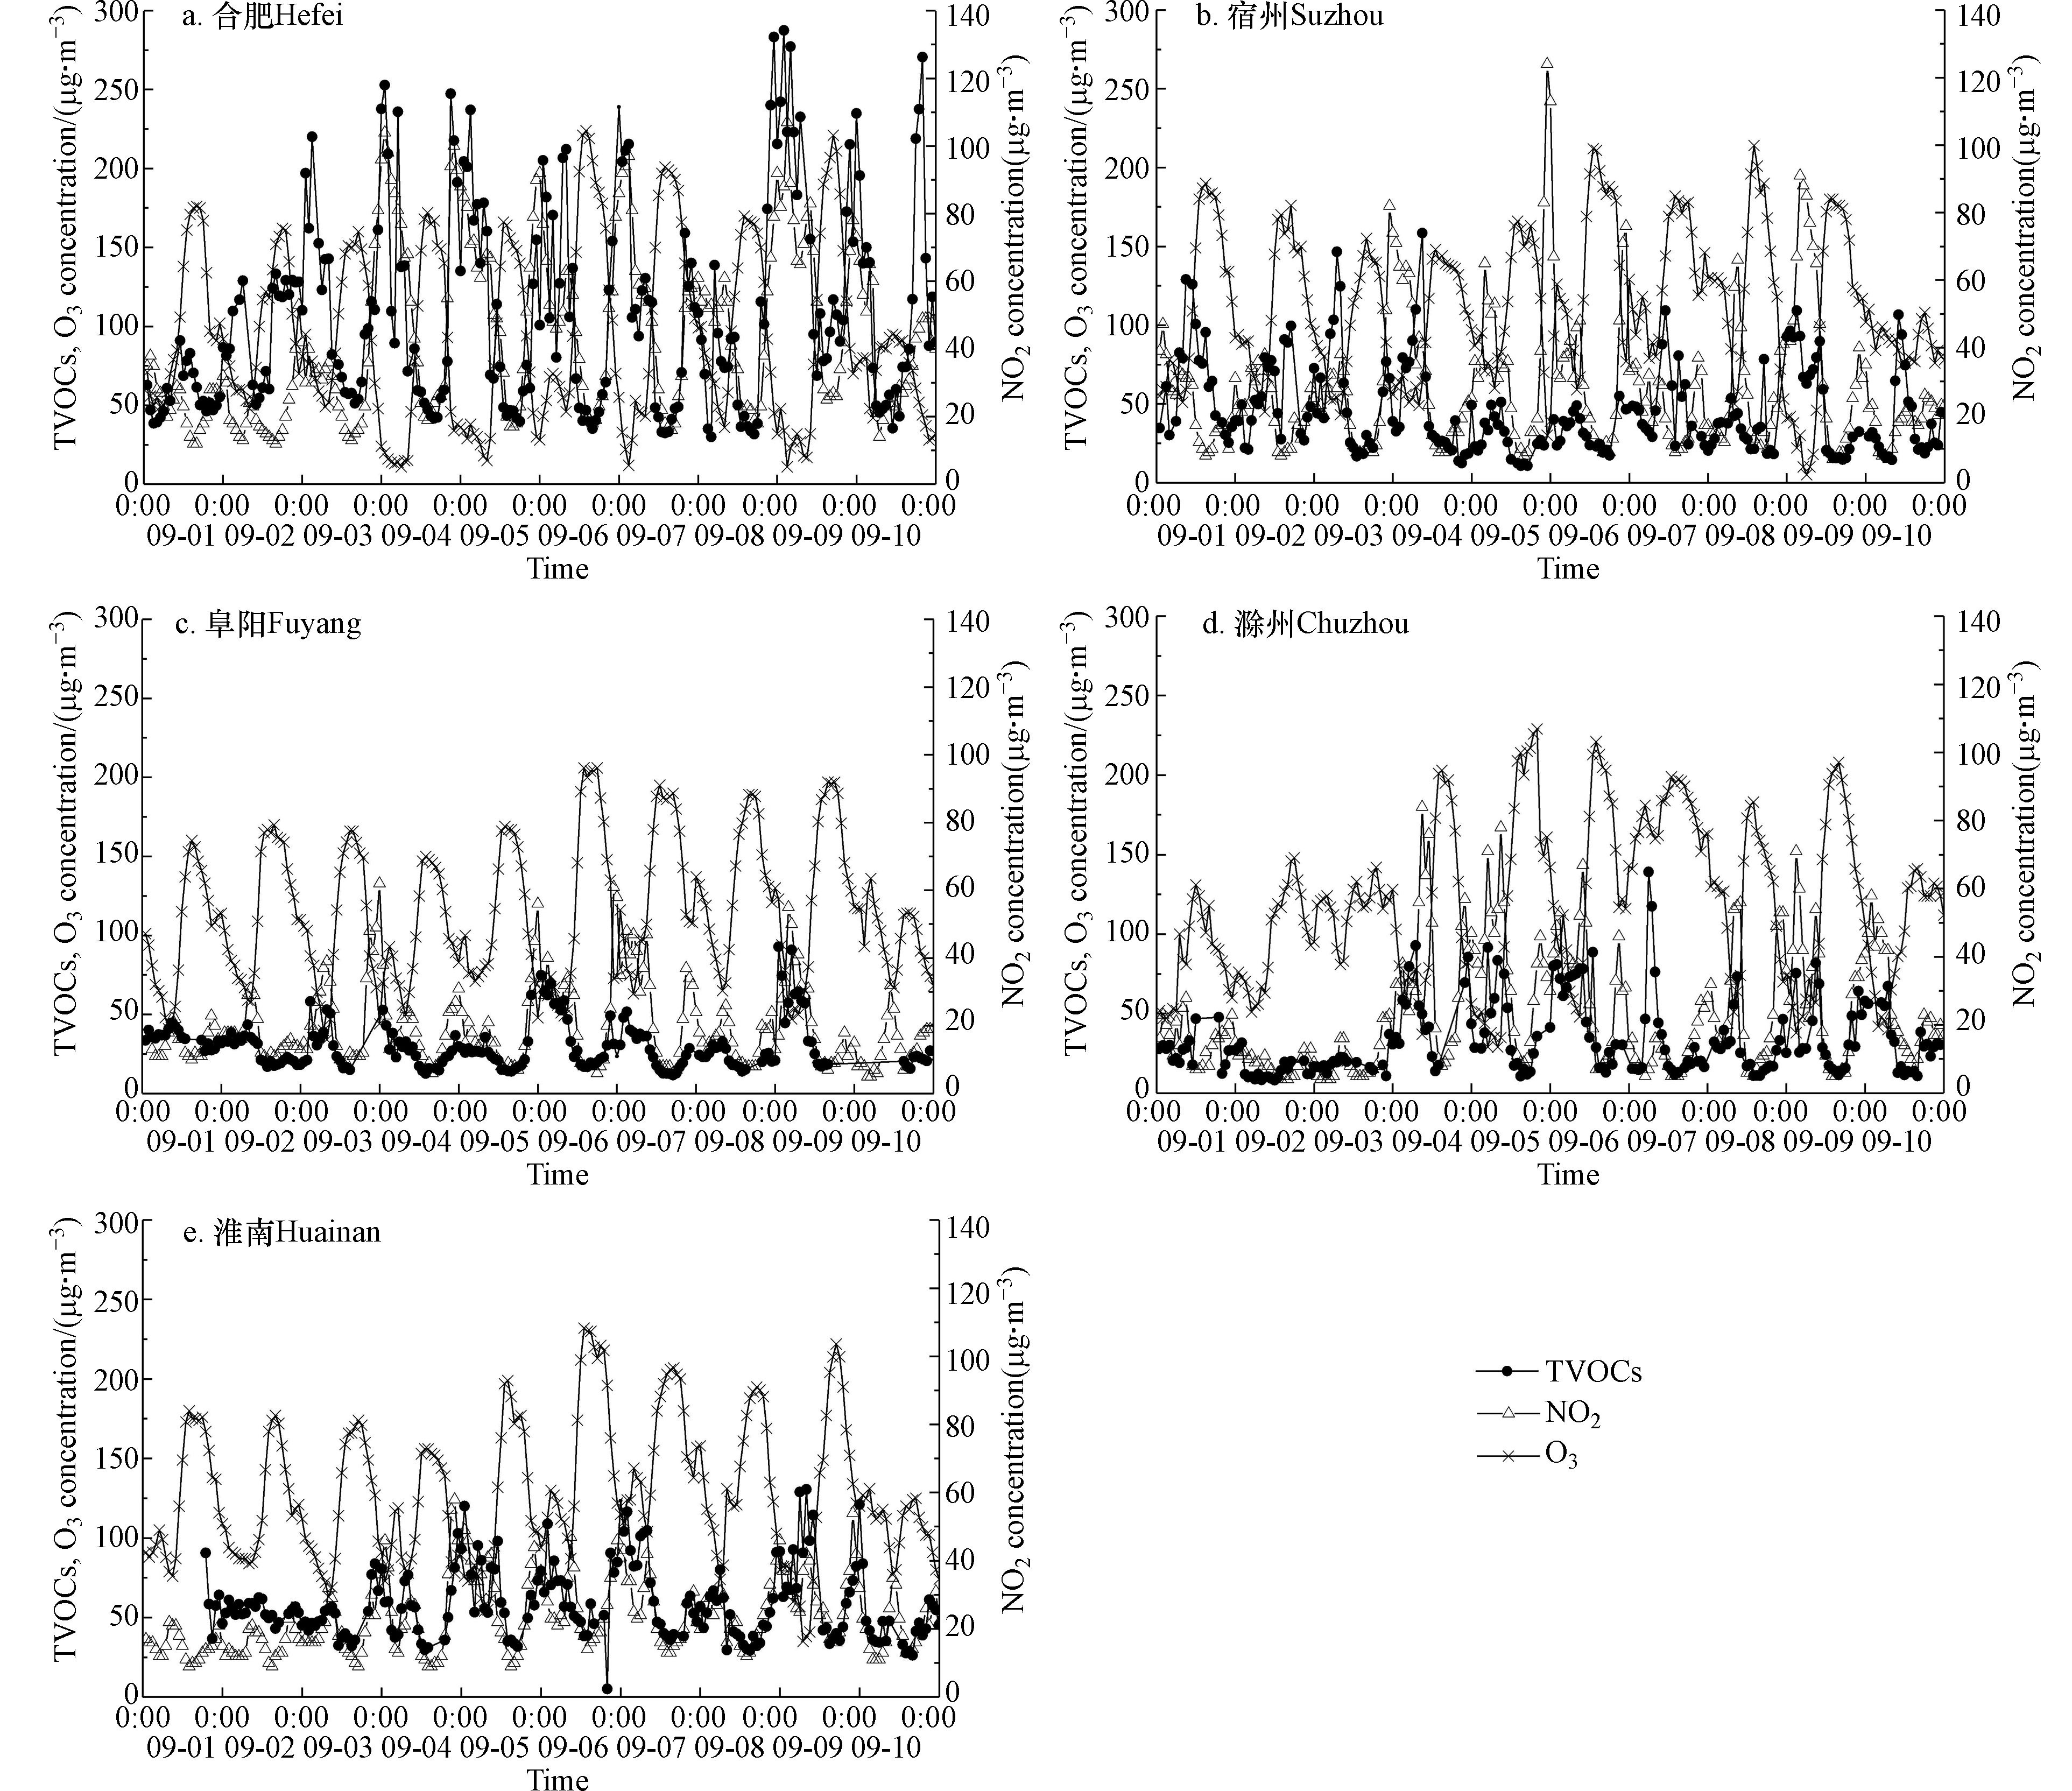
统计分析2020年8月下旬至9月中旬江淮地区的气象条件发现,9月上旬5个城市的最高气温均超过31 ℃,比8月下旬平均高3—5 ℃;相对湿度呈现夜间高白天低的日变化特征,日变化范围为50.5%—85.0%(5个城市相对湿度平均为64.1%,其中仅合肥市夜间湿度较高,可达85.0%),基本保持低湿度的稳定状态;主导风向仍为西北风,风速较8月下旬减小0.8—4.4 m·s−1(平均为2.6 m·s−1);随着气温的显著提高、风速的减小,环境气象条件逐渐形成了高温、低湿、小风的O3生成适宜条件[33]. 可能受此有利气象因素影响,合肥、宿州、阜阳、滁州和淮南等5个城市出现了一次区域性的O3污染过程(O3小时浓度超过200 μg·m−3、O3日最大8小时滑动平均浓度超过160 μg·m−3均可认为是出现污染),5个城市O3小时浓度平均值分别达到(108± 56)μg·m−3、(112 ± 46)μg·m−3、(114 ± 46)μg·m−3、(119 ± 50)μg·m−3和(128 ± 43)μg·m−3,其中滁州和淮南小时浓度超标率较高,均为6.7%;O3日最大8小时滑动平均浓度分别高达203、195、196、200、222 μg·m−3,滁州和淮南达到日均中度污染等级;9月6日11:00—17:00 O3浓度甚至高达212—232 μg·m−3(图1).
污染期间,5个城市的O3日变化规律均不符合典型O3污染的“单峰性”特征分布,O3小时浓度均呈“M型”双峰特征分布(图1),O3小时浓度一般在上午9时左右开始,随着光照强度、温度的持续攀升,O3浓度出现明显的上升趋势,在下午13:00—15:00达到污染峰值(合肥、宿州和滁州出现在13:00、阜阳出现在15:00、淮南出现在14:00),随后出现下降趋势,至夜间22时左右,再次出现一次缓慢上升的过程,至夜间(0:00—4:00)呈现一次相对较低的污染峰值(低于130 μg·m-3),之后缓慢下降;其中,滁州和淮南夜间相对较高的O3二次峰值浓度可能为次日浓度的再次攀升(如9月6日)提供了较高的本底浓度. 进一步分析不同城市污染期间TVOCs浓度结果表明(表1),5个城市的VOCs污染水平存在一定的差异性;其中,合肥污染程度远高于其余4个城市,TVOCs浓度平均值达112 μg·m-3,小时变化范围30—288 μg·m-3,日变化的波动范围最大;其他4个城市平均值均低于60 μg·m-3,淮南与滁州TVOCs处于5个城市中等水平,宿州和阜阳TVOCs浓度较低,平均值不超过40 μg·m-3;除合肥浓度较高外,其余4个城市的TVOCs浓度比石家庄[30]、天津[39]和邯郸[40]等城市低约20—110 μg·m-3,合肥市的VOCs污染水平基本达到国内主要大城市的污染水平. 目前众多研究认为长三角及其周边城市中心城区的O3污染一般处于VOCs控制区,郊区及农村区域处于NOx控制区[16-17,19],针对夏季合肥市的O3敏感性研究也认为其属于VOCs控制型[16,33]. 而从污染峰值和持续时间上看,宿州、阜阳、合肥、滁州和淮南的O3污染形势依次更加严峻,这与其经济社会发展程度和污染源排放量并不匹配. 据2019年安徽统计年鉴数据显示,合肥和阜阳常驻人口超过800万,尤其是合肥机动车保有量(达到257万辆)和NOx排放量(达到2.05万吨)远高于滁州和淮南,这与污染期间合肥NO2浓度相对较高的结论基本一致(9月4—6日合肥夜间和早间的NO2峰值超过100 μg·m-3,比淮南和滁州高30—60 μg·m-3);而合肥的O3污染程度反而相对较轻,这可能与合肥NOx浓度较高引发的O3滴定效应或者较高湿度(不利于氢氧自由基的生成)有关[25,41]. 综上,此次污染过程中,同处于江淮地区的5个城市O3污染日变化具有非典型的“M型”双峰特征,但O3与VOCs的污染浓度趋势无正相关关系,推测原因可能为不同城市VOCs和NOx的污染程度和相对比例(VOCs/NOx)以及气象条件差异性导致的非线性关系所致[25],合肥等江淮地区城市的O3污染敏感性需要进一步研究.
-
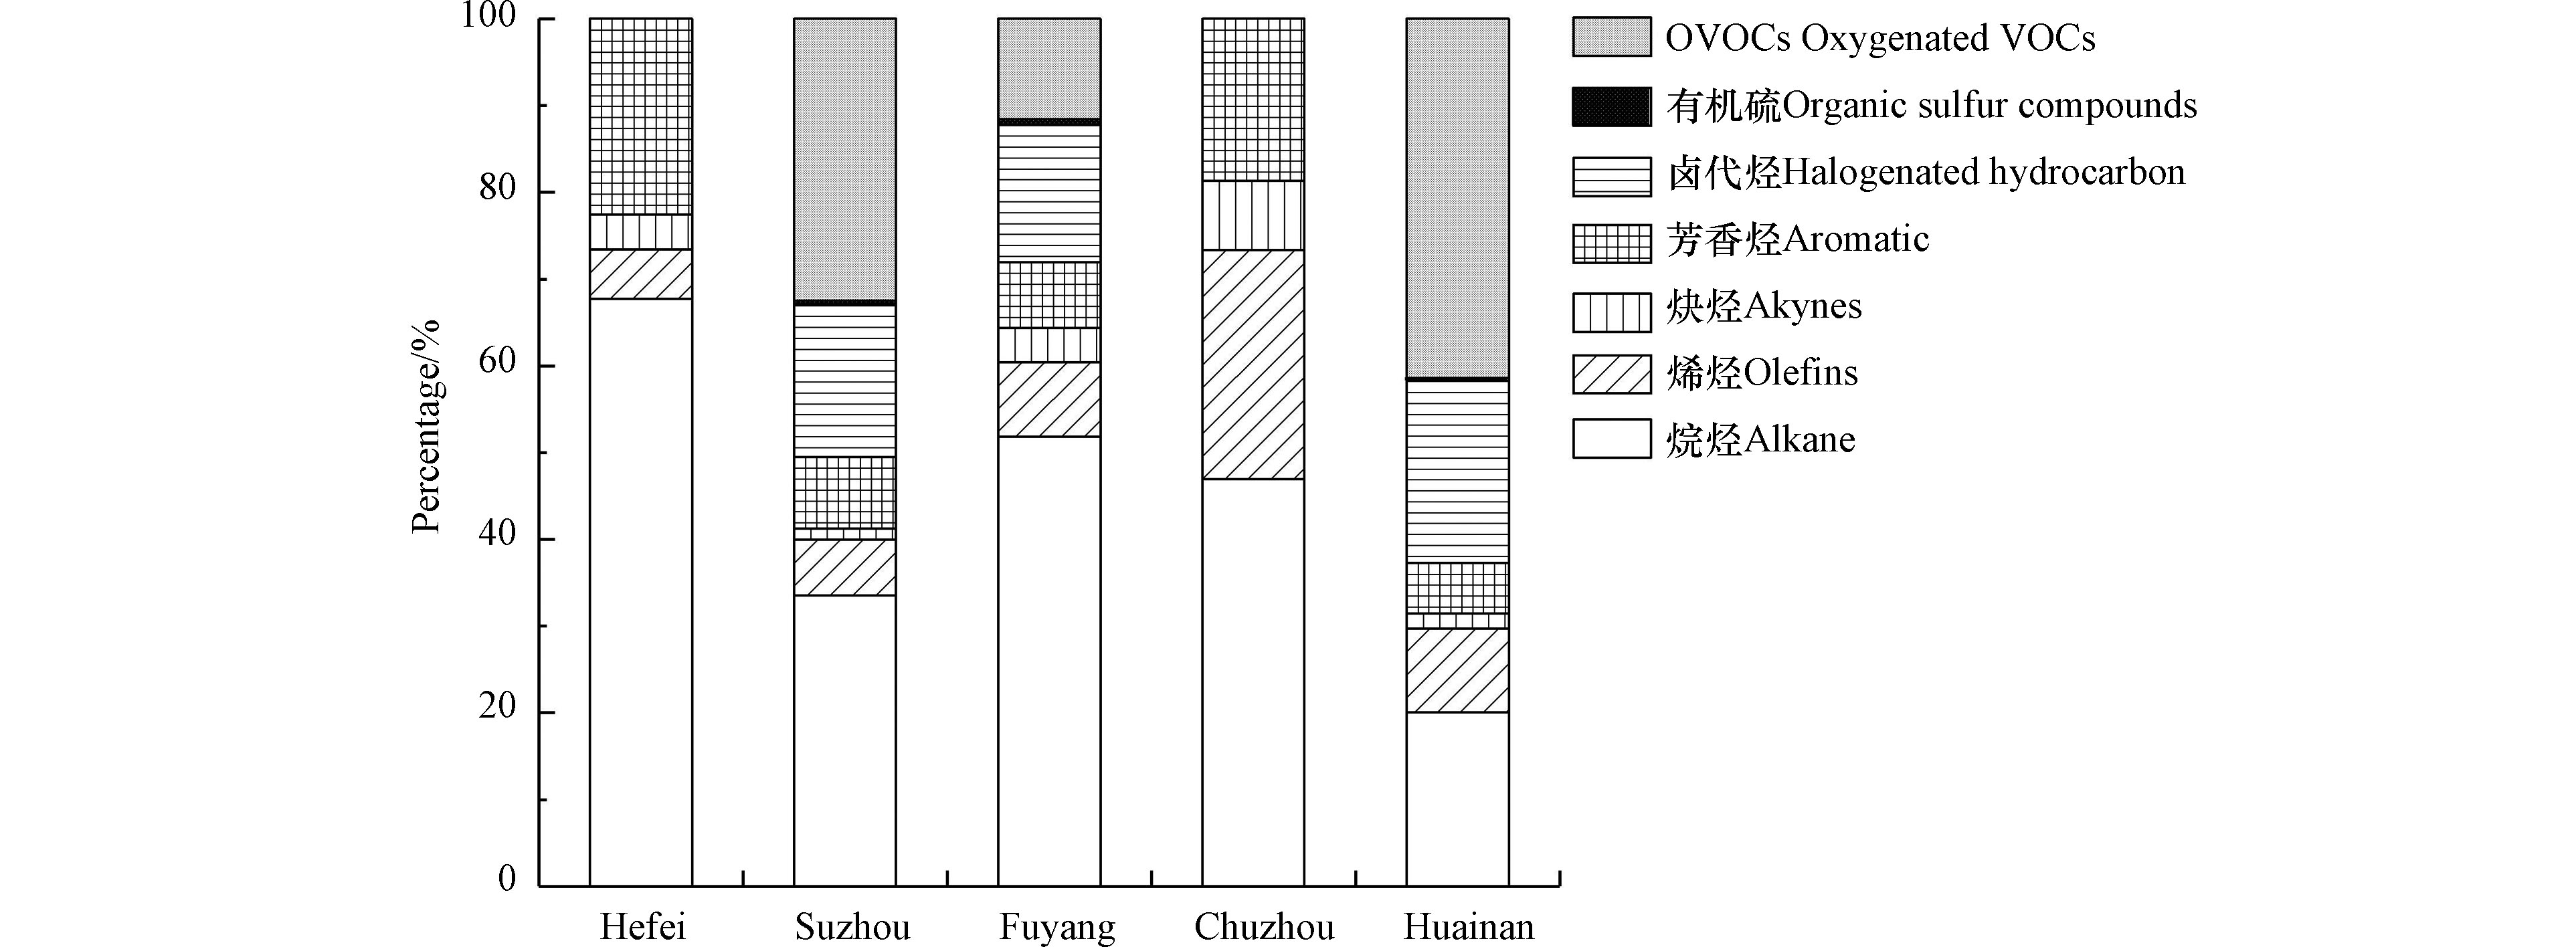
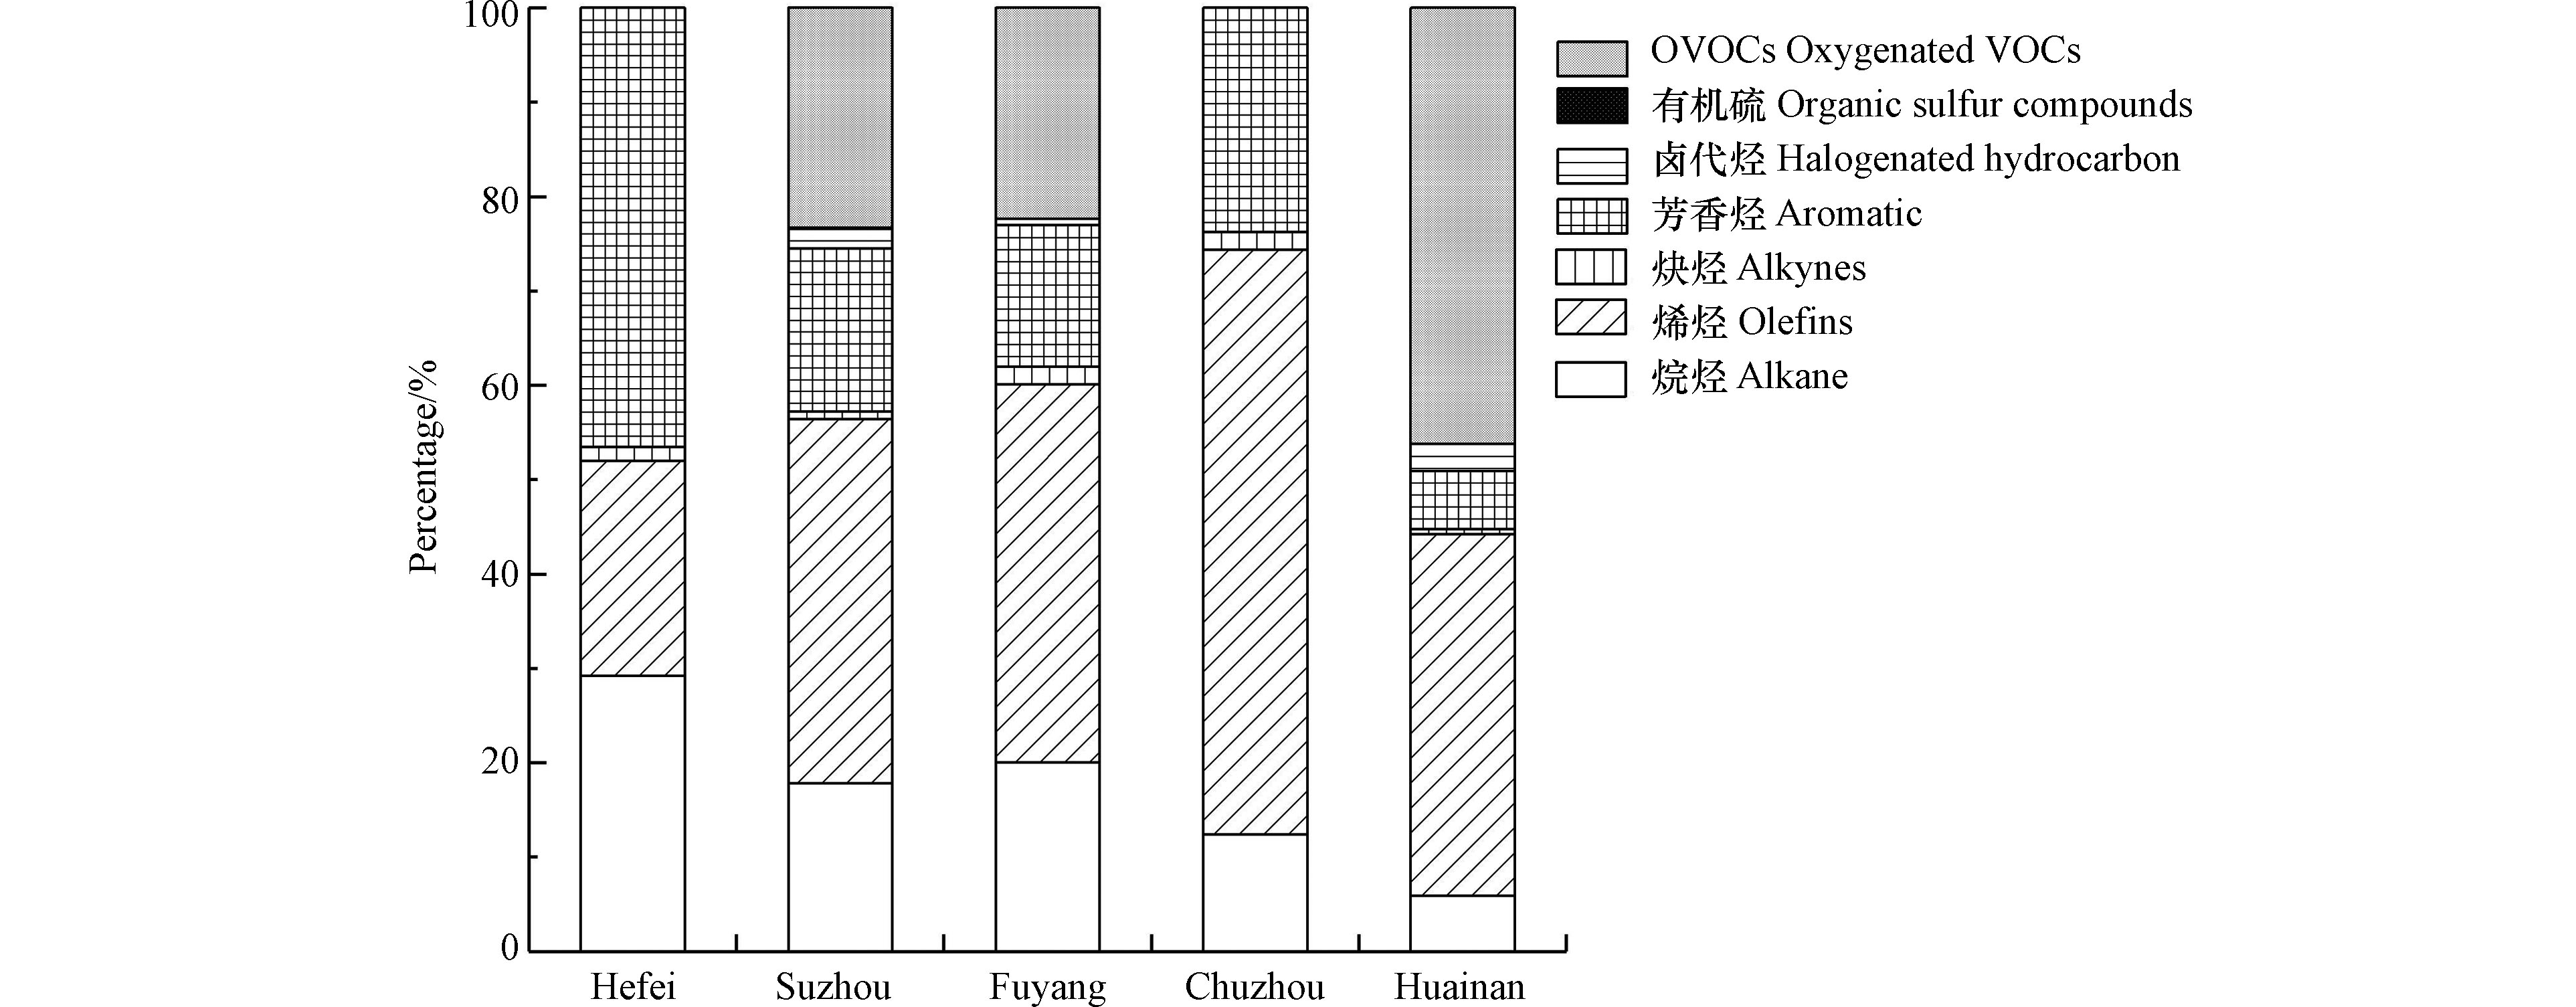
统计分析5个城市污染期间VOCs的组分平均值(图2),合肥烷烃组分占比较高,达67.7%,芳香烃(22.5%)也有较大贡献,烯烃和炔烃组分贡献相对较低,这与天津大气环境VOCs以烷烃(65.0%)和芳香烃(17.4%)为主要成分的研究结论一致[39];宿州烷烃(33.4%)和OVOCs(32.5%)贡献比较高,属优势组分,卤代烃(17.5%)也有较强贡献;阜阳烷烃占比51.9%,卤代烃(15.9%)和OVOCs(11.5%)具有一定水平贡献;滁州烷烃(47.0%)、烯烃(26.4%)和芳香烃(18.6%)均有较高贡献,炔烃贡献最低,仅为7.9%;淮南与其他城市存在显著性差异,第一优势组分为OVOCs,贡献比达41.4%,卤代烃(20.9%)与烷烃(20.1%)贡献总和超过40.0%,这与石家庄市卤代烃和OVOCs含量较高的结果相似[30];这可能与淮南煤炭消费量超过全省平均水平3倍以上的工业结构有关[16,42]. 综上,除淮南外,其他各城市均以烷烃为主,芳香烃、烯烃、OVOCs等具有一定贡献,炔烃和有机硫组分贡献较低,与天津[39]和邯郸[40]等城市的VOCs组成具有一定的相似性,这可能与其主要污染源具有一定的相似性有关[42-43].
-
选择TVOCs相对高值时段(3—6日、9日)作为重点分析时段,对比分析5个城市的VOCs高值物种及其指示的潜在排放源(表2)[41],不同城市在2个TVOCs高值时段的高值单体物种存在显著差异性,但同一城市在不同污染时段高值物种和潜在排放源相似性较高,不同城市的污染源排放具有一定程度的连续性. 交通移动源和油气行业对大气VOCs的贡献在高值时段占据主导地位,主要排放物种为乙烷、丙烷、异正丁烷、戊烷、正戊烷等;除交通移动源外,化工合成、溶剂使用、工业源等对VOCs也有较大贡献;其中,滁州和淮南在污染高值阶段监测到了高浓度的乙醛、丙酮等OVOCs,除了光化学反应的二次生成外,可能源于溶剂使用和有机化工等行业的排放[40-41].
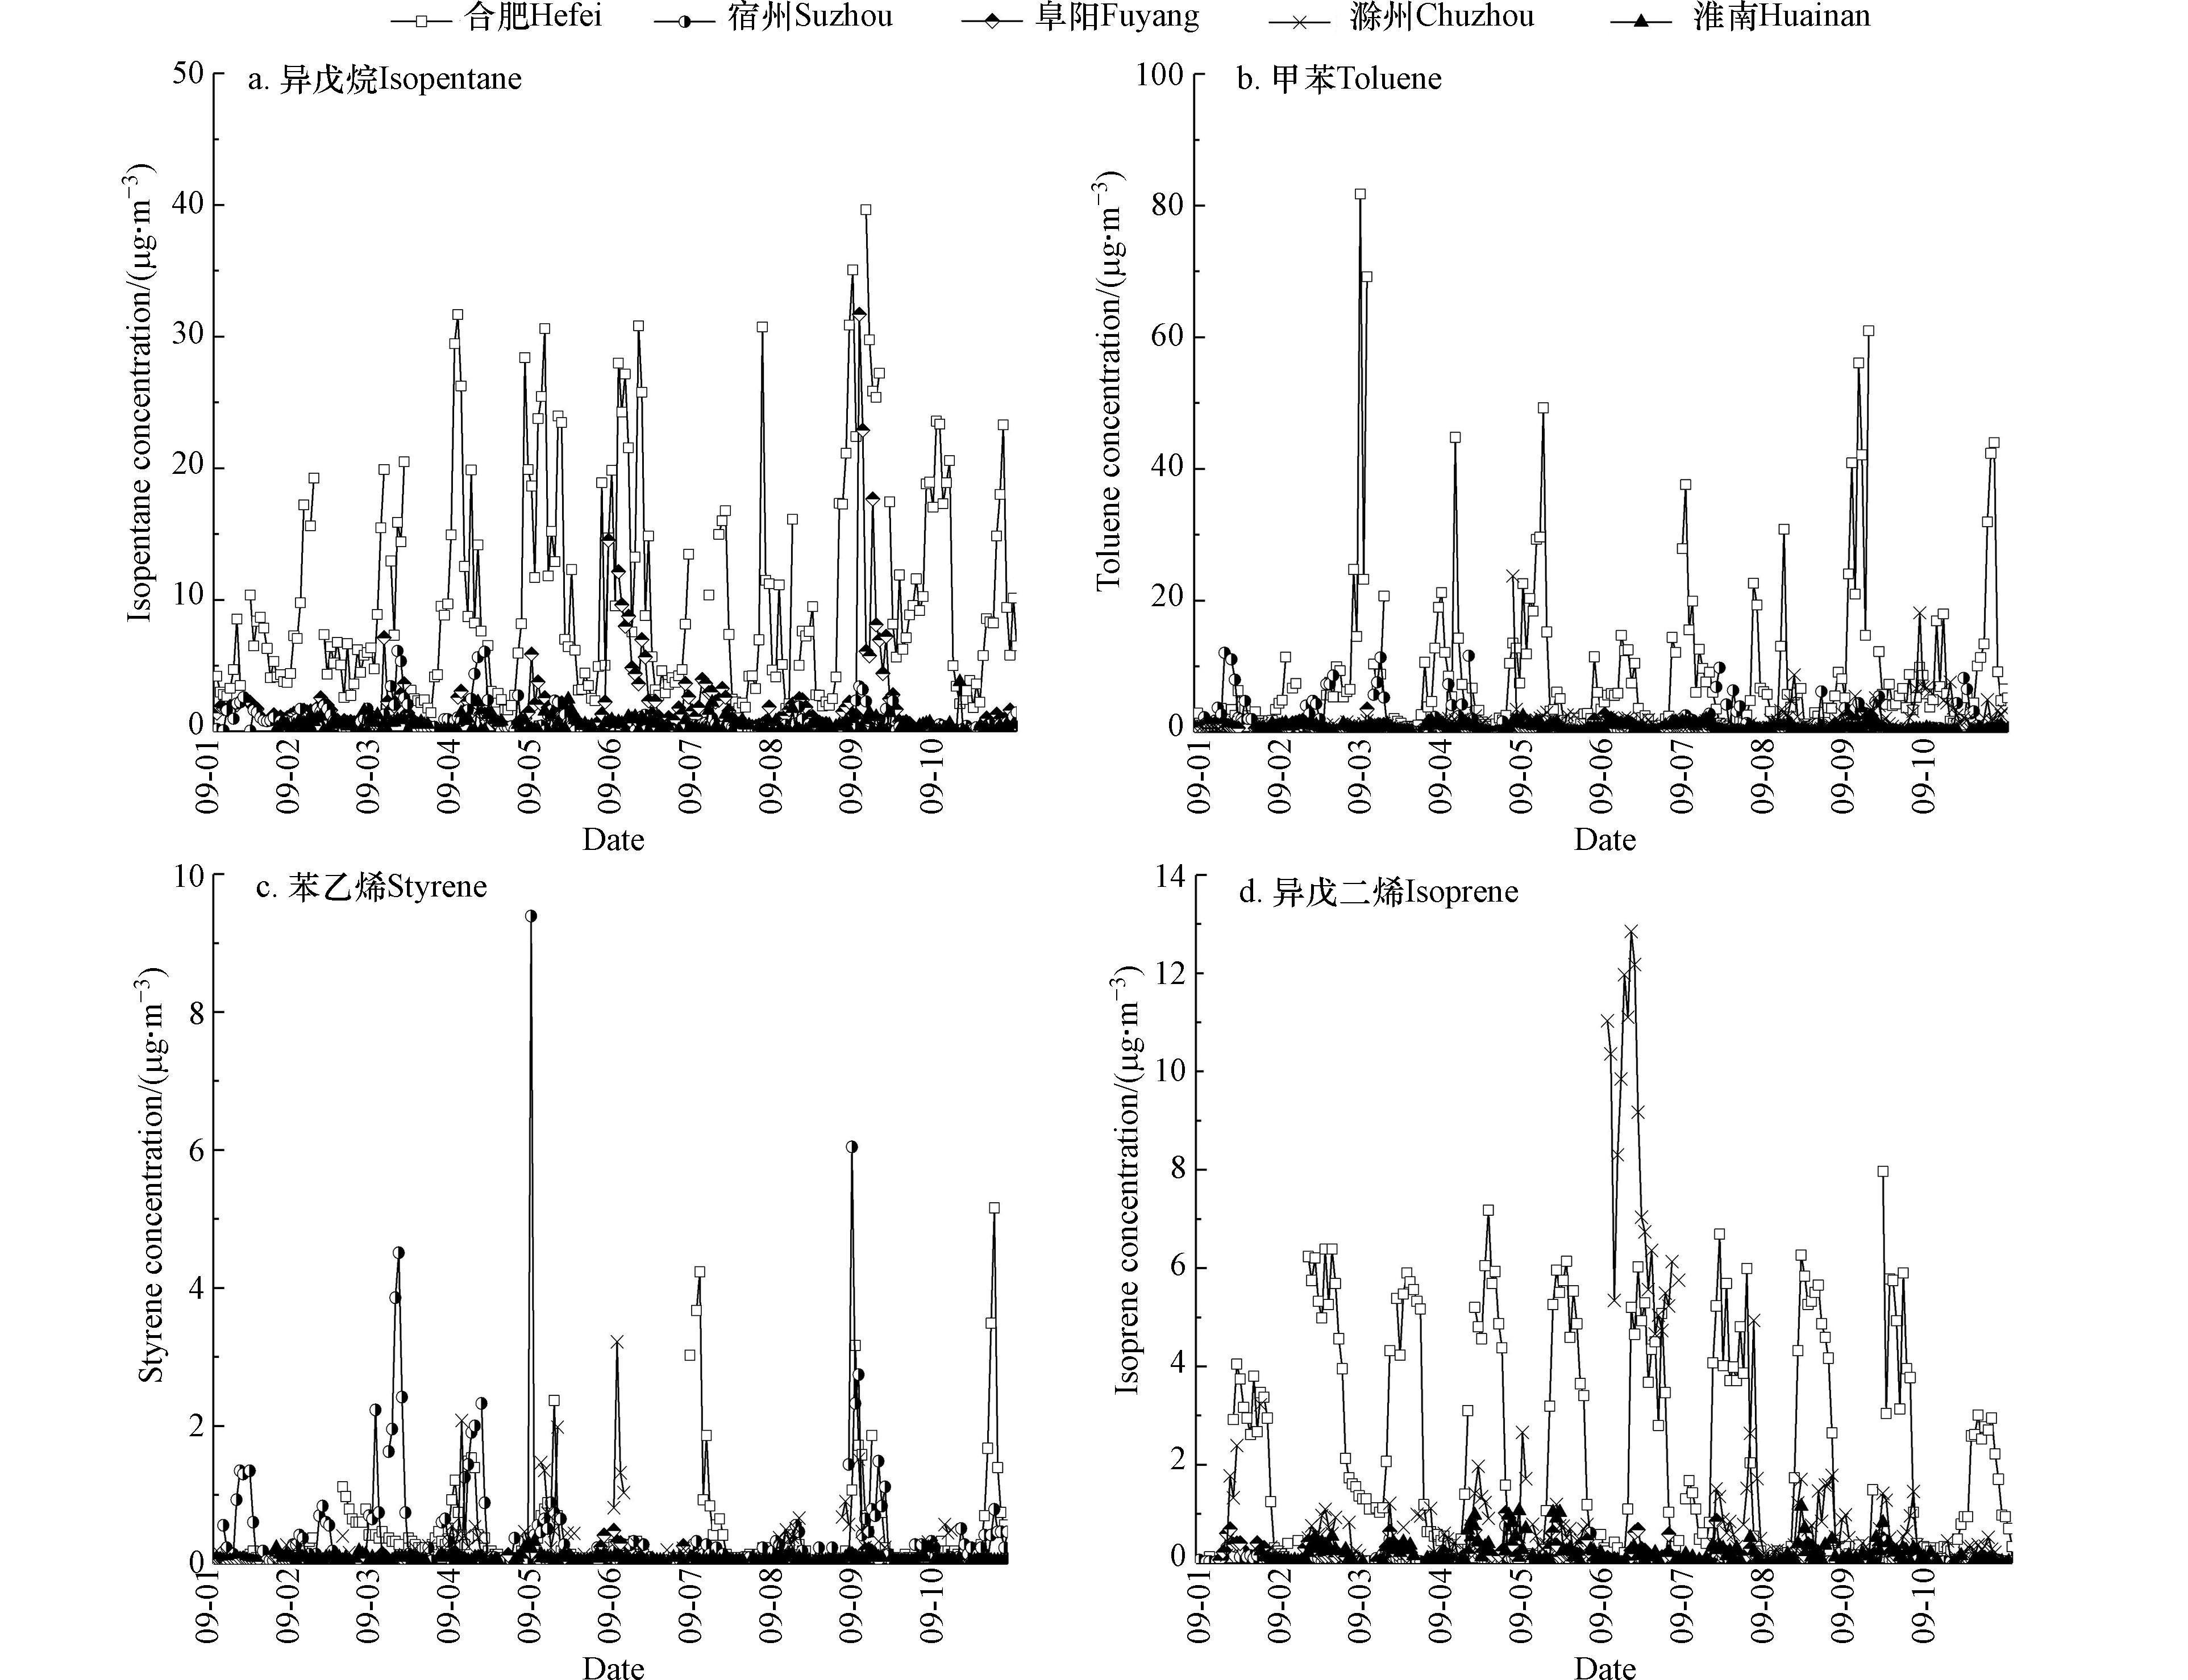
参考现有关于VOCs源指示性的最新研究成果,选取异戊烷、甲苯、苯乙烯、异戊二烯4种特征性单体VOCs分别指示机动车尾气、燃烧过程和溶剂涂料、工业排放(化工)、植物排放[39-40]. 污染期间,5个城市特征VOCs物种的时间序列如图3所示,合肥的异戊烷维持在较高水平,于9日2:00观测到40 μg·m−3的极大值,且出现相对明显的日变化趋势,这与合肥较高的机动车保有量和交通活动密切相关[43];其次为阜阳,其他城市异戊烷始终维持在相对较低水平. 合肥甲苯维持在较高水平,于10日19:00观测到44 μg·m−3的极大值,且呈现明显的日变化趋势,表明合肥受到交通移动源和溶剂使用等影响较强;其次为滁州,在4日、9日等时段也出现甲苯高值;其他城市甲苯始终维持在相对较低水平. 宿州、合肥以及滁州均在污染期间出现苯乙烯高值,其中宿州在9日0:00监测到6 μg·m−3的高值,表明污染期间上述3座城市存在间歇性工业排放情况;阜阳和淮南苯乙烯始终维持在较低水平. 作为天然源识别的关键核心物种,异戊二烯在5个城市呈现出相对明显的日变化趋势,其中合肥与滁州异戊二烯相对较高,可能与2座城市监测站点周边植物密集有关;其他城市异戊二烯较低.
-
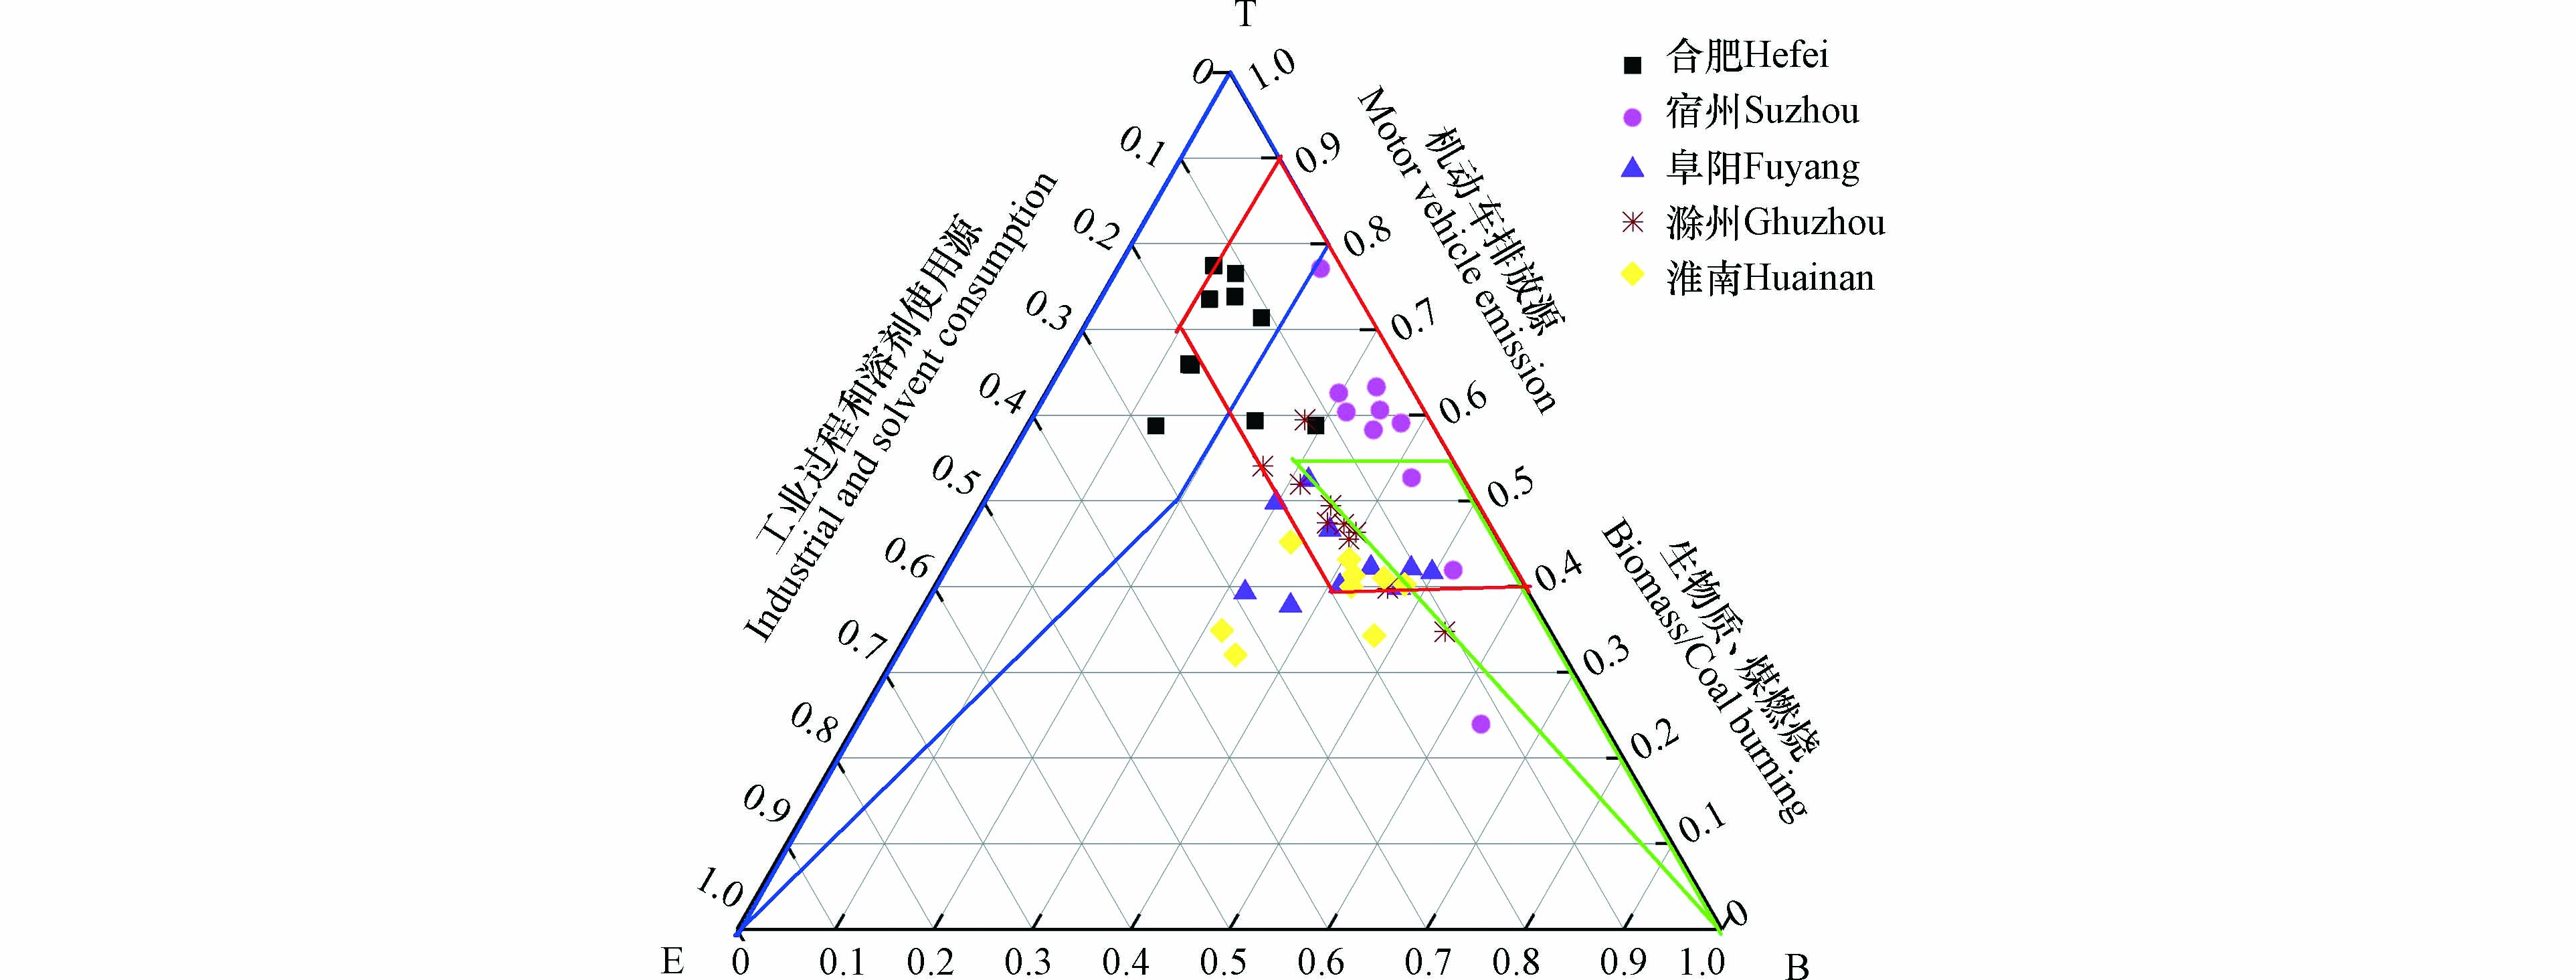
VOCs的监测结果表明苯系物(BTEX)是城市污染排放量较大的高活性组分,且因污染排放的协同性和控制措施的相似特征往往导致BTEX之间比率出现一定的规律性特征,因此通过分析环境样品苯(B)、甲苯(T)和乙苯(E)的比值可以大致判断苯系物的可能来源. 已有研究通过汇总整理包括生物质燃料、煤燃烧源谱、机动车排放源谱或隧道实验数据以及工业过程和溶剂使用等源谱数据[44],参考此法分析得到5个城市的源识别三相图(图4);其中,红色线框内部区域代表机动车排放源,蓝色线框内部区域代表工业过程和溶剂使用源,绿色线框内部区域代表生物质燃料、煤燃烧源,不同BTEX源识别区存在一定的交叉区域. 仅从BTEX的特征比值分析表明,除淮南个别天数外,5个城市的B/T/E日均比值绝大部分落在机动车排放源区域内,其中合肥的B/T/E日均比值同时较多地落在工业过程和溶剂使用源区域内,这与合肥城市规模较大的工业现状相匹配,阜阳和宿州部分日均比值落在生物质燃料、煤燃烧源谱区域内,可能源于生物质和煤炭的燃烧排放. 综合各城市B/T/E比值的分析结果,推测机动车排放源在江淮区域大气苯系物的排放贡献中占主导地位.
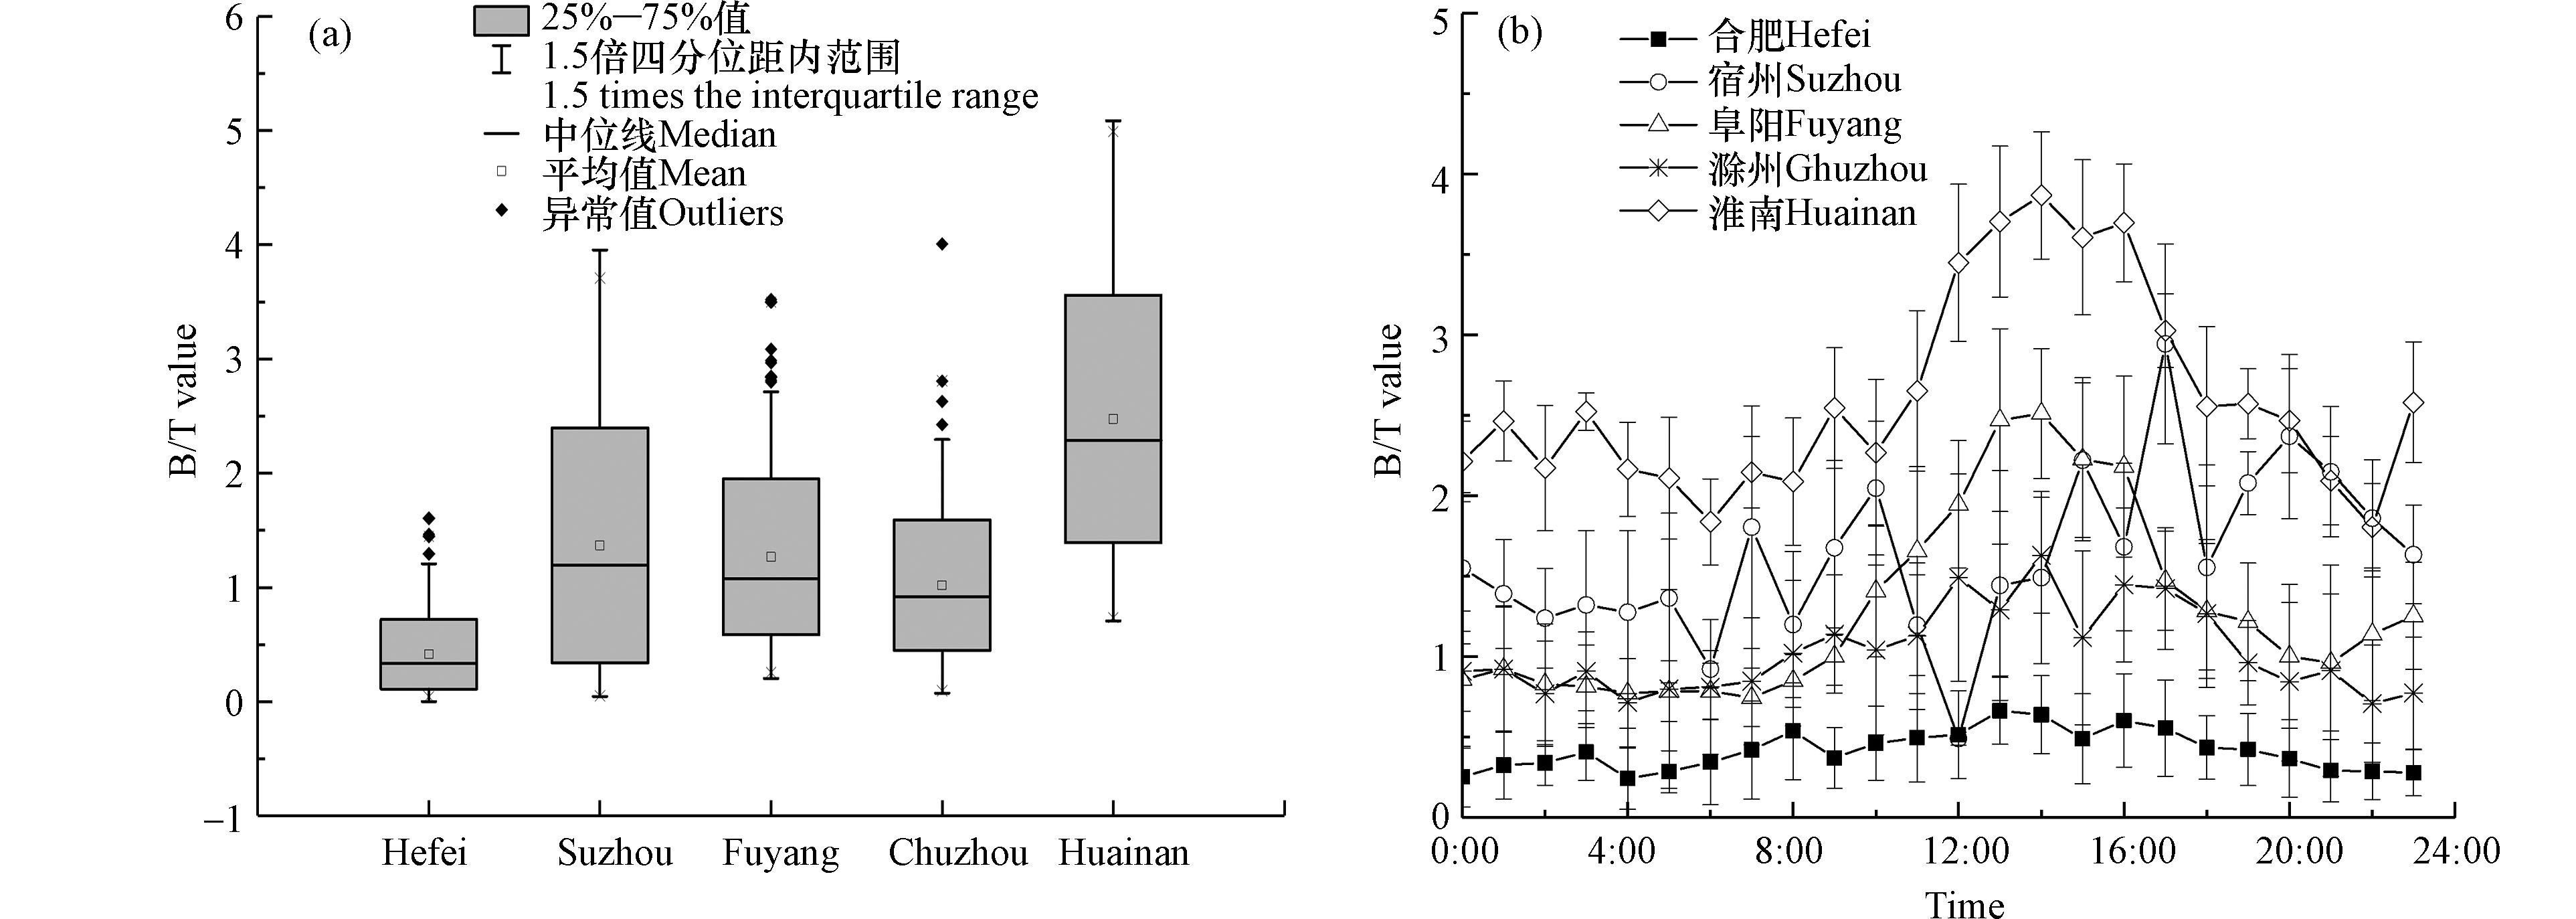
近年来,Barletta[45]、王鸣[46]和Mo[47]等学者通过对比分析我国众多典型城市(43个城市、7次以上外场观测实验)环境大气挥发性有机物特征比值的源解析指示信息,一般认为苯与甲苯浓度比值(B/T)作为苯系物的特征物种比值法,可用来定性判断当前地区环境空气中苯和甲苯等典型VOCs的来源;B/T的比值在0.50附近可认为是机动车排放的特点;B/T比值高于0.5时,VOCs的来源主要为各类型燃料燃烧,B/T比值高于1.0时,VOCs主要来自煤燃烧;研究发现煤炭燃烧中B/T比值范围为1.5至2.2,生物质燃烧中B/T的特征比值约为2.5[45]. 统计分析监测期间5个城市B/T的平均比值表明(图5),城市之间B/T值存在显著性差异;合肥B/T比值在0.50附近,与广州(B/T为0.56)和上海(B/T为0.41)市研究结果相似,表明合肥VOCs受到机动车排放和溶剂使用影响强烈[46];宿州和阜阳B/T比值总体大于1.0,表明2座城市VOCs主要受到燃烧过程影响;滁州B/T比值总体处于0.5至1.5之间,显示该城市可能受到机动车尾气和燃烧过程的综合影响;淮南B/T比值较高(大于1.5),表明燃烧过程特别是生物质燃烧可能是该城市VOCs的主要影响因素. 统计分析B/T比值的日变化表明,5个城市B/T大小存在显著性差异的同时,也存在相似的日变化趋势。B/T比值在日间呈上升趋势,在08:00开始不断上升,至13:00左右达一天中的最大值,随后不断下降,夜间维持在相对较低水平;这可能与日间生产生活活动相关,在生产生活中伴随着煤炭燃烧(工业过程)以及生物质燃烧等排放过程[40,43]. 综上,宿州、阜阳和淮南污染期间均受到燃烧过程的影响较大,合肥受机动车尾气和溶剂使用影响较大,滁州受到燃烧过程和机动车尾气排放的综合影响.
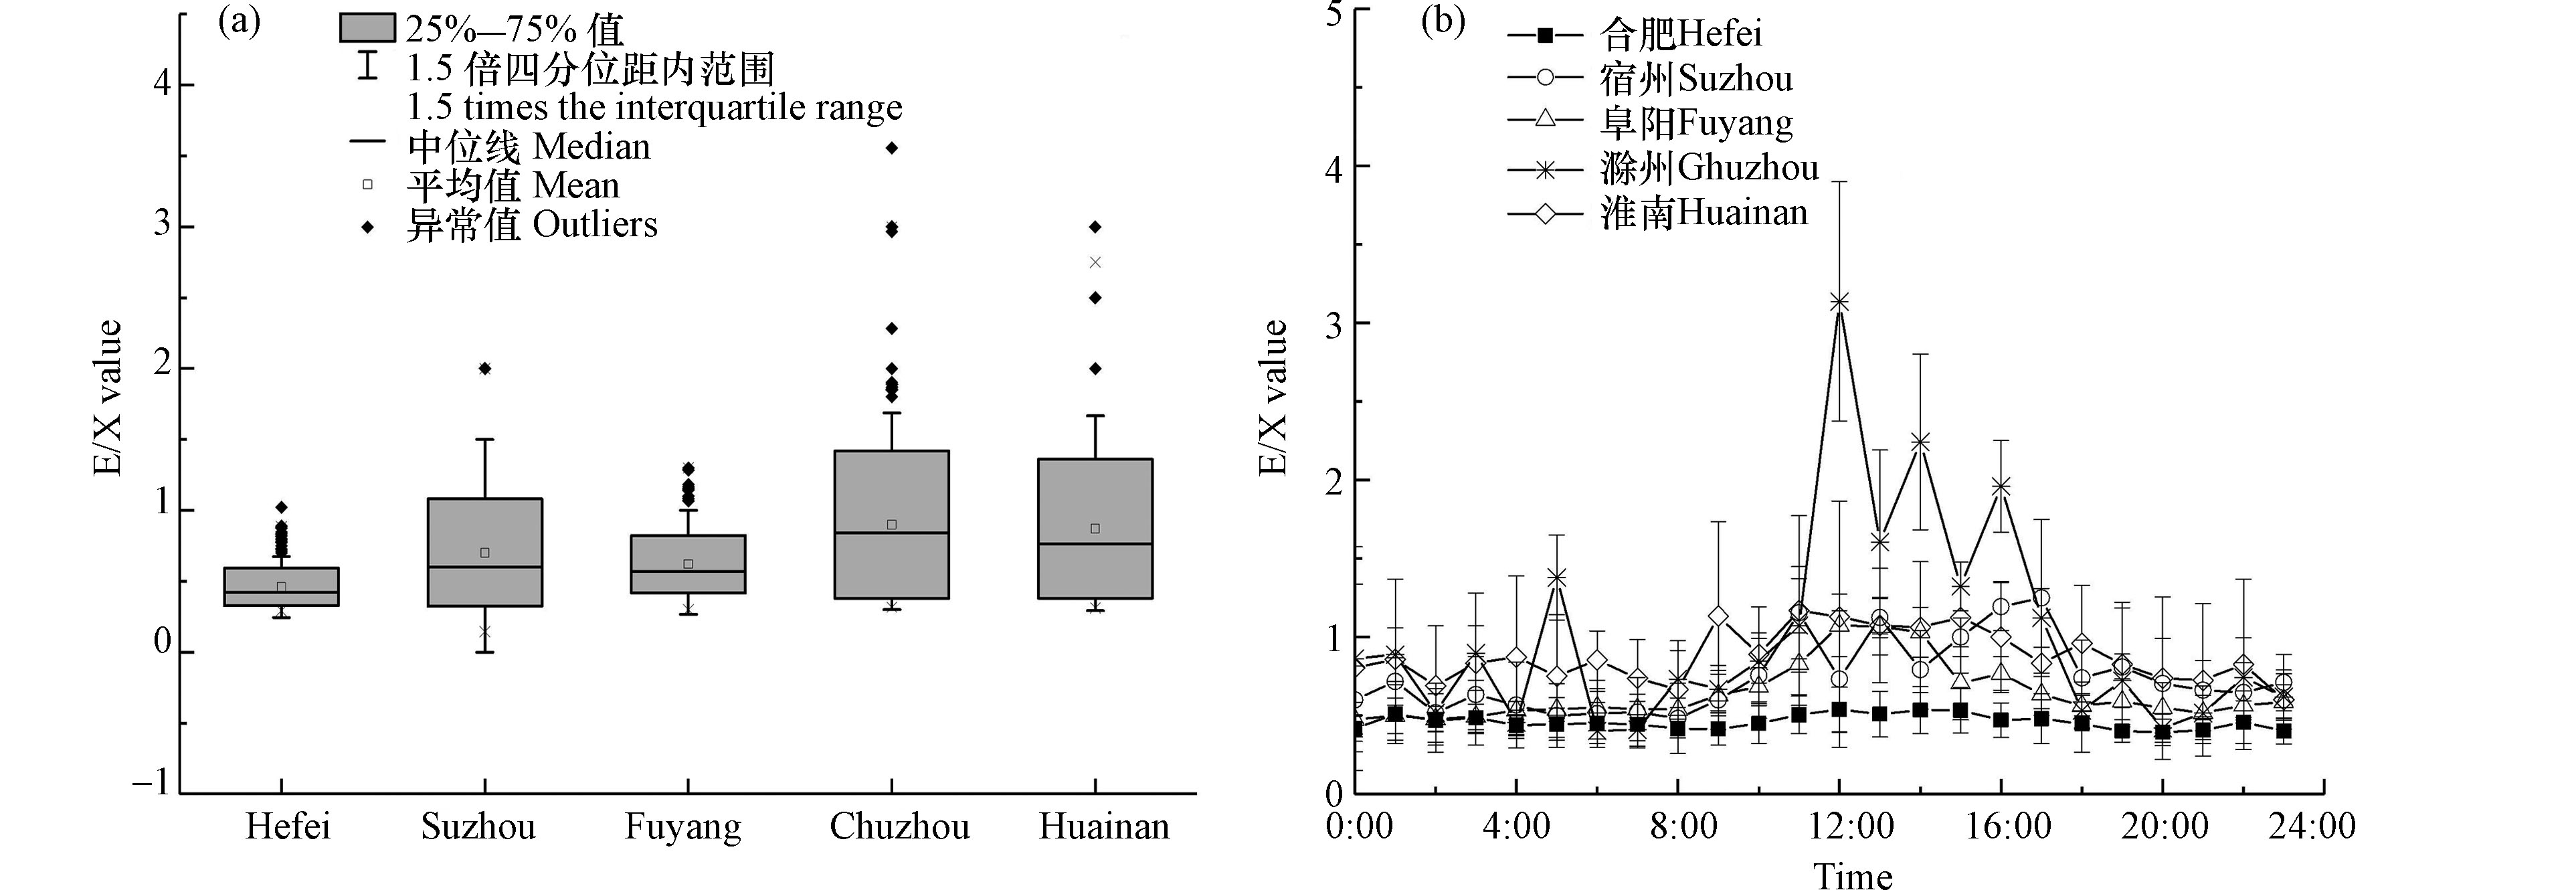
乙苯(E)和间−对二甲苯(X)浓度比值的不同能够近似表明污染过程是受新鲜排放的影响还是经历光化学作用的影响,比值越高说明经历的化学进程越长,与污染排放源距离越远[46]. 5个城市E/X比值如图6所示,E/X比值由高到低分别为滁州(0.90±0.52)、淮南(0.87±0.49)、宿州(0.70±0.38)、阜阳(0.62±0.20)和合肥(0.46±0.13);其中,合肥E/X较低,气团较为新鲜,表明合肥VOCs污染受到本地排放作用较强,这与合肥城市规模大、工业工艺较发达以及机动车保有量较多等因素密切相关;滁州、淮南在5个城市中属于受外来传输污染影响相对较大的城市;宿州和阜阳E/X比值处5个城市中间水平. 此外,E/X比值的日均变化分析表明,5个城市E/X比值呈现较为显著的日变化特征,在夜晚和清晨E/X比值较低,气团相对新鲜,约在09:00左右开始逐渐上升,11:00—17:00时段内略高于其他时段,再次验证了HO对E/X的影响规律,且E/X显著低于广州(E/X为2.43)和北京(E/X为2.14)等发达区域[46],污染气团老化程度相对较轻;其中,滁州E/X比值在12:00—16:00内出现高值(1.90—3.05),表明该时段内滁州气团老化较为显著,可能受到较强的外来传输污染影响.
-
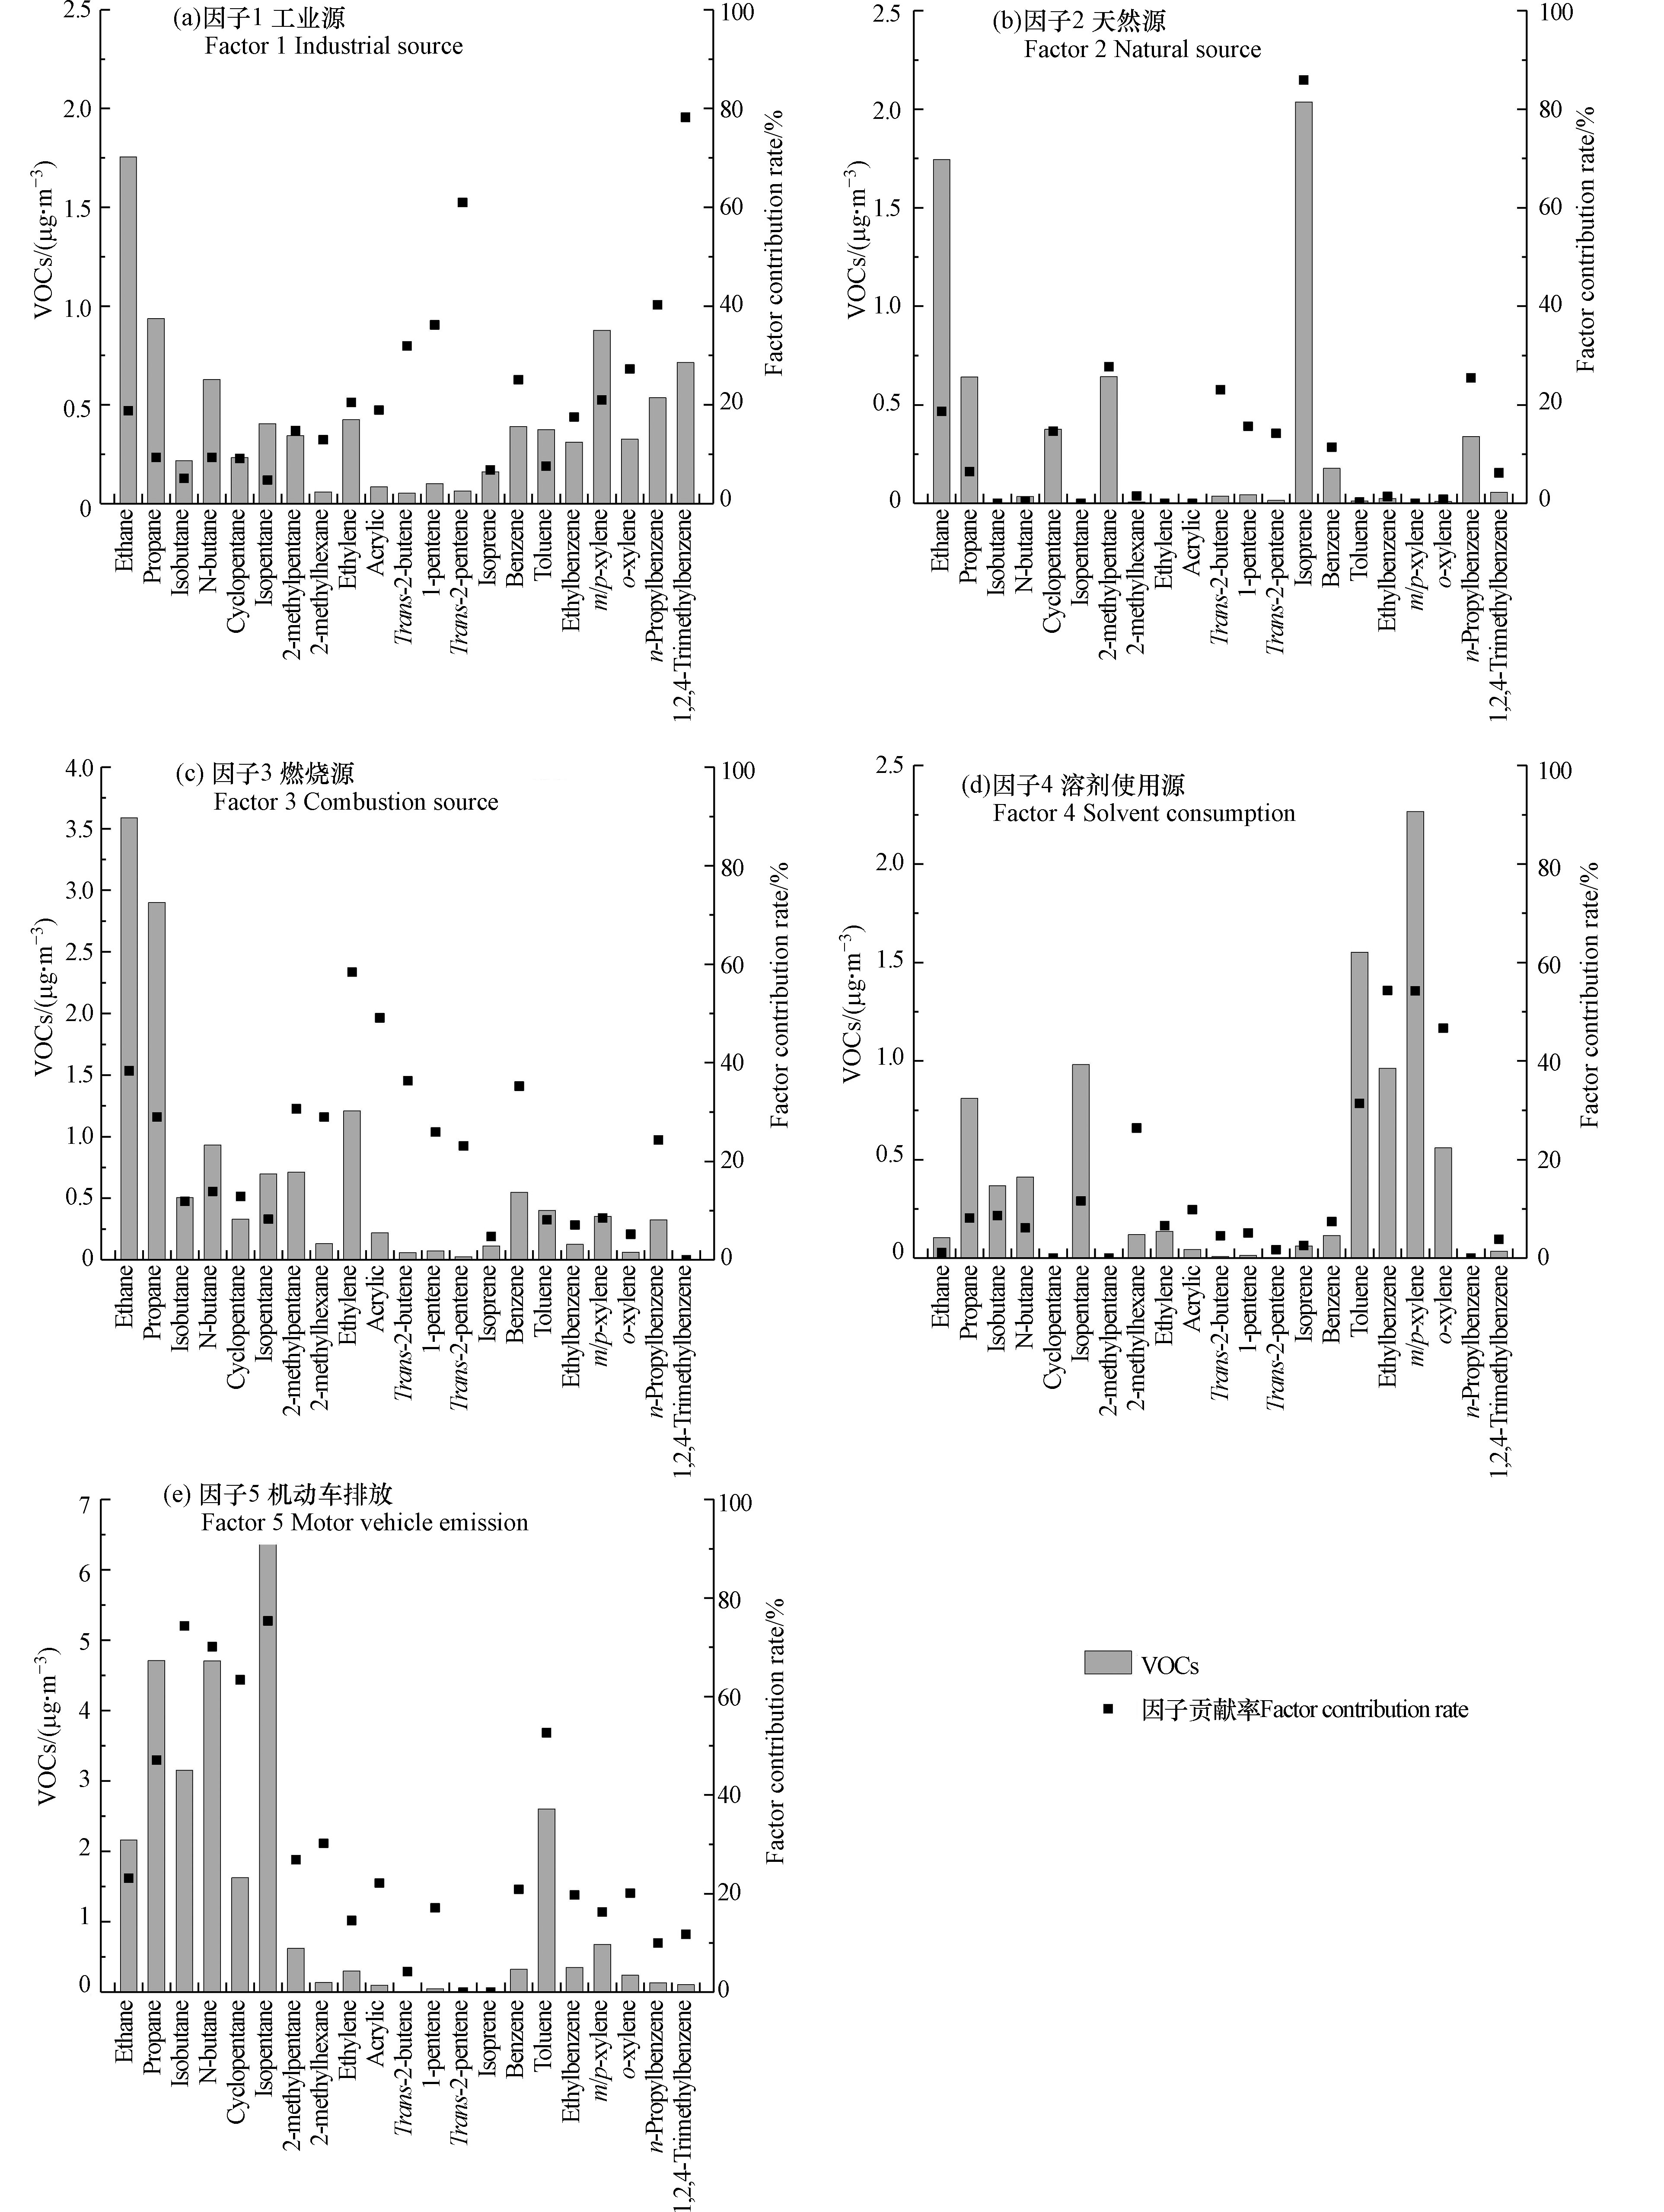
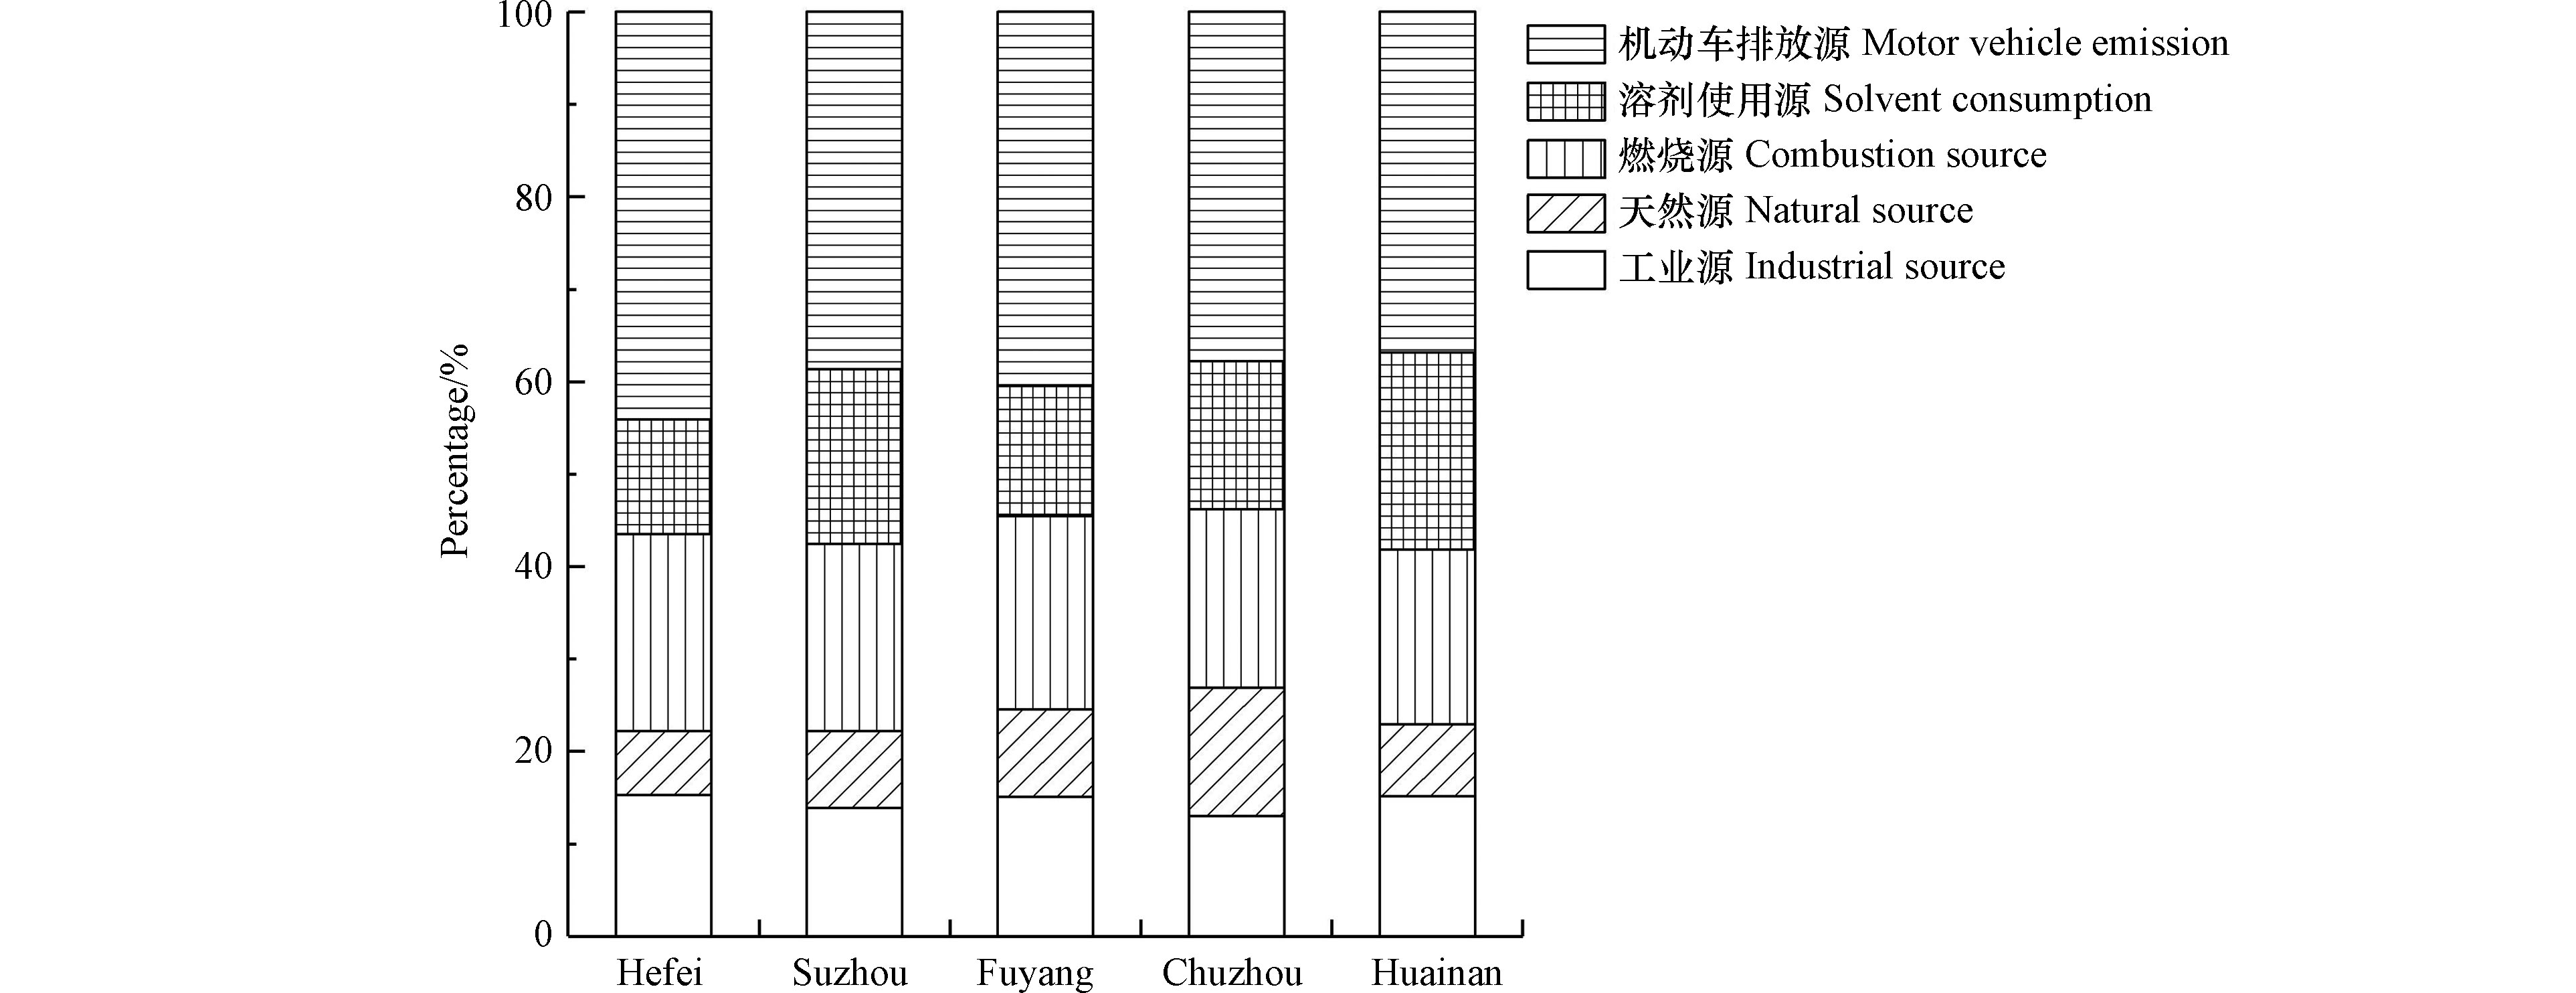
利用PMF模型对5个城市VOCs进行来源解析,例如合肥解析因子如图7所示,基本确定了5种较为合理的污染来源,其中,因子1中反−2−戊烯、1−戊烯和反−2−丁烯等烯烃类及1、2、4−三甲基苯、正丙苯等苯系物贡献率较高,主要由工业生产排放,故因子1为工业源;因子2中异戊二烯为主要贡献者,异戊二烯是植物排放的主要示踪物,故因子2为天然源;因子3中乙烷、丙烷、乙烯、丙烯等贡献率较高,且苯/甲苯比值大于1,具有典型的燃烧源特征,故因子3为燃烧源;因子4中乙基苯、间/对二甲苯、邻二甲苯为代表的苯系物贡献率较高,苯系物经常被用作溶剂使用的主要污染物,故因子4为溶剂使用源;因子5中正/异丁烷、环戊烷、异戊烷等低碳烃贡献率较高,主要由燃料燃烧排放,且苯/甲苯比值在0.5左右,一般认为大气中苯/甲苯比值在0.5附近可认为是机动车排放的特点,故因子5为机动车排放源. 以此类推,不同排放源对各城市大气VOCs的贡献率见图8,由解析结果可以看出,机动车排放源均为各城市贡献最大的污染源,合肥、宿州、阜阳、滁州和淮南贡献率分别为44.1%、38.7%、40.5%、37.8%和36.8%,其中合肥为省会城市,机动车保有量较大,其贡献率明显高于其他城市,这与前文B/T/E比值法推断机动车排放源在江淮区域大气苯系物排放中占重要贡献的结论基本一致. 其次是燃烧源,贡献率在19.3%—21.3%(淮南为18.9%),5个城市差异性不显著. 但各城市的溶剂使用源存在较大差别,其中淮南贡献率较高(为21.3%),合肥较低(为12.4%),推测与各城市溶剂使用工业结构不同有关[29]. 各城市的工业源贡献率在13.0%—15.3%之间,合肥工业企业数最多,其贡献略高于其他城市. 天然源贡献率整体较低,除滁州天然源的贡献率达13.9%,其余城市基本在8.0%左右,这可能与滁州的森林覆盖率(2020年达到35.5%)较高有关.
-
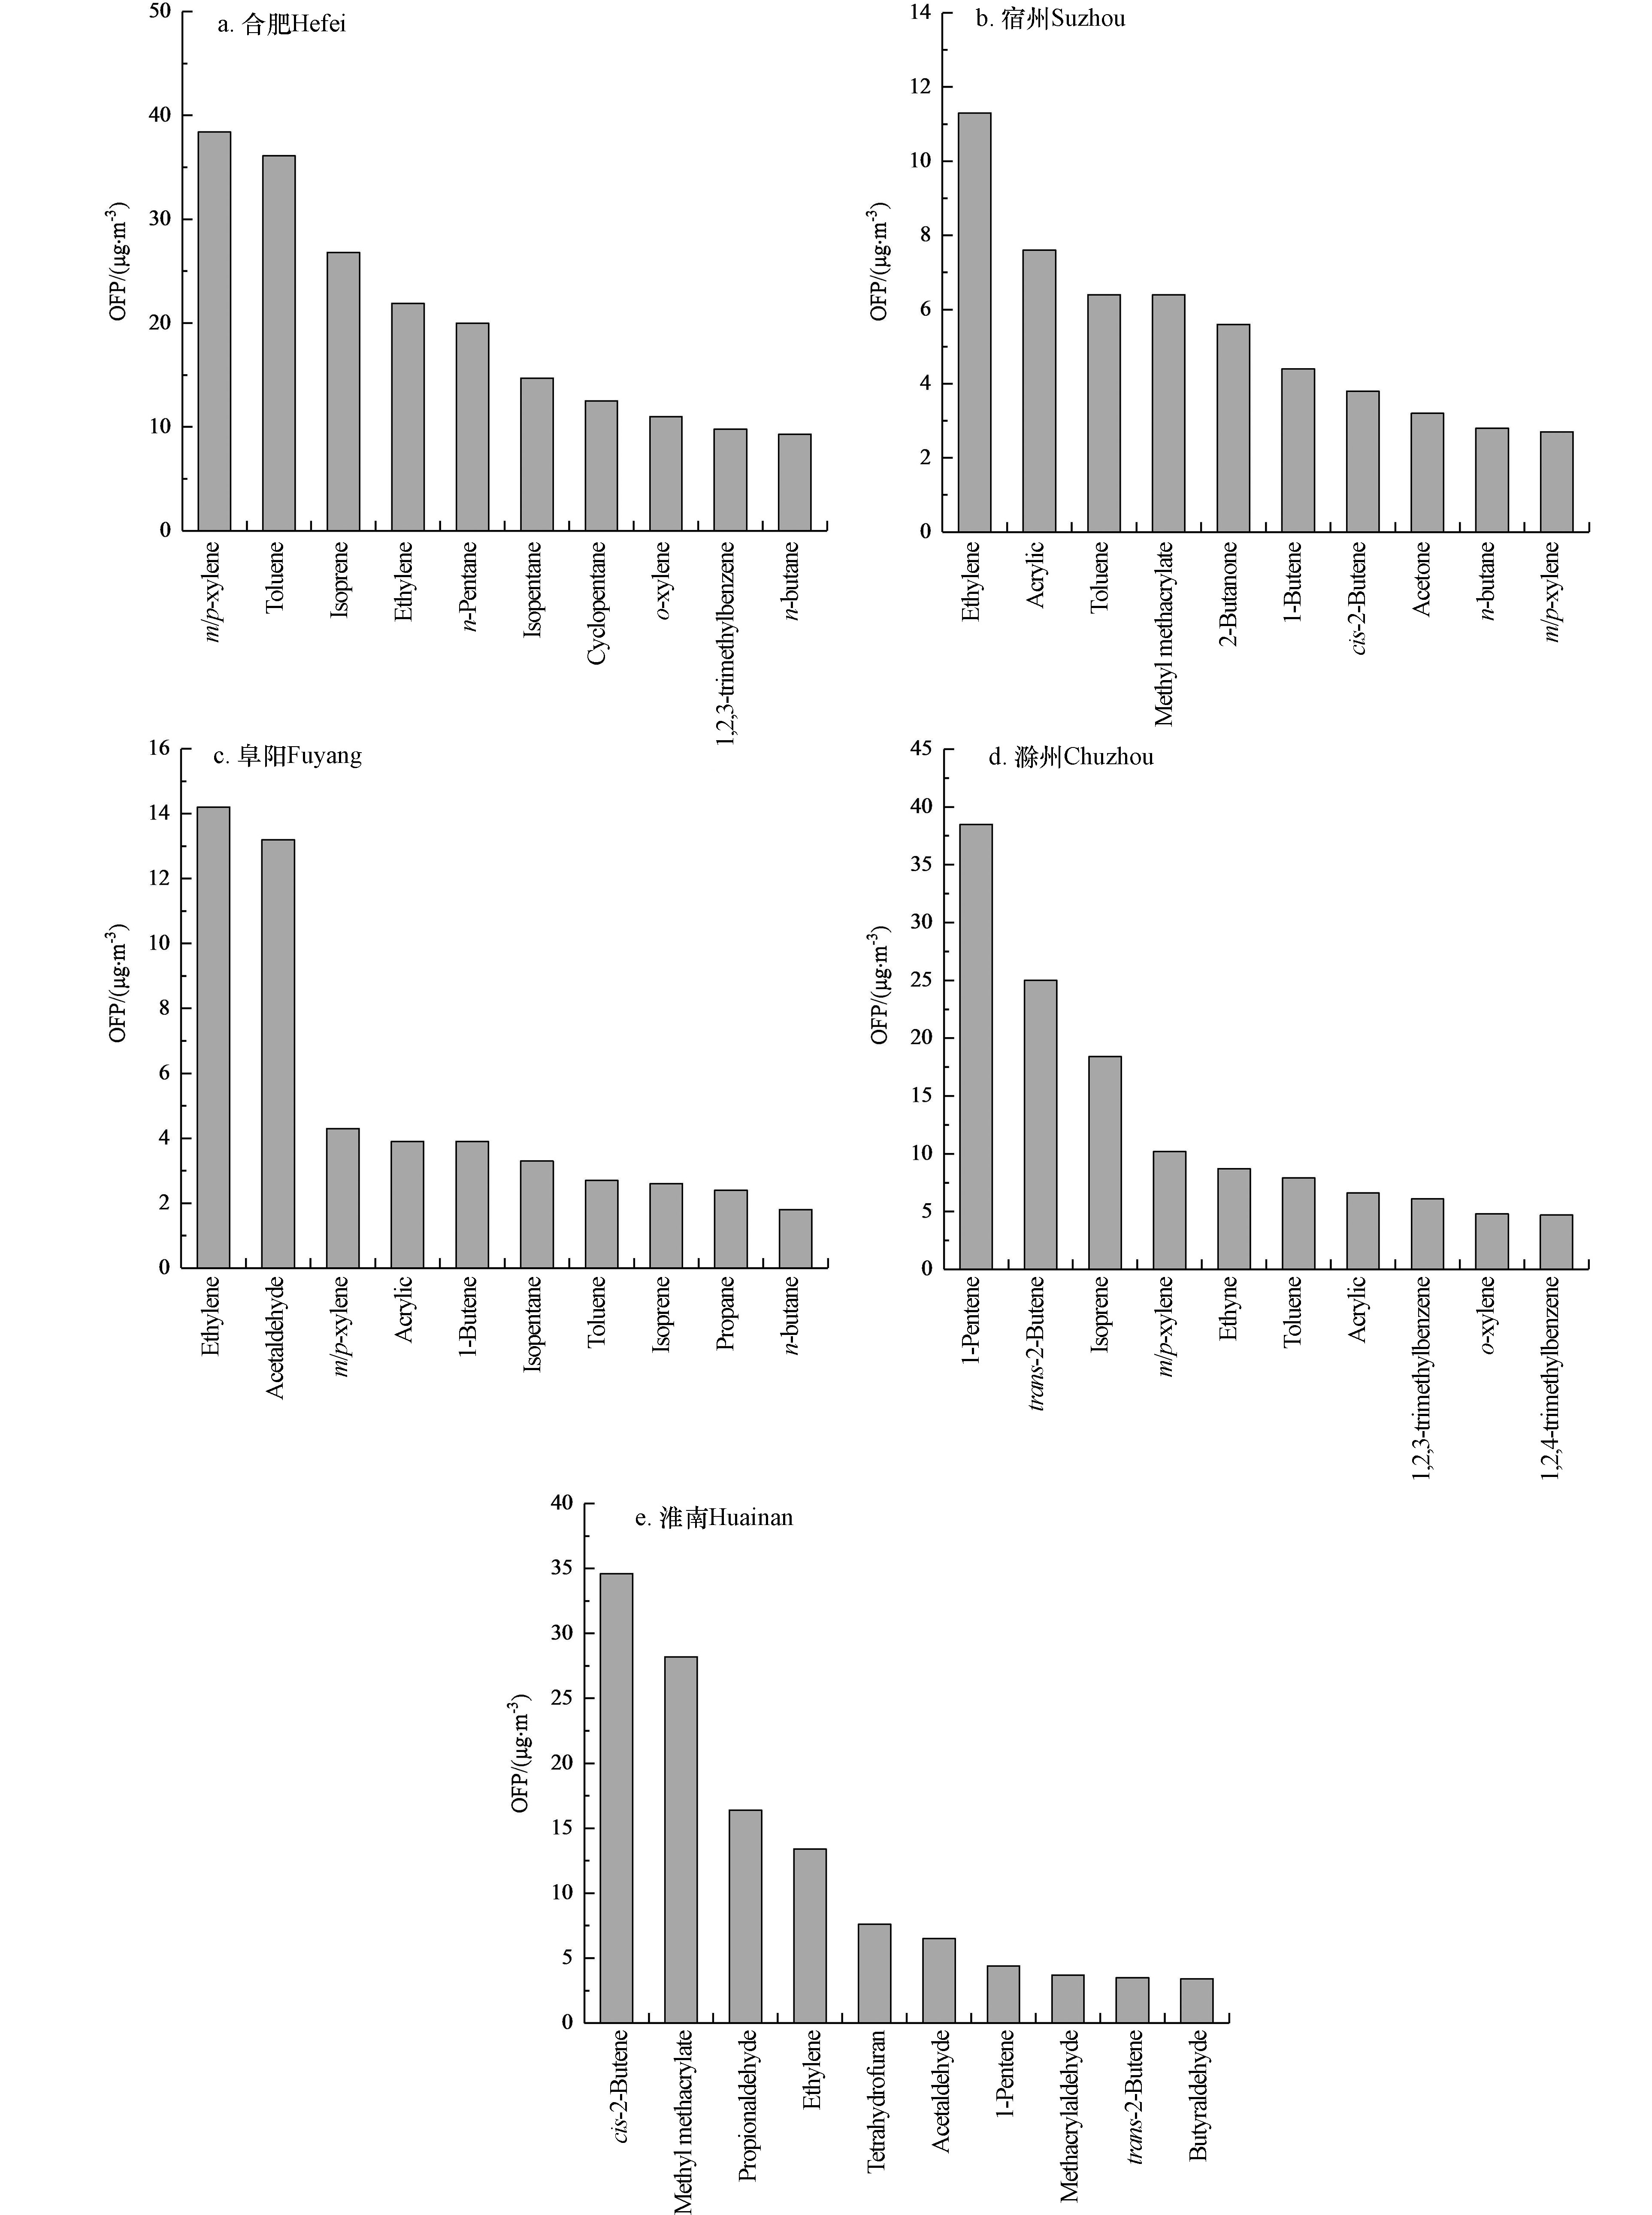
不同城市VOCs组分的OFP及其占比表明(图9),污染期间OFP由高到低依次为合肥(284.9 μg·m−3)、淮南(167.7 μg·m−3)、滁州(123.8 μg·m−3)、宿州(73.9 μg·m−3)和阜阳(62.1 μg·m−3),对其OFP影响最大的物种分别为芳香烃、OVOCs、烯烃、烯烃和烯烃;其中,5个城市大气环境中VOCs对OPF影响较大的前10物种累计OFP占总OFP分别为68.2%、70.7%、83.5%、66.4%和80.3%(图10). 除淮南OVOCs的OFP贡献较大外,其余城市中烯烃、芳香烃和烷烃等组分对OFP贡献相对较高;其中,芳香烃占比相对较低,但因该组分高MIR系数导致其对OFP的贡献占比最高;烷烃MIR系数相对较低,但绝对浓度较高,因此对OFP也有较大贡献.
为进一步研究9月上旬5个城市O3污染敏感控制属性,采用基于观测的OBM模型对其污染过程进行模拟分析,研判不同城市VOCs和NOx对O3生成的经验动力学关系[29-31]. 研究结果表明,阜阳和滁州两个城市的O3控制属性比较稳定,污染期间一直分别处于VOCs控制区和协同控制区;而合肥、宿州和淮南市的污染峰值期间(6日)处于VOCs控制区,其余日期多处于NOx和VOCs协同控制区,其中合肥O3超标日(7日)及其他日期均处于NOx和VOCs协同控制区(表3),这与前文推测合肥市O3控制属性与其NOx浓度较高相关的推测一致,需以一定比例协同降低NOx和VOCs才可以有效降低O3污染程度[46].
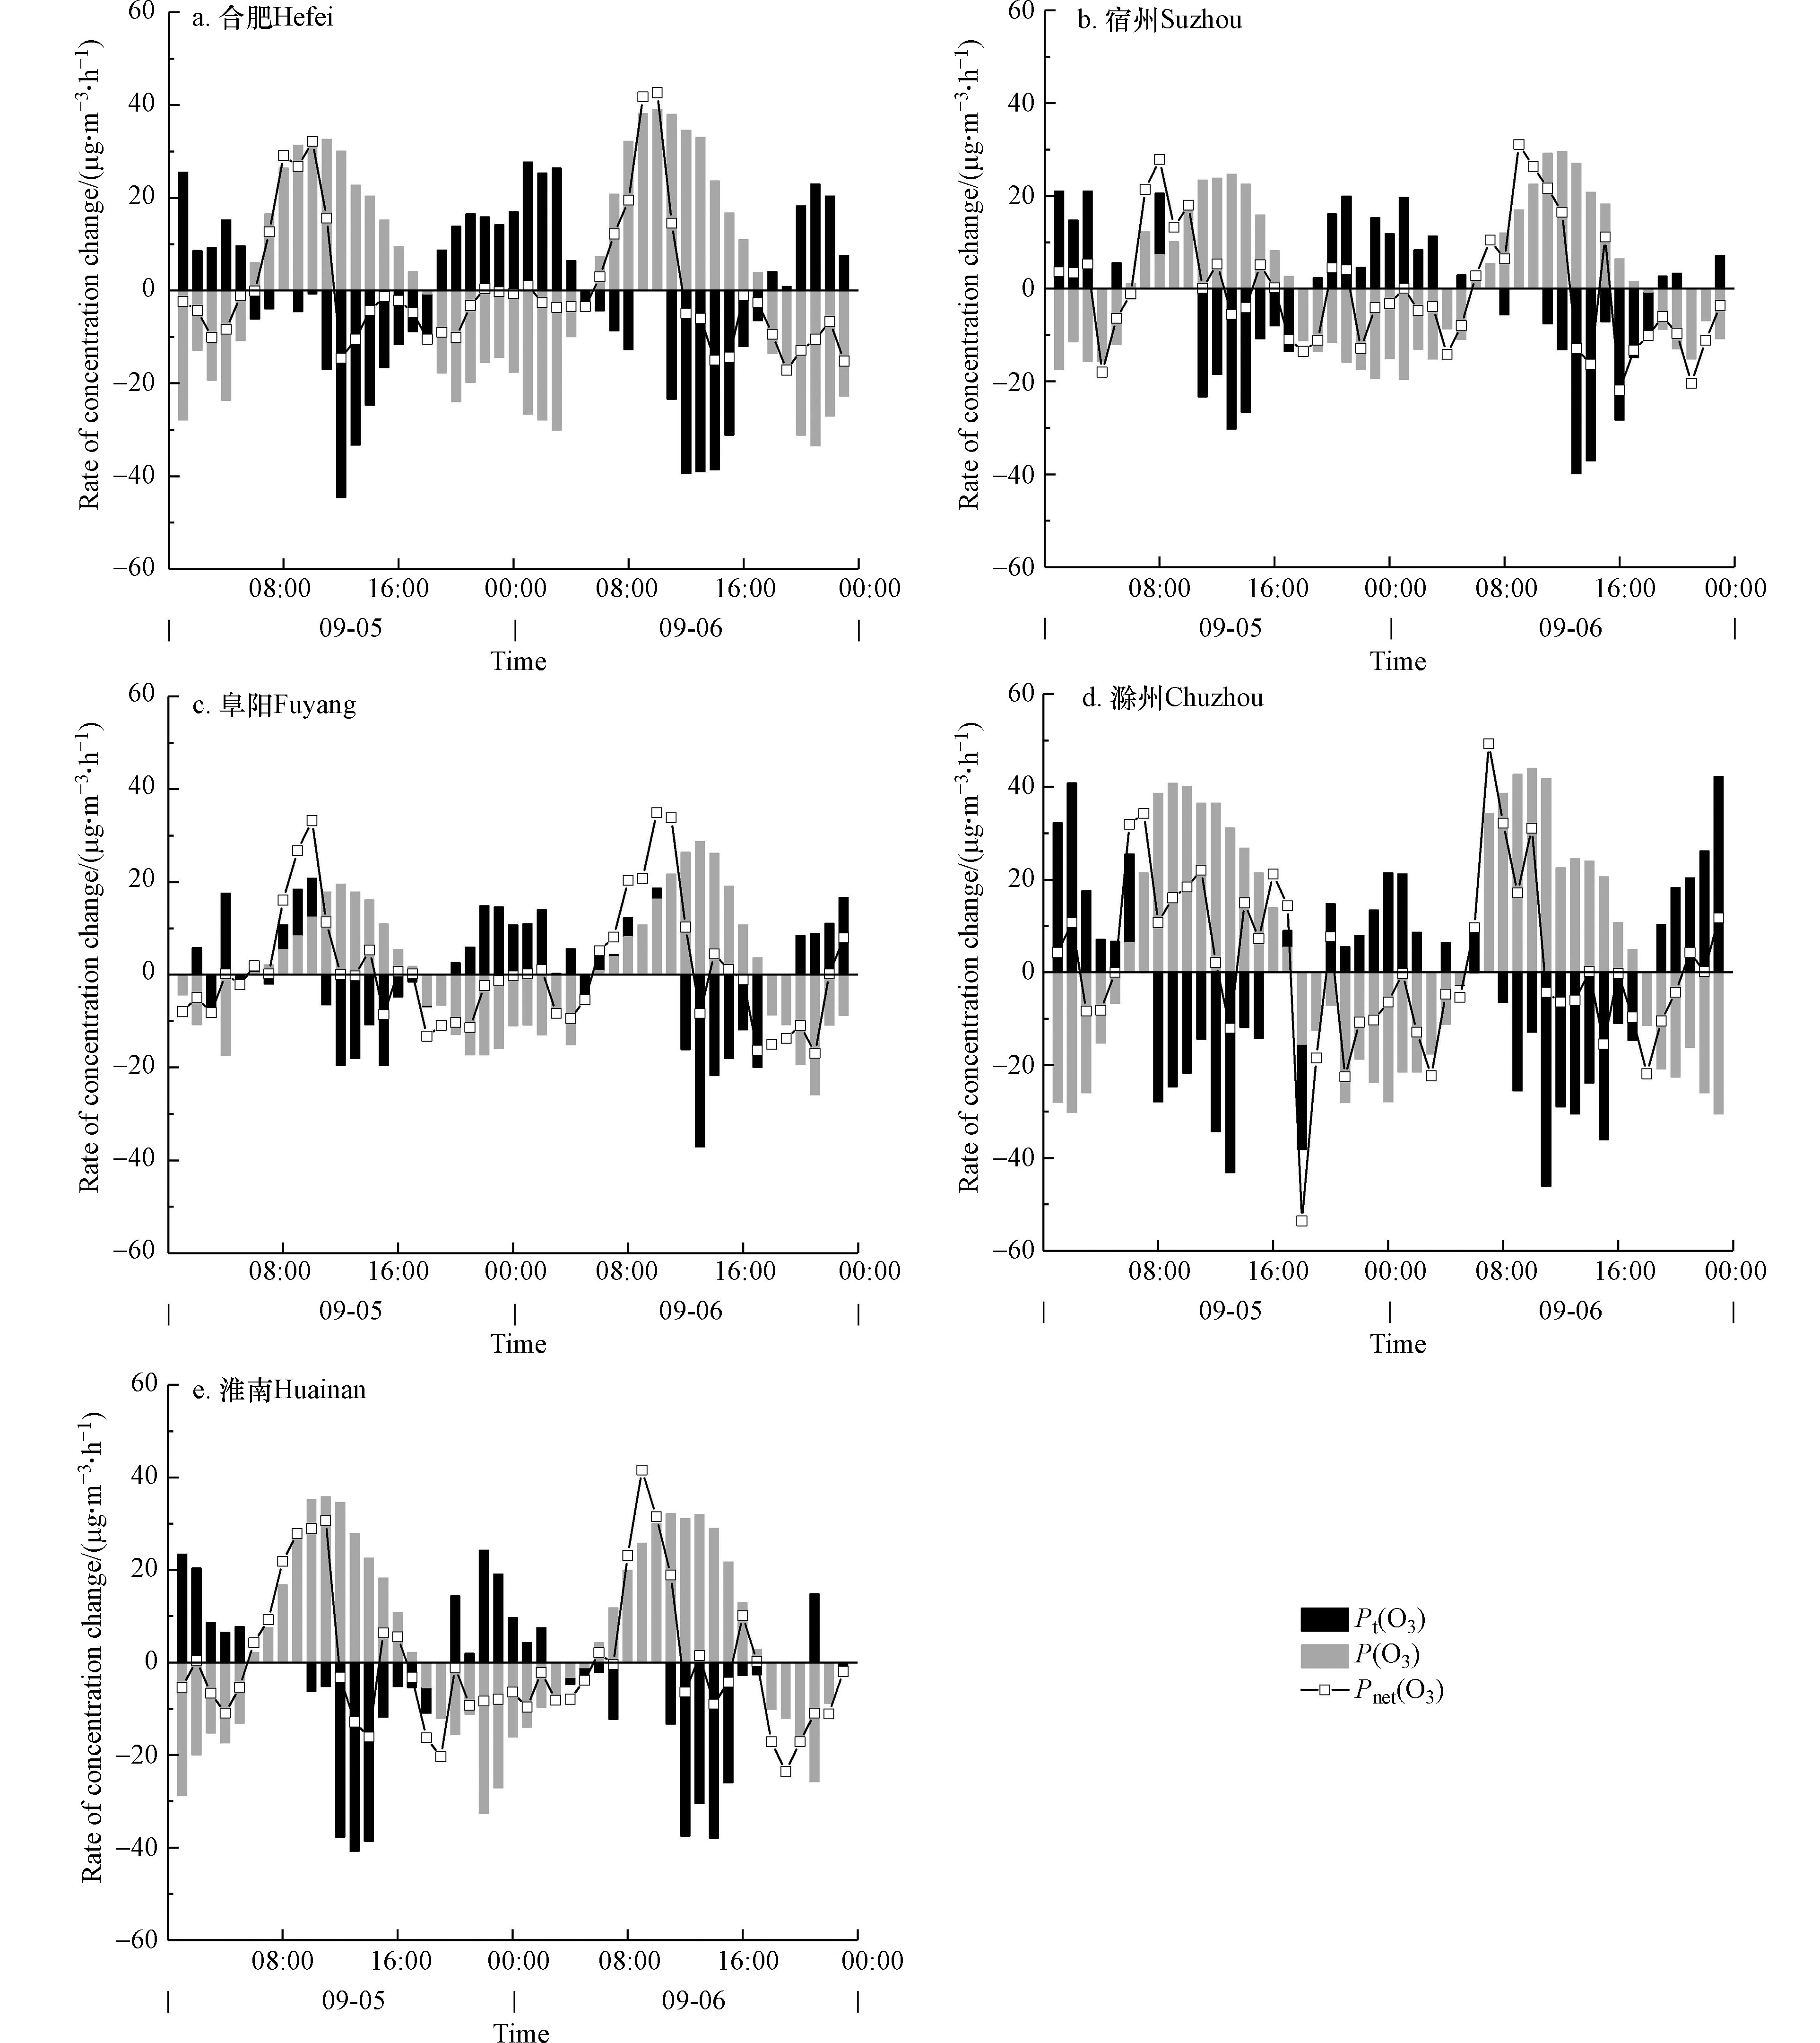
城市大气环境中O3的浓度变化是本地光化学过程和区域传输过程的综合结果,鉴于污染源清单的欠缺,O3的区域传输问题采用传统的网格化数值模型难以模拟出科学合理的结果,尤其是本次受台风(2020年9号台风“美莎克”)外围影响可能带来的垂直高空输送过程. 基于OBM模型的分析结果如图11所示,O3实际变化率Pnet(O3)采用临近时刻的浓度变化率代替,O3小时本地变化率P(O3)采用CB05机制的反应速率常数输出近似计算,区域传输变化率Pt(O3)采用P(O3)与Pnet(O3)的差(大于0、小于0分别表示对内和对外传输)[31].
模拟结果显示,合肥、宿州、阜阳、滁州和淮南均在8:00—13:00时受本地O3生成的影响较大,P(O3)分别为32、20、16、36、29 μg·m−3·h−1. 其中,滁州、淮南和合肥在白天的P(O3)峰值分别为44、35、39 μg·m−3·h−1,显著高于阜阳和宿州(均小于30 μg·m−3·h−1),这与前文滁州、淮南和合肥市VOCs浓度较高的结论一致,较高的光化学前体物浓度在适宜的条件下,O3生成速率一般较快[48]. 此外,5个城市存在不同程度的区域传输过程,合肥、宿州、滁州和淮南在20:00—3:00时对内输入的影响较大,平均输入量分别为17、10、19、10 μg·m−3·h−1. 阜阳在22:00—2:00和8:00—10:00时受区域传输的影响较大,平均输入量分别为11 μg·m−3·h−1. 合肥、宿州、阜阳、滁州和淮南均在12:00—15:00时对外输出的影响较大,平均输出量(Pt(O3)小于0)分别为33、23、20、28 、32 μg·m−3·h−1. 传输过程主要集中在白天O3高值时段(12:00—15:00)的对外传输和夜间的对内输入,临近苏南地区(O3污染相对较重区域)的滁州市在夜间的输入速率甚至超过30 μg·m−3·h−1,其中夜间的对内输入(推测为高空输入)可能是本次污染过程夜间二次浓度峰值的主要原因之一.
-
(1)受高温、低湿、小风等适宜气象条件影响,9月上旬安徽省江淮地区5个城市(合肥、宿州、阜阳、滁州、和淮南)经历了一次区域性O3污染过程,6日达到O3污染峰值232 μg·m−3;其中,滁州与淮南O3浓度最高,达到日均中度污染水平,小时浓度超标率平均达到6.7%,且O3污染过程的日变化均呈现非典型的双峰特征,在白天下午(13:00—15:00)和夜间(0:00—4:00)分别呈现一个O3高峰和O3次高峰.
(2)污染期间,5个城市VOCs污染程度由高到低分别为合肥、淮南、滁州、宿州和阜阳;其中,交通移动源和工业排放及燃烧过程对VOCs的贡献在高值时段占据主导地位. 基于特征物(BTEX)比值法和PMF模型分析表明机动车排放源为各城市VOCs贡献最大的污染源,5个城市的机动车排放源贡献率分别高达44.1%(合肥)、36.8%(淮南)、37.8%(滁州)、38.7%(宿州)和40.5%(阜阳);其次是燃烧源、溶剂使用源、工业源和天然源;各城市的溶剂使用源存在较大差别,贡献范围为12.4%(合肥)—21.3%(淮南),这可能与溶剂使用结构不同有关;合肥工业源贡献(15.3%)略高于其他城市1—2个百分点;除滁州外(13.9%),天然源的贡献率基本在8.0%左右.
(3)污染期间,主要VOCs组分的OFP差异显著,OFP由高到低分别为合肥(284.9 μg·m−3)、淮南(167.7 μg·m−3)、滁州(123.8 μg·m−3)、宿州(73.9 μg·m−3)和阜阳(62.1 μg·m−3);除淮南OVOCs的OFP贡献较大外,其余城市中烯烃、芳香烃和烷烃等组分对OFP贡献最高,与国内其他城市的组成比例具有一定的相似性.
(4)污染期间,合肥、宿州和淮南3个城市存在O3污染控制区属性的变化,其中合肥O3超标日(6日)属于NOx和VOCs协同控制区. O3的污染收支来源主要以本地生成为主;与阜阳和宿州(皖北城市)相比,滁州、淮南和合肥的O3本地生成速率相对更快,平均分别高达32、36、29 μg·m−3·h−1,比皖北城市高9—20μg·m−3·h−1;夜间的对内输入可能是本次污染夜间二次浓度峰值(M型双峰)的主要原因.
江淮地区城市O3污染过程的非典型特征及其前体物来源分析
Atypical characteristics of urban O3 pollution process and the source analysis of precursor pollutants in Yangtze−huaihe Region
-
摘要: 为了研究江淮地区典型城市的O3污染来源,该文对一次典型O3污染过程(2020年9月1—10日)开展了多参数的监测分析,综合多种方法分析了江淮区域的O3和挥发性有机物(VOCs)污染特征及其来源. 结果表明,江淮地区城市(合肥、宿州、阜阳、滁州和淮南)O3浓度的日变化均呈现出非典型的 “双峰”特征(日间和夜间均有污染峰值). 污染期间VOCs的污染程度由高到低分别为合肥、淮南、滁州、宿州和阜阳;其中,机动车排放源为该区域城市VOCs污染贡献最大的来源,贡献率分别高达44.1%、36.8%、37.8%、38.7%和40.5%;其次是燃烧源(18.9%—21.3%)、溶剂使用源(12.4%—21.3%)、工业源(13.0%—15.3%)和天然源(除滁州为13.9%外,其余为8.0%左右). O3生成潜势(OFP)分析表明,除OVOCs对淮南市OFP贡献较高外,其余城市中烯烃、芳香烃等组分对OFP贡献最高,OFP由高到低分别为合肥(284.9 μg·m−3)、淮南(167.7 μg·m−3)、滁州(123.8 μg·m−3)、宿州(73.9 μg·m−3)和阜阳(62.1 μg·m−3). O3的污染主要以本地生成为主,其中滁州、淮南和合肥的O3本地生成速率平均分别高达32 μg·m−3·h−1、36 μg·m−3·h−1和29 μg·m−3·h−1,比皖北城市(阜阳和宿州)高9—20 μg·m−3·h−1;O3传输过程主要表现为白天高浓度时段的对外传输和夜间的对内输入.
-
关键词:
- O3 /
- VOCs /
- OFP /
- 正定矩阵因子分析(PMF) /
- 来源分析
Abstract: A typical O3 pollution episode occurred during September 1 to 10 in 2020 in the Yangtze-Huaihe region , which was researched to reveal the source of O3. In this paper, the characteristics and sources of O3 and precursor pollutants (VOCs) were researched based on multi parameter monitoring data and analysis methods. The results showed that the daily variation feature of O3 concentration in Yangtze-Huaihe region (Hefei, Suzhou, Fuyang, Chuzhou and Huainan) presented an atypical "double peaks" structure. Meanwhile, the peak value both appeared in daytime and nighttime. During the pollution episode, the order of the VOCs concentration from high to low was Hefei, Huainan, Chuzhou, Suzhou, and Fuyang. Motor vehicle emission was the most important source of VOCs and it respectively accounted for 44.1%, 36.8%, 37.8%, 38.7% and 40.5% of VOCs concentration in the five cities. In addition, the others emission sources included combustion source (18.9%—21.3%), solvent consumption source (12.4%—21.3%), industrial source (13.0%—15.3%) and natural source (13.9% for Chuzhou and about 8% for the other four cities). The ranked of O3 formation potential (OFP) value from high to low was Hefei (284.97 μg·m−3), Huainan (167.77 μg·m−3), Chuzhou (123.87 μg·m−3), Suzhou (73.97 μg·m−3) and Fuyang (62.17 μg·m−3). The most important contributors for OFP were OVOCs in Huainan and the olefins, aromatic hydrocarbons in the other four cities. Local generation was main method for O3 pollution. O3 local generation rate was 32, 36, 29 μg·m−3·h−1 respectively for Chuzhou, Huainan and Hefei, which was obviously higher than it in the cities in the north of Anhui province with the value during 9 μg·m−3·h−1 to 20 μg·m−3·h−1. The transmission characteristics of O3 represented external transmission during high concentration period in the daytime and internal transmission at night.-
Key words:
- O3 /
- VOCs /
- OFP /
- positive definite matrix factor analysis(PMF) /
- source analysis
-
表 1 污染期间合肥、宿州、阜阳、滁州和淮南TVOCs浓度与国内其他城市对比
Table 1. Comparison of TVOCs concentrations in Hefei, Suzhou, Fuyang, Chuzhou and Huainan during the pollution period with other cities in China
城市 City 观测时间 Observation time TVOCs平均值/(μg·m−3)Average value 标准偏差/(μg·m−3)Standard deviation 最大值/(μg·m−3)Maximum value 最小值/(μg·m−3)Minimum value 合肥 2020年9月 112 63 288 30 宿州 2020年9月 40 28 159 11 阜阳 2020年9月 30 14 93 12 滁州 2020年9月 43 23 93 8 淮南 2020年9月 58 23 131 5 石家庄[30] 2017年1月—2018年1月 137.2 64.6 316.9 29.0 天津[39] 2019年1—12月 48.9 — 69.9 34.6 邯郸[40] 2017年10月 102.2 45.8 358.4 49.1 注:“—”表示参考文献中没有相关数据. 表 2 高值时段的VOCs物种
Table 2. VOCs species in high−value periods
观测时段Observation time 城市City 高值物种High concentration species 潜在排放源Potential emission source 3—6日 合肥 正戊烷、异戊烷、丙烷、甲苯、乙烷 交通移动源 宿州 丙酮、丙烷、乙烷、正丁烷、2-丁酮 交通移动源、化工、溶剂使用、光化学生成 阜阳 丙烷、乙烷、乙醛、异戊烷、乙烯 交通移动源、光化学生成、工业源 滁州 1-戊烯、正丁烷、丙烷、乙炔、异丁烷 交通移动源、油气行业、工业源 淮南 丙酮、乙酸乙酯、乙烷、顺-2-丁烯、乙醛 溶剂使用、油气行业、光化学生成、移动源 9日 合肥 正戊烷、环戊烷、丙烷、异戊烷、乙烷 交通移动源、溶剂使用 宿州 丙酮、丙烷、乙烷、正丁烷、三氯甲烷 交通移动源、有机化工、光化学生成 阜阳 丙烷、异戊烷、乙烷、正戊烷、乙醛 交通移动源、光化学生成 滁州 1-戊烯、丙烷、甲苯、正丁烷、乙炔 交通移动源、油气行业、工业源 淮南 丙酮、氯乙烯、二氯甲烷、乙炔、乙烷 有机化工、光化学生成、移动源 表 3 9月1—10日5个城市O3污染的控制属性
Table 3. Control properties of O3 pollution from September 1th to 10th in the cities
城市City 日期Date O3污染控制属性Control properties of O3 pollution 合肥 6日、9日 VOCs控制区 1—5日、7—8日、10日 NOx和VOCs控制区 宿州 6日、9日 VOCs控制区 1—5日、7—8日、10日 NOx和VOCs控制区 阜阳 1—10日 VOCs控制区 滁州 1—10日 NOx和VOCs协同控制区 淮南 6日、7日、9日 VOCs控制区 1—5日、8日、10日 NOx和VOCs协同控制区 -
[1] 赵辉, 郑有飞, 李硕, 等. 我国近地层O3污染及其风险评估研究进展 [J]. 环境化学, 2019, 38(12): 2709-2718. doi: 10.7524/j.issn.0254−6108.2019011701 ZHAO H, ZHENG Y F, LI S, et al. Research progress on ground−level O3 pollution and its risk assessment in China [J]. Environmental Chemistry, 2019, 38(12): 2709-2718(in Chinese). doi: 10.7524/j.issn.0254−6108.2019011701
[2] 李如梅, 武媛媛, 彭林, 等. 朔州市夏季环境空气中VOCs的污染特征及来源解析 [J]. 环境化学, 2017, 36(5): 984-993. doi: 10.7524/j.issn.0254−6108.2017.05.2016111603 LI R M, WU Y Y, PENG L, et al. Characteristics and sources apportionment of ambient volatile organic compounds(VOCs) in summer in Shuozhou [J]. Environmental Chemistry, 2017, 36(5): 984-993(in Chinese). doi: 10.7524/j.issn.0254−6108.2017.05.2016111603
[3] 张亮林, 潘竟虎. 中国PM2.5人口暴露风险时空格局 [J]. 中国环境科学, 2020, 40(1): 1-12. doi: 10.3969/j.issn.1000−6923.2020.01.001 ZHANG L L, PAN J H. Spatial-temporal pattern of population exposure risk to PM2.5 in China [J]. China Environmental Science, 2020, 40(1): 1-12(in Chinese). doi: 10.3969/j.issn.1000−6923.2020.01.001
[4] DI Q, WANG Y, ZANOBETTI A. Air pollution and mortality in the medicare population [J]. New England Journal of Medicine, 2017, 376(26): 1498-2522. [5] HU H, HA S D, XU X H. Ozone and hypertensive disorders of pregnancy in Florida: Identifying critical windows of exposure [J]. Environmental Research, 2017, 153: 120-125. doi: 10.1016/j.envres.2016.12.002 [6] 洪莹莹, 翁佳烽, 谭浩波, 等. 珠江三角洲秋季典型O3污染的气象条件及贡献量化 [J]. 中国环境科学, 2021, 41(1): 1-10. doi: 10.3969/j.issn.1000−6923.2021.01.001 HONG Y Y, WENG J F, TAN H B, et al. Meteorological conditions and contribution quantification of typical ozone pollution during autumn in Pearl River Delta [J]. China Environmental Science, 2021, 41(1): 1-10(in Chinese). doi: 10.3969/j.issn.1000−6923.2021.01.001
[7] CARDELINO C A, CHAMEIDES W L. An observation-based model for analyzing ozone precursor relationships in the urban atmosphere [J]. Journal of the Air & Waste Management Association, 1995, 45(3): 161-180. [8] UTEMBE S R, WATSON L A, SHALLCROSS D E, et al. A common representative intermediates (CRI) mechanism for VOC degradation. part 3: development of a secondary organic aerosol module [J]. Atmospheric Environment, 2009, 43(12): 1982-1990. doi: 10.1016/j.atmosenv.2009.01.008 [9] ZHANG X M, WANG D, LIU Y, et al. Characteristics and ozone formation potential of volatile organic compounds in emissions from a typical Chinese coking plant [J]. Journal of Environmental Sciences, 2020, 95: 183-189. doi: 10.1016/j.jes.2020.03.018 [10] DU Z J, MO J H, ZHANG Y P. Risk assessment of population inhalation exposure to volatile organic compounds and carbonyls in urban China [J]. Environment International, 2014, 73: 33-45. doi: 10.1016/j.envint.2014.06.014 [11] 郭云, 蒋玉丹, 黄炳昭, 等. 我国大气PM2.5及O3导致健康效益现状分析及未来10年预测 [J]. 环境科学研究, 2021, 34(4): 1023-1032. GUO Y, JIANG Y D, HUANG B Z, et al. Health impact of PM2.5 and O3 and forecasts for next 10 years in China [J]. Research of Environmental Sciences, 2021, 34(4): 1023-1032(in Chinese).
[12] DU Z J, MO J H, ZHANG Y P, et al. Benzene, toluene and xylenes in newly renovated homes and associated health risk in Guangzhou, China [J]. Building and Environment, 2014, 72: 75-81. doi: 10.1016/j.buildenv.2013.10.013 [13] WEI W, CHENG S Y, LI G H, et al. Characteristics of ozone and ozone precursors (VOCs and NOx) around a petroleum refinery in Beijing, China [J]. Journal of Environmental Sciences, 2014, 26(2): 332-342. doi: 10.1016/S1001-0742(13)60412-X [14] WANG G, CHENG S Y, WEI W, et al. Characteristics and source apportionment of VOCs in the suburban area of Beijing, China [J]. Atmospheric Pollution Research, 2016, 7(4): 711-724. doi: 10.1016/j.apr.2016.03.006 [15] ZHU J, WANG S S, WANG H L, et al. Observationally constrained modeling of atmospheric oxidation capacity and photochemical reactivity in Shanghai, China [J]. Atmospheric Chemistry and Physics, 2020, 20(3): 1217-1232. doi: 10.5194/acp-20-1217-2020 [16] MO Z W, SHAO M, LU S H, et al. Characterization of non-methane hydrocarbons and their sources in an industrialized coastal city, Yangtze River Delta, China [J]. Science of the Total Environment, 2017, 593/594: 641-653. doi: 10.1016/j.scitotenv.2017.03.123 [17] 叶听听, 江飞, 易福金, 等. 长三角地区春季臭氧污染特征及其对冬小麦产量的影响 [J]. 环境科学研究, 2017, 30(7): 991-1000. YE T T, JIANG F, YI F J, et al. Characteristics of ozone pollution and its impact on winter wheat yield in the Yangtze River Delta in spring [J]. Research of Environmental Sciences, 2017, 30(7): 991-1000(in Chinese).
[18] TIE X X, GENG F H, PENG L, et al. Measurement and modeling of O3 variability in Shanghai, China: Application of the WRF-Chem model [J]. Atmospheric Environment, 2009, 43(28): 4289-4302. doi: 10.1016/j.atmosenv.2009.06.008 [19] HUANG C F, CHEN C H, LI L, et al. Emission inventory of anthropogenic air pollutants and VOC species in the Yangtze River Delta region, China [J]. Atmospheric Chemistry and Physics, 2011, 11(9): 4105-4120. doi: 10.5194/acp-11-4105-2011 [20] 陆克定, 张远航, 苏杭, 等. 珠江三角洲夏季臭氧区域污染及其控制因素分析 [J]. 中国科学:化学, 2010, 40(4): 407-420. doi: 10.1360/zb2010−40−4−407 LU K D, ZHANG Y H, SU H, et al. Regional ozone pollution and key controlling factors of photochemical ozone production in Pearl River Delta during summer time [J]. Scientia Sinica (Chimica), 2010, 40(4): 407-420(in Chinese). doi: 10.1360/zb2010−40−4−407
[21] ZHANG Y L, WANG X M, ZHANG Z, et al. Sources of C2-C4 alkenes, the most important ozone nonmethane hydrocarbon precursors in the Pearl River Delta region [J]. Science of the Total Environment, 2015, 502: 236-245. doi: 10.1016/j.scitotenv.2014.09.024 [22] 颜敏, 尹魁浩, 梁永贤, 等. 深圳市夏季臭氧污染研究 [J]. 环境科学研究, 2012, 25(4): 411-418. YAN M, YIN K H, LIANG Y X, et al. Ozone pollution in summer in Shenzhen city [J]. Research of Environmental Sciences, 2012, 25(4): 411-418(in Chinese).
[23] ZOU Y, DENG X J, ZHU D, et al. Characteristics of 1 year of observational data of VOCs, NOx and O3 at a suburban site in Guangzhou, China [J]. Atmospheric Chemistry and Physics, 2015, 15(12): 6625-6636. doi: 10.5194/acp−15−6625−2015 [24] DENG Y Y, LI J, LI Y Q, et al. Characteristics of volatile organic compounds, NO2, and effects on ozone formation at a site with high ozone level in Chengdu [J]. Journal of Environmental Sciences, 2019, 75: 334-345. doi: 10.1016/j.jes.2018.05.004 [25] 徐晨曦, 陈军辉, 韩丽, 等. 成都市2017年夏季大气VOCs污染特征、臭氧生成潜势及来源分析 [J]. 环境科学研究, 2019, 32(4): 619-626. XU C X, CHEN J H, HAN L, et al. Analyses of pollution characteristics, ozone formation potential and sources of VOCs atmosphere in Chengdu city in summer 2017 [J]. Research of Environmental Sciences, 2019, 32(4): 619-626(in Chinese).
[26] 缑亚峰, 余欢, 王成, 等. PM2.5化学组成观测设计对PMF源解析结果影响综述 [J]. 环境化学, 2020, 39(7): 1744-1753. doi: 10.7524/j.issn.0254−6108.2020020301 GOU Y F, YU H, WANG C, et al. Review: Influence of PM2.5 composition measurement design on source apportionment using positive matrix factorization (PMF) [J]. Environmental Chemistry, 2020, 39(7): 1744-1753(in Chinese). doi: 10.7524/j.issn.0254−6108.2020020301
[27] LI J, HAO Y F, SIMAYI M, et al. Verification of anthropogenic VOC emission inventory through ambient measurements and satellite retrievals [J]. Atmospheric Chemistry and Physics, 2019, 19(9): 5905-5921. doi: 10.5194/acp−19−5905−2019 [28] 齐安安, 周小平, 雷春妮, 等. 兰州市功能区环境空气中挥发性有机物关键活性组分与来源解析 [J]. 环境化学, 2020, 39(11): 3083-3093. doi: 10.7524/j.issn.0254−6108.2019080402 QI A A, ZHOU X P, LEI C N, et al. Key active components and sources of volatile organic compounds in ambient air of Lanzhou City [J]. Environmental Chemistry, 2020, 39(11): 3083-3093(in Chinese). doi: 10.7524/j.issn.0254−6108.2019080402
[29] 李颖慧, 李如梅, 胡冬梅, 等. 太原市不同功能区环境空气中挥发性有机物特征与来源解析 [J]. 环境化学, 2020, 39(4): 920-930. doi: 10.7524/j.issn.0254−6108.2019110804 LI Y H, LI R M, HU D M, et al. Characteristics and source apportionment of ambient volatile organic compounds of different functional areas in Taiyuan City [J]. Environmental Chemistry, 2020, 39(4): 920-930(in Chinese). doi: 10.7524/j.issn.0254−6108.2019110804
[30] 王帅, 崔建升, 冯亚平, 等. 石家庄市挥发性有机物和臭氧的污染特征及源解析 [J]. 环境科学, 2020, 41(12): 5325-5335. WANG S, CUI J S, FENG Y P, et al. Characteristics and source apportionment of VOCs and O3 in Shijiazhuang [J]. Environmental Science, 2020, 41(12): 5325-5335(in Chinese).
[31] 韩丽, 陈军辉, 姜涛, 等. 基于观测模型的成都市臭氧污染敏感性研究 [J]. 环境科学学报, 2020, 40(11): 4092-4104. HAN L, CHEN J H, JIANG T, et al. Sensitivity analysis of atmospheric ozone formation to its precursors in Chengdu with an observation based model [J]. Acta Scientiae Circumstantiae, 2020, 40(11): 4092-4104(in Chinese).
[32] 沈劲, 黄晓波, 汪宇, 等. 广东省臭氧污染特征及其来源解析研究 [J]. 环境科学学报, 2017, 37(12): 4449-4457. SHEN J, HUANG X B, WANG Y, et al. Study on ozone pollution characteristics and source apportionment in Guangdong Province [J]. Acta Scientiae Circumstantiae, 2017, 37(12): 4449-4457(in Chinese).
[33] 石春娥, 杨关盈, 张浩, 等. 安徽省臭氧污染特征及其气象成因 [J]. 三峡生态环境监测, 2020, 5(3): 71-84. SHI C E, YANG G Y, ZHANG H, et al. Characteristics and meteorological causes of ozone pollution in Anhui Province [J]. Ecology and Environmental Monitoring of Three Gorges, 2020, 5(3): 71-84(in Chinese).
[34] 赵旭辉, 董昊, 季冕, 等. 合肥市O3污染时空变化特征及影响因素分析 [J]. 环境科学学报, 2018, 38(2): 649-660. ZHAO X H, DONG H, JI M, et al. Analysis on the spatial-temporal distribution characteristics of O3 and its influencing factors in Hefei City [J]. Acta Scientiae Circumstantiae, 2018, 38(2): 649-660(in Chinese).
[35] 伏志强, 戴春皓, 王章玮, 等. 长沙市夏季大气臭氧生成对前体物的敏感性分析 [J]. 环境化学, 2019, 38(3): 531-538. doi: 10.7524/j.issn.0254−6108.2018042503 FU Z Q, DAI C H, WANG Z W, et al. Sensitivity analysis of atmospheric ozone formation to its precursors in summer of Changsha [J]. Environmental Chemistry, 2019, 38(3): 531-538(in Chinese). doi: 10.7524/j.issn.0254−6108.2018042503
[36] CARTER W P L. Development of a condensed SAPRC−07 chemical mechanism [J]. Atmospheric Environment, 2010, 44(40): 5336-5345. doi: 10.1016/j.atmosenv.2010.01.024 [37] BUZCU B, FRASER M P. Source identification and apportionment of volatile organic compounds in Houston, TX [J]. Atmospheric Environment, 2006, 40(13): 2385-2400. doi: 10.1016/j.atmosenv.2005.12.020 [38] TAN Z F, LU K D, JIANG M Q, et al. Exploring ozone pollution in Chengdu, southwestern China: A case study from radical chemistry to O3−VOC−NOx sensitivity [J]. Science of the Total Environment, 2018, 636: 775-786. doi: 10.1016/j.scitotenv.2018.04.286 [39] 高璟赟, 肖致美, 徐虹, 等. 2019年天津市挥发性有机物污染特征及来源 [J]. 环境科学, 2021, 42(1): 55-64. GAO J Y, XIAO Z M, XU H, et al. Characterization and source apportionment of atmospheric VOCs in Tianjin in 2019 [J]. Environmental Science, 2021, 42(1): 55-64(in Chinese).
[40] 王雨, 王丽涛, 杨光, 等. 邯郸市秋季大气挥发性有机物污染特征 [J]. 环境科学研究, 2019, 32(7): 1134-1142. WANG Y, WANG L T, YANG G, et al. Characteristics of volatile organic compounds in autumn in Handan city, China [J]. Research of Environmental Sciences, 2019, 32(7): 1134-1142(in Chinese).
[41] WANG T, XUE L K, BRIMBLECOMBE P, et al. Ozone pollution in China: A review of concentrations, meteorological influences, chemical precursors, and effects [J]. Science of the Total Environment, 2017, 575: 1582-1596. doi: 10.1016/j.scitotenv.2016.10.081 [42] 王新富, 高良敏, 周晓芳, 等. 基于因子分析的安徽省大气污染特征及综合评价研究 [J]. 安徽理工大学学报(自然科学版), 2020, 40(1): 64-71. WANG X F, GAO L M, ZHOU X F, et al. Study on characteristics and comprehensive evaluation of air pollution in Anhui Province based on factor analysis [J]. Journal of Anhui University of Science and Technology (Natural Science), 2020, 40(1): 64-71(in Chinese).
[43] LIU Y, SHAO M, FU L L, et al. Source profiles of volatile organic compounds (VOCs) measured in China: Part I [J]. Atmospheric Environment, 2008, 42(25): 6247-6260. doi: 10.1016/j.atmosenv.2008.01.070 [44] 张洲. 中国大气非甲烷碳氢化合物时空分布特征初步研究[D]. 广州: 中国科学院研究生院(广州地球化学研究所), 2016. ZHANG Z. Spatiotemporal patterns of ambient non-methane hydrocarbons in China[D]. Guangzhou: Guangzhou Institute of Geochemistry, Chinese Academy of Sciences, 2016:201(in Chinese).
[45] BARLETTA B, MEINARDI S, ROWLAND F S, et al. Volatile organic compounds in 43 Chinese cities [J]. Atmospheric Environment, 2005, 39(32): 5979-5990. doi: 10.1016/j.atmosenv.2005.06.029 [46] 王鸣, 陈文泰, 陆思华, 等. 我国典型城市环境大气挥发性有机物特征比值 [J]. 环境科学, 2018, 39(10): 4393-4399. WANG M, CHEN W T, LU S H, et al. Ratios of volatile organic compounds in ambient air of various cities of China [J]. Environmental Science, 2018, 39(10): 4393-4399(in Chinese).
[47] MO Z W, SHAO M, LU S H, et al. Process-specific emission characteristics of volatile organic compounds (VOCs) from petrochemical facilities in the Yangtze River Delta, China [J]. Science of the Total Environment, 2015, 533: 422-431. doi: 10.1016/j.scitotenv.2015.06.089 [48] AN J L, ZHU B, WANG H L, et al. Characteristics and source apportionment of VOCs measured in an industrial area of Nanjing, Yangtze River Delta, China [J]. Atmospheric Environment, 2014, 97: 206-214. doi: 10.1016/j.atmosenv.2014.08.021 期刊类型引用(3)
1. 汤凯,宋灿辉,曹茜斐,安天一,刘洋,周钒,杜桂泉,孙法迁,陈重军. 低耗往复式膜生物反应器系统的中试应用研究. 中国环境科学. 2025(02): 727-735 .  百度学术
百度学术
2. 韩奕彤,罗育池,王刚,刘畅,宋宝德,秘昭旭,王先稳. 典型离子型稀土矿区氮污染地下水原位微生物修复技术研究. 环境科学研究. 2024(11): 2391-2400 .  百度学术
百度学术
3. 杨春玉,董战峰,顾湘,汪俊峰. 中国公众空气质量感知的时空演化及其驱动因素分析. 环境科学研究. 2024(12): 2653-2664 .  百度学术
百度学术
其他类型引用(0)
-


 下载:
下载:
