-
人类活动是造成土壤重金属污染的重要成因,比如:金属冶炼、矿产开采、煤燃烧、汽车尾气排放、污水灌溉等[1]。我国是汞矿资源大国,随着工业化进程的快速发展,化工、医疗等行业对汞的需求量不断增加,而汞矿山开采是其主要来源。虽然矿产资源的开发利用可推动国家和地方的经济发展,但大量的矿产资源开采易使矿区及周边的土壤、地下水以及农作物受到重金属污染[2-5]。大量的研究显示,汞矿区及周边土壤-农作物污染严重,如湘西茶田汞矿区土壤中Hg、Cd、As、Pb、Zn均存在污染,其中Hg和Cd污染较为严重[6];陕西旬阳汞矿区稻田稻米和土壤中Hg含量远超我国农作物和土壤质量标准[7];贵州万山汞矿区土壤中Ni、As、Cd、Hg元素平均含量均超过农用地土壤筛选值,其中Hg元素平均含量超标达70倍[8];贵州丹寨—三都汞矿区土壤中As、Cd、Hg超标率分别达44%、11%、44%,水稻Cd、Cr、Cu、Pb、Zn 等5 种重金属含量超过我国农作物重金属限量标准[9]。重金属进入土壤后因不能被生物降解而长期存在于土壤中且不断积累,不仅影响土壤性质和功能、降低农产品的产量和质量,而且可以通过农作物累积进入食物链,造成当地居民的重金属健康风险[10-11]。
重庆市汞矿的资源优势与贵州、陕西齐名,累计查明汞金属资源储量14271 t,保有资源储量13077 t,列全国第3位[12]。重庆市汞矿集中分布在东南部酉阳、秀山、黔江三区县,矿产地及资源储量均以酉阳县为主,重庆市最大的汞矿(羊石坑汞矿床)位于秀山溪口镇。重庆东南部汞矿储量巨大,对汞矿区周边耕地环境构成了严重威胁,影响着该地区的农业经济发展。1:25万土地质量地球化学调查表明重庆秀山-酉阳地区As、Cd、Hg存在明显的局部聚集[13]。张龙等[14]曾报道秀山汞矿区土壤Hg最高超过土壤环境二级标准值的2倍,并指出矿山的冶炼炉渣和烟道排气是矿区土壤汞的主要来源,而污染大气的汞沉降是下游旱田土壤汞污染的主要途径。李柳[15]评价了秀山溪口乡五龙村汞矿区土壤重金属生态风险,发现全部土壤样品的生态危害程度均为极强。鲍丽然等[16]也指出秀山县西北部汞矿、锰矿区农田土壤As、Cd、Cr、Cu、Hg、Ni、Pb、Zn等重金属均高于重庆土壤背景值,受开矿影响最明显。但以往的研究主要集中在秀山汞矿区及周围土壤污染和生态风险评价,缺少对酉阳汞矿区的研究,并少有对汞矿区周边农作物开展调查。
本文通过对重庆东南部汞矿区内主要农作物及其种植土壤的重金属含量进行调查分析,探讨汞矿区土壤、农作物重金属的分布、积累特征,系统分析土壤重金属污染特征和生态风险,并评价食用农作物的人体健康风险,以期为土壤重金属污染防治、区域农产品安全和居民健康生活提供科学依据。
-
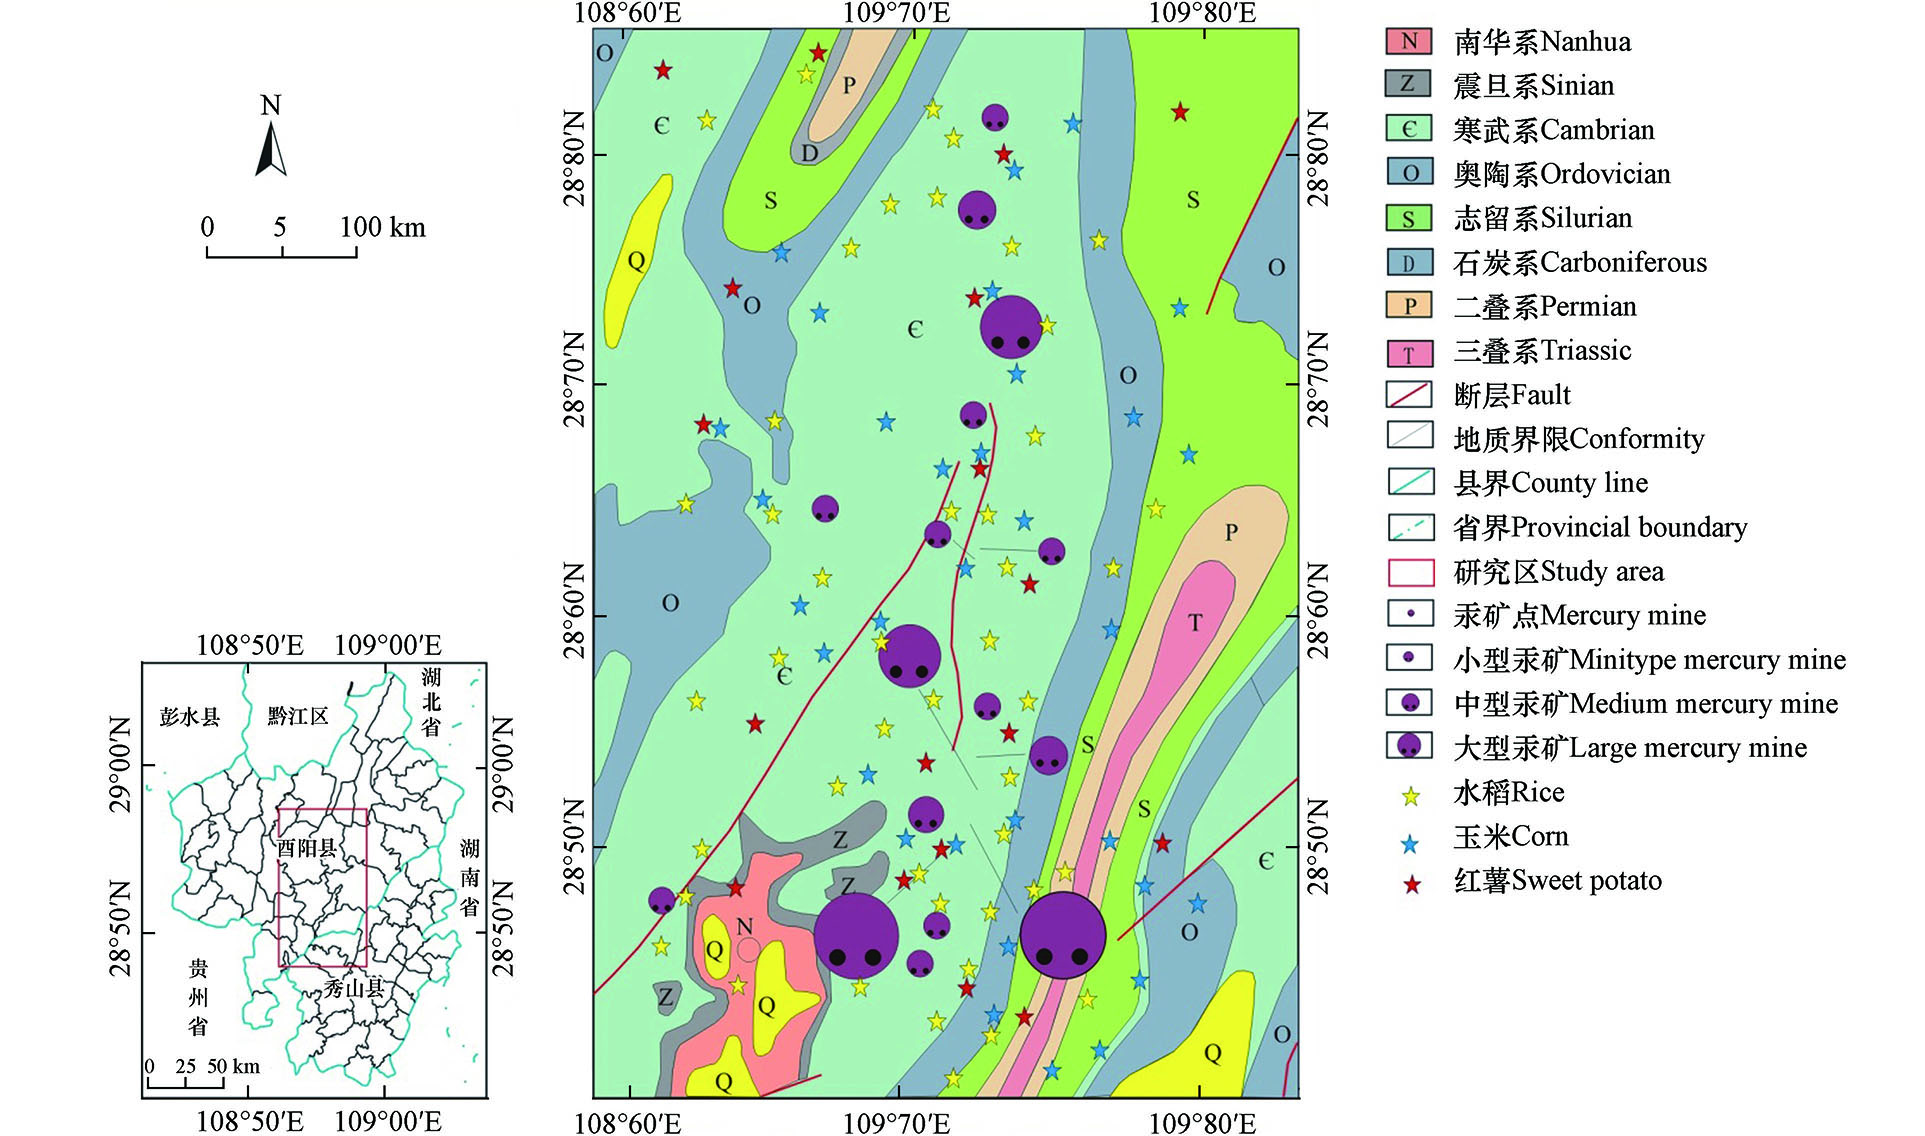
本研究区位于重庆市东南部,为扬子陆块南部被动边缘褶冲带,古生代碳酸盐岩建造发育,燕山期盖层褶皱发育,并伴随区域性走向断层产生,形成剪切破碎带,为地下水热液成矿创造了良好条件,形成规模较大的汞、铅锌等层控矿床,汞矿主要赋存于寒武系下统清虚洞组的白云岩[17]。秀山-酉阳地区为渝、鄂、湘、黔四省结合部位,地理坐标介于东经108°18′17—109°19′12,北纬28°09′43—29°24′4之间。研究区主要分布属亚热带湿润季风气候,四季分明,气温正常,降水充沛,山地气候垂直分异性明显,立体气候显著。区内喀斯特地貌发育典型,大致分为中山区(800—1895 m)、低山区(600—800 m)和槽谷平坝区(263—600 m)。该区农业生产条件极具优势,为重庆市优质粮食基地县,但区内汞矿分布较多,威胁着周边生态环境(图1)。
-
研究区采集大宗农作物(水稻、玉米和红薯)及其种植土壤样品,采用GPS定位法共采取根系土壤样品95件,水稻45件,玉米32件,红薯18件,其采样点基本均匀分布于农耕区。在每个采样点周围按照梅花点法5点采样,每个点采取农作物100—200 g,组合成1个混合样;并在每个农作物样点用竹铲采集0—20 cm深度内的耕作层根系土壤,混合均匀后采用四分法留取1 kg混合土样。土壤样品在室内自然风干后去除植物根系、砾石等杂质,用玛瑙研钵磨细,置于塑料袋中密封;农作物样品去壳或皮,风干,在送往实验室化验分析。
对土壤样品进行了pH、As、Cd、Cr、Cu、Hg、Ni、Pb、Zn等 9项指标的分析,农作物样品进行As、Cd、Cr、Cu、Hg、Ni、Pb和Zn 8项指标的分析,所有样品分析均在重庆地质矿产测试中心完成。测试过程严格按照《DZ/T0295—2016 土地质量地球化学评价规范》的有关规定执行。分析指标、测定方法及检出限见表1。准确度和精密度采用国家一级标准物质进行控制,元素分析准确度和精密度合格率均高于98%;元素报出率高于95%。
-
采用德国科学家Muller提出的地累积指数法[18],评价土壤重金属的污染水平,计算公式为:
式中,Igeo为重金属i的地累积指数;Ci为土壤中重金属i的实测值;Si为参比值,选用重庆市土壤重金属元素背景值[16];k为修正系数,一般为1.5。重金属地累积指数Igeo分级与污染程度关系如表2所示[19]。
-
瑞典著名地球化学家Hakanson[20]提出的潜在生态指数法是目前最为常用的评价土壤重金属污染程度的方法之一,该方法将重金属的含量、重金属的生态效应、环境效应和毒理学效应均联系起来[16, 21-22]。其计算公式如下:
式中,Cfi为某一金属的污染指数;Ci为土壤中某重金属的实测值;Cni为某重金属参比值,采用重庆市土壤重金属背景值[16];Eri为单项重金属潜在生态风险指数;Tri为某重金属的毒性响应参数,各重金属毒性系数为:Zn=1<Cr=2<Cu=Ni=Pb=5<As=10<Cd=30<Hg=40[23];RI 为总的潜在生态风险指数。根据Eri和RI,将单因子潜在生态危害和总潜在生态危害进行分级。因Hakanson 研究的是PCB、Hg、Cd、As、Pb、Cu、Cr 和Zn 等8 种污染物的潜在生态风险,并根据污染物中最大毒性系数( TPCB = THg =40) 和8 种污染物的毒性响应系数之和(133) 提出Eri和RI的分级标准,因此应用RI进行生态风险评价时,必须根据污染种类、数量和毒性系数进行调整。本文根据文献[22]的研究方法对分级标准进行了相应的调整,调整后重金属潜在生态风险指标分级标准如表3所示。
-
长期食用受到重金属污染的农作物,会造成慢性病风险,采用USEPA 公布的健康风险评估模型评价居民食用该区域农作物的健康风险,评价步骤包括暴露计算和风险表征[24]。
( 1 )暴露计算
日均暴露剂量(CDI)计算公式为:
式中,CDI为重金属通过农作物的日平均摄入量,(mg·kg−1);Ci为农作物重金属i含量(mg·kg−1);IR为人体每日对农作物的食用量(g·d−1),根据对研究区400人实地问卷调查数据,成人水稻、玉米和红薯的平均摄入量分别为0.300、0.045、0.069 kg·d−1,儿童分别为0.176、0.033、0.046 kg·d−1;其余参数见表4。
(2) 健康风险表征
健康风险指数(HQ)计算公式为:
式中,HQ为单一重金属的健康风险指数;THQ为多种重金属总健康风险指数;RfD为重金属暴露参考剂量[mg·(kg·d)−1],As、Cd、Cr、Cu、Hg、Ni、Pb、Zn的RfD取值分别为0.0003、0.001、1.5、0.04、0.0003、0.02、0.004、0.3[25-26]。如果THQ≤1表明没有明显的健康影响;THQ>1表明对人体健康产生影响的可能性大;THQ>10表明存在慢性毒性效应。
-
元素富集系数是农作物样品某元素含量与根系土中对应元素含量的比值,反映出植物对土壤中元素的吸收富集能力,可用来表征元素的生物有效性[27],计算式如下:
式中,K 表示元素的富集系数;Cplant为重金属元素在作物中的含量,单位为mg·kg−1;Csoil为重金属元素在根系土中的含量,单位为mg·kg−1.
-
研究区土壤pH值在4.33—8.22范围内,平均值为6.34,整体处于偏酸性水平。如表5所示,水稻田、玉米地和红薯地土壤重金属平均含量由高至低依次均为Zn>Cr>Pb>Ni>Cu>As>Hg>Cd,并均高于重庆市土壤背景值,表明重金属在土壤中都有一定程度的累积。水稻田、玉米地和红薯地土壤Hg含量分别为0.088—46.5、0.115—432 、0.112—115 mg·kg−1,平均含量分别是重庆土壤背景值的62、261、132倍;Cd和As平均值分别为0.752、0.817、1.07 mg·kg−1和14.9、19.7、22.9 mg·kg−1,是重庆土壤背景值的2—4倍;Cu、Pb、Zn、Cr和Ni是重庆土壤背景值的1—2倍左右,显然土壤中Hg积累效应最明显,Cd、As次之。对比水稻田、玉米地和红薯地,As、Cd、Cr、Ni、Zn的平均含量为红薯地>玉米地>水稻田;Cu和Hg的平均含量为玉米地>红薯地>水稻田;Pb的平均含量为红薯地>水稻田>玉米地。
变异系数可以反映人为活动对环境的干扰程度,变异系数小于0.1为弱变异,0.1—0.3之间为中变异,大于0.3为强变异[28]。从变异系数来看,Hg明显高于其它元素,水稻田、玉米地和红薯地变异系数分别达到2.18、4.24、2.94。此外,水稻田As、Cd变异系数较高,分别为0.683、0.513;玉米地Cd、Cu、As变异系数较高,分别为0.614、0.536和0.415;红薯地Cd、As、Pb、Zn、Cu变异系数较高,分别为0.611、0.468、0.441、0.415、0.393。变异系数越大,元素在土壤中分布越不均匀,受人类活动影响越大,研究区土壤中Hg元素(变异系数均大于1)受区域汞矿开采等影响最大,其次是Cd、As。
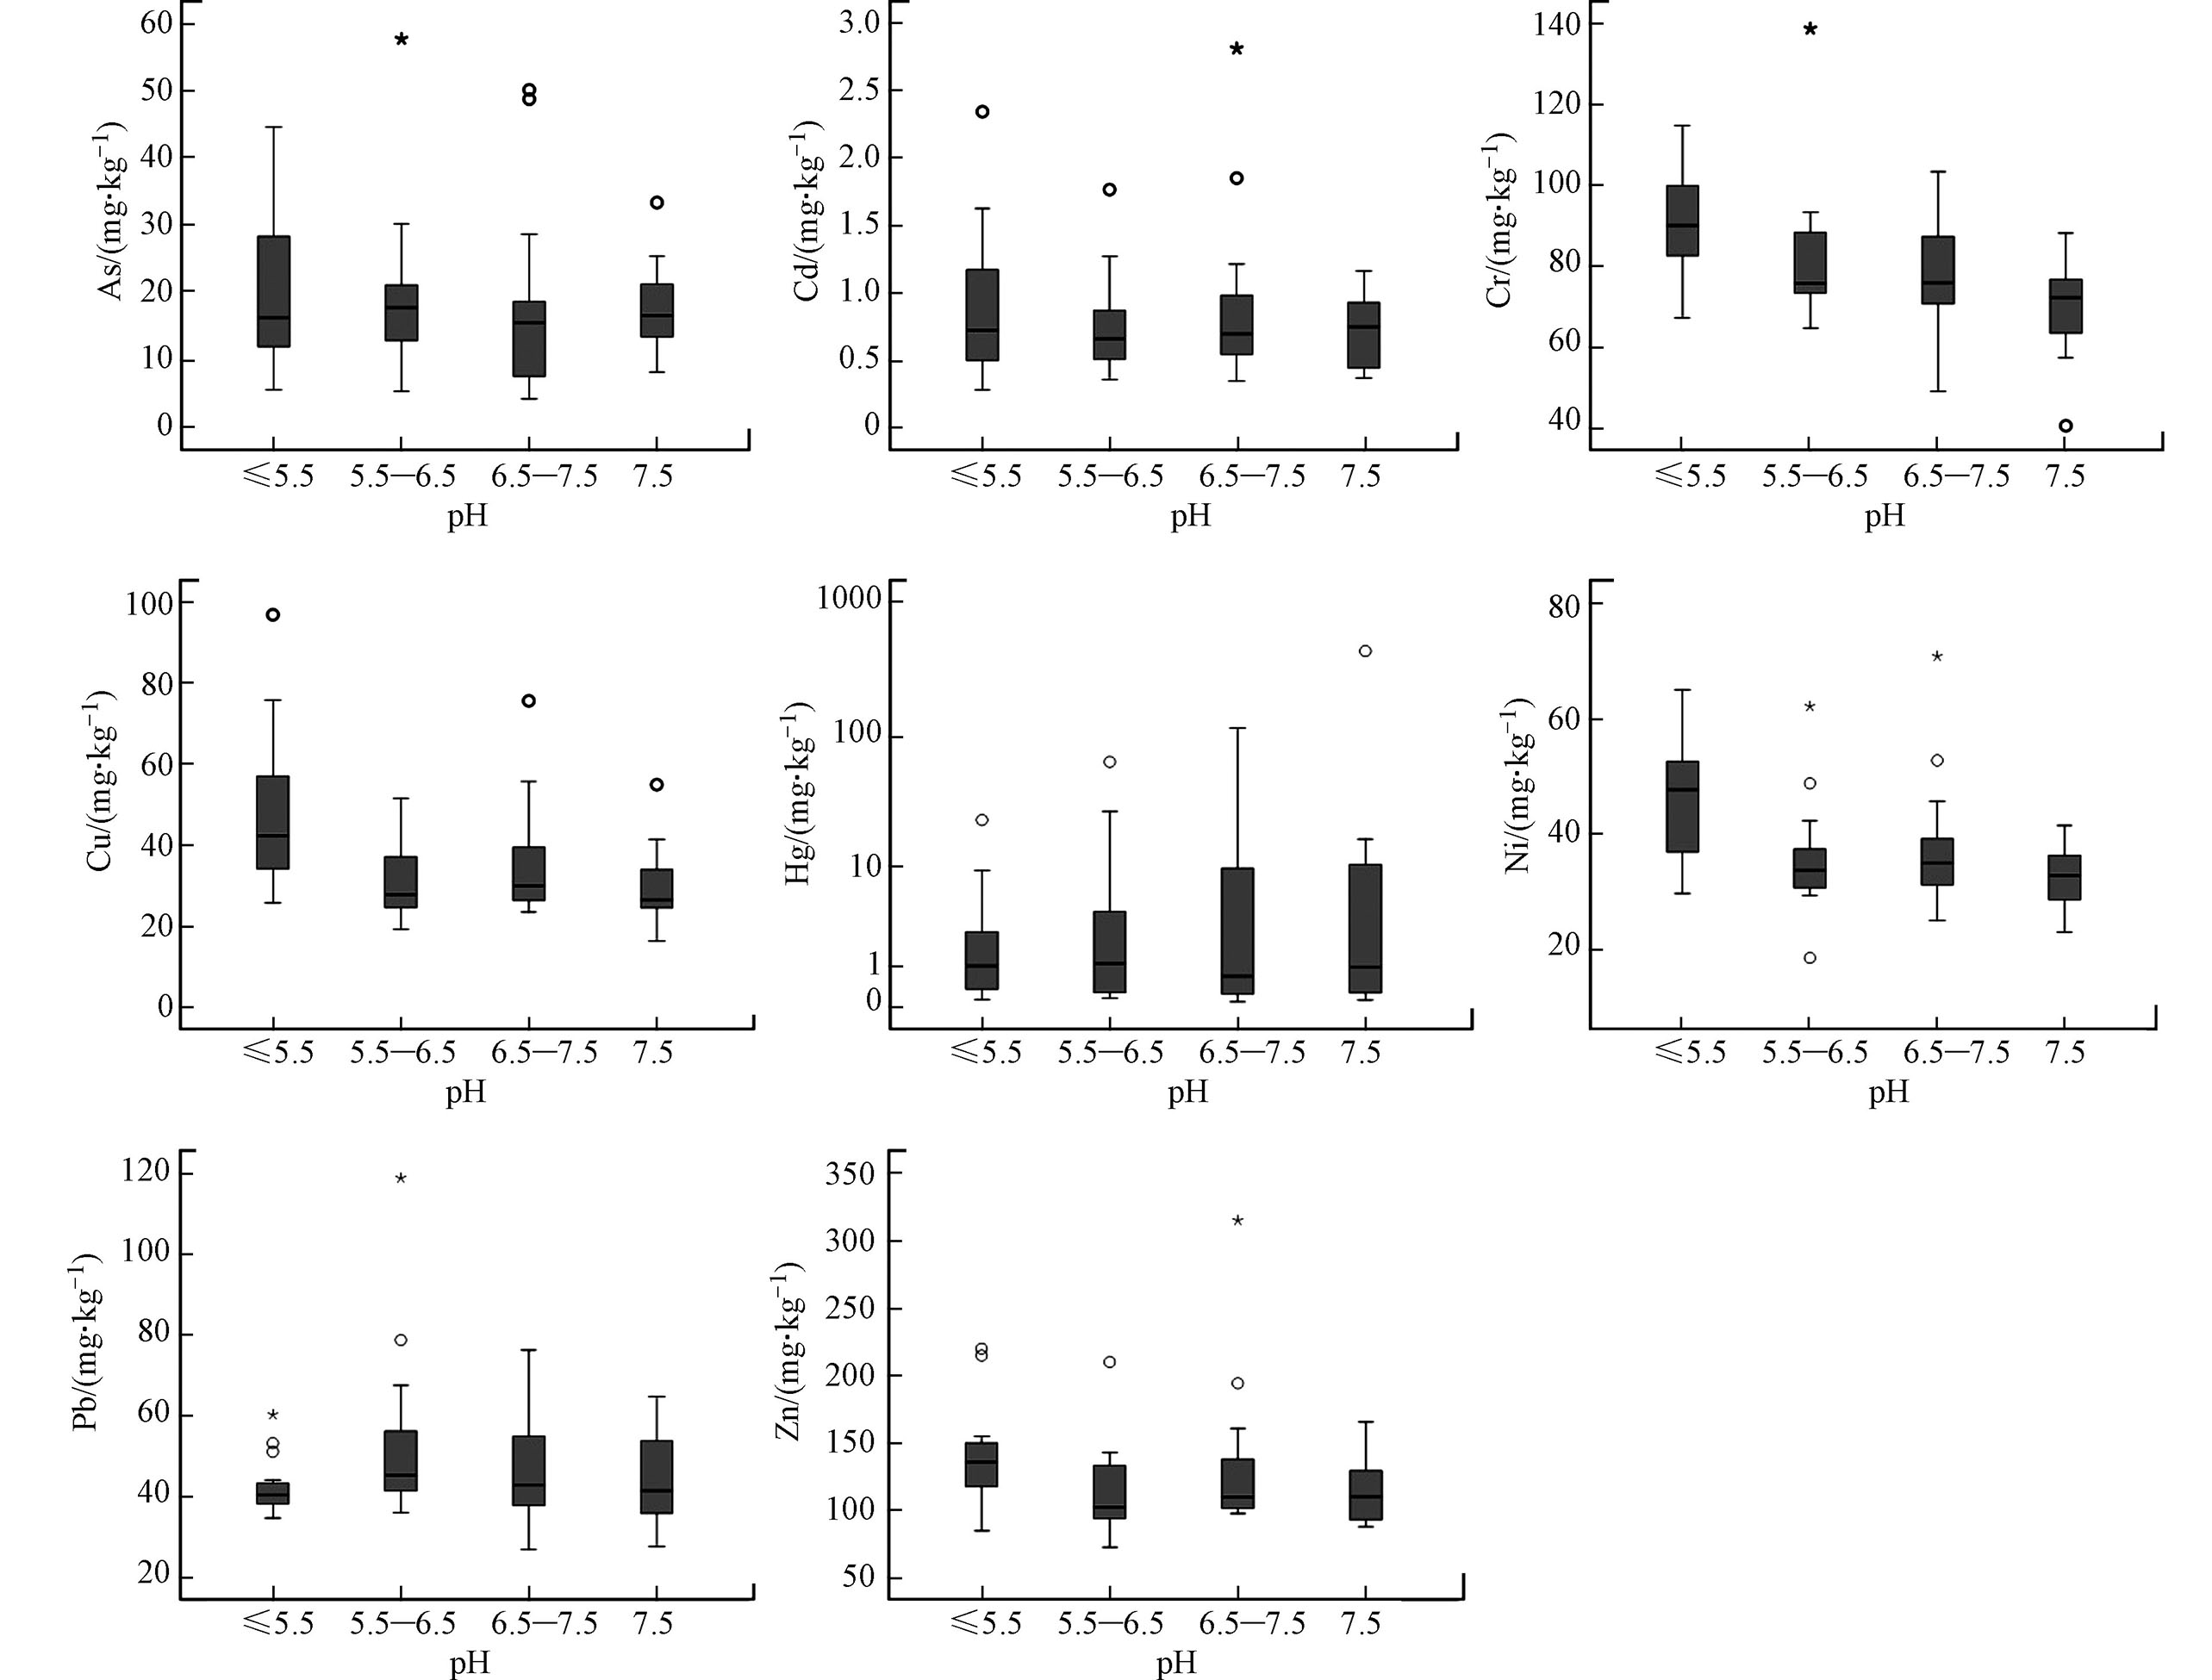
与土壤环境质量标准值对比,研究区耕地土壤中Cr均未超标,Pb有1个样品超标,Ni、Zn、Cu有少量样品超标,Cd、Hg、As则存在较多样品超标,Cd最高值是标准值的7.82倍,Hg最高值超出标准值的100倍以上,As最高值是标准值的2.51倍(图2)。其中水稻田中Cd、Hg、As分别有40、28、5件样品超过农用地土壤筛选值,超标率分别为88.9%、62.2%、11.1%;玉米地中Cd、Hg、As分别有26、14、6件样品超过农用地土壤筛选值,超标率分别为81.3%、43.8%、18.8%;红薯地中Cd、Hg、As分别有18、8、3件样品超过农用地土壤筛选值,超标率分别为100%、44.4%、16.7%。因此,Cd、Hg、As是该区土壤主要超标元素,尤其是Cd超标率均大于80%,对周边生态环境、农作物安全和人体健康带来危害的可能性较大。
-
研究区农作物水稻中重金属含量由高至低依次为Zn>Cu>Ni>Cr>Cd>As>Pb>Hg;玉米种重金属含量由高至低依次为Zn>Cu>Ni>Cr>Cd>Pb>As>Hg;红薯中重金属含量由高至低依次为Zn>Cu>Ni>Cr>Pb>Cd>As>Hg,水稻、玉米和红薯中Zn的含量都是最大,其次为Cu、Ni、Cr,而Hg含量最低。水稻中重金属As、Cd、Cr、Cu、Hg、Ni、Pb、Zn的平均值分别为0.159、0.202、0.269、2.239、0.005、0.473、0.048、19.6 mg·kg−1;玉米中重金属As、Cd、Cr、Cu、Hg、Ni、Pb、Zn的平均值分别为0.007、0.058、0.178、1.768、0.003、0.482、0.045、18.2 mg·kg−1;红薯中重金属As、Cd、Cr、Cu、Hg、Ni、Pb、Zn的平均值分别为0.029、0.065、0.525、4.803、0.004、0.659、0.133、7.069 mg·kg−1。研究区农作物绝大多数重金属变异系数均大于0.3(表6),因此认为研究区内农作物中重金属来源受外界干扰较大,可能与研究区矿产开采等人为活动有关。
在所采集的所有农作物样品中,除水稻Cd以外,其余农作物重金属元素的平均含量均未超过《食品安全国家标准 食品中污染物限量》(GB2726—2017)中的标准限值(表6)。水稻中Cd超标率为20%,As、Cr、Hg和Pb均没有点位超标;玉米中部分点位的Cd含量超标,超标率为15.6%,其余元素均未超标;红薯中部分点位Cd、Cr和Pb含量超标,超标率分别为22.2%、5.56%和27.8%。综合重金属含量、重金属超标种类和超标率等指标可知,研究区农作物受Cd污染的风险最高,这与Cd较高的迁移能力有关[29];红薯污染程度最高,玉米受污染程度最低,可以通过调整种植结构,提高土地利用效率,改善农作物质量。
-
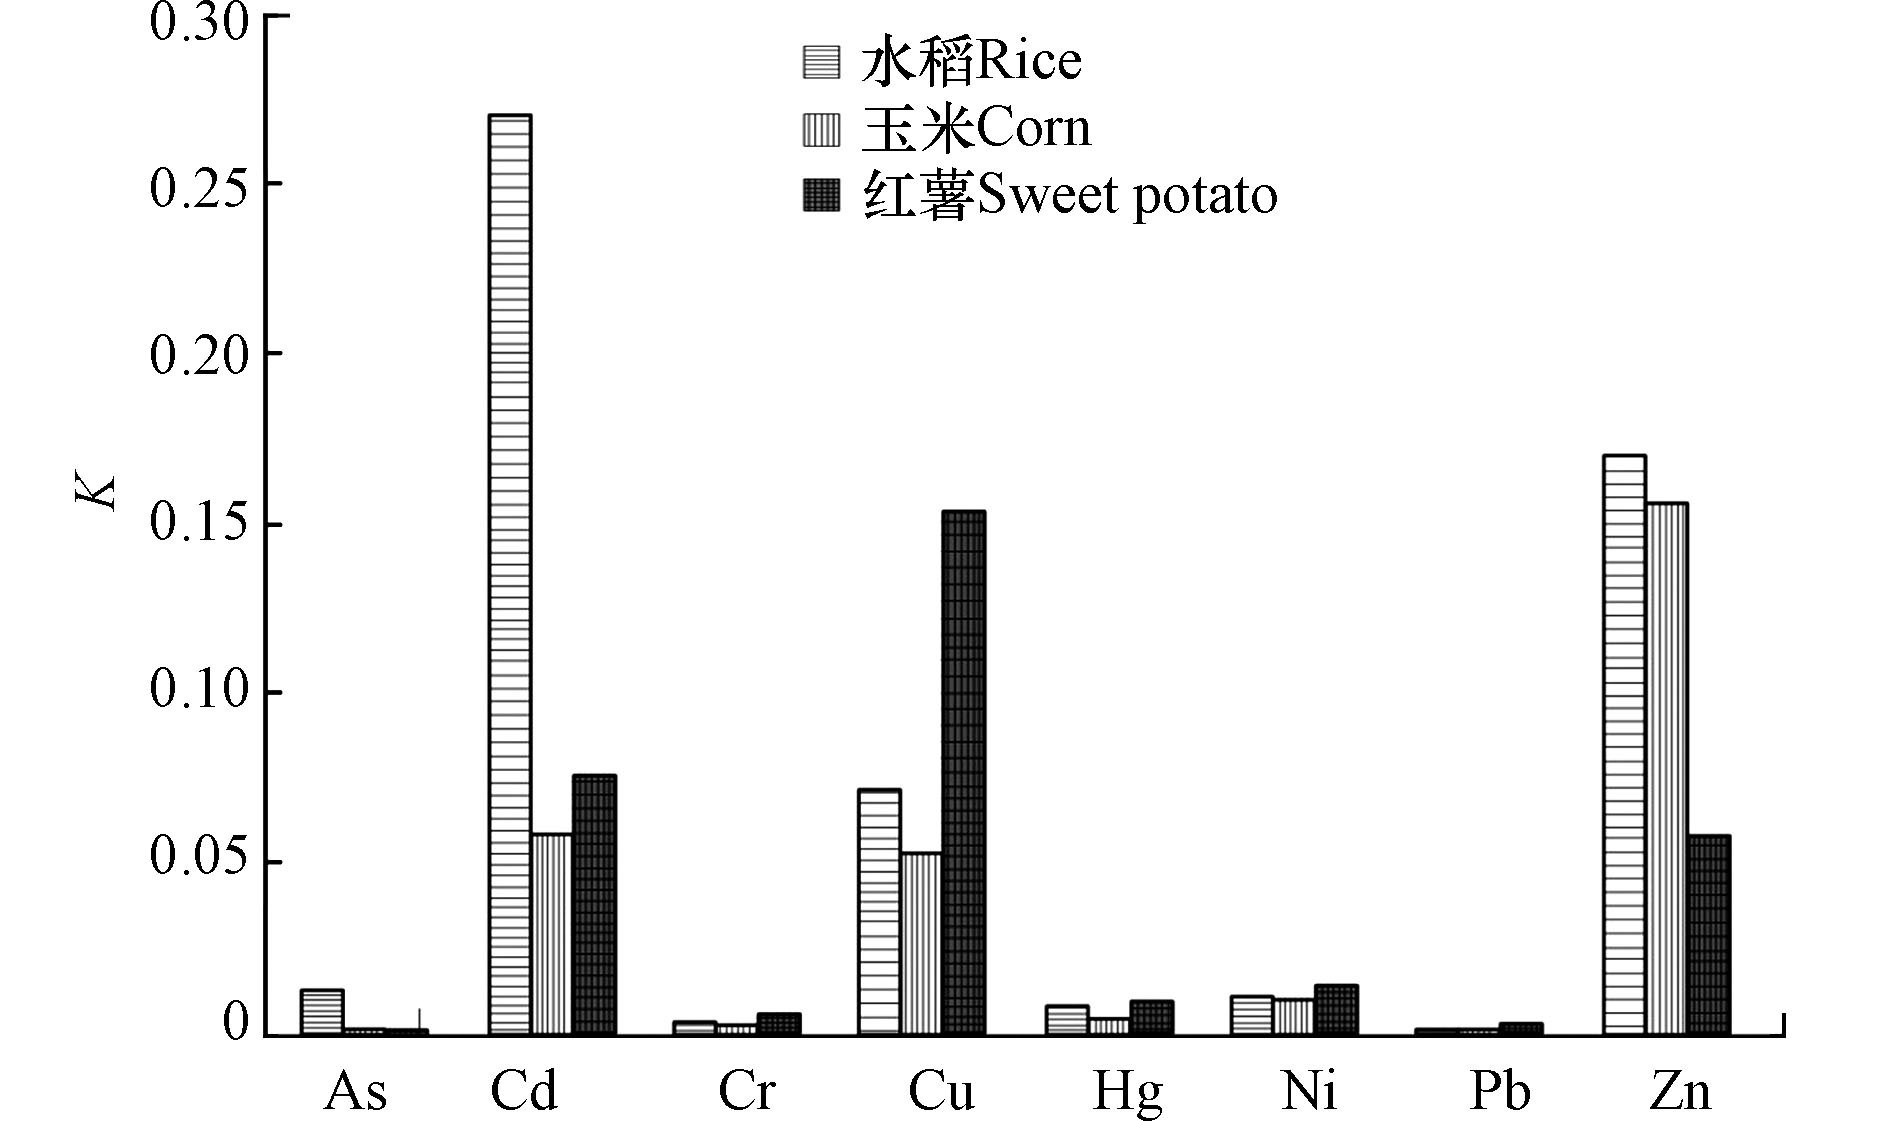
如表6所示,水稻中重金属元素富集系数大小顺序为Cd>Zn>Cu>As>Ni>Hg>Cr>Pb;玉米中重金属元素富集系数大小顺序为Zn>Cd>Cu>Ni>>Hg>Cr>Pb>As;红薯中重金属元素富集系数大小顺序为Cu>Cd>Zn>Ni>Hg>Cr>Pb>As。8种重金属元素在水稻、玉米和红薯中Cd、Zn和Cu的富集系数较高(图3),Zn、Cu 是农作物的营养元素,农作物对其有一定的需求量,故Zn、Cu 在农作物中吸收能力较强;Cd 在土壤中有较强的可移动性,且作物对Cd 有较强的吸收能力,同时Cd 在偏酸性土壤中溶解度增大,而研究区整体处于偏酸性水平,增强了Cd迁移富集能力[30]。此外,水稻中As的富集系数也较高,由于淹水稻田的厌氧条件和水稻对三价As较强的吸收能力,导致水稻中积累了较高含量的As[29]。而水稻、玉米和红薯中Cr、Hg、Pb的富集系数较低,研究表明长期施肥使Cr的有效性在逐步降低,从不稳定形态(可交换态和碳酸盐结合态)向较为稳定的形态转化(铁锰氧化物结合态和有机结合态),造成Cr不易向农作物中迁移[31];相对土壤中其他形态Hg而言,有机-硫化态Hg的生物可利用性强,研究区Hg的富集系数较低可能与矿区土壤中酸交换态Hg含量较低并且变幅较大有关[32]。土壤中Pb主要以不易溶于水的Pb(OH)2、PbCO3、PbSO4形式存在,土壤的有机质含有能大量吸附土壤中Pb+的腐殖质,使得Pb在土壤中大量沉积富集,阻碍了作物对Pb的吸收[33]。
-
利用式(1)对研究区土壤重金属污染程度进行地累积指数评价,重金属污染指数平均值从高至低顺序为Hg>Cd>As>Pb>Zn>Cu>Ni>Cr(表7)。土壤Hg污染最严重,几乎所有土壤样都受到不同程度的Hg污染,其中中污染和极重污染样品较多,分别占样本总数的24.2%和23.2%,轻污染、中—重污染、重污染和重—极重污染分别占16.8%、12.6%、14.7%和7.37%,只有1件样品呈无污染状态。As、Cd的地累积指数均值介于0—1之间,总体处于轻污染水平,部分样品As和Cd达到中—重污染。Cr、Cu、Ni、Pb、Zn总体呈无—轻污染状态,极少数样品达到中污染。因此,研究区土壤Hg污染现象最为突出,污染程度重、样品多。
-
以重庆市土壤背景值作为参比值,利用式(2)对研究区土壤开展潜在生态危害风险评价(表8)。从单项重金属潜在生态风险看,全部样品的Cr、Cu、Ni、Pb和Zn生态风险指数均小于40,为轻微生态风险;As风险指数范围为6.40—87.2,存在轻微至强生态风险,以轻微风险为主,占84.2%;Cd风险指数范围为23.3—302,存在轻微至很强的生态风险,以中等风险和强等风险为主,分别占45.3%和37.9%;Hg风险指数范围为51.2—250584,存在中等至极强生态风险,以极强风险为主,占54.7%;因此,Hg、Cd为研究区土壤主要生态危害元素,As也有较轻的生态危害风险。
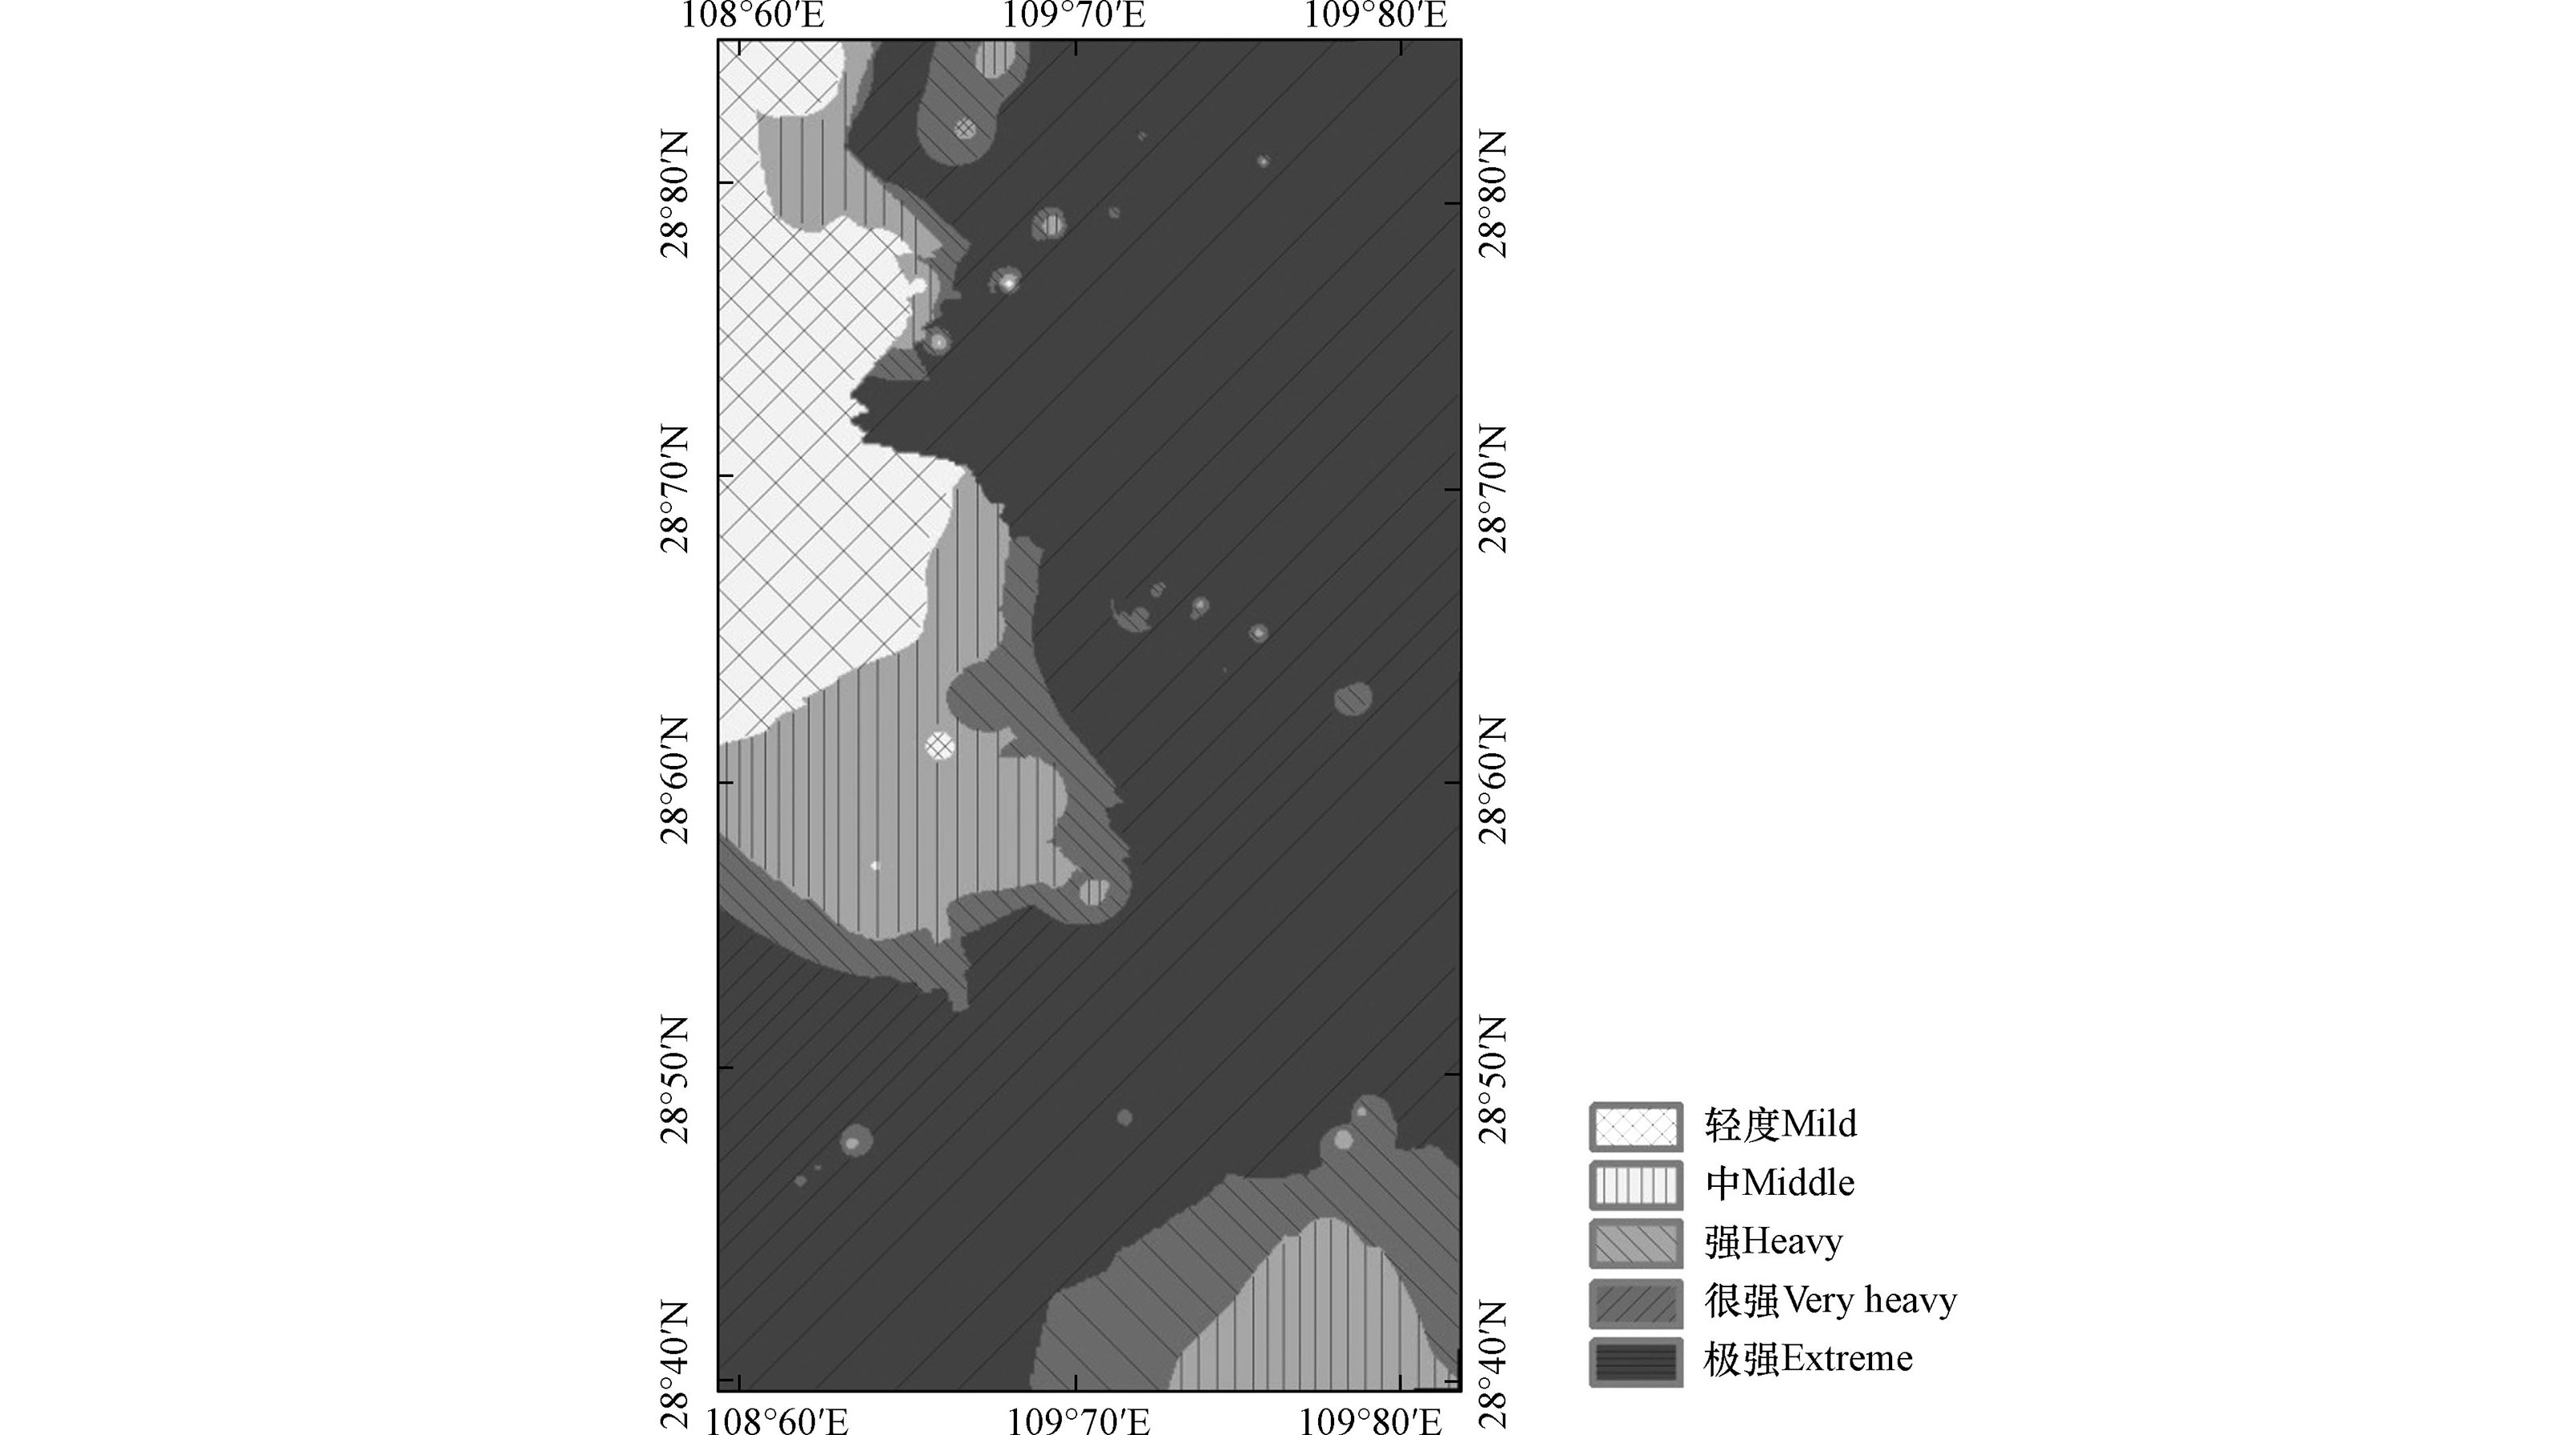
研究区重金属总的潜在生态指数RI分布范围为131—250757,存在中等至很强的生态风险,以强风险和很强风险为主,所占比例分别为33.7%和50.5%。RI空间分布图(图4)显示,研究区大部分地区处于强—很强风险,土壤生态风险与汞矿区分布基本一致,西北部和东南缘距离汞矿区较远,生态风险最低,表现为中等或轻微强度。
-
利用USEPA推荐的健康风险模型分别计算研究区成人和儿童通过食用农作物摄入重金属的风险值(HQ),3种不同农作物不同重金属的健康风险评价结果见表9。由表9可知,就单一重金属的HQ而言,3种不同农作物的健康风险有较明显的差异,水稻为As>Cd>Zn>Cu>Ni>Hg>Pb>Cr;玉米为Zn>Cu>Cd>Ni>As>Hg>Pb>Cr;红薯为Cu>As>Cd>Pb>Ni>Zn>Hg>Cr。无论成人还是儿童,除水稻As的HQ>1,其余食用农作物摄入重金属的风险平均值小于1,说明研究区居民食用水稻存在较高的As风险。食用农作物水稻、玉米和红薯,儿童重金属单项风险指数均高于成人,受危害的可能性更大。重金属在农作物中并不是单一存在的,二是共同存在于农作物中,复合健康风险评价结果,表现为水稻>红薯>玉米。成人食用水稻和红薯的THQ>1,说明对人体健康产生影响的可能性大;食用玉米的THQ<1,说明对人体没有明显的健康影响。儿童食用水稻、玉米和红薯的THQ均大于1,尤其是食用水稻(THQ平均值达到9.86)存在明显的复合健康风险,应引起重视。
-
(1) 重庆市汞矿区水稻田、玉米地和红薯地土壤中As、Cd、Cr、Cu、Hg、Ni、Pb、Zn等重金属均高于重庆土壤背景值,Hg元素最为突出,且变异系数大,受开矿影响最明显,其次是Cd、As。与国家农用地土壤污染风险筛选值相比,Cd、Hg、As是研究区土壤主要超标元素,可能会产生生态健康危害。
(2) 研究区水稻、玉米和红薯中Zn的含量都是最大,其次为Cu、Ni、Cr,Hg含量最低。与食品安全国家标准相比,水稻和玉米中Cd超标,超标率分别为20%、15.6%;部分红薯中Cd、Cr和Pb超标,超标率分别为22.2%、5.56%和27.8%。
(3) 地累积指数评价结果显示,该区土壤Hg污染现象最为严重,以中污染和极重污染为主,As、Cd总体处于轻污染水平,Cr、Ni、Cu、Pb、Zn总体呈无—轻污染状态。
(4) 重金属潜在生态风险评价结果表明,研究区土壤潜在重金属生态危害主要表现为Hg、Cd和As,Hg以极强风险为主,Cd以中等风险和强等风险为主,As以轻微风险为主,其余重金属危害不明显。研究区大部分地区处于强—很强风险,土壤生态风险与汞矿区分布基本一致,西北部和东南缘距离汞矿区较远,生态风险最低。
(5) 单一重金属健康风险指数表明研究区居民食用水稻存在较高的As风险;多种重金属总健康风险指数显示成人食用玉米没有明显的健康影响,但食用水稻、红薯存在明显的复合健康风险;同时儿童更易受到重金属污染威胁,食用水稻、玉米和红薯的THQ均大于1,尤其是食用水稻(THQ平均值达到9.86)存在明显的复合健康风险,应引起重视。
重庆汞矿区耕地土壤和农作物重金属污染状况及健康风险评价
Heavy metal pollution and human health risks assessment of soil and crops near the mercury ore in Chongqing
-
摘要: 为了解重庆汞矿区耕地土壤-农作物重金属污染状况,在研究区采集水稻 45件、玉米 32件、红薯 18件及其种植土壤样品 90件,分析测定As、Cd、Cr、Cu、Hg、Ni、Pb、Zn等 8种重金属含量,采用地累积指数法、潜在生态危害指数法和健康风险评估模型,对该区土壤重金属污染程度、生态风险和食用农作物的健康风险进行评估.结果表明,研究区水稻田、玉米地和红薯地土壤重金属平均含量均高于重庆市土壤背景值,呈现不同程度的积累;Cd、Hg、As超出国家农用地土壤污染风险筛选值,水稻田土壤超标率分别为 88.9%、62.2%、11.1%,玉米地土壤超标率分别为 81.3%、43.8%、18.8%,红薯地土壤超标率分别为 100%、44.4%、16.7%.与食品安全国家标准相比,部分水稻和玉米中Cd超标,超标率分别为 20%、15.6%;部分红薯中Cd、Cr和Pb超标,超标率分别为 22.2%、5.56%和 27.8%.地累积指数法评价显示土壤Hg污染严重,以中污染和极重污染为主,As、Cd总体处于轻污染水平,Cr、Cu、Ni、Pb、Zn总体呈无-轻污染状态.潜在生态风险评价显示,Hg、Cd、As为研究区土壤主要生态危害元素,Hg以极强风险为主,Cd以中等风险和强等风险为主,As以轻微风险为主.单一重金属健康风险指数表明研究区居民食用水稻存在较高的As风险.多种重金属总健康风险指数显示成人食用玉米没有明显的健康影响,但食用水稻、红薯存在明显的复合健康风险;同时儿童更易受到重金属污染威胁,食用水稻、玉米和红薯的THQ均大于 1Abstract: In order to understand the heavy metal pollution of agriculture soil-crops in mercury ore of Chongqing, 45 rice samples, 32 corn samples, 18 sweet potato samples and 90 corresponding soil samples were collected, and the concentrations of As, Cd, Cr, Cu, Hg, Ni, Pb and Zn were analyzed. The soil heavy metal pollution level, the ecological risk and health risk were evaluated by the geological accumulation index, potential ecological hazard index and health risk assessment model. Results showed that the average values of 8 heavy metals in the surrounding soil of mercury mining area were higher than the soil background values of Chongqing, showing different degree of accumulation effect. The concentrations of Cd, Hg and As significantly exceeded the risk screening values for soil contamination of agricultural land, with the over-standard rates of 88.9%, 62.2% and 11.1% in rice soil, with the over-standard rates of 81.3%, 43.8% and 18.8% in corn soil, with the over-standard rates of 100%, 44.4% and 16.7% in sweet potato soil. Compared with the national food safety standard, Cd exceeded the standard in some rice and corn, with the exceeding rate of 20% and 15.6% respectively. Cd, Cr and Pb exceeded the standard in some sweet potatoes, and the exceeding rates were 22.2%, 5.56% and 27.8%, respectively. Evaluation of the soil by geological accumulation index, Hg pollution was relatively serious, and its pollution level was medium pollution or very heavy pollution, As and Cd were generally light pollution, and the remaining heavy metals were basically pollution-free. The potential ecological hazard index showed that Hg, Cd and As were the main ecological hazard elements, Hg ecological risk was mainly extremely strong, Cd ecological risk was mainly medium and strong, and As ecological risk was mainly slight risk. The heavy metal health risk assessment results showed adults and children had a higher risk of As by rice ingestion. The heavy metal health risk assessment of multiple heavy metals showed that adult had no significant health effects by corn ingestion. However, there were significant health effects by rice and sweet potato ingestion. Meanwhile, The heavy metal health risk assessment results showed children were more susceptible to the heavy metal pollution, the THQ of rice, corn and sweet potatoes are all greater than 1.
-
Key words:
- the mercury ore of Chongqing /
- soil /
- crops /
- heavy metal /
- ecological risk /
- health risk
-
人类活动是造成土壤重金属污染的重要成因,比如:金属冶炼、矿产开采、煤燃烧、汽车尾气排放、污水灌溉等[1]。我国是汞矿资源大国,随着工业化进程的快速发展,化工、医疗等行业对汞的需求量不断增加,而汞矿山开采是其主要来源。虽然矿产资源的开发利用可推动国家和地方的经济发展,但大量的矿产资源开采易使矿区及周边的土壤、地下水以及农作物受到重金属污染[2-5]。大量的研究显示,汞矿区及周边土壤-农作物污染严重,如湘西茶田汞矿区土壤中Hg、Cd、As、Pb、Zn均存在污染,其中Hg和Cd污染较为严重[6];陕西旬阳汞矿区稻田稻米和土壤中Hg含量远超我国农作物和土壤质量标准[7];贵州万山汞矿区土壤中Ni、As、Cd、Hg元素平均含量均超过农用地土壤筛选值,其中Hg元素平均含量超标达70倍[8];贵州丹寨—三都汞矿区土壤中As、Cd、Hg超标率分别达44%、11%、44%,水稻Cd、Cr、Cu、Pb、Zn 等5 种重金属含量超过我国农作物重金属限量标准[9]。重金属进入土壤后因不能被生物降解而长期存在于土壤中且不断积累,不仅影响土壤性质和功能、降低农产品的产量和质量,而且可以通过农作物累积进入食物链,造成当地居民的重金属健康风险[10-11]。
重庆市汞矿的资源优势与贵州、陕西齐名,累计查明汞金属资源储量14271 t,保有资源储量13077 t,列全国第3位[12]。重庆市汞矿集中分布在东南部酉阳、秀山、黔江三区县,矿产地及资源储量均以酉阳县为主,重庆市最大的汞矿(羊石坑汞矿床)位于秀山溪口镇。重庆东南部汞矿储量巨大,对汞矿区周边耕地环境构成了严重威胁,影响着该地区的农业经济发展。1:25万土地质量地球化学调查表明重庆秀山-酉阳地区As、Cd、Hg存在明显的局部聚集[13]。张龙等[14]曾报道秀山汞矿区土壤Hg最高超过土壤环境二级标准值的2倍,并指出矿山的冶炼炉渣和烟道排气是矿区土壤汞的主要来源,而污染大气的汞沉降是下游旱田土壤汞污染的主要途径。李柳[15]评价了秀山溪口乡五龙村汞矿区土壤重金属生态风险,发现全部土壤样品的生态危害程度均为极强。鲍丽然等[16]也指出秀山县西北部汞矿、锰矿区农田土壤As、Cd、Cr、Cu、Hg、Ni、Pb、Zn等重金属均高于重庆土壤背景值,受开矿影响最明显。但以往的研究主要集中在秀山汞矿区及周围土壤污染和生态风险评价,缺少对酉阳汞矿区的研究,并少有对汞矿区周边农作物开展调查。
本文通过对重庆东南部汞矿区内主要农作物及其种植土壤的重金属含量进行调查分析,探讨汞矿区土壤、农作物重金属的分布、积累特征,系统分析土壤重金属污染特征和生态风险,并评价食用农作物的人体健康风险,以期为土壤重金属污染防治、区域农产品安全和居民健康生活提供科学依据。
1. 材料与方法(Materials and methods)
1.1 研究区概况
本研究区位于重庆市东南部,为扬子陆块南部被动边缘褶冲带,古生代碳酸盐岩建造发育,燕山期盖层褶皱发育,并伴随区域性走向断层产生,形成剪切破碎带,为地下水热液成矿创造了良好条件,形成规模较大的汞、铅锌等层控矿床,汞矿主要赋存于寒武系下统清虚洞组的白云岩[17]。秀山-酉阳地区为渝、鄂、湘、黔四省结合部位,地理坐标介于东经108°18′17—109°19′12,北纬28°09′43—29°24′4之间。研究区主要分布属亚热带湿润季风气候,四季分明,气温正常,降水充沛,山地气候垂直分异性明显,立体气候显著。区内喀斯特地貌发育典型,大致分为中山区(800—1895 m)、低山区(600—800 m)和槽谷平坝区(263—600 m)。该区农业生产条件极具优势,为重庆市优质粮食基地县,但区内汞矿分布较多,威胁着周边生态环境(图1)。
1.2 样品采集与分析测试
研究区采集大宗农作物(水稻、玉米和红薯)及其种植土壤样品,采用GPS定位法共采取根系土壤样品95件,水稻45件,玉米32件,红薯18件,其采样点基本均匀分布于农耕区。在每个采样点周围按照梅花点法5点采样,每个点采取农作物100—200 g,组合成1个混合样;并在每个农作物样点用竹铲采集0—20 cm深度内的耕作层根系土壤,混合均匀后采用四分法留取1 kg混合土样。土壤样品在室内自然风干后去除植物根系、砾石等杂质,用玛瑙研钵磨细,置于塑料袋中密封;农作物样品去壳或皮,风干,在送往实验室化验分析。
对土壤样品进行了pH、As、Cd、Cr、Cu、Hg、Ni、Pb、Zn等 9项指标的分析,农作物样品进行As、Cd、Cr、Cu、Hg、Ni、Pb和Zn 8项指标的分析,所有样品分析均在重庆地质矿产测试中心完成。测试过程严格按照《DZ/T0295—2016 土地质量地球化学评价规范》的有关规定执行。分析指标、测定方法及检出限见表1。准确度和精密度采用国家一级标准物质进行控制,元素分析准确度和精密度合格率均高于98%;元素报出率高于95%。
表 1 元素分析方法与检出限(mg·kg−1)Table 1. The element analysis methods and detection limit(mg·kg−1)指标Indicator 测定方法Assay method 检出限Detection limit 指标Indicator 测定方法Assay method 检出限Detection limit Cr X射线荧光光谱法 3 Cu 等离子体发射光谱法 1 Pb X射线荧光光谱法 2 Ni 等离子体发射光谱法 1 Zn X射线荧光光谱法 1 Cd 等离子体质谱法 0.02 As 原子荧光光谱法 0.2 pH pH计电极法 0.1 Hg 原子荧光光谱法 0.0005 1.3 评价方法
1.3.1 土壤重金属污染评价
采用德国科学家Muller提出的地累积指数法[18],评价土壤重金属的污染水平,计算公式为:
Igeo=log2[Cik×Si] (1) 式中,Igeo为重金属i的地累积指数;Ci为土壤中重金属i的实测值;Si为参比值,选用重庆市土壤重金属元素背景值[16];k为修正系数,一般为1.5。重金属地累积指数Igeo分级与污染程度关系如表2所示[19]。
表 2 地累积指数污染程度划分标准Table 2. Igeo index and the criteria of pollution grade地累积指数Igeo 级别Level 污染程度Pollution level Igeo<0 0 无污染 0≤Igeo<1 1 轻污染 1≤Igeo<2 2 中污染 2≤Igeo<3 3 中—重污染 3≤Igeo<4 4 重污染 4≤Igeo<5 5 重—极重污染 5≤Igeo 6 极重污染 1.3.2 土壤重金属生态风险评价
瑞典著名地球化学家Hakanson[20]提出的潜在生态指数法是目前最为常用的评价土壤重金属污染程度的方法之一,该方法将重金属的含量、重金属的生态效应、环境效应和毒理学效应均联系起来[16, 21-22]。其计算公式如下:
RI=n∑i=1Eir=n∑i=1(Tir×Cif)=n∑i=1(Tir×CiCin) (2) 式中,Cfi为某一金属的污染指数;Ci为土壤中某重金属的实测值;Cni为某重金属参比值,采用重庆市土壤重金属背景值[16];Eri为单项重金属潜在生态风险指数;Tri为某重金属的毒性响应参数,各重金属毒性系数为:Zn=1<Cr=2<Cu=Ni=Pb=5<As=10<Cd=30<Hg=40[23];RI 为总的潜在生态风险指数。根据Eri和RI,将单因子潜在生态危害和总潜在生态危害进行分级。因Hakanson 研究的是PCB、Hg、Cd、As、Pb、Cu、Cr 和Zn 等8 种污染物的潜在生态风险,并根据污染物中最大毒性系数( TPCB = THg =40) 和8 种污染物的毒性响应系数之和(133) 提出Eri和RI的分级标准,因此应用RI进行生态风险评价时,必须根据污染种类、数量和毒性系数进行调整。本文根据文献[22]的研究方法对分级标准进行了相应的调整,调整后重金属潜在生态风险指标分级标准如表3所示。
表 3 土壤重金属潜在生态风险指标分级标准Table 3. Classification criteria of soil heavy metal potential ecological risk index潜在生态危害系数(Ei) 总潜在生态危害系数(RI) 潜在生态风险分级Classification of potential ecological risks Hakanson 本文This study Hakanson 本文This study Ei <40 Ei <40 RI <150 RI <120 轻度生态危害 40≤ Ei <80 40≤ Ei <80 150≤ RI <300 120≤ RI <240 中度生态危害 80≤ Ei <160 80≤ Ei <160 300≤ RI <600 240≤ RI <480 强度生态危害 160≤ Ei <320 160≤ Ei <320 600≤ RI <1200 480≤ RI <960 很强生态危害 Ei ≥320 Ei ≥320 RI ≥1200 RI≥960 极强生态危害 1.3.3 农作物重金属的健康风险评价
长期食用受到重金属污染的农作物,会造成慢性病风险,采用USEPA 公布的健康风险评估模型评价居民食用该区域农作物的健康风险,评价步骤包括暴露计算和风险表征[24]。
( 1 )暴露计算
日均暴露剂量(CDI)计算公式为:
CDI=Ci×IR×EF×EDBW×AT (3) 式中,CDI为重金属通过农作物的日平均摄入量,(mg·kg−1);Ci为农作物重金属i含量(mg·kg−1);IR为人体每日对农作物的食用量(g·d−1),根据对研究区400人实地问卷调查数据,成人水稻、玉米和红薯的平均摄入量分别为0.300、0.045、0.069 kg·d−1,儿童分别为0.176、0.033、0.046 kg·d−1;其余参数见表4。
表 4 健康风险评价模型参数Table 4. The parameters of health risk assessment model(2) 健康风险表征
健康风险指数(HQ)计算公式为:
HQ=CDIRfD (4) THQ=∑ni=1HQ (5) 式中,HQ为单一重金属的健康风险指数;THQ为多种重金属总健康风险指数;RfD为重金属暴露参考剂量[mg·(kg·d)−1],As、Cd、Cr、Cu、Hg、Ni、Pb、Zn的RfD取值分别为0.0003、0.001、1.5、0.04、0.0003、0.02、0.004、0.3[25-26]。如果THQ≤1表明没有明显的健康影响;THQ>1表明对人体健康产生影响的可能性大;THQ>10表明存在慢性毒性效应。
1.3.4 农作物重金属富集系数
元素富集系数是农作物样品某元素含量与根系土中对应元素含量的比值,反映出植物对土壤中元素的吸收富集能力,可用来表征元素的生物有效性[27],计算式如下:
K=Cplant/Csoil (6) 式中,K 表示元素的富集系数;Cplant为重金属元素在作物中的含量,单位为mg·kg−1;Csoil为重金属元素在根系土中的含量,单位为mg·kg−1.
2. 结果与讨论(Results and discussion)
2.1 土壤重金属含量特征
研究区土壤pH值在4.33—8.22范围内,平均值为6.34,整体处于偏酸性水平。如表5所示,水稻田、玉米地和红薯地土壤重金属平均含量由高至低依次均为Zn>Cr>Pb>Ni>Cu>As>Hg>Cd,并均高于重庆市土壤背景值,表明重金属在土壤中都有一定程度的累积。水稻田、玉米地和红薯地土壤Hg含量分别为0.088—46.5、0.115—432 、0.112—115 mg·kg−1,平均含量分别是重庆土壤背景值的62、261、132倍;Cd和As平均值分别为0.752、0.817、1.07 mg·kg−1和14.9、19.7、22.9 mg·kg−1,是重庆土壤背景值的2—4倍;Cu、Pb、Zn、Cr和Ni是重庆土壤背景值的1—2倍左右,显然土壤中Hg积累效应最明显,Cd、As次之。对比水稻田、玉米地和红薯地,As、Cd、Cr、Ni、Zn的平均含量为红薯地>玉米地>水稻田;Cu和Hg的平均含量为玉米地>红薯地>水稻田;Pb的平均含量为红薯地>水稻田>玉米地。
表 5 研究区土壤重金属含量特征(mg·kg−1)Table 5. Concentrations distribution of heavy metals in soil(mg·kg−1)耕地Farland 统计值Statistic As Cd Cr Cu Hg Ni Pb Zn pH 水稻田Paddy field 最小值Minimun 4.24 0.273 44.5 17 0.088 18 19.6 79.2 4.78 最大值Maximum 57.8 2.02 139 55.6 46.5 71.5 75.3 165.5 7.97 平均值Average 14.9 0.752 80.4 33.1 4.31 37.3 45.0 117 6.37 几何平均值Geometric mean 12.6 0.673 79.1 31.9 1.12 36.3 43.8 115 6.31 变异系数Variable coefficient 0.683 0.513 0.188 0.292 2.18 0.254 0.247 0.182 0.135 玉米地Corn field 最小值Minimun 5.67 0.217 40.5 16.2 0.115 18.5 27.7 67.9 4.33 最大值Maximum 44.6 2.4 115 96.8 432 65 78.7 220 8.22 平均值Average 19.7 0.817 81.4 39 18 39.1 44.2 122 6.13 几何平均值Geometric mean 18.1 0.703 79.6 34.7 0.881 37.3 42.9 117 6.02 变异系数Variable coefficient 0.415 0.614 0.207 0.536 4.24 0.31 0.255 0.291 0.198 红薯地Sweet potato field 最小值Minimun 8.03 0.335 49 21 0.112 25 26.9 78.9 5.1 最大值Maximum 50.2 2.82 103 75.6 115 70.9 119 315 8.08 平均值Average 22.9 1.07 83.3 36.6 9.17 41.3 47.5 138 6.64 几何平均值Geometric mean 20.8 0.905 81.9 34.4 0.961 39.6 44.6 129 6.59 变异系数Variable coefficient 0.468 0.611 0.17 0.393 2.94 0.315 0.441 0.415 0.129 参照值Reference value 重庆土壤背景值Soil background value of Chongqing 6.62 0.28 74.4 24.6 0.069 31.6 28.1 81.9 — 土壤环境质量标准值Environmental quality standard for soils 30a 0.3 a 150 a 50 a 0.5 a 60 a 70 a 200 a — 30 b 0.3 b 150 b 50 b 0.5 b 70 b 90 b 200 b — 25 c 0.3 c 200 c 100 c 0.6 c 100 c 120 c 250 c — 20 d 0.6 d 250 d 100 d 1 .0d 190 d 170 d 300 d — 注:1) pH和变异系数无量纲;2)土壤环境质量标准值来源于《土壤环境质量标准 农用地土壤污染风险管控标准(试行)》( GB15618—2008) 二级标准,a 为土壤pH< 5.5,b 为pH 介于5.5—6.5 之间,c 为土壤pH 介于6.5—7.5 之间,d 为土壤pH>7.5时分别对应的质量标准. Note: 1) pH and coefficient of variation are dimensionless; 2) The standard value of soil environmental quality originates from the secondary standard of soil environmental quality standard (GB15618—2008) , a is soil pH< 5.5,b is pH between 5.5 and 6.5, c is soil pH between 6.5and 7.5, and d is the corresponding quality standard when soil pH>7.5. 变异系数可以反映人为活动对环境的干扰程度,变异系数小于0.1为弱变异,0.1—0.3之间为中变异,大于0.3为强变异[28]。从变异系数来看,Hg明显高于其它元素,水稻田、玉米地和红薯地变异系数分别达到2.18、4.24、2.94。此外,水稻田As、Cd变异系数较高,分别为0.683、0.513;玉米地Cd、Cu、As变异系数较高,分别为0.614、0.536和0.415;红薯地Cd、As、Pb、Zn、Cu变异系数较高,分别为0.611、0.468、0.441、0.415、0.393。变异系数越大,元素在土壤中分布越不均匀,受人类活动影响越大,研究区土壤中Hg元素(变异系数均大于1)受区域汞矿开采等影响最大,其次是Cd、As。
与土壤环境质量标准值对比,研究区耕地土壤中Cr均未超标,Pb有1个样品超标,Ni、Zn、Cu有少量样品超标,Cd、Hg、As则存在较多样品超标,Cd最高值是标准值的7.82倍,Hg最高值超出标准值的100倍以上,As最高值是标准值的2.51倍(图2)。其中水稻田中Cd、Hg、As分别有40、28、5件样品超过农用地土壤筛选值,超标率分别为88.9%、62.2%、11.1%;玉米地中Cd、Hg、As分别有26、14、6件样品超过农用地土壤筛选值,超标率分别为81.3%、43.8%、18.8%;红薯地中Cd、Hg、As分别有18、8、3件样品超过农用地土壤筛选值,超标率分别为100%、44.4%、16.7%。因此,Cd、Hg、As是该区土壤主要超标元素,尤其是Cd超标率均大于80%,对周边生态环境、农作物安全和人体健康带来危害的可能性较大。
2.2 农作物重金属含量特征
研究区农作物水稻中重金属含量由高至低依次为Zn>Cu>Ni>Cr>Cd>As>Pb>Hg;玉米种重金属含量由高至低依次为Zn>Cu>Ni>Cr>Cd>Pb>As>Hg;红薯中重金属含量由高至低依次为Zn>Cu>Ni>Cr>Pb>Cd>As>Hg,水稻、玉米和红薯中Zn的含量都是最大,其次为Cu、Ni、Cr,而Hg含量最低。水稻中重金属As、Cd、Cr、Cu、Hg、Ni、Pb、Zn的平均值分别为0.159、0.202、0.269、2.239、0.005、0.473、0.048、19.6 mg·kg−1;玉米中重金属As、Cd、Cr、Cu、Hg、Ni、Pb、Zn的平均值分别为0.007、0.058、0.178、1.768、0.003、0.482、0.045、18.2 mg·kg−1;红薯中重金属As、Cd、Cr、Cu、Hg、Ni、Pb、Zn的平均值分别为0.029、0.065、0.525、4.803、0.004、0.659、0.133、7.069 mg·kg−1。研究区农作物绝大多数重金属变异系数均大于0.3(表6),因此认为研究区内农作物中重金属来源受外界干扰较大,可能与研究区矿产开采等人为活动有关。
表 6 研究区农作物重金属含量特征Table 6. Concentrations distribution of heavy metals in crops农作物Crop 元素Element 极小值/(mg·kg−1)Minimum 极大值/(mg·kg−1)Maximum 均值/(mg·kg−1)Average 标准差/(mg·kg−1)Standard deviation 变异系数/%Coefficient of variation 富集系数/%Concentration coefficient GB2762—2017/(mg·kg−1) 水稻Rice As 0.044 0.42 0.159 0.101 0.635 0.013 0.5 Cd 0.004 1.38 0.202 0.339 1.683 0.276 0.2 Cr 0.051 0.618 0.269 0.172 0.64 0.004 1 Cu 0.47 4.62 2.239 1.013 0.453 0.073 — Hg 0.002 0.01 0.005 0.002 0.45 0.009 0.02 Ni 0.152 1.48 0.473 0.299 0.631 0.011 — Pb 0.022 0.095 0.048 0.017 0.36 0.001 0.2 Zn 12.3 25 19.6 2.817 0.144 0.173 — 玉米Corn As 0 0.01 0.007 0.004 0.619 0.0002 0.5 Cd 0.006 0.202 0.058 0.051 0.883 0.06 0.1 Cr 0.053 0.514 0.178 0.121 0.681 0.002 1 Cu 1.07 2.8 1.768 0.471 0.266 0.055 — Hg 0.001 0.005 0.003 0.001 0.291 0.004 0.02 Ni 0.14 1.588 0.482 0.309 0.64 0.01 — Pb 0.027 0.072 0.045 0.016 0.36 0.0002 0.2 Zn 13.25 25.9 18.17 2.617 0.144 0.16 — 红薯Sweetpotato As 0.009 0.088 0.029 0.028 0.956 0.001 0.5 Cd 0.008 0.189 0.065 0.05 0.763 0.077 0.1 Cr 0.04 2.01 0.525 0.512 0.975 0.005 1 Cu 1.6 9.62 4.803 2.741 0.571 0.156 — Hg 0.001 0.008 0.004 0.002 0.606 0.009 0.02 Ni 0.16 1.55 0.659 0.368 0.558 0.014 — Pb 0.02 0.403 0.133 0.126 0.951 0.003 0.2 Zn 2 14.4 7.069 3.999 0.566 0.059 — 在所采集的所有农作物样品中,除水稻Cd以外,其余农作物重金属元素的平均含量均未超过《食品安全国家标准 食品中污染物限量》(GB2726—2017)中的标准限值(表6)。水稻中Cd超标率为20%,As、Cr、Hg和Pb均没有点位超标;玉米中部分点位的Cd含量超标,超标率为15.6%,其余元素均未超标;红薯中部分点位Cd、Cr和Pb含量超标,超标率分别为22.2%、5.56%和27.8%。综合重金属含量、重金属超标种类和超标率等指标可知,研究区农作物受Cd污染的风险最高,这与Cd较高的迁移能力有关[29];红薯污染程度最高,玉米受污染程度最低,可以通过调整种植结构,提高土地利用效率,改善农作物质量。
2.3 农作物重金属元素富集特征
如表6所示,水稻中重金属元素富集系数大小顺序为Cd>Zn>Cu>As>Ni>Hg>Cr>Pb;玉米中重金属元素富集系数大小顺序为Zn>Cd>Cu>Ni>>Hg>Cr>Pb>As;红薯中重金属元素富集系数大小顺序为Cu>Cd>Zn>Ni>Hg>Cr>Pb>As。8种重金属元素在水稻、玉米和红薯中Cd、Zn和Cu的富集系数较高(图3),Zn、Cu 是农作物的营养元素,农作物对其有一定的需求量,故Zn、Cu 在农作物中吸收能力较强;Cd 在土壤中有较强的可移动性,且作物对Cd 有较强的吸收能力,同时Cd 在偏酸性土壤中溶解度增大,而研究区整体处于偏酸性水平,增强了Cd迁移富集能力[30]。此外,水稻中As的富集系数也较高,由于淹水稻田的厌氧条件和水稻对三价As较强的吸收能力,导致水稻中积累了较高含量的As[29]。而水稻、玉米和红薯中Cr、Hg、Pb的富集系数较低,研究表明长期施肥使Cr的有效性在逐步降低,从不稳定形态(可交换态和碳酸盐结合态)向较为稳定的形态转化(铁锰氧化物结合态和有机结合态),造成Cr不易向农作物中迁移[31];相对土壤中其他形态Hg而言,有机-硫化态Hg的生物可利用性强,研究区Hg的富集系数较低可能与矿区土壤中酸交换态Hg含量较低并且变幅较大有关[32]。土壤中Pb主要以不易溶于水的Pb(OH)2、PbCO3、PbSO4形式存在,土壤的有机质含有能大量吸附土壤中Pb+的腐殖质,使得Pb在土壤中大量沉积富集,阻碍了作物对Pb的吸收[33]。
2.4 土壤重金属污染程度分析
利用式(1)对研究区土壤重金属污染程度进行地累积指数评价,重金属污染指数平均值从高至低顺序为Hg>Cd>As>Pb>Zn>Cu>Ni>Cr(表7)。土壤Hg污染最严重,几乎所有土壤样都受到不同程度的Hg污染,其中中污染和极重污染样品较多,分别占样本总数的24.2%和23.2%,轻污染、中—重污染、重污染和重—极重污染分别占16.8%、12.6%、14.7%和7.37%,只有1件样品呈无污染状态。As、Cd的地累积指数均值介于0—1之间,总体处于轻污染水平,部分样品As和Cd达到中—重污染。Cr、Cu、Ni、Pb、Zn总体呈无—轻污染状态,极少数样品达到中污染。因此,研究区土壤Hg污染现象最为突出,污染程度重、样品多。
表 7 土壤重金属污染地累积指数分级Table 7. The classification of heavy metals in soil based on the Igeo元素Element 指数均值Index of average 各级样本数Samples of all levels 无污染Non-pollution 轻污染Mild pollution 中污染Middle pollution 中—重污染Middle-heavy pollution 重污染Heavy pollution 重—极重污染Heavy-extreme pollution 极重污染Extreme pollution As 0.659 19 48 23 5 0 0 0 Cd 0.783 14 47 27 7 0 0 0 Cr −0.484 92 3 0 0 0 0 0 Cu −0.149 61 30 4 0 0 0 0 Hg 3.275 1 16 23 12 14 7 22 Ni −0.349 70 20 0 0 0 0 0 Pb 0.05 53 41 1 0 0 0 0 Zn −0.055 58 36 1 0 0 0 0 2.5 土壤重金属潜在生态风险评价
以重庆市土壤背景值作为参比值,利用式(2)对研究区土壤开展潜在生态危害风险评价(表8)。从单项重金属潜在生态风险看,全部样品的Cr、Cu、Ni、Pb和Zn生态风险指数均小于40,为轻微生态风险;As风险指数范围为6.40—87.2,存在轻微至强生态风险,以轻微风险为主,占84.2%;Cd风险指数范围为23.3—302,存在轻微至很强的生态风险,以中等风险和强等风险为主,分别占45.3%和37.9%;Hg风险指数范围为51.2—250584,存在中等至极强生态风险,以极强风险为主,占54.7%;因此,Hg、Cd为研究区土壤主要生态危害元素,As也有较轻的生态危害风险。
表 8 土壤重金属的潜在生态危害指数统计Table 8. Potential ecological risk coefficient for every heavy metal in soil危害指数Hazard index 分布范围Distribution range 各级样本数Samples of all levels 轻微Mild 中Middle 强Heavy 很强Very heavy 极强Extreme Ei As 6.40—87.2 80 14 1 0 0 Cd 23.3—302 10 43 33 9 0 Cr 1.09—3.73 95 0 0 0 0 Cu 3.29—19.7 95 0 0 0 0 Hg 51.2—250584 0 7 21 15 52 Ni 2.84—11.3 95 0 0 0 0 Pb 3.49—21.1 95 0 0 0 0 Zn 0.830—3.85 95 0 0 0 0 RI 131—250757 0 15 32 48 0 研究区重金属总的潜在生态指数RI分布范围为131—250757,存在中等至很强的生态风险,以强风险和很强风险为主,所占比例分别为33.7%和50.5%。RI空间分布图(图4)显示,研究区大部分地区处于强—很强风险,土壤生态风险与汞矿区分布基本一致,西北部和东南缘距离汞矿区较远,生态风险最低,表现为中等或轻微强度。
2.6 农作物重金属健康风险评价
利用USEPA推荐的健康风险模型分别计算研究区成人和儿童通过食用农作物摄入重金属的风险值(HQ),3种不同农作物不同重金属的健康风险评价结果见表9。由表9可知,就单一重金属的HQ而言,3种不同农作物的健康风险有较明显的差异,水稻为As>Cd>Zn>Cu>Ni>Hg>Pb>Cr;玉米为Zn>Cu>Cd>Ni>As>Hg>Pb>Cr;红薯为Cu>As>Cd>Pb>Ni>Zn>Hg>Cr。无论成人还是儿童,除水稻As的HQ>1,其余食用农作物摄入重金属的风险平均值小于1,说明研究区居民食用水稻存在较高的As风险。食用农作物水稻、玉米和红薯,儿童重金属单项风险指数均高于成人,受危害的可能性更大。重金属在农作物中并不是单一存在的,二是共同存在于农作物中,复合健康风险评价结果,表现为水稻>红薯>玉米。成人食用水稻和红薯的THQ>1,说明对人体健康产生影响的可能性大;食用玉米的THQ<1,说明对人体没有明显的健康影响。儿童食用水稻、玉米和红薯的THQ均大于1,尤其是食用水稻(THQ平均值达到9.86)存在明显的复合健康风险,应引起重视。
表 9 土壤重金属健康风险指数Table 9. Health risk index of heavy metals in soil类型Type 农作物Crops HQ THQ As Cd Cr Cu Hg Ni Pb Zn 成人Adult 水稻 2.272 0.864 0.001 0.240 0.068 0.083 0.033 0.280 3.842 玉米 0.050 0.180 0.001 0.189 0.025 0.081 0.009 0.260 0.794 红薯 0.302 0.280 0.001 0.515 0.037 0.110 0.134 0.101 1.480 儿童Children 水稻 5.832 2.218 0.002 0.616 0.175 0.214 0.085 0.719 9.860 玉米 0.129 0.461 0.001 0.486 0.063 0.207 0.023 0.666 2.038 红薯 0.775 0.719 0.003 1.321 0.096 0.282 0.344 0.259 3.799 3. 结论(Conclusion)
(1) 重庆市汞矿区水稻田、玉米地和红薯地土壤中As、Cd、Cr、Cu、Hg、Ni、Pb、Zn等重金属均高于重庆土壤背景值,Hg元素最为突出,且变异系数大,受开矿影响最明显,其次是Cd、As。与国家农用地土壤污染风险筛选值相比,Cd、Hg、As是研究区土壤主要超标元素,可能会产生生态健康危害。
(2) 研究区水稻、玉米和红薯中Zn的含量都是最大,其次为Cu、Ni、Cr,Hg含量最低。与食品安全国家标准相比,水稻和玉米中Cd超标,超标率分别为20%、15.6%;部分红薯中Cd、Cr和Pb超标,超标率分别为22.2%、5.56%和27.8%。
(3) 地累积指数评价结果显示,该区土壤Hg污染现象最为严重,以中污染和极重污染为主,As、Cd总体处于轻污染水平,Cr、Ni、Cu、Pb、Zn总体呈无—轻污染状态。
(4) 重金属潜在生态风险评价结果表明,研究区土壤潜在重金属生态危害主要表现为Hg、Cd和As,Hg以极强风险为主,Cd以中等风险和强等风险为主,As以轻微风险为主,其余重金属危害不明显。研究区大部分地区处于强—很强风险,土壤生态风险与汞矿区分布基本一致,西北部和东南缘距离汞矿区较远,生态风险最低。
(5) 单一重金属健康风险指数表明研究区居民食用水稻存在较高的As风险;多种重金属总健康风险指数显示成人食用玉米没有明显的健康影响,但食用水稻、红薯存在明显的复合健康风险;同时儿童更易受到重金属污染威胁,食用水稻、玉米和红薯的THQ均大于1,尤其是食用水稻(THQ平均值达到9.86)存在明显的复合健康风险,应引起重视。
-
表 1 元素分析方法与检出限(mg·kg−1)
Table 1. The element analysis methods and detection limit(mg·kg−1)
指标Indicator 测定方法Assay method 检出限Detection limit 指标Indicator 测定方法Assay method 检出限Detection limit Cr X射线荧光光谱法 3 Cu 等离子体发射光谱法 1 Pb X射线荧光光谱法 2 Ni 等离子体发射光谱法 1 Zn X射线荧光光谱法 1 Cd 等离子体质谱法 0.02 As 原子荧光光谱法 0.2 pH pH计电极法 0.1 Hg 原子荧光光谱法 0.0005 表 2 地累积指数污染程度划分标准
Table 2. Igeo index and the criteria of pollution grade
地累积指数Igeo 级别Level 污染程度Pollution level Igeo<0 0 无污染 0≤Igeo<1 1 轻污染 1≤Igeo<2 2 中污染 2≤Igeo<3 3 中—重污染 3≤Igeo<4 4 重污染 4≤Igeo<5 5 重—极重污染 5≤Igeo 6 极重污染 表 3 土壤重金属潜在生态风险指标分级标准
Table 3. Classification criteria of soil heavy metal potential ecological risk index
潜在生态危害系数(Ei) 总潜在生态危害系数(RI) 潜在生态风险分级Classification of potential ecological risks Hakanson 本文This study Hakanson 本文This study Ei <40 Ei <40 RI <150 RI <120 轻度生态危害 40≤ Ei <80 40≤ Ei <80 150≤ RI <300 120≤ RI <240 中度生态危害 80≤ Ei <160 80≤ Ei <160 300≤ RI <600 240≤ RI <480 强度生态危害 160≤ Ei <320 160≤ Ei <320 600≤ RI <1200 480≤ RI <960 很强生态危害 Ei ≥320 Ei ≥320 RI ≥1200 RI≥960 极强生态危害 表 4 健康风险评价模型参数
Table 4. The parameters of health risk assessment model
表 5 研究区土壤重金属含量特征(mg·kg−1)
Table 5. Concentrations distribution of heavy metals in soil(mg·kg−1)
耕地Farland 统计值Statistic As Cd Cr Cu Hg Ni Pb Zn pH 水稻田Paddy field 最小值Minimun 4.24 0.273 44.5 17 0.088 18 19.6 79.2 4.78 最大值Maximum 57.8 2.02 139 55.6 46.5 71.5 75.3 165.5 7.97 平均值Average 14.9 0.752 80.4 33.1 4.31 37.3 45.0 117 6.37 几何平均值Geometric mean 12.6 0.673 79.1 31.9 1.12 36.3 43.8 115 6.31 变异系数Variable coefficient 0.683 0.513 0.188 0.292 2.18 0.254 0.247 0.182 0.135 玉米地Corn field 最小值Minimun 5.67 0.217 40.5 16.2 0.115 18.5 27.7 67.9 4.33 最大值Maximum 44.6 2.4 115 96.8 432 65 78.7 220 8.22 平均值Average 19.7 0.817 81.4 39 18 39.1 44.2 122 6.13 几何平均值Geometric mean 18.1 0.703 79.6 34.7 0.881 37.3 42.9 117 6.02 变异系数Variable coefficient 0.415 0.614 0.207 0.536 4.24 0.31 0.255 0.291 0.198 红薯地Sweet potato field 最小值Minimun 8.03 0.335 49 21 0.112 25 26.9 78.9 5.1 最大值Maximum 50.2 2.82 103 75.6 115 70.9 119 315 8.08 平均值Average 22.9 1.07 83.3 36.6 9.17 41.3 47.5 138 6.64 几何平均值Geometric mean 20.8 0.905 81.9 34.4 0.961 39.6 44.6 129 6.59 变异系数Variable coefficient 0.468 0.611 0.17 0.393 2.94 0.315 0.441 0.415 0.129 参照值Reference value 重庆土壤背景值Soil background value of Chongqing 6.62 0.28 74.4 24.6 0.069 31.6 28.1 81.9 — 土壤环境质量标准值Environmental quality standard for soils 30a 0.3 a 150 a 50 a 0.5 a 60 a 70 a 200 a — 30 b 0.3 b 150 b 50 b 0.5 b 70 b 90 b 200 b — 25 c 0.3 c 200 c 100 c 0.6 c 100 c 120 c 250 c — 20 d 0.6 d 250 d 100 d 1 .0d 190 d 170 d 300 d — 注:1) pH和变异系数无量纲;2)土壤环境质量标准值来源于《土壤环境质量标准 农用地土壤污染风险管控标准(试行)》( GB15618—2008) 二级标准,a 为土壤pH< 5.5,b 为pH 介于5.5—6.5 之间,c 为土壤pH 介于6.5—7.5 之间,d 为土壤pH>7.5时分别对应的质量标准. Note: 1) pH and coefficient of variation are dimensionless; 2) The standard value of soil environmental quality originates from the secondary standard of soil environmental quality standard (GB15618—2008) , a is soil pH< 5.5,b is pH between 5.5 and 6.5, c is soil pH between 6.5and 7.5, and d is the corresponding quality standard when soil pH>7.5. 表 6 研究区农作物重金属含量特征
Table 6. Concentrations distribution of heavy metals in crops
农作物Crop 元素Element 极小值/(mg·kg−1)Minimum 极大值/(mg·kg−1)Maximum 均值/(mg·kg−1)Average 标准差/(mg·kg−1)Standard deviation 变异系数/%Coefficient of variation 富集系数/%Concentration coefficient GB2762—2017/(mg·kg−1) 水稻Rice As 0.044 0.42 0.159 0.101 0.635 0.013 0.5 Cd 0.004 1.38 0.202 0.339 1.683 0.276 0.2 Cr 0.051 0.618 0.269 0.172 0.64 0.004 1 Cu 0.47 4.62 2.239 1.013 0.453 0.073 — Hg 0.002 0.01 0.005 0.002 0.45 0.009 0.02 Ni 0.152 1.48 0.473 0.299 0.631 0.011 — Pb 0.022 0.095 0.048 0.017 0.36 0.001 0.2 Zn 12.3 25 19.6 2.817 0.144 0.173 — 玉米Corn As 0 0.01 0.007 0.004 0.619 0.0002 0.5 Cd 0.006 0.202 0.058 0.051 0.883 0.06 0.1 Cr 0.053 0.514 0.178 0.121 0.681 0.002 1 Cu 1.07 2.8 1.768 0.471 0.266 0.055 — Hg 0.001 0.005 0.003 0.001 0.291 0.004 0.02 Ni 0.14 1.588 0.482 0.309 0.64 0.01 — Pb 0.027 0.072 0.045 0.016 0.36 0.0002 0.2 Zn 13.25 25.9 18.17 2.617 0.144 0.16 — 红薯Sweetpotato As 0.009 0.088 0.029 0.028 0.956 0.001 0.5 Cd 0.008 0.189 0.065 0.05 0.763 0.077 0.1 Cr 0.04 2.01 0.525 0.512 0.975 0.005 1 Cu 1.6 9.62 4.803 2.741 0.571 0.156 — Hg 0.001 0.008 0.004 0.002 0.606 0.009 0.02 Ni 0.16 1.55 0.659 0.368 0.558 0.014 — Pb 0.02 0.403 0.133 0.126 0.951 0.003 0.2 Zn 2 14.4 7.069 3.999 0.566 0.059 — 表 7 土壤重金属污染地累积指数分级
Table 7. The classification of heavy metals in soil based on the Igeo
元素Element 指数均值Index of average 各级样本数Samples of all levels 无污染Non-pollution 轻污染Mild pollution 中污染Middle pollution 中—重污染Middle-heavy pollution 重污染Heavy pollution 重—极重污染Heavy-extreme pollution 极重污染Extreme pollution As 0.659 19 48 23 5 0 0 0 Cd 0.783 14 47 27 7 0 0 0 Cr −0.484 92 3 0 0 0 0 0 Cu −0.149 61 30 4 0 0 0 0 Hg 3.275 1 16 23 12 14 7 22 Ni −0.349 70 20 0 0 0 0 0 Pb 0.05 53 41 1 0 0 0 0 Zn −0.055 58 36 1 0 0 0 0 表 8 土壤重金属的潜在生态危害指数统计
Table 8. Potential ecological risk coefficient for every heavy metal in soil
危害指数Hazard index 分布范围Distribution range 各级样本数Samples of all levels 轻微Mild 中Middle 强Heavy 很强Very heavy 极强Extreme Ei As 6.40—87.2 80 14 1 0 0 Cd 23.3—302 10 43 33 9 0 Cr 1.09—3.73 95 0 0 0 0 Cu 3.29—19.7 95 0 0 0 0 Hg 51.2—250584 0 7 21 15 52 Ni 2.84—11.3 95 0 0 0 0 Pb 3.49—21.1 95 0 0 0 0 Zn 0.830—3.85 95 0 0 0 0 RI 131—250757 0 15 32 48 0 表 9 土壤重金属健康风险指数
Table 9. Health risk index of heavy metals in soil
类型Type 农作物Crops HQ THQ As Cd Cr Cu Hg Ni Pb Zn 成人Adult 水稻 2.272 0.864 0.001 0.240 0.068 0.083 0.033 0.280 3.842 玉米 0.050 0.180 0.001 0.189 0.025 0.081 0.009 0.260 0.794 红薯 0.302 0.280 0.001 0.515 0.037 0.110 0.134 0.101 1.480 儿童Children 水稻 5.832 2.218 0.002 0.616 0.175 0.214 0.085 0.719 9.860 玉米 0.129 0.461 0.001 0.486 0.063 0.207 0.023 0.666 2.038 红薯 0.775 0.719 0.003 1.321 0.096 0.282 0.344 0.259 3.799 -
[1] 黄益宗, 郝晓伟, 雷鸣, 等. 重金属污染土壤修复技术及其修复实践 [J]. 农业环境科学学报, 2013, 32(3): 409-417. HUANG Y Z, HAO X W, LEI M, et al. The remediation technology and remediation practice of heavy metals-contaminated soil [J]. Journal of Agro-Environment Science, 2013, 32(3): 409-417(in Chinese).
[2] 丁振华, 王文华, 瞿丽雅, 等. 贵州万山汞矿区汞的环境污染及对生态系统的影响 [J]. 环境科学, 2004, 25(2): 111-114. DING Z H, WANG W H, ZAI L Y, et al. Mercury pollution and its ecosystem effects in Wanshan mercury miner area, Guizhou [J]. Environment Science, 2004, 25(2): 111-114(in Chinese).
[3] 孟其义, 钱晓莉, 陈淼, 等. 稻田生态系统汞的生物地球化学研究进展[J]. 生态学杂志, 2018, 298(5): 268-285. MENG Q Y, QIAN X L, CHEN M, et al, Biogeochemical cycle of mercury in rice paddy ecosystem: A critical review[J]. Chinese Journal of Ecology, 2018, 298(5): 268-285 ( in Chinese).
[4] ZHOU Y, AAMIR M, LIU K, et al. Status of mercury accumulation in agricultural soil across China: Spatial distribution, temporal trend, influencing factor and risk assessment [J]. Environmental Pollution, 2018, 240(9): 116-124. [5] 张成丽, 张伟平, 程红丹, 等. 禹州市煤矿区周边土壤和农作物重金属污染状况及健康风险评价 [J]. 环境化学, 2019, 38(4): 805-812. ZHANG C L, ZHANG W P, CHENG H D, et al. Heavy metal contamination and health risk assessment of farmland soil around coal mines in Yuzhou City [J]. Environmental Chemistry, 2019, 38(4): 805-812(in Chinese).
[6] 孙宏飞, 李永华, 姬艳芳, 等. 湘西汞矿区土壤中重金属的空间分布特征及其生态环境意义[J]. 环境科学, 2009, 30(4): 1159-1165. SUN H F, LI Y H, JI Y F, et al, Spatial distribution and ecological significance of heavy metals in soils from Chatian mercury mining deposit, western Hunan province[J]. Environment Science, 2009, 30(4): 1159-1165 (in Chinese).
[7] QIU G, FENG X, MENG B, et al. Environmental geochemistry of an active Hg mine in Xunyang, Shaanxi Province, China [J]. Applied Geochemistry, 2012, 27(12): 2280-2288. doi: 10.1016/j.apgeochem.2012.08.003 [8] 林勇征. 贵州万山汞矿区地球化学特征及环境质量评价[D]. 成都: 成都理工大学, 2017. LIN Y Z. The geochemical characteristics and environmenta levaluation of quality in mercury mine area of Guizhou Wanshan[D]. Chengdu: Chengdu University of Technology, 2017 (in Chinese).
[9] 倪莘然, 杨瑞东, 陈蓉, 等. 贵州丹寨-三都汞矿区土壤重金属和玉米Se, Mo, Zn含量及健康风险评价 [J]. 地质论评, 2020, 66(4): 1031-1044. NI Z R, YANG R D, CHEN R, et al. Health risk assessment of heavy metal and Se, Mo, Zn in the soil and maize in the Danzhai—Sandu mercury mining area, Guizhou [J]. Geological Review, 2020, 66(4): 1031-1044(in Chinese).
[10] 孙清斌, 尹春芹, 邓金锋, 等. 大冶矿区土壤-蔬菜重金属污染特征及健康风险评价 [J]. 环境化学, 2013, 32(4): 671-677. doi: 10.7524/j.issn.0254-6108.2013.04.020 SUN Q B, YIN C Q, DENG J F, et al. Characteristics of soil-vegetable pollution of heavy metals and health risk assessment in Daye mining area [J]. Environmental Chemistry, 2013, 32(4): 671-677(in Chinese). doi: 10.7524/j.issn.0254-6108.2013.04.020
[11] MAO C, SONG Y, CHEN L, et al. Human health risks of heavy metals in paddy rice based on transfer characteristics of heavy metals from soil to rice [J]. Catena, 2019, 175: 339-348. doi: 10.1016/j.catena.2018.12.029 [12] 孙阳, 周富春. 重庆市优势矿产资源加工业发展探讨 [J]. 矿业安全与环保, 2005(2): 30-33,57. SUN Y, ZHOU F C. Inquiring into development of processing industry of superior mineral resources in Chongqing [J]. Mining Safety and Environmental protection, 2005(2): 30-33,57(in Chinese).
[13] 曾琴琴, 王永华, 刘才泽, 等. 秀山-酉阳地区土壤环境地球化学特征 [J]. 四川地质学报, 2019, 39(2): 294-298. ZENG Q Q, WANG Y H, LIU Z C, et al. Pedogeochemistry in the Xiushan-Youyang Region [J]. Acta Geologica Sichuan, 2019, 39(2): 294-298(in Chinese).
[14] 张龙, 林先辉, 刘俏, 等. 秀山汞矿开采对当地土水环境的影响 [J]. 西南师范大学学报(自然科学版), 2011, 36(6): 105-109. ZHANG L, LIN X H, LIU Q, et al. Effects of mercury mine exploitation on local soil and water environment in Xiushan [J]. Journal of Southwest China Normal University (Natural Science Edition), 2011, 36(6): 105-109(in Chinese).
[15] 李柳. 溪口汞矿地区汞环境污染现状及风险评价研究[D]. 重庆: 重庆大学, 2014. LI L. Study on environmental pollution status and risk assessment of mercury in Xikou mercury mining area [D]. Chongqing: Chongqing University, 2014 (in Chinese).
[16] 鲍丽然, 邓海, 贾中民, 等. 重庆秀山西北部农田土壤重金属生态健康风险评价[J]. 中国地质. http://kns.cnki.net/kcms/detail/11.1167.P.20200220.1019.002.html. BAO L R, DENG H, JIA Z M, et al. Ecological and health risk assessment of heavy metals in farmland soil in northwest Xiushan, Chongqing [J]. Geology in China. http://kns.cnki.net/kcms/detail/11.1167.P.20200220.1019.002.html (in Chinese).
[17] 程军, 张丽红, 刘梓萱. 重庆市主要矿产资源分布及赋存特征[J]. 中国西部科技, 2011, 241(10): 3-5. CHENG J, ZHANG L H, LIU Z X. Distribution of main mineral resources and the orebearing feature in Chongqing[J]. 中国西部科技, 2011, 241(10): 3-5 (in Chinese). [18] MULLER G. Index of geoaccumulation in sediments of the Rhime River [J]. Geological Journals, 1969, 2: 109-118. [19] 赵庆令, 李清彩, 谢江坤, 等. 应用富集系数法和地累积指数法研究济宁南部区域土壤重金属污染特征及生态风险评价 [J]. 岩矿测试, 2015, 34(1): 129-137. ZHAO Q L, LI Q C, XIE J K, et al. Characteristics of soil heavy metal pollution and tts ecological risk assessment in south Jining district using methods of enrichment factor and index of geoaccumulation [J]. Rock and Mineral Analysis, 2015, 34(1): 129-137(in Chinese).
[20] HAKANSON L. An ecological risk index for aquatic pollution control a sediment to logical approach [J]. Water Research, 1980, 14(8): 975-1001. doi: 10.1016/0043-1354(80)90143-8 [21] 陆金, 赵兴青. 铜陵狮子山矿区土壤重金属污染特征及生态风险评价 [J]. 环境化学, 2017, 36(9): 1958-1967. doi: 10.7524/j.issn.0254-6108.2017010304 LU J, ZHAO X Q. Characteristics and ecological risk assessment of polluted soil by heavy metals in Shizishan, Tongling [J]. Environmental Chemistry, 2017, 36(9): 1958-1967(in Chinese). doi: 10.7524/j.issn.0254-6108.2017010304
[22] 李一蒙, 马建华, 刘德新, 等. 开封城市土壤重金属污染及潜在生态风险评价 [J]. 环境科学, 2015, 36(3): 1037-1044. LI Y M, MA J H, LIU D X, et al. Assessment of heavy metal pollution and potential ecological risks of urban soils in Kaifeng city, China [J]. Environment Science, 2015, 36(3): 1037-1044(in Chinese).
[23] 徐争启, 倪师军, 庹先国, 等. 潜在生态危害指数法评价中重金属毒性系数计算 [J]. 环境科学与技术, 2008, 31(2): 112-115. XU Z Q, NI S J, YU X G, et al. Calculat ion of heavy metals’ toxicity coefficient in the evaluat ion of potential ecological risk index [J]. Environmental Science & Technology, 2008, 31(2): 112-115(in Chinese).
[24] USEPA. Exposure factors handbook[R]. Washington: National Center for Environmental Assessment, 2011. [25] USEPA. Highlights of the child–specific exposure factors handbook(Final Report)[R]. Washington DC: U. S. Environmental Protection Agency, 2009. [26] USEPA. Regional screening level (RSL) for chemical contaminants at superfund sites[R]. Washington DC: U. S. Environmental Protection Agency, 2013. [27] 王锐, 胡小兰, 张永文, 等. 重庆市主要农耕区土壤Cd生物有效性及影响因素 [J]. 环境科学, 2020, 41(4): 355-361. WANG R, HU X L, ZHANG Y W, et al. Bioavailability and influencing factors of soil Cd in the major farming areas of Chongqing [J]. Environment Science, 2020, 41(4): 355-361(in Chinese).
[28] 陈凤, 董泽琴, 王程程, 等. 锌冶炼区耕地土壤和农作物重金属污染状况及风险评价 [J]. 环境科学, 2017, 38(10): 4360-4369. CHEN F, DONG Z Q, WANG C C, et al. Heavy metal contamination of soils and crops near a zinc smelter [J]. Environment Science, 2017, 38(10): 4360-4369(in Chinese).
[29] 赵方杰, 谢婉滢, 汪鹏. 土壤与人体健康 [J]. 土壤学报, 2020, 57(1): 1-11. ZHAO F J, XIE W Y, WANG P. Soil and human health [J]. Acta Pedologica Sinica, 2020, 57(1): 1-11(in Chinese).
[30] 马宏宏, 彭敏, 郭飞等. 广西典型岩溶区农田土壤-作物系统Cd迁移富集影响因素[J]. 环境科学.https://doi.org/10.13227/j.hjkx.202007138. MA H H, PENG M, GUO F, et al. Factors affecting translocation and accumulation of cadmium in soil-crop system from a typical karst area in Guangxi province, China[J]. Environment Science.https://doi.org/10.13227/j.hjkx.202007138 ( in Chinese).
[31] 李杰, 朱立新, 康志强. 南宁市郊周边农田土壤-农作物系统重金属元素迁移特征及其影响因素 [J]. 中国岩溶, 2018, 37(1): 43-52. LI J, ZHU L X, KANG Z Q. Characteristics of transfer and their influencing factors of heavy metals in soil-crop system of peri-urban agricultural soils of Nanning, South China [J]. Carsologica sinica, 2018, 37(1): 43-52(in Chinese).
[32] 李永华, 孙宏飞, 杨林生, 等. 湖南凤凰茶田汞矿区土壤-水稻系统中汞的传输及其健康风险 [J]. 地理研究, 2012, 31(1): 63-70. LI Y H, SUN H F, YANG L S, et al. Transmission and health risks of mercury in soil-paddy system in Chatian mercury mining area, Fenghuang County, Hunan Province [J]. Geographical Research, 2012, 31(1): 63-70(in Chinese).
[33] CUI L, FENG X, LIN C J, et al. Accumulation and translocation of 198Hg in four crop species [J]. Environmental Toxicology and Chemistry, 2014, 33(2): 334-340. doi: 10.1002/etc.2443 -


 下载:
下载:


