-
现阶段我国正在实行最严格水资源管理制度并颁布了考核标准,其中,“三条红线”制度中第三条明确规定了对水功能区达标率的要求,即水功能区水质达标率提高到95%以上,为实现上述红线目标,进一步明确了2015年和2020年水资源管理的阶段性目标[1-3]。制度实施过程中,其存在的问题也在不断显现。如法律体系保障滞;流域机构与行政管理部门职能界限不清;统计管理基础薄弱,统计方式较为粗放;缺乏控制污染物排放的有效手段和刚性措施等问题[4-6]。然而在制度的实施与考核过程中存在这样一个尤为突出的问题:以《地表水环境质量标准》(GB3838—2002)对全国范围内同一类型水功能区进行达标考核时,忽略了因地域自然条件与地理环境差异导致的水环境背景值的空间差异性,这种差异使得特殊区域水功能区难以通过有效的水环境治理措施提高达标率[7-8],即水环境管理与评价体系和最严格水资源管理制度实施之间的主要突出问题。为解决这一问题,亟需开展地表水环境背景问题识别工作以提出具有针对性的区域水环境管理与评价调整方案,保障最严格水资源管理制度的可持续实施。
了解水环境背景值是水环境管理的基础,对制定地表水质量监管框架具有重要意义[9-10]。然而我国制定相关环境质量标准或建立环境质量管理体系时恰恰忽视了背景值的影响[11],因此,有必要针对特殊区域地表水环境进行系统分析,识别影响地表水环境质量的胁迫因子,判断区域地表水环境是否存在以非人类活动干扰为主导因子的背景值问题。
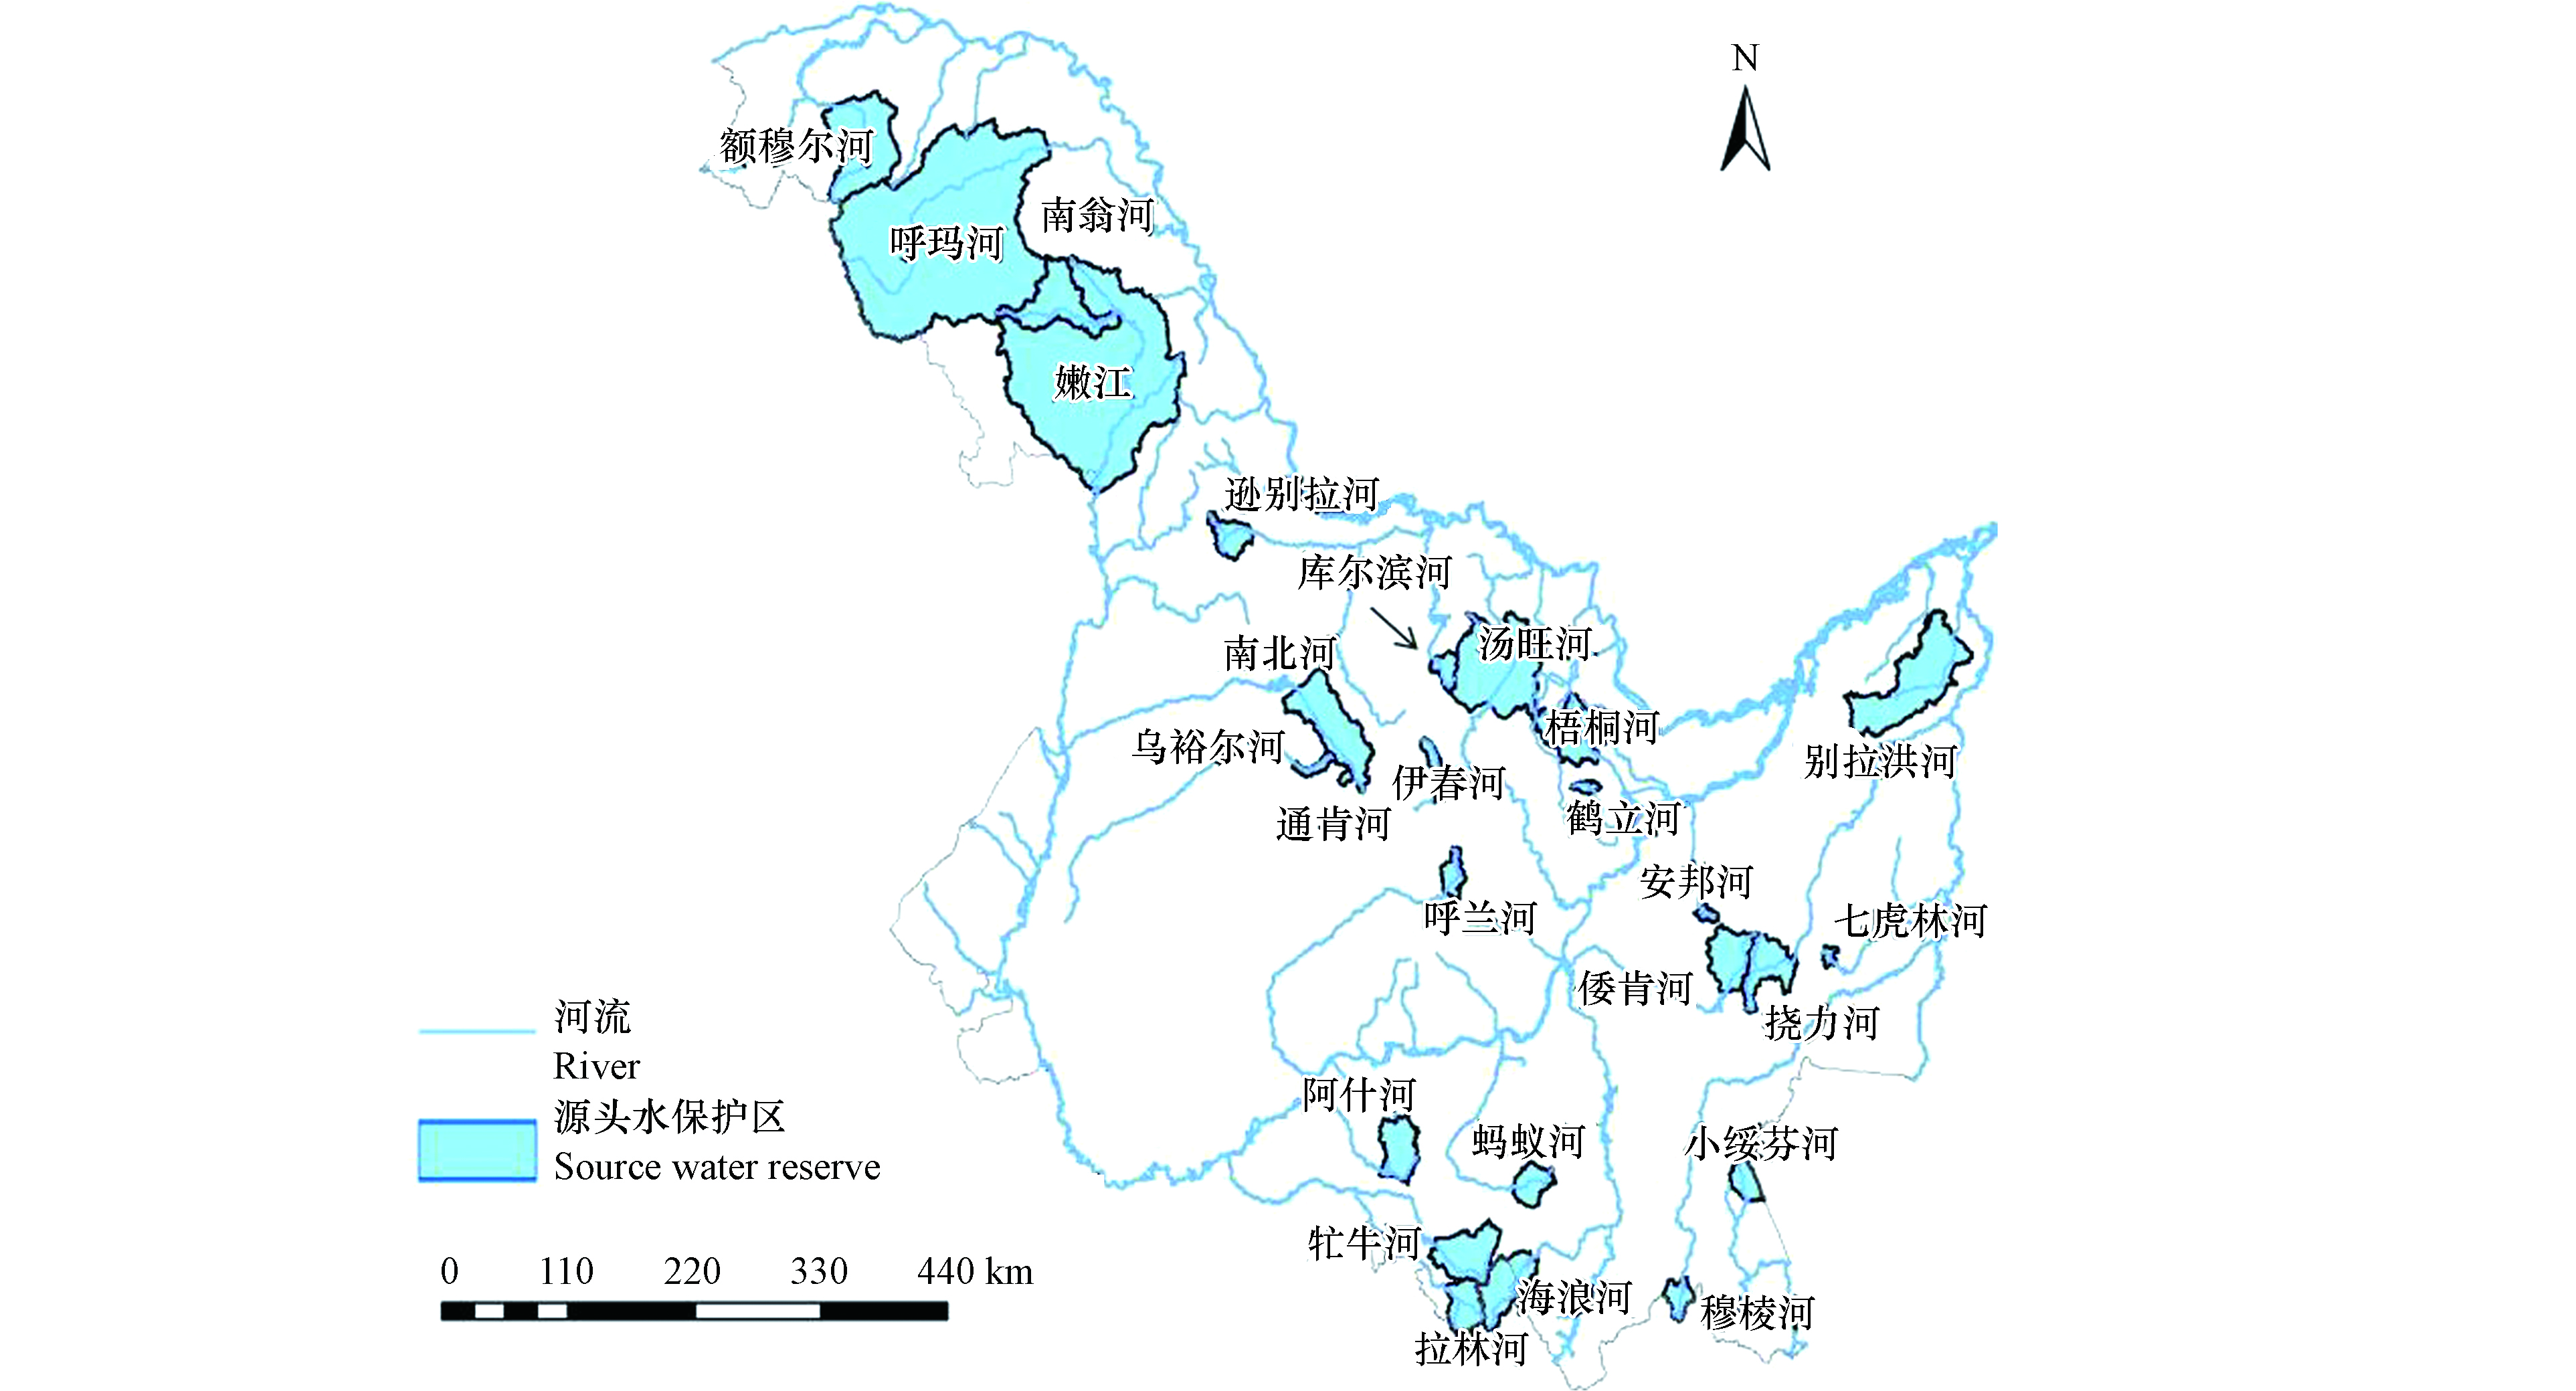
本研究以黑龙江省26个源头水保护区为例,对保护区水环境质量特征进行全面分析,识别影响水质类别的主要超标指标,并对超标指标浓度值时空变化进行分析,根据研究区土地利用类型结合主要超标指标浓度来源识别背景污染物种类;分析背景值问题对区域水环境管理的影响程度及其在研究区的特殊性问题,以期指导研究区地表水环境管理评价体系的调整优化,解决最严格水资源管理制度实施过程中因背景值问题影响出现的考核偏差,为完善我国水资源水环境管理与评价体系提供现实依据.
黑龙江省源头水保护区水环境特征分析及背景问题识别
Environmental characteristics analysis and background value identification of surface water reserve in Heilongjiang Province
-
摘要: 由于我国水环境标准与评价方法中未充分考虑环境背景的空间差异性,导致存在环境背景值问题的水功能区水质达标率长期处于较低水平,且难以满足最严格水资源管理制度考核的要求。因此,针对特殊区域识别存在背景问题及其影响程度以指导完善区域水质管理与评价体系是制度顺利实施的重要前提。本文系统全面的评价了黑龙江省源头水保护区2011—2016年地表水环境质量,识别了主要超标水质项目类别,分析了其浓度分布特征,在此基础之上,结合区域自然环境特征与超标指标浓度来源明确了研究区存在水环境背景值问题。通过对比全国水资源一级区内源头水保护区达标率、社会经济发展以及排污情况,重点突出了背景值问题对松花江区水环境管理与评价的负面影响。本文以特殊区域实行最严格水资源管理制度过程中主要问题为研究导向展开研究,以期为区域调整完善水环境管理与评价体系以满足制度可持续实施提供理论支撑。Abstract: Due to insufficient consideration of the spatial variation of environmental background, water quality standard attainment of the water function zones with environmental background problems has been persistently low, and thus cannot satisfy the requirement of the most stringent water resource management policy. Therefore, it is an important prerequisite for the sustainable implementation of the system to improve regional water quality management and evaluation system based on the background value problems. This paper systematically and comprehensively evaluated the surface water environment quality of the source water reserves in Heilongjiang Province from 2011 to 2016, identified the categories of background pollutants and analyzed concentration variation characteristics. On this basis, combined with the characteristics of natural environment and the sources of background pollutants, it was clear that there is a background value problem in surface water. By comparing the standard-reaching rate of source water reserves in 10 water resources basins with social and economic development and pollution discharge, the paper focuses on describing the serious impact of background value problems on water environment management and evaluation in Songhuajiang basin. In this paper, the main problems in the process of implementing the strictest water resources management system in special regions as the research direction, in order to provide theoretical support for regional adjustment and improvement of water environment management and evaluation system to meet the sustainable implementation of the system.
-
Key words:
- reserves /
- surface water /
- water environment /
- background value /
- temporal-spatial distribution
-
表 1 源头水保护区地表水水质指标浓度特征值
Table 1. Concentration characteristic value of water quality indices in river source water reserve.
水质指标
VariableDO COD CODMn BOD5 NH3-N 总汞
Hg总砷
As镉
Cd铅
Pb数据量(Quantity) 956 964 960 908 957 974 923 987 985 最小值(Min) 0.2 5.0 1.0 0.1 0.01 0.000005 0.00001 0.00025 0.001 25%分位数(25% percentile) 7.4 13.0 3.6 1.0 0.20 0.000005 0.00001 0.00025 0.001 均值(Average) 8.8 19.8 6.2 1.7 0.44 0.000011 0.00050 0.00025 0.001 75%分位数(75% percentile) 10.0 26.0 7.8 2.0 0.56 0.000010 0.00060 0.00025 0.001 最大值(Max) 15.0 249.0 69.2 49.4 5.56 0.000050 0.01050 0.00200 0.013 Ⅱ类水质标准限值
(ClassⅡwater quality standard)6.0 15.0 4.0 3.0 0.50 0.000050 0.050 0.0050 0.010 水质指标
Variables铜
Cu总铁
Fe锌
Zn氰化物
Cyanide氟化物
Fluoride挥发酚
Phenol六价铬
Cr(Ⅵ)硒
Se粪大肠菌群
Fecal coliform数据量(Quantity) 980 102 968 988 985 986 988 982 468 最小值(Min) 0.0010 0.02 0.001 0.002 0.005 0.00015 0.002 0.00015 10 25%分位数(25% percentile) 0.0025 0.08 0.025 0.002 0.070 0.00100 0.002 0.00015 10 均值(Average) 0.0032 0.31 0.024 0.002 0.156 0.00100 0.002 0.00015 99 75%分位数(75% percentile) 0.0025 0.44 0.025 0.002 0.190 0.00100 0.002 0.00015 110 最大值(Max) 0.1350 2.00 0.364 0.004 1.000 0.00730 0.021 0.00050 5540 Ⅱ类水质标准限值
(Class Ⅱ water quality standard)1 0.3 1 0.05 1 0.002 0.05 0.01 2000 表 2 2011—2016年源头水保护区地表水水质单因子法评价结果
Table 2. Water quality evaluation results of single factor method in 2011—2016
年份
Year各类水质占比/%
(Proportion of water quality class)总监测次数/次
Monitoring timesⅠ类
Class ⅠⅡ类
Class ⅡⅢ类
Class ⅢⅣ类
Class ⅣⅤ类
Class Ⅴ劣Ⅴ类
Inferior Class Ⅴ2011 0.0 19.1 38.2 30.3 7.9 4.5 89 2012 4.4 17.7 24.7 38.6 10.1 4.4 158 2013 0.6 16.4 28.8 36.2 13.6 4.5 177 2014 1.2 21.8 32.9 29.4 12.4 2.4 170 2015 0.5 22.8 29.9 33.5 11.2 2.0 197 2016 1.0 17.8 29.4 37.1 10.7 4.1 197 合计 1.3 19.3 30.1 34.5 11.2 3.5 988 表 3 单因子法评价结果各类水质占比年内分布情况
Table 3. The annual distribution of water quality classification by single factor method
月份
Month各类水质占比/%
(Proportion of water quality class)总监测次数/次
Monitoring timesⅠ类
Class ⅠⅡ类
Class ⅡⅢ类
Class ⅢⅣ类
Class ⅣⅤ类
Class Ⅴ劣Ⅴ类
Inferior Class Ⅴ1月 2.9 35.0 29.9 24.1 7.3 0.7 137 3月 7.1 38.1 25.7 17.7 7.1 4.4 113 5月 0.6 11.1 23.9 42.2 11.7 10.6 180 7月 0.0 7.9 25.4 45.2 18.6 2.8 177 9月 0.0 6.7 29.8 47.8 13.5 2.2 178 11月 0.0 24.9 41.8 25.4 7.9 0.0 177 表 4 26个源头水保护区内参评水质指标污染指数值
Table 4. Pollution index of water quality indices in source water reserves
参评指标Variables 溶解氧DO COD 高锰酸盐指数CODMn 五日生化需氧量BOD5 氨氮NH3-N 总汞Hg 平均值Average 0.71 1.33 1.54 0.35 1.01 0.22 最大值Max 3.75 16.6 17.3 6.5 11.1 1.00 最小值Min 0.40 0.33 0.20 0.03 0.03 0.10 参评指标Variables 总砷Se 镉Cd 铅Pb 铜Cu 总铁Fe 锌Zn 平均值Average 0.01 0.05 0.13 0.001 0.48 0.02 最大值 0.21 0.40 1.26 0.14 1.93 0.36 最小值 0.00 0.05 0.13 0.001 0.04 0.001 参评指标Variables 氰化物Cyanide 氟化物Fluoride 挥发酚Phenol 六价铬Cr(Ⅵ) 硒Se 粪大肠菌群Fecal coliform 平均值Average 0.04 0.16 0.50 0.04 0.02 0.05 最大值Max 0.08 1.00 3.65 0.42 0.05 2.77 最小值Min 0.04 0.01 0.08 0.04 0.02 0.01 表 5 CCME-WQI评价法中各变量(F1,F2,F3)信息表
Table 5. The value of variables (F1, F2, F3) in CCME-WQI
年份
Year参评变量/个
Number of participating variables超标变量/个
Number of failing variablesF1/% F2/% F3/% CCME WQI得分值
CCME WQI value2011 18 6 33.33 10.56 7.83 79.31 2012 18 5 27.78 11.08 14.90 80.71 2013 18 6 33.33 11.49 14.52 77.98 2014 18 5 27.78 11.41 15.21 80.57 2015 18 7 38.89 9.55 12.75 75.74 2016 18 7 38.89 11.14 13.83 75.32 表 6 2014年黑龙江省源头水保护区汇水范围内分类土地利用面积占比统计表(%)
Table 6. Statistical data of the proportion of land-use types in source water reserves(%)
编号
Number水功能区
Water
functional zone汇水面积
Catchment
area/km2耕地
Farmland林地
Woodland草地
Grassland水域
Water城镇
Town农村
居民点
Rural工业建设用地
Industrial land未利用地
Unused landA1 额木尔河 3239 0.12 66.82 29.12 0.24 0.07 0.21 0 3.43 A2 呼玛河 19176 0.33 80.79 6.91 0.58 0.14 0.21 0 11.03 A3 南瓮河 2262 0 74.66 0.99 0.21 0 0 0 24.14 A4 嫩江 14991 6.17 64.8 4.99 0.4 0 0.05 0.09 23.5 A5 逊别拉河 712 0.57 82.65 14.43 0 0 0.16 0 2.18 A6 南北河 2517 29.12 65.31 5.27 0.04 0 0.21 0 0.05 A7 乌裕尔河 227 41.95 33.1 7.19 0 0 0.55 0 17.21 A8 通肯河 82 14.86 80.29 0.58 0.02 0 0 0 4.23 A9 库尔滨河 412 0.21 85 14.55 0.05 0 0.18 0 0 A10 汤旺河 5123 1.5 92 4.81 0.28 0.48 0.56 0.01 0.36 A11 伊春河 219 0.48 92.66 0.2 0.27 0 0.2 0 6.19 A12 梧桐河 1703 6.28 84.45 0.47 0.35 0 0.09 0 8.37 A13 鹤立河 146 3.35 76.21 19.84 0.09 0 0.18 0.21 0.11 A14 呼兰河 471 5.59 91.8 0.85 0 0.24 0.73 0 0.78 A15 阿什河 1161 14.61 79.67 0.43 2.74 0.17 0.99 0.15 1.24 A16 牤牛河 1628 12.94 82.03 3.98 0.09 0 0.9 0 0.07 A17 蚂蚁河 702 24.67 71.95 1.61 0.03 0.14 1.51 0 0.09 A18 拉林河 928 6.01 91.35 0.78 1.23 0 0.5 0 0.13 A19 海浪河 1588 1.39 97.2 1.08 0.22 0 0.12 0 0 A20 穆棱河 464 4.14 88.52 5.86 1.26 0 0.22 0 0 A21 小绥芬河 558 3.08 91.65 4.53 0 0 0.15 0 0.58 A22 安邦河 143 1.94 97.28 0.45 0 0 0.33 0 0 A23 倭肯河 1303 32.33 55.77 2.85 0.04 0 0.66 0 8.36 A24 挠力河 1329 46.93 42.69 4.6 0 0 0.86 0 4.93 A25 七虎林河 134 1.94 96.49 1.25 0 0 0.06 0 0.26 A26 别拉洪河 3711 70.01 3.37 7.27 0 0.19 0.38 0 18.47 合计 64925 9.81 71.55 6.42 0.40 0.10 0.27 0.03 11.42 表 7 2011—2016年源头水保护区水质达标情况
Table 7. Meet the standard requirements of source water reserves in 2011—2016
保护区Reserves 2011 2012 2013 2014 2015 2016 呼兰河 — 未达标 未达标 — 达标 未达标 拉林河 达标 达标 未达标 达标 未达标 未达标 牤牛河 达标 达标 未达标 未达标 未达标 未达标 注:其余23个源头水保护区2011—2016年共评价123次且均未达标.
Note:Other source water reserves were evaluated 123 times in 2011-2016 and failed to meet the standard requirements表 8 2017年全国十大水资源一级区源头水保护区水质达标率
Table 8. The percentage of reaching standard requirements of source water reserves in 2017
水资源一级区
Water resources basins评价个数
Evaluation number达标个数
Number of reach the standard达标率/%
Compliance rate松花江区 80 16 20 辽河区 37 25 67.6 海河区 30 13 43.3 黄河区 70 52 74.3 淮河区 78 41 52.6 长江区 273 193 70.7 东南诸河区 26 22 84.6 珠江区 97 50 51.5 西南诸河区 62 47 75.8 西北诸河区 138 131 94.9 全国 891 590 66.2 表 9 2017年中国十大分区内保护区COD, CODMn以及NH3-N达标评价比例
Table 9. The percentage of fail to meet standard requirements of COD, CODMn and NH3-N in source water reserve.
十大分区
10 water resource basins超标率/%The over standard rate COD CODMn NH3-N 松花江区 9.0 27.8 6.8 辽河区 3.3 6.1 3.3 海河区 8.3 18.1 2.1 淮河区 7.4 6.1 2.7 黄河区 5.4 0.7 8.3 长江区 1.4 4.3 3.4 东南诸河区 0.0 0.0 1.9 珠江区 1.3 3.5 5.4 西南诸河区 0.8 1.1 1.3 西北诸河区 0.0 0.0 0.0 -
[1] 李维明, 何凡. 中国最严格水资源管理制度实施进展、问题与建议 [J]. 中国经济报告, 2019(3): 96-100. doi: 10.3969/j.issn.1673-3788.2019.03.014 LI M W, HE F. Progress, problems and suggestions on the implementation of the strictest water resource management system in China [J]. China Economic Report, 2019(3): 96-100(in Chinese). doi: 10.3969/j.issn.1673-3788.2019.03.014
[2] 温建雄. 分析最严格水资源管理制度背景下水资源配置情况 [J]. 河南水利与南水北调, 2019, 48(2): 40-41. WEN X J. Analysis of water resource allocation in the context of the strictest water resource management system [J]. Henan Water Resources & South-to-North Water Div, 2019, 48(2): 40-41(in Chinese).
[3] 于琪洋. 实行最严格水资源管理制度考核工作分析与展望 [J]. 中国水利, 2019(17): 6-8. doi: 10.3969/j.issn.1000-1123.2019.17.003 YU Y Q. Analysis and prospect of implementing the assessment of the strictest water resources management system [J]. China Water Resources, 2019(17): 6-8(in Chinese). doi: 10.3969/j.issn.1000-1123.2019.17.003
[4] 侯君, 王汴歌, 孙国恩, 等. 最严格水资源管理制度的解读与思考 [J]. 河南水利与南水北调, 2018, 47(9): 55-56. doi: 10.3969/j.issn.1673-8853.2018.09.030 HOU J, WANG G B, SUN E G, et al. Interpretation and consideration of the strictest water resource management system [J]. Henan Water Resources & South-to-North Water Div, 2018, 47(9): 55-56(in Chinese). doi: 10.3969/j.issn.1673-8853.2018.09.030
[5] 刘婷婷. 最严格水资源管理制度亟需解决的问题及对策 [J]. 管理观察, 2016(23): 57-58. doi: 10.3969/j.issn.1674-2877.2016.23.018 LIU T T. Problems and countermeasures to be solved in the strictest water resource management system [J]. Management Observer, 2016(23): 57-58(in Chinese). doi: 10.3969/j.issn.1674-2877.2016.23.018
[6] 张旺, 庞靖鹏. 落实最严格水资源管理制度亟需解决的问题和下一步对策建议 [J]. 水利发展研究, 2012(4): 18-21. ZHANG W, PANG P J. Problems to be solved in implementing the strictest water resource management system and suggestions for the next step [J]. Water Resources Development Research, 2012(4): 18-21(in Chinese).
[7] DUAN Q M, DU X, PENG Q W, et al. Role of humic substances as refractory organic matter in sustainable water quality assessment and management [J]. Water Supply, 2020, 20(2): 538-549. doi: 10.2166/ws.2019.186 [8] DUAN Q M, DU X, PENG Q W, et al. Quantitative assessment of background pollutants using a modified method in data-poor regions [J]. Environ Monit Assess, 2020, 192(3): 160-175. doi: 10.1007/s10661-020-8122-8 [9] ISMAIEL I A, BIRD G, MCDONALD M A, et al. Establishment of background water quality conditions in the Great Zab River catchment: Influence of geogenic and anthropogenic controls on developing a baseline for water quality assessment and resource management [J]. Environmental Earth Sciences, 2018, 77(50): 1-12. [10] JUNG K Y, AHN J M, CHO S, et al. Evaluation of long-term water quality management policy effect using nonparametric statistical methods [J]. Membrane Water Treatment, 2019, 10(5): 339-352. [11] 仇茂龙, 刘玲花, 邹晓雯, 等. 国内外水源地水质评价标准与评价方法的比较 [J]. 中国水利水电科学研究院学报, 2013, 11(3)-176. doi: 10.3969/j.issn.1672-3031.2013.03.003 QIU L M, LIU H L, ZOU W X, et al. Comparison of water quality evaluation standards and methods at home and abroad [J]. Journal of China Institute of Water Resources and Hydropower Research, 2013, 11(3)-176(in Chinese). doi: 10.3969/j.issn.1672-3031.2013.03.003
[12] 张阳阳, 卢庆文. 四种水质评价方法的研究和分析比较 [J]. 中国水运月刊, 2017, 17(7): 174-176. ZHANG Y Y, LU W Q. Research, analysis and comparison of four water quality evaluation methods [J]. China Water Transport, 2017, 17(7): 174-176(in Chinese).
[13] 郭晶, 王丑明, 黄代中,等. 洞庭湖水污染特征及水质评价 [J]. 环境化学, 2019, 38(1): 156-164. GUO J, WANG M C, HUANG Z D, et al. Pollution characterization and water quality assessment of Dongting Lake [J]. Environ Chem, 2019, 38(1): 156-164(in Chinese).
[14] DUAN Q M, DU X, PENG Q W, et al. A revised method of surface water quality evaluation based on background values and its application to samples collected in Heilongjiang Province, China. Water[J]. 2019, 11(5), 1057-1073. [15] 袁兴程, 钱新, 庞宗强,等. 不同土地利用方式土壤表层氮、磷流失特征研究 [J]. 环境化学, 2011, 30(9): 1657-1662. YUAN C X, QIAN X, PANG Q Z, et al. Characteristics of nitrogen and phosphorus loss from surface soil in different landuse [J]. Environ Chem, 2011, 30(9): 1657-1662(in Chinese).
[16] 朱恒, 任常青, 邓凯. 巢湖流域土地利用变化对人类活动程度的响应 [J]. 测绘标准化, 2018, 34(3): 42-46. ZHU H, REN Q C, DENG K. Response of land use change to human activities in Chaohu Basin [J]. Standardization of Survveying and Mapping, 2018, 34(3): 42-46(in Chinese).
[17] BAKER N R, ALLISON S D. Ultraviolet photodegradation facilitates microbial litter decomposition in a Mediterranean climate [J]. Ecology, 2015, 96(7): 1994-2003. doi: 10.1890/14-1482.1 [18] LIU H, YANG Y, ZhANG K, et al. Soil Erosion as affected by freeze-thaw regime and initial soil moisture content [J]. Soil Science Society of America Journal, 2017, 81(3): 459-473. doi: 10.2136/sssaj2016.08.0271 [19] 卫芯宇, 杨万勤, 张丽, 等. 冻融环境下凋落叶添加对亚高山森林土壤腐殖化程度的影响 [J]. 生态学报, 2018, 38(18): 166-174. WEI Y X, YANG Q W, ZHANG L, et al. Effect of litter addition on soil humification in subalpine forest under freeze-thaw environment [J]. Acta Ecologica Sinica, 2018, 38(18): 166-174(in Chinese).
[20] CHAIPRASITHIKUL S. Assessing impact of economic development on water pollution in Thailand using dynamic spatial econometrics analysis. Social Science Electronic Publishing [J]. OIDA International Journal of Sustainable Development, 2013, 6(3): 71-76. [21] JUMA D W, WANG H, LI F. Impacts of population growth and economic development on water quality of a lake: Case study of Lake Victoria Kenya water [J]. Environmental Science and Pollution Research, 2014, 21(8): 5737-5746. doi: 10.1007/s11356-014-2524-5 [22] WU K Y, WU D N. Evolution of the relationship between economic development and water pollution in shanghai [J]. Advanced Materials Research, 2014, 962-965: 2031-2039. doi: 10.4028/www.scientific.net/AMR.962-965.2031 [23] OSTE L, ZWOLSMAN G J, KLEIN J. Methods to derive natural background concentrations of metals in surface water, and an application of two methods in a case study[R]. Deltares report 1206111.005, Utrecht, 2012, 104.