-
高速发展的工业化进程以及粗放的生产方式,使得大量的重金属进入土壤,导致我国土壤重金属污染形势不容乐观。近年来频发的土壤污染事故,尤其是农田土壤重金属污染事故,引起了人们对重金属污染的研究关注及对其污染危害的广泛研究。
农田土壤重金属污染不仅会影响农产品质量,造成经济损失,还会通过食物链影响人类和其他动物的生命健康,因此,研究农田中土壤重金属污染,探究重金属在农田土壤中的空间分布,评价其可能的潜在风险,对土壤重金属污染的防治以及保护人类生命健康都具有十分重要的意义。
本研究以某村庄无主金矿矿区以北农田土壤为研究对象,对重金属在土壤环境中的空间分布进行研究分析并评价其污染状况,研究结果将为该区域土壤污染治理和防控提供基础理论依据。
-
研究区位于甘肃省岷县某金矿区附近(104.231715°~104.244558°E,34.511970°~34.515167°N),该区域地处西秦岭中低山区,地形平缓开阔,属于典型的构造侵蚀中低山地貌;当地气候处于温带半湿润向高寒湿润气候过渡带,高寒阴湿,常年主导风向西北风,平均风速1.3~1.5 m/s,最大风速24 m/s。研究区的土壤类型主要为黑土,土体疏松,结构良好。
-
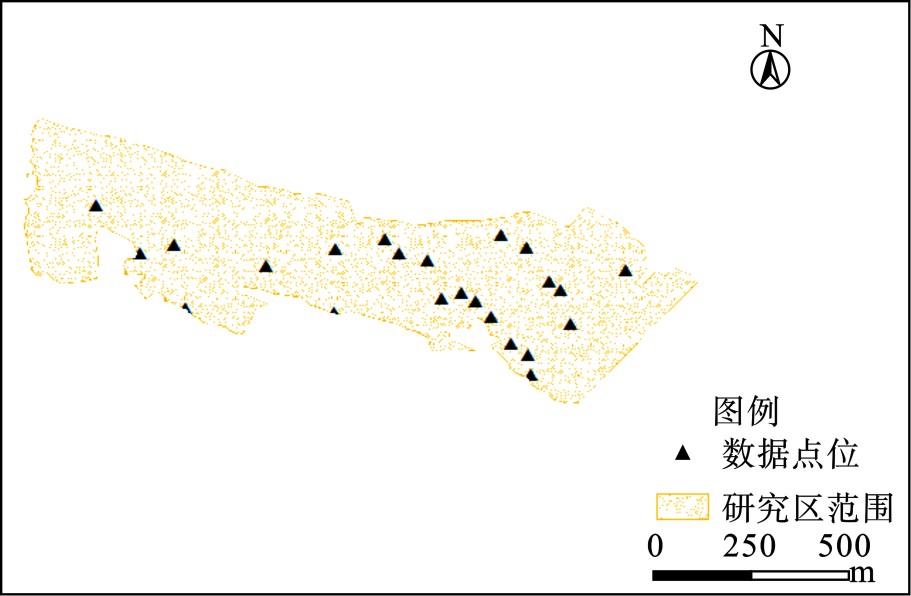
本次研究参考了《岷县曙光金矿无主矿区土壤污染治理项目场地环境调查报告》[1]中23个具有代表性的农田土壤点位数据(2018年4月)进行评价点位分布,见图1。
-
本研究使用单因子指数、内梅罗综合污染指数、地质累积指数及潜在生态危害指数的分析方法对土壤中重金属的含量进行评价。各方法的评价标准,见表1。
-
变异系数是统计学中反应数据离散程度的指标,见式(1):
式中:
σ 为重金属i的标准偏差;μ 为重金属i的平均值。 -
使用Excel2016对土壤重金属含量、污染指数和生态风险指数进行统计;使用SPSS26.0对数据相关性进行分析;使用ArcGIS10.2绘制土壤点位分布图、重金属的空间分布图。
-
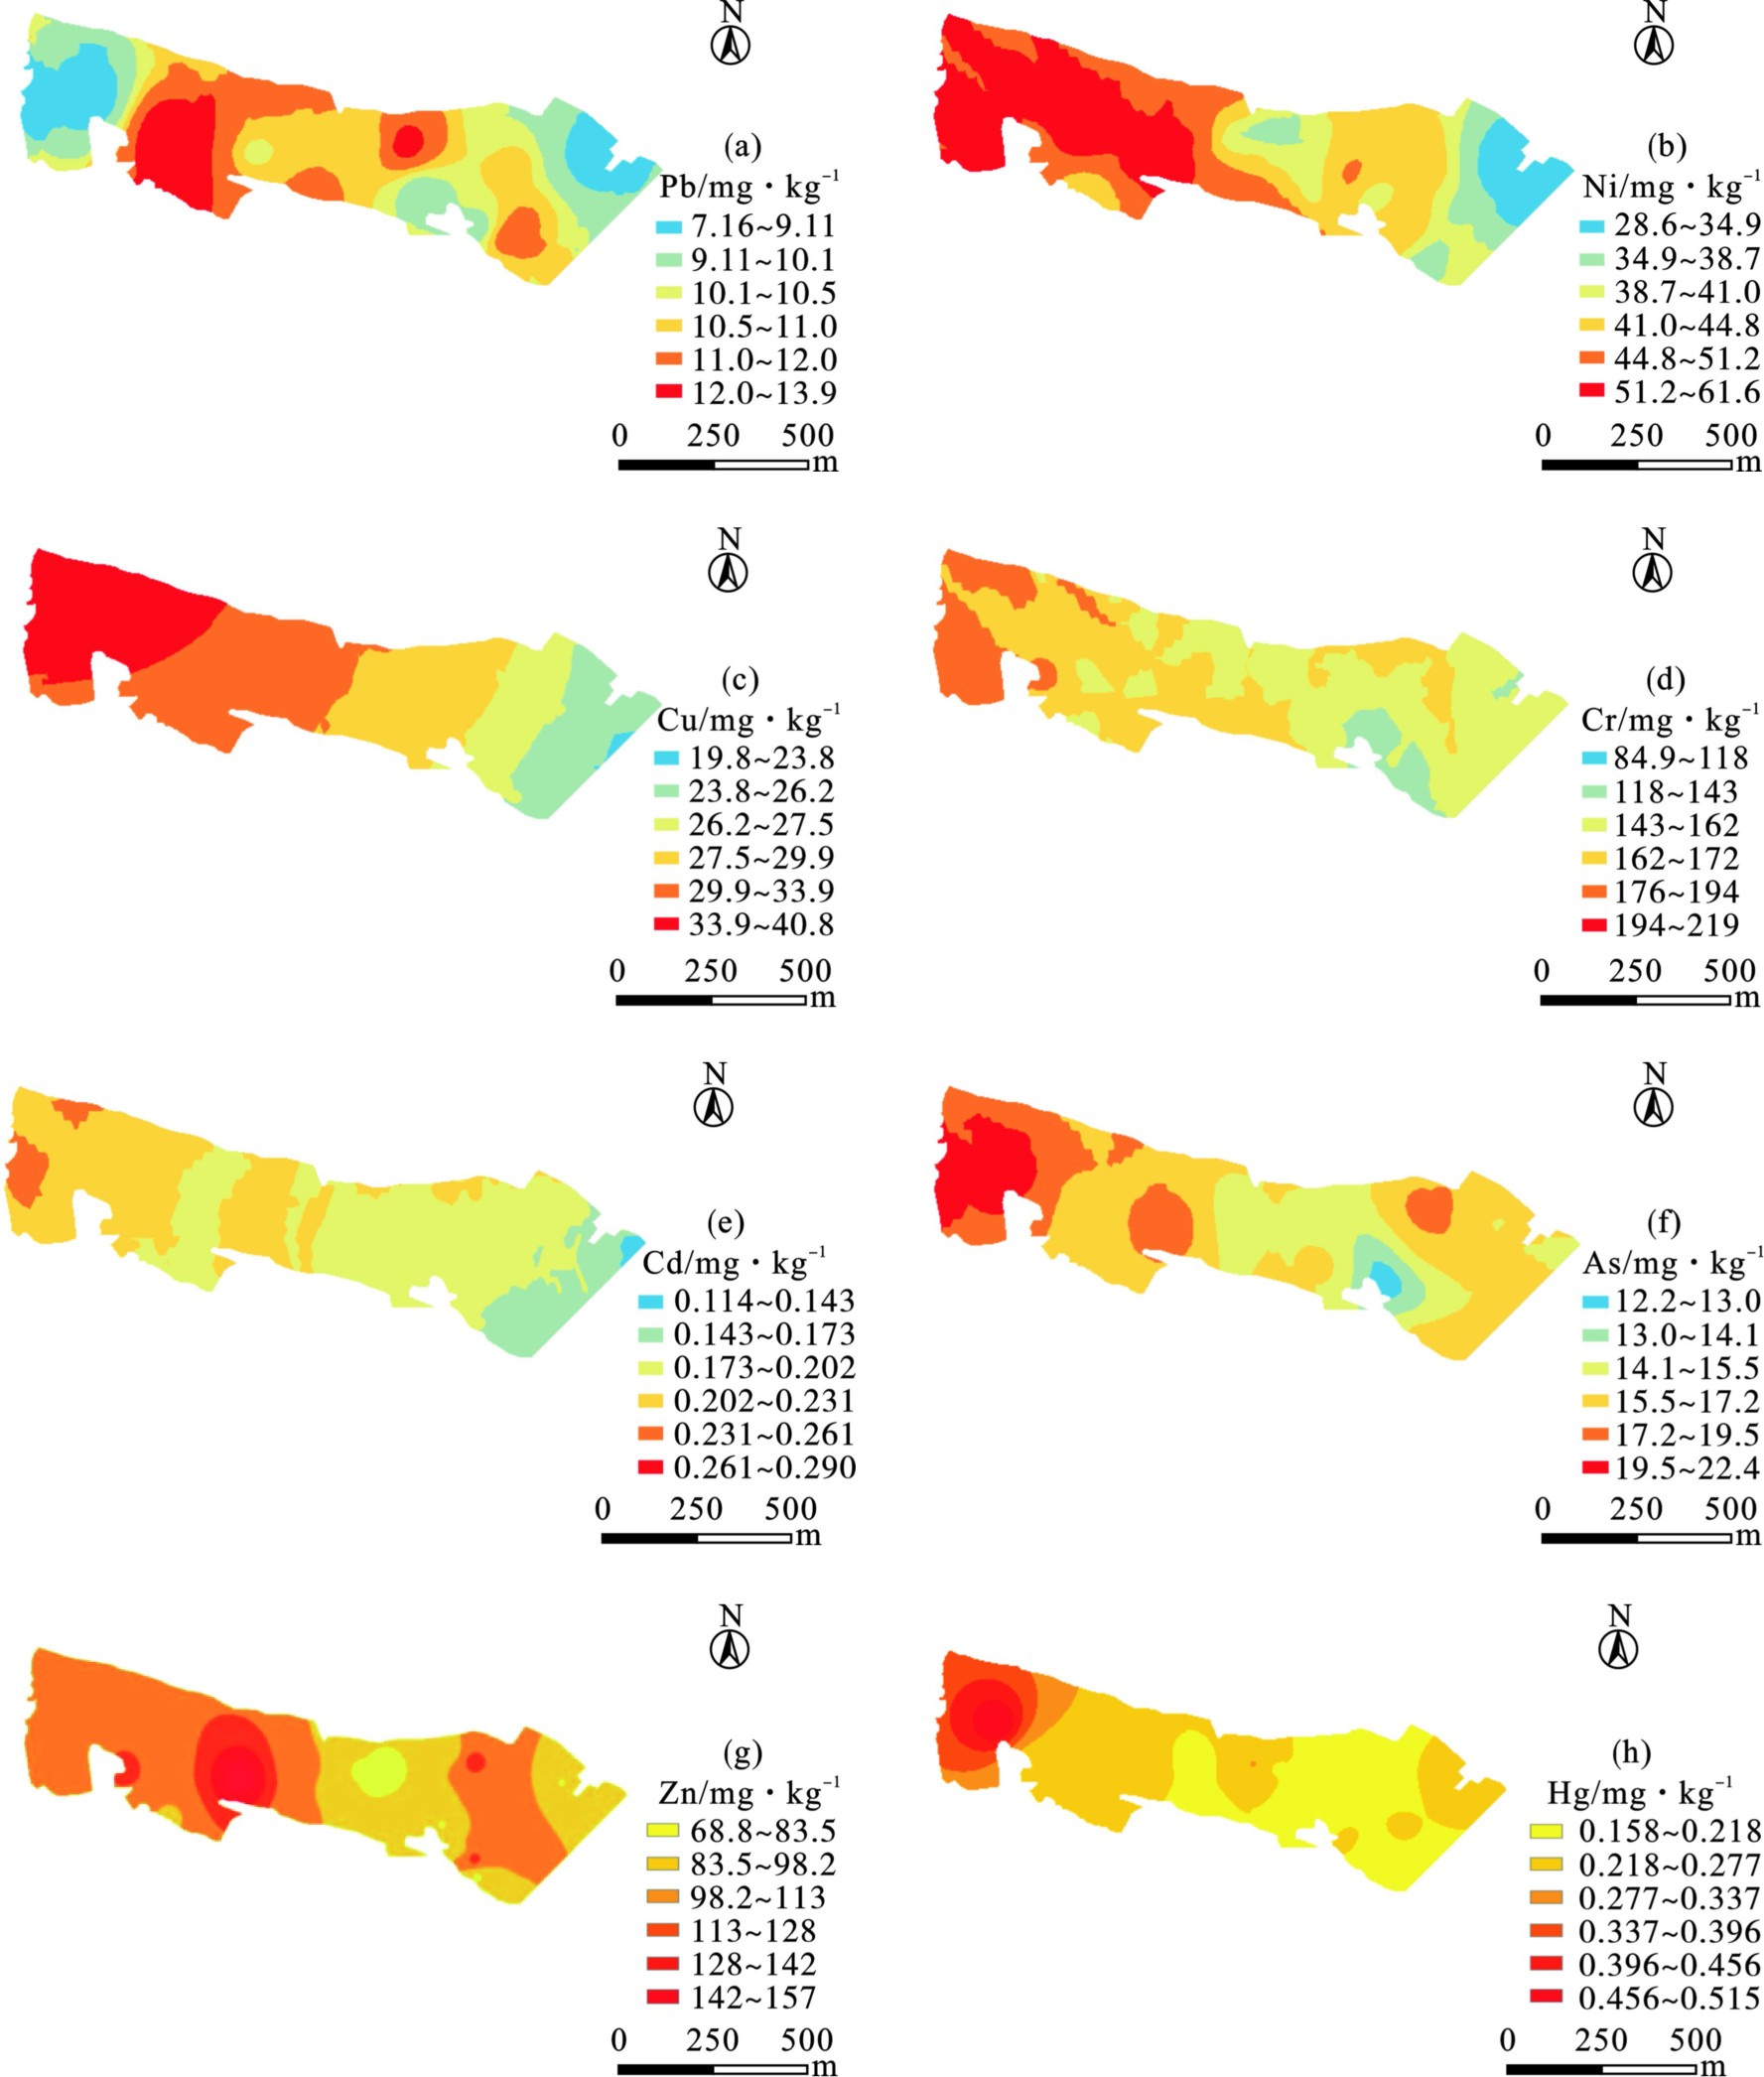
通过对研究区土壤中的As、Cd、Cu、Pb、Cr和Ni 6种金属元素进行克里金插值分析,对Zn、Hg 2种金属元素进行反距离插值分析,得到研究区内各重金属含量的空间分布情况,见图2。
图2可知,8种重金属分布极为相似,均呈现自西向东递减趋势。
-
土壤pH及重金属含量统计,见表2。
表2可知,研究区土壤pH处于7.03~7.74范围内,整体呈弱碱性。土壤中Hg、As、Cd、Cu、Pb、Cr、Zn和Ni含量分别为0.16~0.52 、12.20~22.40 、0.11~0.29、19.80~40.80、7.16~13.90、84.90~219.00、68.80~157.00和28.60~61.60 mg/kg。与国家标准相比,研究区土壤中8种重金属平均含量均不存在超标现象。与甘肃省背景值相比,研究区土壤中Hg、As、Cd、Cu、Cr、Zn和Ni 7种重金属平均含量超出该区域土壤环境的背景值,说明存在累积现象。
变异系数可反映人类活动对区域内重金属含量的影响程度。通过计算可知,Hg、Cd和Cr在研究区变异系数分别为0.30、0.25和0.22,处于0.2~0.5之间,变异性适度。As、Cu、Pb、Zn和Ni变异系数均低于0.2,变异性相对较弱[2-4]。由于变异系数数值越大,空间变异性越大,受人为干扰程度越大。因此,研究区Hg变异系数相对较高,偏度和峰度值也相对较高,可推测其受当地人为活动影响较大。
-
单因子污染指数能反映单项重金属在土壤中的污染程度;内梅罗指数则能反映土壤中多种重金属的综合污染程度。本研究分别以《土壤环境质量 农用地土壤污染风险管控标准(试行):GB 15618—2018》表1中的限值和甘肃省土壤中金属元素背景值为评价标准,使用上述2种方法对重金属的污染程度进行综合评价,统计,见表3。
当以背景值为评价标准时,研究区土壤中Hg、As、Cd、Cu、Pb、Cr、Zn和Ni的单因子污染指数范围分别为7.90~25.75、0.97~1.87、0.95~2.42、0.82~1.69、0.38~0.74、1.36~3.52、0.99~2.27和0.81~1.75之间,见表3。数据显示100%、91%、96%、87%、100%、96%和96%样点的Hg、As、Cd、Cu、Cr、Zn和Ni含量超过甘肃省土壤背景值。
当以GB 15618—2018限值为评价标准时,研究区Hg、As、Cd、Cu、Pb、Cr、Zn和Ni的单因子污染指数范围分别为0.046~0.215、0.407~0.747、0.228~0.967、0.198~0.408、0.047~0.116、0.425~1.095、0.275~0.628和0.151~0.616之间,见表4。除Cr轻微超标外,研究区内其余7种重金属元素含量均不超标。内梅罗综合指数显示研究区土壤处于清洁状态。
研究区土壤中重金属的地质累积指数统计,见表5。
表5可知,8种重金属的地质累积指数平均值由大到小依次为Hg>Cr>Cd>Zn>As>Ni>Cu>Pb。结果显示,除Hg、Cr和Cd以外,其余5种重金属均无污染程度。8种重金属地质累积指数的极大值均﹥0,表明研究区内存在重金属累积现象,其中Hg累积最严重,其次是Cr和Cd。
研究区域8种重金属潜在生态风险系数,见表6。
表6可知,8种重金属单项潜在生态风险指数均值大小顺序为Hg>Cd>As>Ni>Cu>Cr>Pb>Zn。其中,As、Ni、Cu、Cr、Pb和Zn潜在生态风险系数均值均﹤40,处于轻微危害水平;Hg潜在生态风险系数均值为457.04,明显高于其他重金属,处于极强危害水平;Cd潜在生态风险系数均值为48.01,处于中等危害水平。研究区多元素综合污染指数均值为539,整体潜在生态风险等级较高,主要贡献因子为Hg。
-
土壤重金属的来源主要包括自然源和人为源。通过重金属之间的相关性分析能够判断几种重金属的来源是否一致,若重金属间相关性较强,表现为显著正相关时,说明这些重金属的来源具有同一性。否则,可能有多个来源[5]。对研究区农田土壤重金属进行Spearman相关性分析,见表7。
表7可知,重金属Cu-Cd、Ni-Cu之间的相关系数分别为0.644、0.637,达到极显著正相关关系(P<0.01),Zn-As、Zn-Cd、Zn-Cu、Ni-Cr和Ni-Zn之间的相关系数分别为0.415、0.495、0.493、0.519和0.504,达到显著正相关关系(P<0.05),表明其来源具有同源性。
-
数据显示研究区内100%、91%、96%、87%、100%、96%和96%样点的Hg、As、Cd、Cu、Cr、Zn和Ni超过甘肃省土壤背景值,研究区土壤中重金属累积现象严重,其中以Hg的累积现象最为严重。这一结论与孙建伟等[6]、张江华等[7]和林荩等[8]对豫西金矿区、小秦岭金矿区和潼关金矿区的研究结果相似,进一步说明矿区周边农田土壤重金属污染主要是由开采活动造成的。
此外,牛真茹等[9]通过对某金属冶炼场浅层土壤重金属空间变异规律和分布特征的研究发现重金属渗滤液沿地形优势通道迁移,在局部地段累积,导致土壤中重金属污染严重。结合本次研究区和矿区的位置关系,推测造成研究区内土壤重金属累积现象的原因可能为长时间的雨水冲刷,使矿山上的重金属迁移至研究区内造成。重金属含量统计中Hg的变异系数较高,峰度值、偏度值也较高,表明Hg含量受人为干扰较大,结合矿区开采背景,推测研究区土壤中Hg累积现象严重主要与矿区的混乱开采有关。
由于研究区土地用途为农田,且该区域重金属累积现象较严重,长远来看,应采取相应的措施减缓矿区对研究区的影响。目前,该矿区已关停,矿区对研究区土壤的影响主要通过重金属的自然迁移实现,因此,后续管理过程中针对研究区的保护措施应当以切断重金属的迁移途径为主。建议在矿区周边采用防渗阻隔技术,阻断重金属向矿区周边区域及深层土壤迁移的途径。同时,对阻隔产生的积水进行定期收集和处理,避免含重金属的水体造成进一步的污染。再者,建议针对矿区周边农田建立连续监测机制,动态监测周边土壤中的重金属含量以判断土地用途的合理性。
-
(1)研究区农田土壤中存在重金属累积现象。
(2)研究区农田土壤中Hg的累积受人为干扰程度最大,累积现象最严重,生态风险贡献值最高。
(3)研究区农田土壤中As、Cd、Cu、Zn、Cr和Ni同源性较高,主要来源为自然源。Hg的来源为复合源(人为源+自然源),其中人为源为主要来源。
金矿区农田土壤重金属空间分布特征及污染评价
Spatial distribution characteristics and pollution evaluation of heavy metals in farmland soil of gold mine areas
-
摘要: 为了解岷县某村无主金矿矿区历史活动对周边农田的影响,使用指数法对土壤质量进行评价,使用GIS地统计学模型对土壤重金属空间分布进行分析。结果表明,研究区土壤环境质量整体处于清洁水平,但存在重金属累积现象,并且整体呈现自西向东递减趋势。其中以汞的累积现象最为严重,这可能与当地混乱开采活动关系密切,因此,为控制重金属在该区域的持续积累,相应的管控措施是必不可少的。Abstract: In order to understand the influence of the historical activities of the unowned gold mining area in a village in Minxian County on the surrounding farmland, the index method was used to evaluate the soil quality, and the GIS geostatistical model was used to analyze the spatial distribution of soil heavy metals. The results showed that the overall soil environmental quality in the study area was at a clean level. However, there was an accumulation of heavy metals, and the overall trend was decreasing from west to east. Among them, the accumulation of mercury was the most serious, which might be closely related to local chaotic mining activities. Therefore, in order to manage the continuous accumulation of heavy metals in this area, corresponding control measures are essential.
-
Key words:
- soil /
- heavy metals /
- spatial distribution characteristics /
- pollution evaluation /
- pollution index
-
高速发展的工业化进程以及粗放的生产方式,使得大量的重金属进入土壤,导致我国土壤重金属污染形势不容乐观。近年来频发的土壤污染事故,尤其是农田土壤重金属污染事故,引起了人们对重金属污染的研究关注及对其污染危害的广泛研究。
农田土壤重金属污染不仅会影响农产品质量,造成经济损失,还会通过食物链影响人类和其他动物的生命健康,因此,研究农田中土壤重金属污染,探究重金属在农田土壤中的空间分布,评价其可能的潜在风险,对土壤重金属污染的防治以及保护人类生命健康都具有十分重要的意义。
本研究以某村庄无主金矿矿区以北农田土壤为研究对象,对重金属在土壤环境中的空间分布进行研究分析并评价其污染状况,研究结果将为该区域土壤污染治理和防控提供基础理论依据。
1. 材料与方法
1.1 研究区概况
研究区位于甘肃省岷县某金矿区附近(104.231715°~104.244558°E,34.511970°~34.515167°N),该区域地处西秦岭中低山区,地形平缓开阔,属于典型的构造侵蚀中低山地貌;当地气候处于温带半湿润向高寒湿润气候过渡带,高寒阴湿,常年主导风向西北风,平均风速1.3~1.5 m/s,最大风速24 m/s。研究区的土壤类型主要为黑土,土体疏松,结构良好。
1.2 数据来源
本次研究参考了《岷县曙光金矿无主矿区土壤污染治理项目场地环境调查报告》[1]中23个具有代表性的农田土壤点位数据(2018年4月)进行评价点位分布,见图1。
1.3 评价方法
本研究使用单因子指数、内梅罗综合污染指数、地质累积指数及潜在生态危害指数的分析方法对土壤中重金属的含量进行评价。各方法的评价标准,见表1。
表 1 选取评价方法的评价标准Table 1. Evaluation criteria for selecting evaluation methods地质累计指数法 单因子指数法 内梅罗综合指数法 潜在生态风险指数法 Igeo 级数 污染程度 Pi 污染程度 PN 污染程度 Eir RI 生态风险等级 Igeo 0 无 Pi<1 无污染 PN<0.7 清洁 Eir RI<150 轻微危害 0< Igeo 1 无-中度 1<Pi≤2 轻微污染 0.7<PN≤1 尚清洁 40≤ Eir 150≤RI<300 中等危害 1< Igeo 2 中度 2<Pi≤3 轻度污染 1<PN≤2 轻度污染 80≤ Eir 300≤RI<600 强危害 2< Igeo 3 中-强度 3<Pi≤5 中度污染 2<PN≤3 中度污染 160≤ Eir RI>600 很强危害 3< Igeo 4 强度 Pi>5 重度污染 PN>3 重度污染 Eir − 极强危害 4< Igeo 5 强-极强 − − − − − − − Igeo 6 极强 − − − − − − − 注:“-”,表示无。 1.4 变异系数
变异系数是统计学中反应数据离散程度的指标,见式(1):
Cv=σμ (1) 式中:
σ μ 1.5 数据处理
使用Excel2016对土壤重金属含量、污染指数和生态风险指数进行统计;使用SPSS26.0对数据相关性进行分析;使用ArcGIS10.2绘制土壤点位分布图、重金属的空间分布图。
2. 结果分析
2.1 土壤中重金属空间分布特征
通过对研究区土壤中的As、Cd、Cu、Pb、Cr和Ni 6种金属元素进行克里金插值分析,对Zn、Hg 2种金属元素进行反距离插值分析,得到研究区内各重金属含量的空间分布情况,见图2。
图2可知,8种重金属分布极为相似,均呈现自西向东递减趋势。
2.2 土壤pH及重金属含量分析
土壤pH及重金属含量统计,见表2。
表 2 研究区土壤pH及重金属含量统计Table 2. Statistics of soil pH and heavy metal content in the study area元素 最大值/mg·kg−1 最小值/mg·kg−1 中位数/mg·kg−1 平均值/mg·kg−1 标准偏差 变异系数 偏度系数 峰度系数 背景值/mg·kg−1 pH 7.74 7.03 7.18 7.28 0.20 0.03 0.67 −0.54 − Hg 0.52 0.16 0.21 0.23 0.07 0.30 3.26 13.22 0.02 As 22.40 12.20 15.20 15.79 2.46 0.16 0.82 0.76 12.60 Cd 0.29 0.11 0.19 0.19 0.05 0.25 0.22 −0.80 0.12 Cu 40.80 19.80 27.90 29.02 5.27 0.18 0.64 0.27 24.10 Pb 13.90 7.16 10.60 10.64 1.39 0.13 −0.14 1.70 18.80 Cr 219.00 84.90 154.00 155.10 34.70 0.22 −0.15 −0.61 62.23 Zn 157.00 68.80 96.40 99.50 17.63 0.18 1.33 3.70 69.30 Ni 61.60 28.60 41.30 43.57 7.85 0.18 0.71 0.40 35.20 表2可知,研究区土壤pH处于7.03~7.74范围内,整体呈弱碱性。土壤中Hg、As、Cd、Cu、Pb、Cr、Zn和Ni含量分别为0.16~0.52 、12.20~22.40 、0.11~0.29、19.80~40.80、7.16~13.90、84.90~219.00、68.80~157.00和28.60~61.60 mg/kg。与国家标准相比,研究区土壤中8种重金属平均含量均不存在超标现象。与甘肃省背景值相比,研究区土壤中Hg、As、Cd、Cu、Cr、Zn和Ni 7种重金属平均含量超出该区域土壤环境的背景值,说明存在累积现象。
变异系数可反映人类活动对区域内重金属含量的影响程度。通过计算可知,Hg、Cd和Cr在研究区变异系数分别为0.30、0.25和0.22,处于0.2~0.5之间,变异性适度。As、Cu、Pb、Zn和Ni变异系数均低于0.2,变异性相对较弱[2-4]。由于变异系数数值越大,空间变异性越大,受人为干扰程度越大。因此,研究区Hg变异系数相对较高,偏度和峰度值也相对较高,可推测其受当地人为活动影响较大。
2.3 土壤中重金属污染评价
单因子污染指数能反映单项重金属在土壤中的污染程度;内梅罗指数则能反映土壤中多种重金属的综合污染程度。本研究分别以《土壤环境质量 农用地土壤污染风险管控标准(试行):GB 15618—2018》表1中的限值和甘肃省土壤中金属元素背景值为评价标准,使用上述2种方法对重金属的污染程度进行综合评价,统计,见表3。
表 3 研究区土壤各重金属的单因子指数与内梅罗综合指数统计(以背景值为依据)Table 3. Statistics of the single factor index and Nemerow comprehensive index of each heavy metal in the soil of the study area (based on background value)元素 单因子指数 内梅罗综合指数 最大值 最小值 平均值 PN 土壤环境质量等级 Hg 25.75 7.90 11.43 19.92 重度污染 As 1.78 0.97 1.25 1.54 轻度污染 Cd 2.42 0.95 1.60 2.05 中度污染 Cu 1.69 0.82 1.20 1.47 轻度污染 Pb 0.74 0.38 0.57 0.66 清洁 Cr 3.52 1.36 2.49 3.05 重度污染 Zn 2.27 0.99 1.44 1.90 轻度污染 Ni 1.75 0.81 1.24 1.52 轻度污染 当以背景值为评价标准时,研究区土壤中Hg、As、Cd、Cu、Pb、Cr、Zn和Ni的单因子污染指数范围分别为7.90~25.75、0.97~1.87、0.95~2.42、0.82~1.69、0.38~0.74、1.36~3.52、0.99~2.27和0.81~1.75之间,见表3。数据显示100%、91%、96%、87%、100%、96%和96%样点的Hg、As、Cd、Cu、Cr、Zn和Ni含量超过甘肃省土壤背景值。
当以GB 15618—2018限值为评价标准时,研究区Hg、As、Cd、Cu、Pb、Cr、Zn和Ni的单因子污染指数范围分别为0.046~0.215、0.407~0.747、0.228~0.967、0.198~0.408、0.047~0.116、0.425~1.095、0.275~0.628和0.151~0.616之间,见表4。除Cr轻微超标外,研究区内其余7种重金属元素含量均不超标。内梅罗综合指数显示研究区土壤处于清洁状态。
表 4 研究区土壤各重金属单因子指数与内梅罗综合指数统计(以标准值为依据)Table 4. Statistics of heavy metal single factor index and Nemerow comprehensive index of soil in the study area (based on standard value)元素 单因子指数 内梅罗综合指数 最大值 最小值 平均值 PN 土壤环境质量等级 Hg 0.21 0.05 0.09 0.16 清洁 As 0.75 0.41 0.54 0.65 清洁 Cd 0.97 0.23 0.60 0.81 清洁 Cu 0.41 0.20 0.29 0.35 清洁 Pb 0.12 0.05 0.09 0.10 清洁 Cr 1.10 0.42 0.76 0.94 清洁 Zn 0.63 0.28 0.39 0.52 清洁 Ni 0.62 0.15 0.41 0.52 清洁 研究区土壤中重金属的地质累积指数统计,见表5。
表 5 研究区土壤中8种重金属地质累计指数统计Table 5. Statistics of geological cumulative index of eight heavy metals in the soil of the study area元素 地质累计指数法 范围 平均值 标准差 污染等级 Hg 2.40~4.10 2.88 0.34 无—中度 As −0.63~025 −0.28 0.22 无 Cd −0.66~0.69 0.05 0.38 无—中度 Cu −0.87~-0.17 −0.34 0.26 无 Pb −1.98~-1.02 −1.42 0.20 无 Cr −0.14~1.23 0.69 0.35 无—中度 Zn −0.60~0.59 −0.08 0.24 无 Ni −0.88~0.22 −0.30 0.25 无 表5可知,8种重金属的地质累积指数平均值由大到小依次为Hg>Cr>Cd>Zn>As>Ni>Cu>Pb。结果显示,除Hg、Cr和Cd以外,其余5种重金属均无污染程度。8种重金属地质累积指数的极大值均﹥0,表明研究区内存在重金属累积现象,其中Hg累积最严重,其次是Cr和Cd。
研究区域8种重金属潜在生态风险系数,见表6。
表 6 研究区土壤中8种重金属的潜在生态风险系数统计Table 6. Potential ecological risk coefficient statistics of eight heavy metals in the soil of the study area项目 范围 平均值 风险等级 单项潜在生态风险 Hg 316~1 030 457.04 极强危害 As 9.68~17.78 12.53 轻微危害 Cd 28.50~72.50 48.01 中等危害 Cu 4.11~8.46 6.02 轻微危害 Pb 1.90~3.70 2.83 轻微危害 Cr 2.73~7.04 4.98 轻微危害 Zn 0.99~2.27 1.44 轻微危害 Ni 4.06~8.75 6.19 轻微危害 综合潜在生态风险 408~1 144 539.00 轻微危害 表6可知,8种重金属单项潜在生态风险指数均值大小顺序为Hg>Cd>As>Ni>Cu>Cr>Pb>Zn。其中,As、Ni、Cu、Cr、Pb和Zn潜在生态风险系数均值均﹤40,处于轻微危害水平;Hg潜在生态风险系数均值为457.04,明显高于其他重金属,处于极强危害水平;Cd潜在生态风险系数均值为48.01,处于中等危害水平。研究区多元素综合污染指数均值为539,整体潜在生态风险等级较高,主要贡献因子为Hg。
2.4 土壤中重金属相关性分析
土壤重金属的来源主要包括自然源和人为源。通过重金属之间的相关性分析能够判断几种重金属的来源是否一致,若重金属间相关性较强,表现为显著正相关时,说明这些重金属的来源具有同一性。否则,可能有多个来源[5]。对研究区农田土壤重金属进行Spearman相关性分析,见表7。
表 7 土壤重金属相关系数(Spearman)Table 7. Correlation coefficient of soil heavy metals (Spearman)元素 Hg As Cd Cu Pb Cr Zn Ni Hg 1 As 0.346 1 Cd −0.159 0.322 1 Cu 0.110 0.136 0.644** 1 Pb −0.146 −0.044 −0.179 −0.049 1 Cr 0.100 0.218 0.093 0.033 0.182 1 Zn −0.164 0.415* 0.495* 0.493* 0.131 0.230 1 Ni 0.009 0.209 0.363 0.637** −0.060 0.519* 0.504* 1 注:*在 0.05 级别(双尾),相关性显著;**在0.01级别(双尾),相关性显著。 表7可知,重金属Cu-Cd、Ni-Cu之间的相关系数分别为0.644、0.637,达到极显著正相关关系(P<0.01),Zn-As、Zn-Cd、Zn-Cu、Ni-Cr和Ni-Zn之间的相关系数分别为0.415、0.495、0.493、0.519和0.504,达到显著正相关关系(P<0.05),表明其来源具有同源性。
3. 讨论
数据显示研究区内100%、91%、96%、87%、100%、96%和96%样点的Hg、As、Cd、Cu、Cr、Zn和Ni超过甘肃省土壤背景值,研究区土壤中重金属累积现象严重,其中以Hg的累积现象最为严重。这一结论与孙建伟等[6]、张江华等[7]和林荩等[8]对豫西金矿区、小秦岭金矿区和潼关金矿区的研究结果相似,进一步说明矿区周边农田土壤重金属污染主要是由开采活动造成的。
此外,牛真茹等[9]通过对某金属冶炼场浅层土壤重金属空间变异规律和分布特征的研究发现重金属渗滤液沿地形优势通道迁移,在局部地段累积,导致土壤中重金属污染严重。结合本次研究区和矿区的位置关系,推测造成研究区内土壤重金属累积现象的原因可能为长时间的雨水冲刷,使矿山上的重金属迁移至研究区内造成。重金属含量统计中Hg的变异系数较高,峰度值、偏度值也较高,表明Hg含量受人为干扰较大,结合矿区开采背景,推测研究区土壤中Hg累积现象严重主要与矿区的混乱开采有关。
由于研究区土地用途为农田,且该区域重金属累积现象较严重,长远来看,应采取相应的措施减缓矿区对研究区的影响。目前,该矿区已关停,矿区对研究区土壤的影响主要通过重金属的自然迁移实现,因此,后续管理过程中针对研究区的保护措施应当以切断重金属的迁移途径为主。建议在矿区周边采用防渗阻隔技术,阻断重金属向矿区周边区域及深层土壤迁移的途径。同时,对阻隔产生的积水进行定期收集和处理,避免含重金属的水体造成进一步的污染。再者,建议针对矿区周边农田建立连续监测机制,动态监测周边土壤中的重金属含量以判断土地用途的合理性。
4. 结论
(1)研究区农田土壤中存在重金属累积现象。
(2)研究区农田土壤中Hg的累积受人为干扰程度最大,累积现象最严重,生态风险贡献值最高。
(3)研究区农田土壤中As、Cd、Cu、Zn、Cr和Ni同源性较高,主要来源为自然源。Hg的来源为复合源(人为源+自然源),其中人为源为主要来源。
-
表 1 选取评价方法的评价标准
Table 1. Evaluation criteria for selecting evaluation methods
地质累计指数法 单因子指数法 内梅罗综合指数法 潜在生态风险指数法 Igeo 级数 污染程度 Pi 污染程度 PN 污染程度 Eir RI 生态风险等级 Igeo 0 无 Pi<1 无污染 PN<0.7 清洁 Eir RI<150 轻微危害 0< Igeo 1 无-中度 1<Pi≤2 轻微污染 0.7<PN≤1 尚清洁 40≤ Eir 150≤RI<300 中等危害 1< Igeo 2 中度 2<Pi≤3 轻度污染 1<PN≤2 轻度污染 80≤ Eir 300≤RI<600 强危害 2< Igeo 3 中-强度 3<Pi≤5 中度污染 2<PN≤3 中度污染 160≤ Eir RI>600 很强危害 3< Igeo 4 强度 Pi>5 重度污染 PN>3 重度污染 Eir − 极强危害 4< Igeo 5 强-极强 − − − − − − − Igeo 6 极强 − − − − − − − 注:“-”,表示无。 表 2 研究区土壤pH及重金属含量统计
Table 2. Statistics of soil pH and heavy metal content in the study area
元素 最大值/mg·kg−1 最小值/mg·kg−1 中位数/mg·kg−1 平均值/mg·kg−1 标准偏差 变异系数 偏度系数 峰度系数 背景值/mg·kg−1 pH 7.74 7.03 7.18 7.28 0.20 0.03 0.67 −0.54 − Hg 0.52 0.16 0.21 0.23 0.07 0.30 3.26 13.22 0.02 As 22.40 12.20 15.20 15.79 2.46 0.16 0.82 0.76 12.60 Cd 0.29 0.11 0.19 0.19 0.05 0.25 0.22 −0.80 0.12 Cu 40.80 19.80 27.90 29.02 5.27 0.18 0.64 0.27 24.10 Pb 13.90 7.16 10.60 10.64 1.39 0.13 −0.14 1.70 18.80 Cr 219.00 84.90 154.00 155.10 34.70 0.22 −0.15 −0.61 62.23 Zn 157.00 68.80 96.40 99.50 17.63 0.18 1.33 3.70 69.30 Ni 61.60 28.60 41.30 43.57 7.85 0.18 0.71 0.40 35.20 表 3 研究区土壤各重金属的单因子指数与内梅罗综合指数统计(以背景值为依据)
Table 3. Statistics of the single factor index and Nemerow comprehensive index of each heavy metal in the soil of the study area (based on background value)
元素 单因子指数 内梅罗综合指数 最大值 最小值 平均值 PN 土壤环境质量等级 Hg 25.75 7.90 11.43 19.92 重度污染 As 1.78 0.97 1.25 1.54 轻度污染 Cd 2.42 0.95 1.60 2.05 中度污染 Cu 1.69 0.82 1.20 1.47 轻度污染 Pb 0.74 0.38 0.57 0.66 清洁 Cr 3.52 1.36 2.49 3.05 重度污染 Zn 2.27 0.99 1.44 1.90 轻度污染 Ni 1.75 0.81 1.24 1.52 轻度污染 表 4 研究区土壤各重金属单因子指数与内梅罗综合指数统计(以标准值为依据)
Table 4. Statistics of heavy metal single factor index and Nemerow comprehensive index of soil in the study area (based on standard value)
元素 单因子指数 内梅罗综合指数 最大值 最小值 平均值 PN 土壤环境质量等级 Hg 0.21 0.05 0.09 0.16 清洁 As 0.75 0.41 0.54 0.65 清洁 Cd 0.97 0.23 0.60 0.81 清洁 Cu 0.41 0.20 0.29 0.35 清洁 Pb 0.12 0.05 0.09 0.10 清洁 Cr 1.10 0.42 0.76 0.94 清洁 Zn 0.63 0.28 0.39 0.52 清洁 Ni 0.62 0.15 0.41 0.52 清洁 表 5 研究区土壤中8种重金属地质累计指数统计
Table 5. Statistics of geological cumulative index of eight heavy metals in the soil of the study area
元素 地质累计指数法 范围 平均值 标准差 污染等级 Hg 2.40~4.10 2.88 0.34 无—中度 As −0.63~025 −0.28 0.22 无 Cd −0.66~0.69 0.05 0.38 无—中度 Cu −0.87~-0.17 −0.34 0.26 无 Pb −1.98~-1.02 −1.42 0.20 无 Cr −0.14~1.23 0.69 0.35 无—中度 Zn −0.60~0.59 −0.08 0.24 无 Ni −0.88~0.22 −0.30 0.25 无 表 6 研究区土壤中8种重金属的潜在生态风险系数统计
Table 6. Potential ecological risk coefficient statistics of eight heavy metals in the soil of the study area
项目 范围 平均值 风险等级 单项潜在生态风险 Hg 316~1 030 457.04 极强危害 As 9.68~17.78 12.53 轻微危害 Cd 28.50~72.50 48.01 中等危害 Cu 4.11~8.46 6.02 轻微危害 Pb 1.90~3.70 2.83 轻微危害 Cr 2.73~7.04 4.98 轻微危害 Zn 0.99~2.27 1.44 轻微危害 Ni 4.06~8.75 6.19 轻微危害 综合潜在生态风险 408~1 144 539.00 轻微危害 表 7 土壤重金属相关系数(Spearman)
Table 7. Correlation coefficient of soil heavy metals (Spearman)
元素 Hg As Cd Cu Pb Cr Zn Ni Hg 1 As 0.346 1 Cd −0.159 0.322 1 Cu 0.110 0.136 0.644** 1 Pb −0.146 −0.044 −0.179 −0.049 1 Cr 0.100 0.218 0.093 0.033 0.182 1 Zn −0.164 0.415* 0.495* 0.493* 0.131 0.230 1 Ni 0.009 0.209 0.363 0.637** −0.060 0.519* 0.504* 1 注:*在 0.05 级别(双尾),相关性显著;**在0.01级别(双尾),相关性显著。 -
[1] 刘奇林, 崔宝山, 陈蓓, 等. 岷县曙光金矿无主矿区土壤污染治理项目场地环境调查报告[R]. 甘肃: 岷县人民政府, 2019. [2] 王莹捷, 张波, 马鑫, 等. 甘肃省武威酿酒葡萄种植区土壤重金属分布特征及来源分析[J]. 食品与发酵工业, 2021, 47(22): 99 − 108. [3] 王钦德, 杨坚. 食品试验设计与统计分析基础[M]. 北京: 中国农业大学出版社, 2009: 34-36. [4] 王蕊, 陈楠, 张二喜, 等. 龙岩市某铁锰矿区土壤重金属地球化学空间分布特征与来源分析[J]. 环境科学, 2021, 42(3): 1114 − 1122. [5] 杨蕊, 李小平, 王继文, 等. 西宁市城市土壤重金属分布特征及其环境风险[J]. 生态学杂志, 2016, 35(6): 1531 − 1538. [6] 孙建伟, 贾煦, 刘向东, 等. 豫西金矿集区矿业活动对周边农田土壤重金属影响研究[J]. 岩矿测试, 2023, 42(1): 192 − 202. [7] 张江华, 徐友宁, 陈华清, 等. 小秦岭金矿区土壤-小麦重金属累积效应对比研究[J]. 西北地质, 2020, 53(3): 284 − 294. [8] 林荩, 梁文静, 焦旸, 等. 陕西潼关县金矿矿区周边农田土壤重金属生态健康风险评价[J]. 中国地质, 2021, 48(3): 749 − 763. [9] 牛真茹, 齐硕, 吴庭雯, 等. 某有色冶炼场地浅层土壤重金属空间变异规律与分布特征[J]. 土壤通报, 2016, 47(3): 738 − 745. -


 下载:
下载:


