-
二氧化碳(CO2)的排放改变了大气的辐射收支平衡,导致对流层近极地地区和极圈温度大幅度上升[1-3]。自《京都议定书》签订以来,关注气候变化成为全球重点议题[4-5],减少温室气体排放以积极应对全球变暖成为各国共识[6-7]。中国力争在2030年前后实现“碳达峰”、在2060年实现“碳中和”[8]。作为中国“一带一路”政策参与的重要省份[9],为在“一带一路”政策扶持下实现“碳达峰”[10],《甘肃省国民经济和社会发展第十四个五年规划和2035年远景目标纲要》提出,甘肃省“经济结构、能源结构、产业结构加快向绿色低碳转型”,“大力推动非化石能源持续快速增长,加快调整优化产业结构、能源结构”,“推动能源清洁低碳安全高效利用,进一步提升非化石能源消费比重”。
国内已有学者用不同方法就不同省份的“碳达峰”进行了预测并提出了相应的实现路径[11-20],对甘肃省目前开展的研究主要有:焦文献等[21]基于IPAT等式研究了甘肃省能源消费的碳排放特征,提出通过调整能源结构可以促进甘肃省低碳经济的发展[22];唐雯等[9]基于向量自回归(VAR)模型研究了甘肃省能源利用现状;钱娇[23]就甘肃省服务业的碳排放因素进行了分析。上述研究对甘肃省目前的CO2排放现状,甘肃省实现“碳达峰”的最优路径,以及不同发展情景下甘肃省不同市(州)的CO2排放量等的研究较少。本研究采用最新的“MEIC(Multi-resolution Emission Inventory for China)清单”(2017)、《甘肃发展年鉴2021》提供的甘肃省能源消费数据等,通过对IPAT等式进行本地化修正,计算甘肃省不同市(州)的CO2排放量,并研究不同发展情景下甘肃省的“碳达峰”情况,以期为甘肃省制定减排路径、实现“双碳”目标提供参考。
-
利用IPAT等式进行不同政策、情景下CO2的排放研究是一种较为经典的方法[24-27]。经典IPAT等式把环境影响(I)归结为人口(P)、富裕(A,指人均生产或消费)和技术(T,指单位生产或消费的环境影响)3个关键驱动力乘积的结果[28]。其数学形式见式(1):
焦文献等[21]根据经典IPAT提出一种基于能源结构计算碳排放的方法,见式(2):
式中:I表示碳排放量,t;E表示能源消费总量,tce;
αi 表示第i种能源的结构份额;λi 表示第i种能源的碳排放系数;i的取值为1~4,分别表示煤炭、石油、天然气和电力4种能源。由于式(2)是基于能源结构计算碳排放,对于同一种能源,仅用一个通用的碳排放系数表征不同行业的碳排放,忽略了不同行业对于能源不同的利用效率及排放特征,这种矛盾在电力行业尤为突出。为了对简单归一的碳排放系数所造成的误差加以订正,本次研究引入2008—2017年的“MEIC清单”[29-30](http://meicmodel.org)对式(2)进行修正,见式(3~5):
式中:C为利用MEIC清单修正后的甘肃省CO2排放总量,t;
4412 为CO2与碳的相对分子质量之比。β 为基于MEIC清单的修正因子;Mj 表示j年的MEIC清单中甘肃省CO2排放总量,t;Ij 表示式(3)中β =1时基于能源计算的甘肃省CO2排放总量,j的取值为2008~2017;R为采取不同降碳措施引起的CO2减排量,在不采取任何降碳措施时R=0。煤炭、石油和天然气的碳排放系数分别取0.747 6 、0.582 5和0.447 9 tC/tce[21,29-33]。根据《省级温室气体清单编制指南》《2010年中国区域及省级电网平均二氧化碳排放因子》《2011年和2012年中国区域电网平均二氧化碳排放因子》,以及《综合能耗计算通则:GB/T 2589—2020》提供的电力折标系数,电力CO2排放系数在2005—2009年取0.291 5 tC/tce,在2010年取0.182 7 tC/tce,在2011—2020年取0.180 1 tC/tce。经式(4~5)计算,
βj 的平均值为1.116 1、方差为0.002 6,βj变化幅度较小,因此可以采用平均值β 作为修正因子,修正因子β=1.116 1。甘肃省空间分配因子计算公式,见式(6),表征甘肃省现有能源布局、产业布局下甘肃省各市(州)的CO2排放情况。
式中:m代表甘肃省不同的市(州);
μm 为m市(州)的空间分配因子;M为MEIC清单2017甘肃省CO2排放总量,t;Mm为MEIC清单2017甘肃省m市(州)CO2排放总量,t。文中所采用的产业结构数据、地区生产总值GRP(Gross Regional Product)数据和不同能源消费总量数据等均来自《甘肃发展年鉴2021》,用于修正因子计算的数据来源于“MEIC清单”(2008—2017),用于进行甘肃省空间分配因子计算的数据来源于“MEIC清单”(2017)。
-
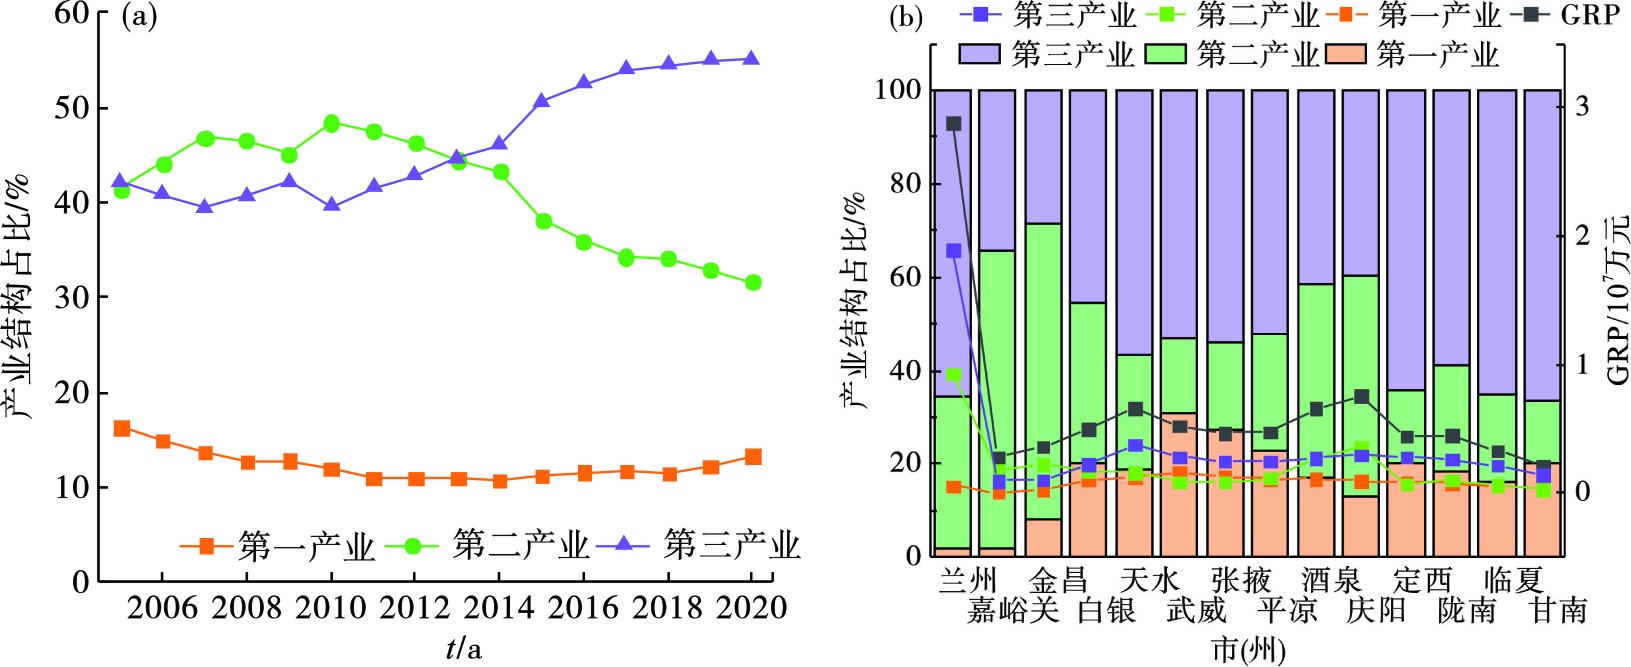
甘肃省2005—2020年产业结构变化趋势见图1(a),2020年不同市(州)的产业结构占比及地区生产总值变化见图1(b)。
图1(a)可知,甘肃省2003—2018年第一产业产值比重较低且呈下降趋势,而2019年和2020年第一产业产值比重有所上升但仍处于较低水平。在2005—2020年甘肃省第二产业产值虽有所波动但仍呈现下降趋势。与此相反,第三产业在2005—2020年呈现波动上升趋势,在2013年第三产业产值超过第二产业占据主导地位,且第三产业与第二产业产值差距进一步扩大。甘肃省产业结构调整基本符合产业结构演变规律,全省经济增长主要由第二产业带动为主转换为主要由第三产业带动,呈现“三二一”的特点,未来甘肃省产业结构将不断优化升级,并向高质量方向发展[9]。
图1(b)可知,甘肃省经济发展严重不平衡,除省会兰州以外,其余各市(州)地区生产总值均较低。嘉峪关、金昌、酒泉和庆阳产业结构中第二产业占比超过40%,其中嘉峪关、金昌的产业结构中第二产业占比更是超过了50%,这些城市的经济发展十分依赖第二产业。
-
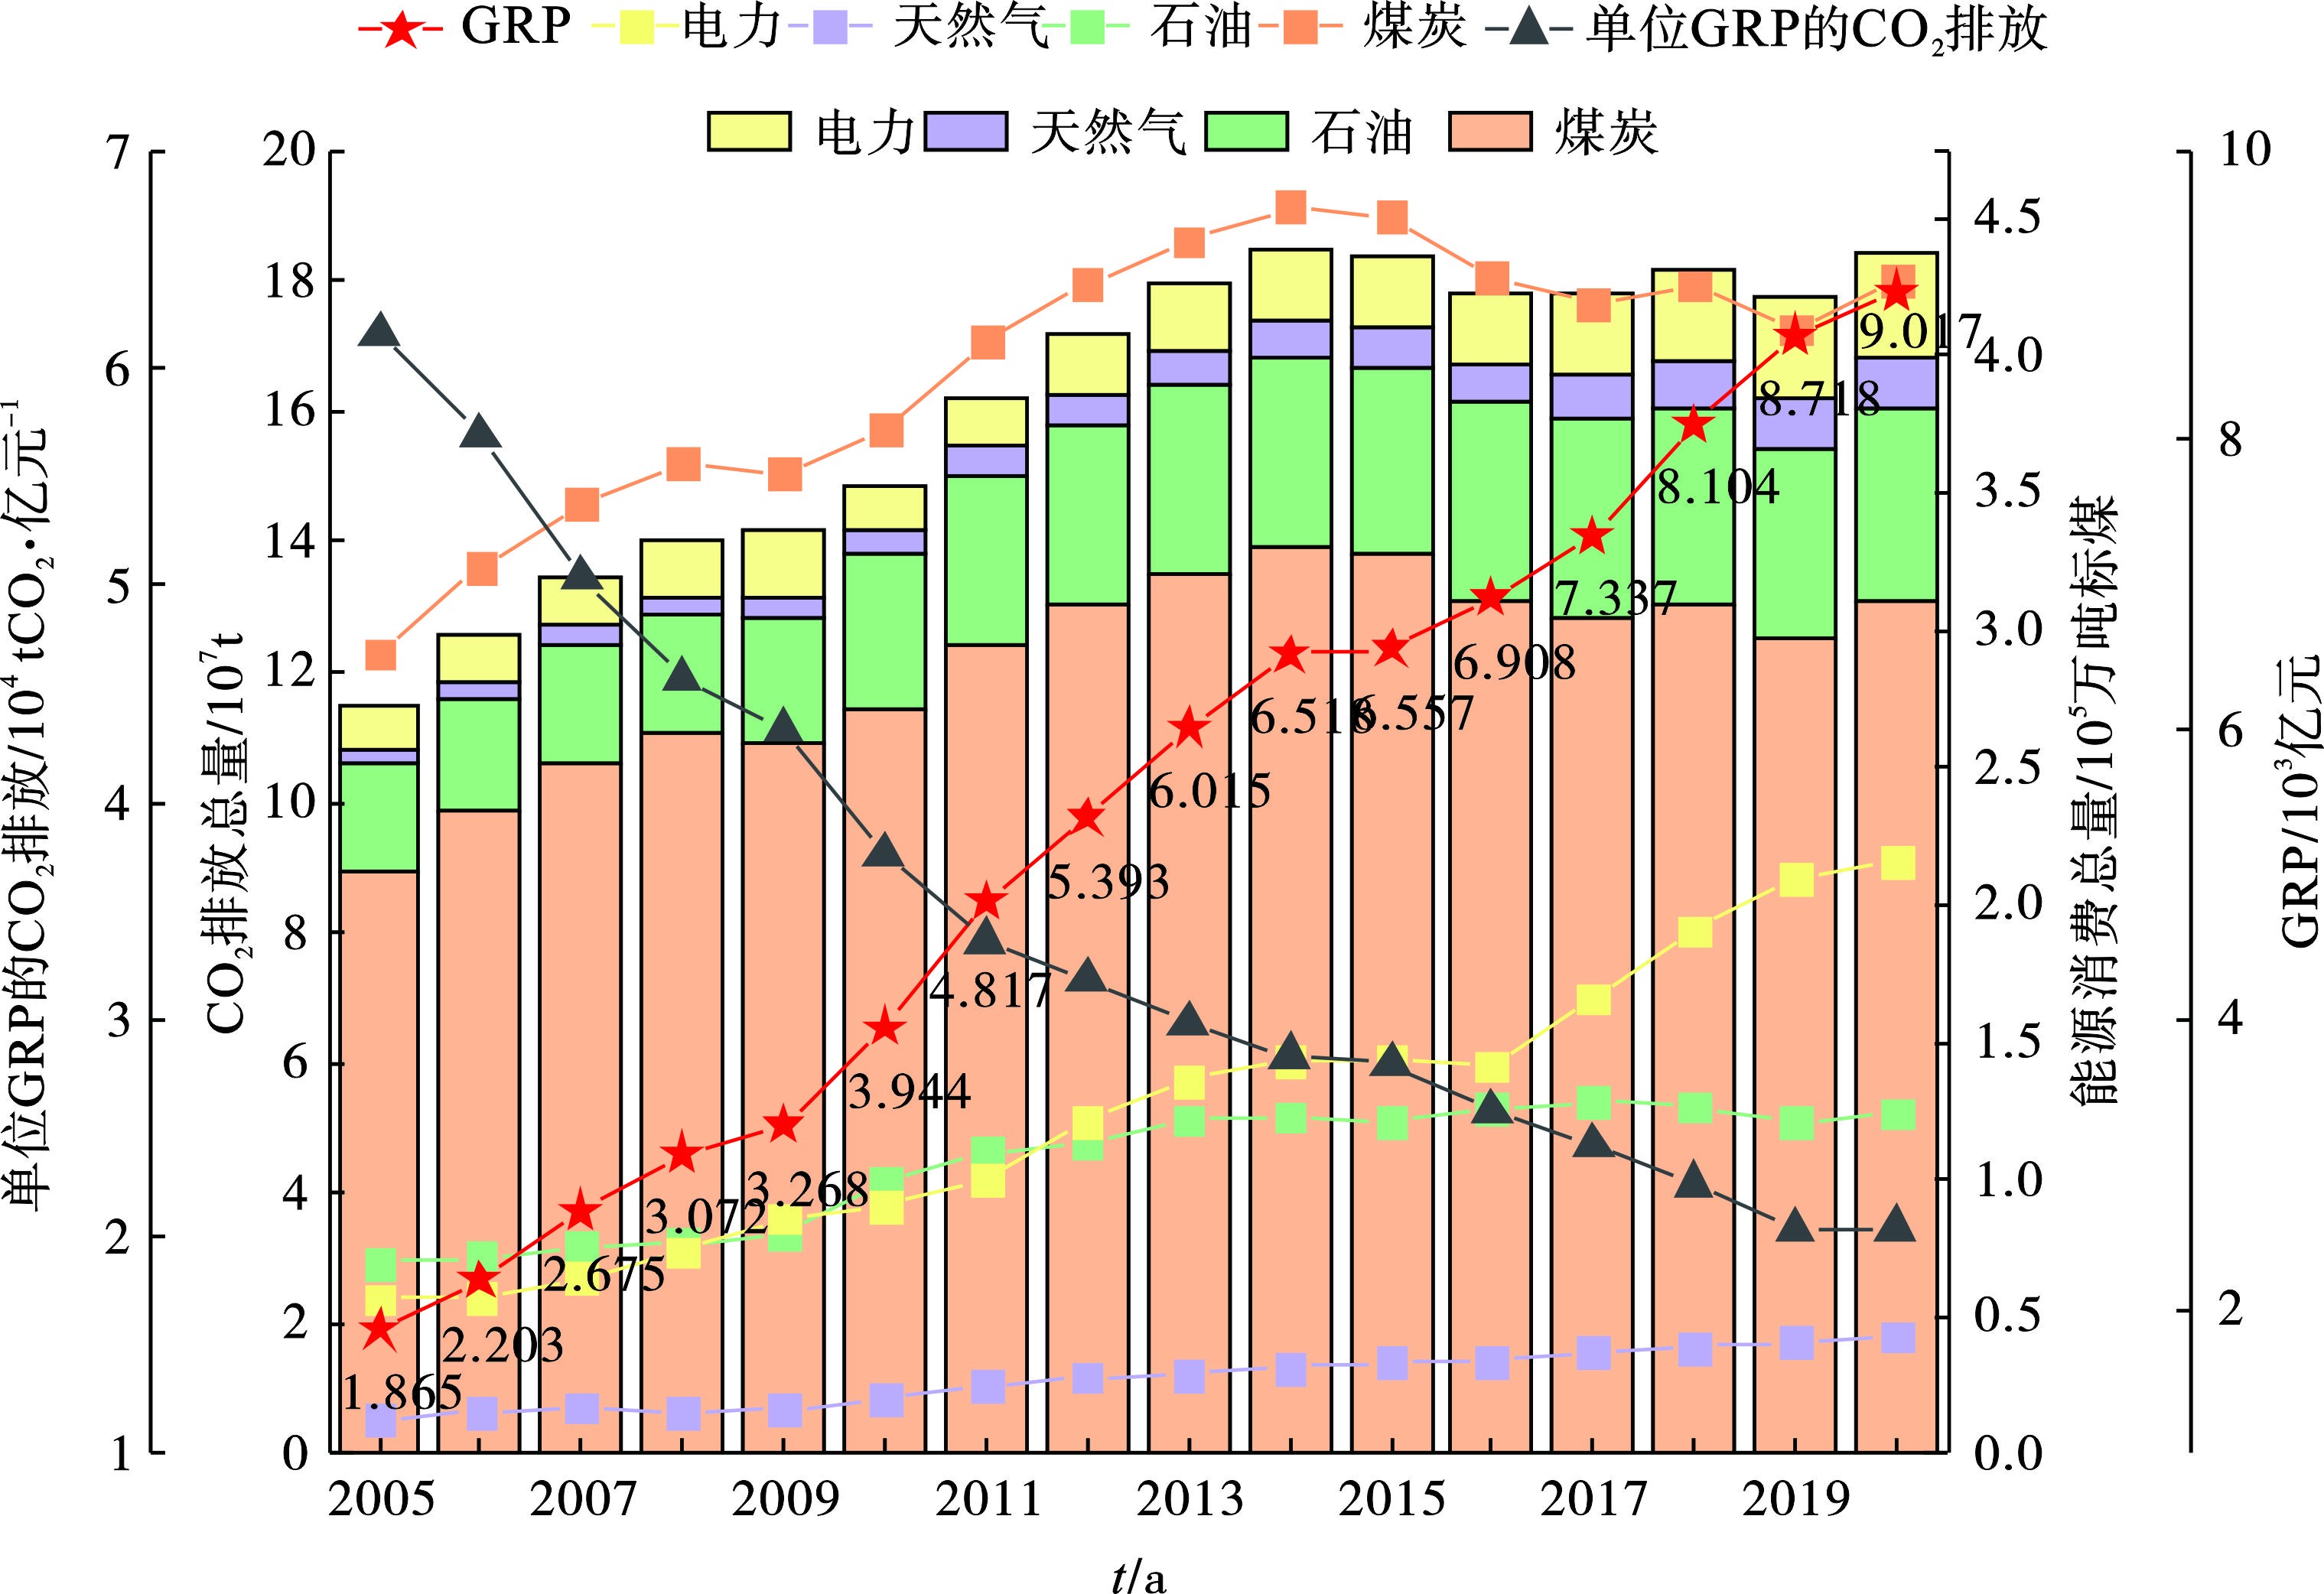
根据2005—2020年的不同能源类型的消耗量及占比,利用修正的IPAT等式(公式3,其中修正因子β=1.116 1)计算修正后甘肃省2005—2020年CO2排放量,见图2。
图2可知,2005—2020年天然气、电力的消费量呈逐年上升趋势。其中,天然气消费量增长速度较慢,而电力消费量上升最快,在2014—2016年上升放缓后又呈现迅速上升的趋势。煤炭和石油的消费量呈现出波动上升的趋势,煤炭消费量波动幅度较大,石油消费量波动幅度不明显。
2005—2020年甘肃省CO2排放量呈现波动上升趋势,且煤炭对于CO2排放的贡献最大,天然气贡献最小,石油和电力的CO2排放贡献逐年升高。在2005—2015年,甘肃省CO2排放量与煤炭消费量有较好的一致性,之后随着煤炭消费量下降和电力消费量的升高,煤炭消费产生的CO2排放对于甘肃省CO2总排放的影响有所降低。
2005—2020年甘肃省的地区生产总值(GRP)呈现稳步上升态势,GRP增长速率显著高于甘肃省CO2排放总量的增长速率,说明随着科学技术进步、产业结构和能源结构的轻微调整[9,34],单位GRP的CO2排放逐年降低(黑色点线)。甘肃省2020年单位GRP CO2排放与2005年相比降低了66.8%,远超《中华人民共和国国民经济和社会发展第十四个五年规划和2035年远景目标纲要》要求的48.4%。
-
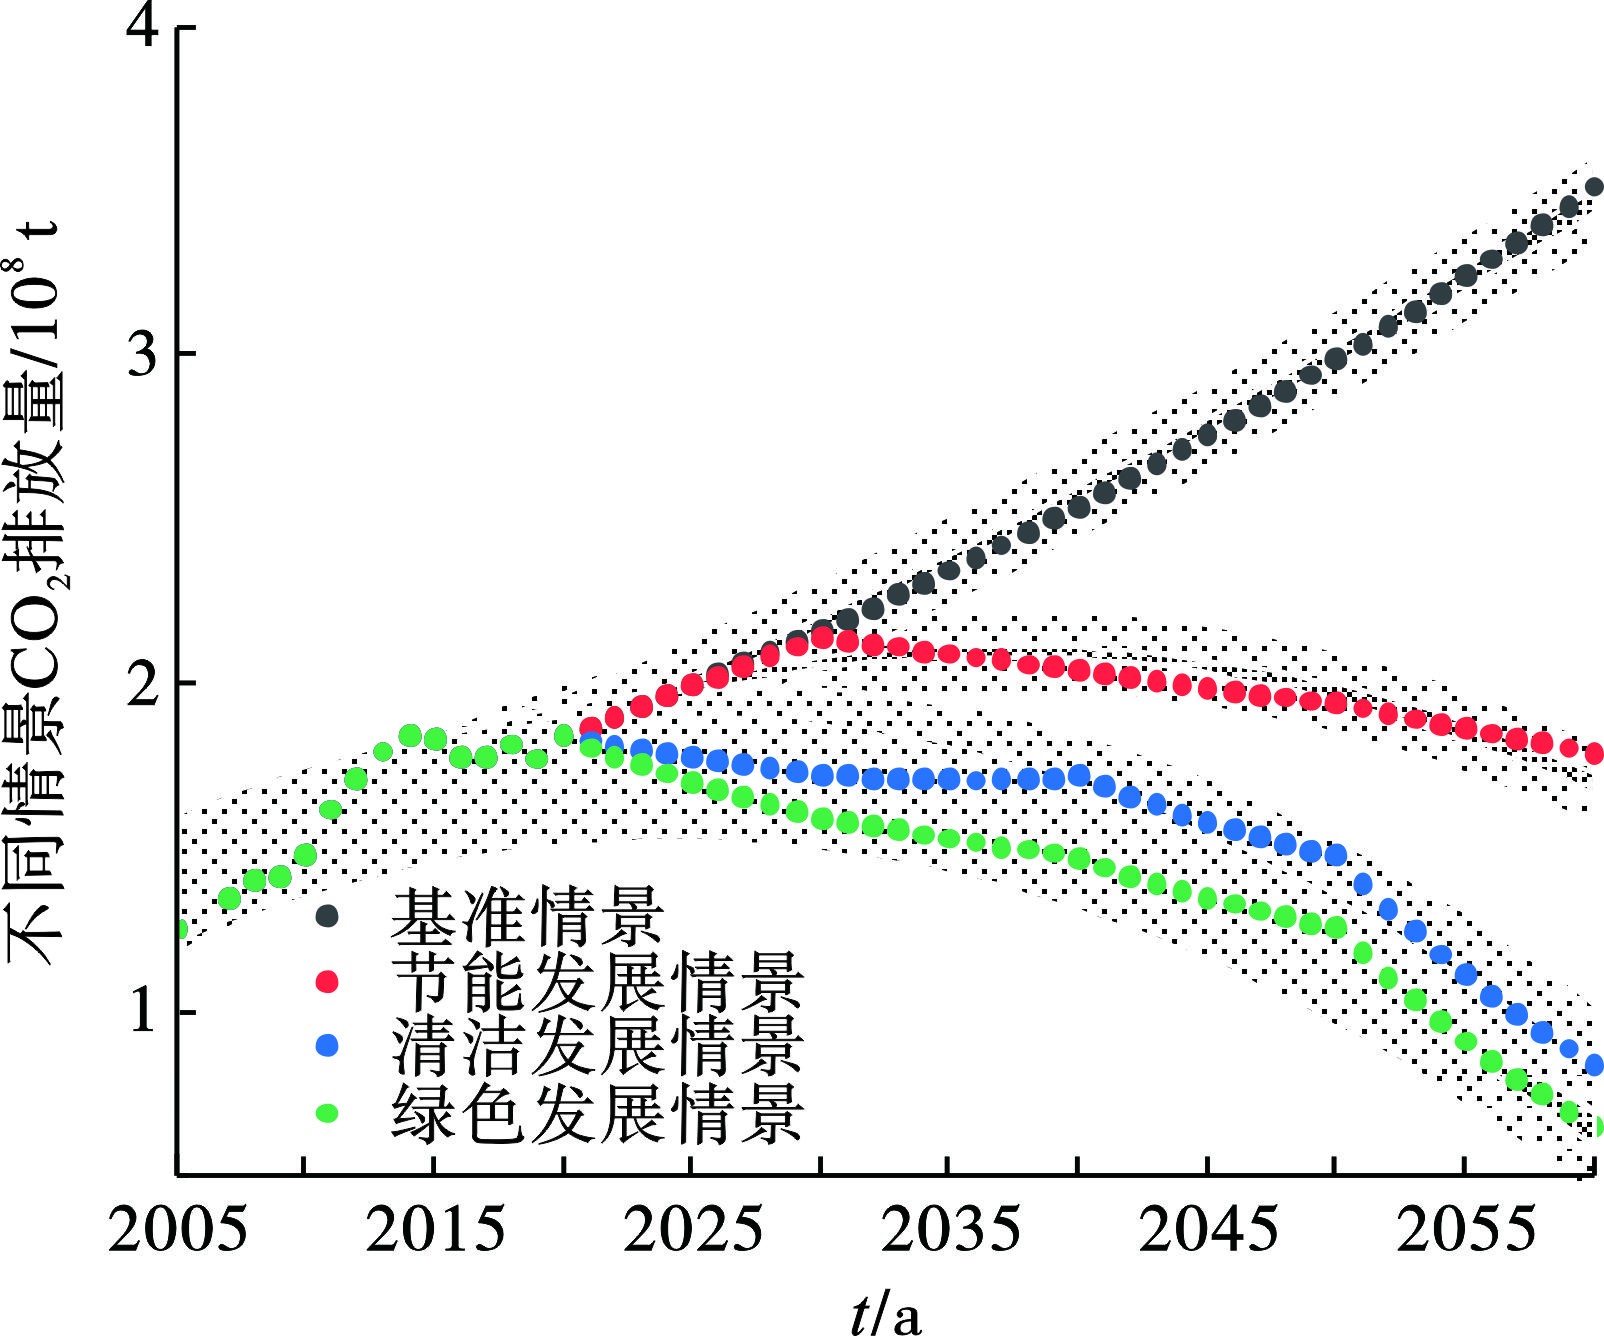
通过能源结构调整、产业结构调整、电力结构调整和能源效率提升设计基准情景、节能发展情景、清洁发展情景和绿色发展情景,见表1,并利用修正的IPAT等式,计算不同情景下甘肃省“碳达峰”的情况,见图3。
-
基准情景是以2020年作为基准,将能源结构、产业结构和电力结构比例冻结在2020年,并用2015—2020年能源消费总量平均增加值作为未来甘肃省能源消费总量年均增长比例来进行甘肃省CO2计算的情景。
-
节能发展情景是依据王陆新等[35]对中国“碳达峰”“碳中和”实现路径的研究,通过在发展的不同阶段对整体化石能源增长幅度进行调整,通过能源消费总量的角度来进行CO2减排的情景。在此过程中,甘肃省能源结构、产业结构、电力结构与基准情景相同,冻结在2020年。
-
清洁发展情景是在节能发展情景的基础上,依据王陆新等[35]的研究,进一步对煤炭、石油和天然气在不同发展阶段的增长水平进行约束,并在2020年原有电力结构的基础上新增了风力发电和光伏发电的情景,通过对能源结构和电力结构进行优化调整,是一种较为清洁的发展路径。
-
绿色发展情景是在清洁发展情景的基础上,用更为严格的增长水平对不同发展阶段的煤炭、石油和天然气进行约束,同时进一步提高风力发电和光伏发电的比例,并通过提升能源利用效率、间接减少火力发电发电量实现能源结构方面的CO2减排。此外,还考虑了技术进步、电网输送损失降低引起的间接CO2减排[13],并在燃煤电厂服务年限临近时逐步进行全省的碳捕集与封存技术改造[36]。宋鹏等[13]研究指出,服务业年均就业率提高可以降低CO2排放,因此通过对产业结构进行调整、提高服务业年均就业率降低CO2排放[37]。
绿色发展情景是通过对能源结构、产业结构和电力结构多方面进行调整,从而降低CO2排放的一种更加高效、强力降碳的情景。
图3可知,在基准情景下,甘肃省CO2排放不会出现峰值,无法实现“碳达峰”。在节能发展情景下,通过阶段性降低化石燃料占比,甘肃省能够在2033年前后实现“碳达峰”,CO2排放量峰值为2.15×10⁸ t。在清洁发展情景下,通过在节能发展情景的基础上阶段性调整不同能源结构配比,并逐年提高光伏发电、风力发电等清洁能源的比例,甘肃省能够在2028年前后实现“碳达峰”,CO2排放量峰值为1.87×10⁸ t。在绿色发展情景下,通过在清洁发展情景的基础上进行产业结构调整、提高能源利用效率、提高清洁能源占比、降低电网损耗,并从2040年起对火力发电进行碳捕集与封存改造后,甘肃省能够在2022年前后实现“碳达峰”,CO2排放量峰值为1.75×10⁸ t。
-
利用“MEIC清单”(2017)和式(6)计算甘肃省CO2在不同市(州)排放的空间分配系数,并计算不改变甘肃省现有能源布局、产业布局的前提下,不同情景2025年、2030年和2060年甘肃省各市(州)的CO2排放量,见表2和图4。
在不改变甘肃省现有能源布局、产业布局的前提下,CO2排放最大的市(州)依次是兰州、嘉峪关、白银、平凉、酒泉和庆阳,其中兰州的CO2排放量远远超过其他市(州)占据了甘肃省CO2排放总量的20%。这些城市2020年的第二产业占比均超过了28%,其中嘉峪关、酒泉和庆阳的第二产业占比超过了40%,嘉峪关的第二产业占比更是超过了50%。虽然兰州市CO2排放量较高,但从图1(b)可知,其GRP远超其他市(州),2020年单位GRP CO2排放(1.49 tCO2/万元)远低于嘉峪关(7.78 tCO2/万元)、白银(5.65 tCO2/万元)、平凉(3.81 tCO2/万元)、酒泉(2.12 tCO2/万元)和庆阳(2.45 tCO2/万元),与兰州市相比,这些城市碳减排的潜力更大。
在节能发展情景即只调整能源消费总量的情景下,甘肃省不同市(州)CO2也可以实现在2033年左右达峰,但此情景对CO2的减排效果有限,2060年CO2排放量为CO2排放峰值的84.0%;而在清洁发展情景即在调整能源消费总量的基础上调整能源消费结构,在2030年左右即可产生一定的碳减排效果,到2060年这种减碳效果更加明显,2060年CO2排放量可以达到CO2排放峰值的50.5%;绿色发展情景对于减碳的效果最为显著,2060年CO2排放量可以达到CO2排放峰值的44.4%,2060年甘肃省人为CO2排放量仅为基准年2020年的55.6%左右,但这种情景需要依赖科学技术的发展和对落后生产工艺的淘汰改造,可能会在一定程度上影响甘肃省各市(州)的经济发展。因此,综合上述分析,本次研究认为,在这3种发展情景中,清洁发展情景是较为适合经济欠发达的甘肃省的发展路径。
-
(1)能源结构调整。甘肃省现有的能源结构仍然以化石燃料,尤其是煤炭为主,通过逐步提高非化石燃料占比,采用煤改气等措施优化现有的能源结构配比,能显著降低甘肃省未来CO2排放。
(2)可再生能源利用。甘肃省拥有丰富的风电和光电资源,在“碳中和”目标导向下,大力开发风电、光电资源,大力推进河西走廊清洁能源基地建设,提高新能源普及率,降低弃风、弃光率,通过实施降低绿电上网电价等措施倒逼新能源自身绿色发展,并提高可再生能源利用效率、建立风光电经济高效利用机制,促进甘肃省“碳达峰”“碳中和”目标实现。
(3)产业结构调整。甘肃省部分市(州)现有产业结构中第二产业仍占有较高比重,降低第二产业比重、提高第三产业占比,能够在能源结构调整的基础上进一步降低甘肃省CO2排放,但此举会在一定程度上降低甘肃省经济发展速度。
(4)淘汰落后工艺。随着科学技术发展逐步淘汰落后工艺、引进新工艺,能够提高能源利用效率并显著降低CO2排放。在甘肃省经济发展到一定程度后可逐步实行碳捕集与封存改造,此举可为甘肃省实现“碳中和”目标提供可能。
(5)区域协调发展。甘肃省部分市(州)经济过度依赖第二产业,如嘉峪关、白银、平凉、酒泉和庆阳,建议这些城市加强区域间,尤其是高耗能工业部门之间的协作,通过资金融合、技术共享等措施,提升区域整体节能减排效率、实现区域间协调发展。通过加强植树造林等措施增强甘肃省自然源的固碳、减碳作用,并协同林业部门进行甘肃省自然碳汇核算,更全面地对甘肃省“碳中和”目标加以阐释。
基于能源结构的甘肃省CO2排放现状及碳达峰情景研究
The status quo of CO2 emissions and carbon peaking scenarios in Gansu Province based on energy structure
-
摘要: 在力争实现“双碳”目标的大背景下,如何制定合适的减排路径才能较好地实现甘肃省“碳达峰”目标,成为当前亟须考虑的问题。基于2008—2017年的MEIC清单,考虑不同能源的利用效率及排放特征,对IPAT等式进行本地化修正,计算了2005—2020年甘肃省的CO2排放量,并设计3种情景,研究了不同发展路径下甘肃省CO2的排放情况。研究发现,2005—2020年甘肃省CO2排放量呈现波动上升趋势,且煤炭对于CO2排放的贡献最大、天然气贡献最小,石油和电力的CO2排放贡献则在逐年升高;甘肃省CO2排放最大的市(州)依次是兰州、嘉峪关、白银,在现有发展空间布局下嘉峪关、白银、平凉碳减排的潜力更大;在3种发展情景中,清洁发展情景是较为适合经济欠发达的甘肃省的发展路径,此情景下全省可在2028年左右实现达峰,峰值排放量1.87亿吨,2060年CO2排放量为峰值的50.5%。Abstract: In the context of striving to achieve the “carbon neutrality” and “emission peak” goals, formulating a suitable emission reduction path to effectively achieve the goal of "carbon peak" in Gansu Province has become an urgent issue to be considered. Based on the MEIC inventory from 2008 to 2017 and considering the utilization efficiency and emission characteristics of different energy sources, the IPAT equation was localized and modified. The CO2 emissions of Gansu Province from 2005 to 2020 were calculated, and 3 scenarios were designed to study the CO2 emissions under different development paths in Gansu Province. The results showed that from 2005 to 2020, the CO2 emissions in Gansu Province showed a fluctuating upward trend, with the coal contributing the most of CO2 emissions and the natural gas contributing the least, and the CO2 emissions of oil and electricity increased year by year. The cities with the highest CO2 emissions in Gansu Province were Lanzhou, Jiayuguan, and Baiyin. Under the existing development space layout, Jiayuguan, Baiyin, and Pingliang had a greater potential for carbon emission reduction. Among the 3 development scenarios, the clean development scenario was more suitable as a development path for the economically less-derdevelopedGansu Province. Under this scenario, Gansu province could achieve its "carbon peak" around 2028, with a peak emission of 187 million tons, and CO2 emissions in 2060 would be 50.5% of the peak.
-
Key words:
- Gansu Province /
- energy structure /
- modified IPAT equation /
- emission peak scenario study
-
己烯雌酚(DES)是一种典型的人工合成非甾体类雌激素, 是环境水体中常被检出的内分泌干扰物之一[1 − 2]. 由于对胎儿生殖器官的致畸作用和可能导致肿瘤[3],己烯雌酚已被禁止用于孕期妇女,但是在临床中仍是治疗雌激素分泌不足所导致的妇科疾病及乳腺癌的药物之一[4]. 随着生活及养殖废水的排放,己烯雌酚最终会进入环境水体,并可能污染饮用水水源. 例如,在我国某些饮用水水源或环境水体中,仍可以检出一定浓度(≤ 2.52 ng·L−1)的己烯雌酚[2,5]. 己烯雌酚常用的检测方法有气相色谱-质谱法、液相色谱-质谱法、酶联免疫吸附法(ELISA)等[6]. 但这些方法或需要利用价格高昂的仪器,对试验人员的专业技术手段要求较高,或耗时较长,无法用于对己烯雌酚的现场快速检测.
胶体金免疫层析检测试纸由于具有简单、快速、易于解读的优势而在临床检测[7]、动物疫病[8]、食品安全[9]、环境监测[10]等领域得到广泛应用,是一种适用于现场快速检测的技术. 该技术的原理是基于目标物与由胶体金标记的抗体或抗原相互作用,在固定有用于捕获抗体或抗原的反应区和控制区,通过目视或使用读取装置读取测试结果[11]. 利用胶体金免疫层析试纸获取目标物含量信息的方式主要有以下三种. 最常见的一种方式是根据检测线(T线)出现与否判断目标物是否超过一定浓度. 在环境检测或食品安全检测中常用来判定目标物含量是否超标,是一种定性检测方式;第二种类型,检测线上包被的反应物设计成只能结合一定量的分析物,过量的分析物会与下一条检测线结合,产生一个条带梯度[12];第三种是用特定仪器读取检测卡显色情况,并将显色情况转换为数字信号达到定量的目的[13].
研究发现[14],利用传统方法制备的己烯雌酚胶体金免疫层析检测卡受温度、湿度影响很大,不适于野外现场检测. 为克服这一问题,我们在金标垫上增加偶联IgY的胶体金做为第二金标物,在NC膜上包被3种不同浓度的羊抗IgY作为参考线,在检测反应中这3条参考线的颜色分别对应3个DES的浓度,通过检测线与3条参考线的颜色对比实现对样品中的DES残留所处浓度区间的确定. 这种体系使得检测线反应和参考线反应处于相同的反应条件,使其很大程度不受环境干扰,通过半定量参考线与检测线的结合,实现了不依赖检测仪器的己烯雌酚可视化检测. 本文研究并验证了基于半定量参考线方法对水中己烯雌酚残留进行现场检测的可行性.
1. 材料与方法(Materials and methods)
1.1 试剂与仪器
己烯雌酚单克隆抗体、DES-BSA购于广东优抗多生物技术有限公司,羊抗鼠抗体、牛血清白蛋白(BSA)购自杭州索莱尔博奥生物技术有限公司,鸡免疫球蛋白IgY、羊抗IgY购自洛阳佰奥通实验材料中心,己烯雌酚、Tween-20购自Merck公司(德国),氯金酸购自于国药集团化学试剂有限公司. 硝酸纤维素膜(VIVID170)购自美国PALL公司. 玻璃纤维膜、PVC底板、吸水纸购于上海金标生物科技有限公司. 己烯雌酚ELISA检测试剂盒购自北京普赞生物技术有限公司.
喷金划膜仪购自上海捷宁生物技术有限公司,可编程切条机(HGS201)购于杭州峰航科技有限公司.
1.2 免疫胶体金的制备
胶体金的制备参考Sun等报道的方法[15]. 主要步骤如下:将2 mL氯金酸溶液(1%,W/V)加入到100 mL超纯水中,加热使溶液沸腾. 然后,在不断搅拌下加入1.3 mL柠檬酸钠溶液(2%,W/V). 待溶液颜色变为酒红色后,继续保持沸腾10 min. 然后,停止搅拌及加热,待溶液冷却至室温后加入超纯水将溶液体积补足至100 mL. 4 ℃冰箱中储存待用. 制备的胶体金平均粒径为30 nm. 分别将DES单克隆抗体和IgY标记在胶体金上,方法简述如下:用0.1 mol·L−1的K2CO3将胶体金溶液调节至最适pH值,加入计算好的最适稳定量的蛋白质,轻摇混匀1 min,静置30 min. 用10% BSA溶液(pH7.2)封闭30 min后,将离心管于4 ℃、
12000 r·min−1离心30 min;弃去上清液. 用 1% BSA(pH7.2)溶液洗涤沉淀,于4 ℃、12000 r·min−1离心30 min;弃去上清液. 加入100 μL胶体金复溶液(10 mmol·L−1磷酸盐缓冲液、pH 7.2、含1% BSA、10%蔗糖、5%海藻糖、0.05%叠氮钠)复溶沉淀.1.3 最适DES-BSA包被浓度的优化
用喷金划膜仪以3 μL·cm−1的速度,将上一步制备的标记了DES单抗的胶体金结合物溶液喷到玻璃纤维素膜上,37 °C烘干24 h,制成DES金标结合物垫. 用喷金划膜仪,以0.8 μL·cm−1的速度,将一系列不同浓度的DES-BSA溶液(0.2、0.4、0.6、0.8 mg·mL−1)和羊抗鼠IgG溶液(0.5 mg·mL−1)划在NC膜上,37 °C烘干24 h;将玻璃纤维膜在样品垫处理液(20 mmol·L−1磷酸盐缓冲液,pH7.2,含1% Tween-20,1% BSA)中浸泡5s,取出后,37 °C烘干24 h,制成样品垫. 按照图1a所示组装己烯雌酚试纸条,分别将80 μL浓度为0、10、20、40 ng·mL−1 的DES溶液滴加到试纸条的样品垫上,反应5min后,目视观察,并利用ImageJ对试纸条的T线和C线灰度值进行分析. 以T线对不同浓度DES的显色区分度选择最适DES-BSA包被浓度.
 图 1 胶体金试纸条示意图Figure 1. Schematic diagram of colloidal gold test stripa 常规免疫层析试纸组成示意图;b 基于“动态比色卡”的免疫层析试纸组成示意图a. schematic diagram of the composition of conventional immunochromatographic test strip; b. schematic diagram of the composition of immunochromatography test strip based on the "dynamic colorimetric card".
1.4 羊抗IgY最适包被浓度的优化
用喷金划膜仪以3 μL·cm−1的速度,将上一步制备的标记了IgY的胶体金结合物溶液喷到玻璃纤维素膜上,37 °C烘干24 h,制成IgY金标结合物垫. 用喷金划膜仪,以0.8 μL·cm−1的速度,将优化浓度的DES-BSA溶液划到NC膜T线位置. 将不同浓度羊抗IgY溶液(0.1、0.2、0.3、0.4 mg·mL−1)划在NC膜C线位置,37 °C烘干24 h;然后按照样品垫、DES金标垫、IgY金标垫、NC膜、吸水纸的顺序组装检测试纸,考察试纸对浓度为0、5、10、20、40 ng·mL−1 DES溶液的响应,目视观察,分别考察在DES浓度为5、10、20 ng·mL−1时T线与C线显色相近的羊抗IgY包被浓度. 如图1b所示,将选出的3个浓度的羊抗IgY按浓度由低到高顺序,依次包被到NC膜上,制备图1b所示检测试纸,并用ImageJ分析试纸对不同上述浓度DES的显色情况,根据分析结果对参考线浓度进行微调,直到阴性条件下该区间中3条半定量参考线中最深显色不超过T线显色,并且3条半定量参考线由低到高分别与5、10、20 ng·mL−1时T线显色相近.
1.5 检测卡的组装
将样品垫、金标垫、硝酸纤维素膜和吸水纸依次贴在底板上,彼此间以搭接方式连接(如图1),用切条机切成4 mm宽试纸条,装入塑料卡壳,加干燥剂密封保存.
1.6 温度、湿度对检测结果的影响
为研究温度对试纸条检测结果的影响,在实验室用空调将实验室温度分别调节至16、25 °C,实验期间室内湿度为30%—35%. 在恒温恒湿箱中将温度调为35 °C、湿度35%. 将试纸放在上述环境中平衡30 min后,考察其对不同浓度DES的响应.
为研究湿度对试纸条检测结果的影响,分别将试纸条放在实验室内(温度25 °C、湿度30%—35%)以及恒温恒湿箱中(温度25 °C、湿度55%)平衡及反应,考察其对不同浓度DES的响应.
1.7 地表水中DES的检测及验证
在山东省王屋水库黄水河入库口、水库中心、大坝位置取3个水样,经0.45 μm滤膜过滤后,分别用本文制备的检测卡及市售的己烯雌酚酶联免疫试剂盒检测水样中己烯雌酚的含量. 在不含己烯雌酚的水样中添加5、10、20 ng·mL−1的己烯雌酚,分别用本文制备的检测卡及己烯雌酚ELISA试剂盒检测,比较二者的检测结果.
2. 结果与讨论 (Results and discussion)
2.1 DES单克隆抗体的标记浓度及DES-BSA包被浓度的优化
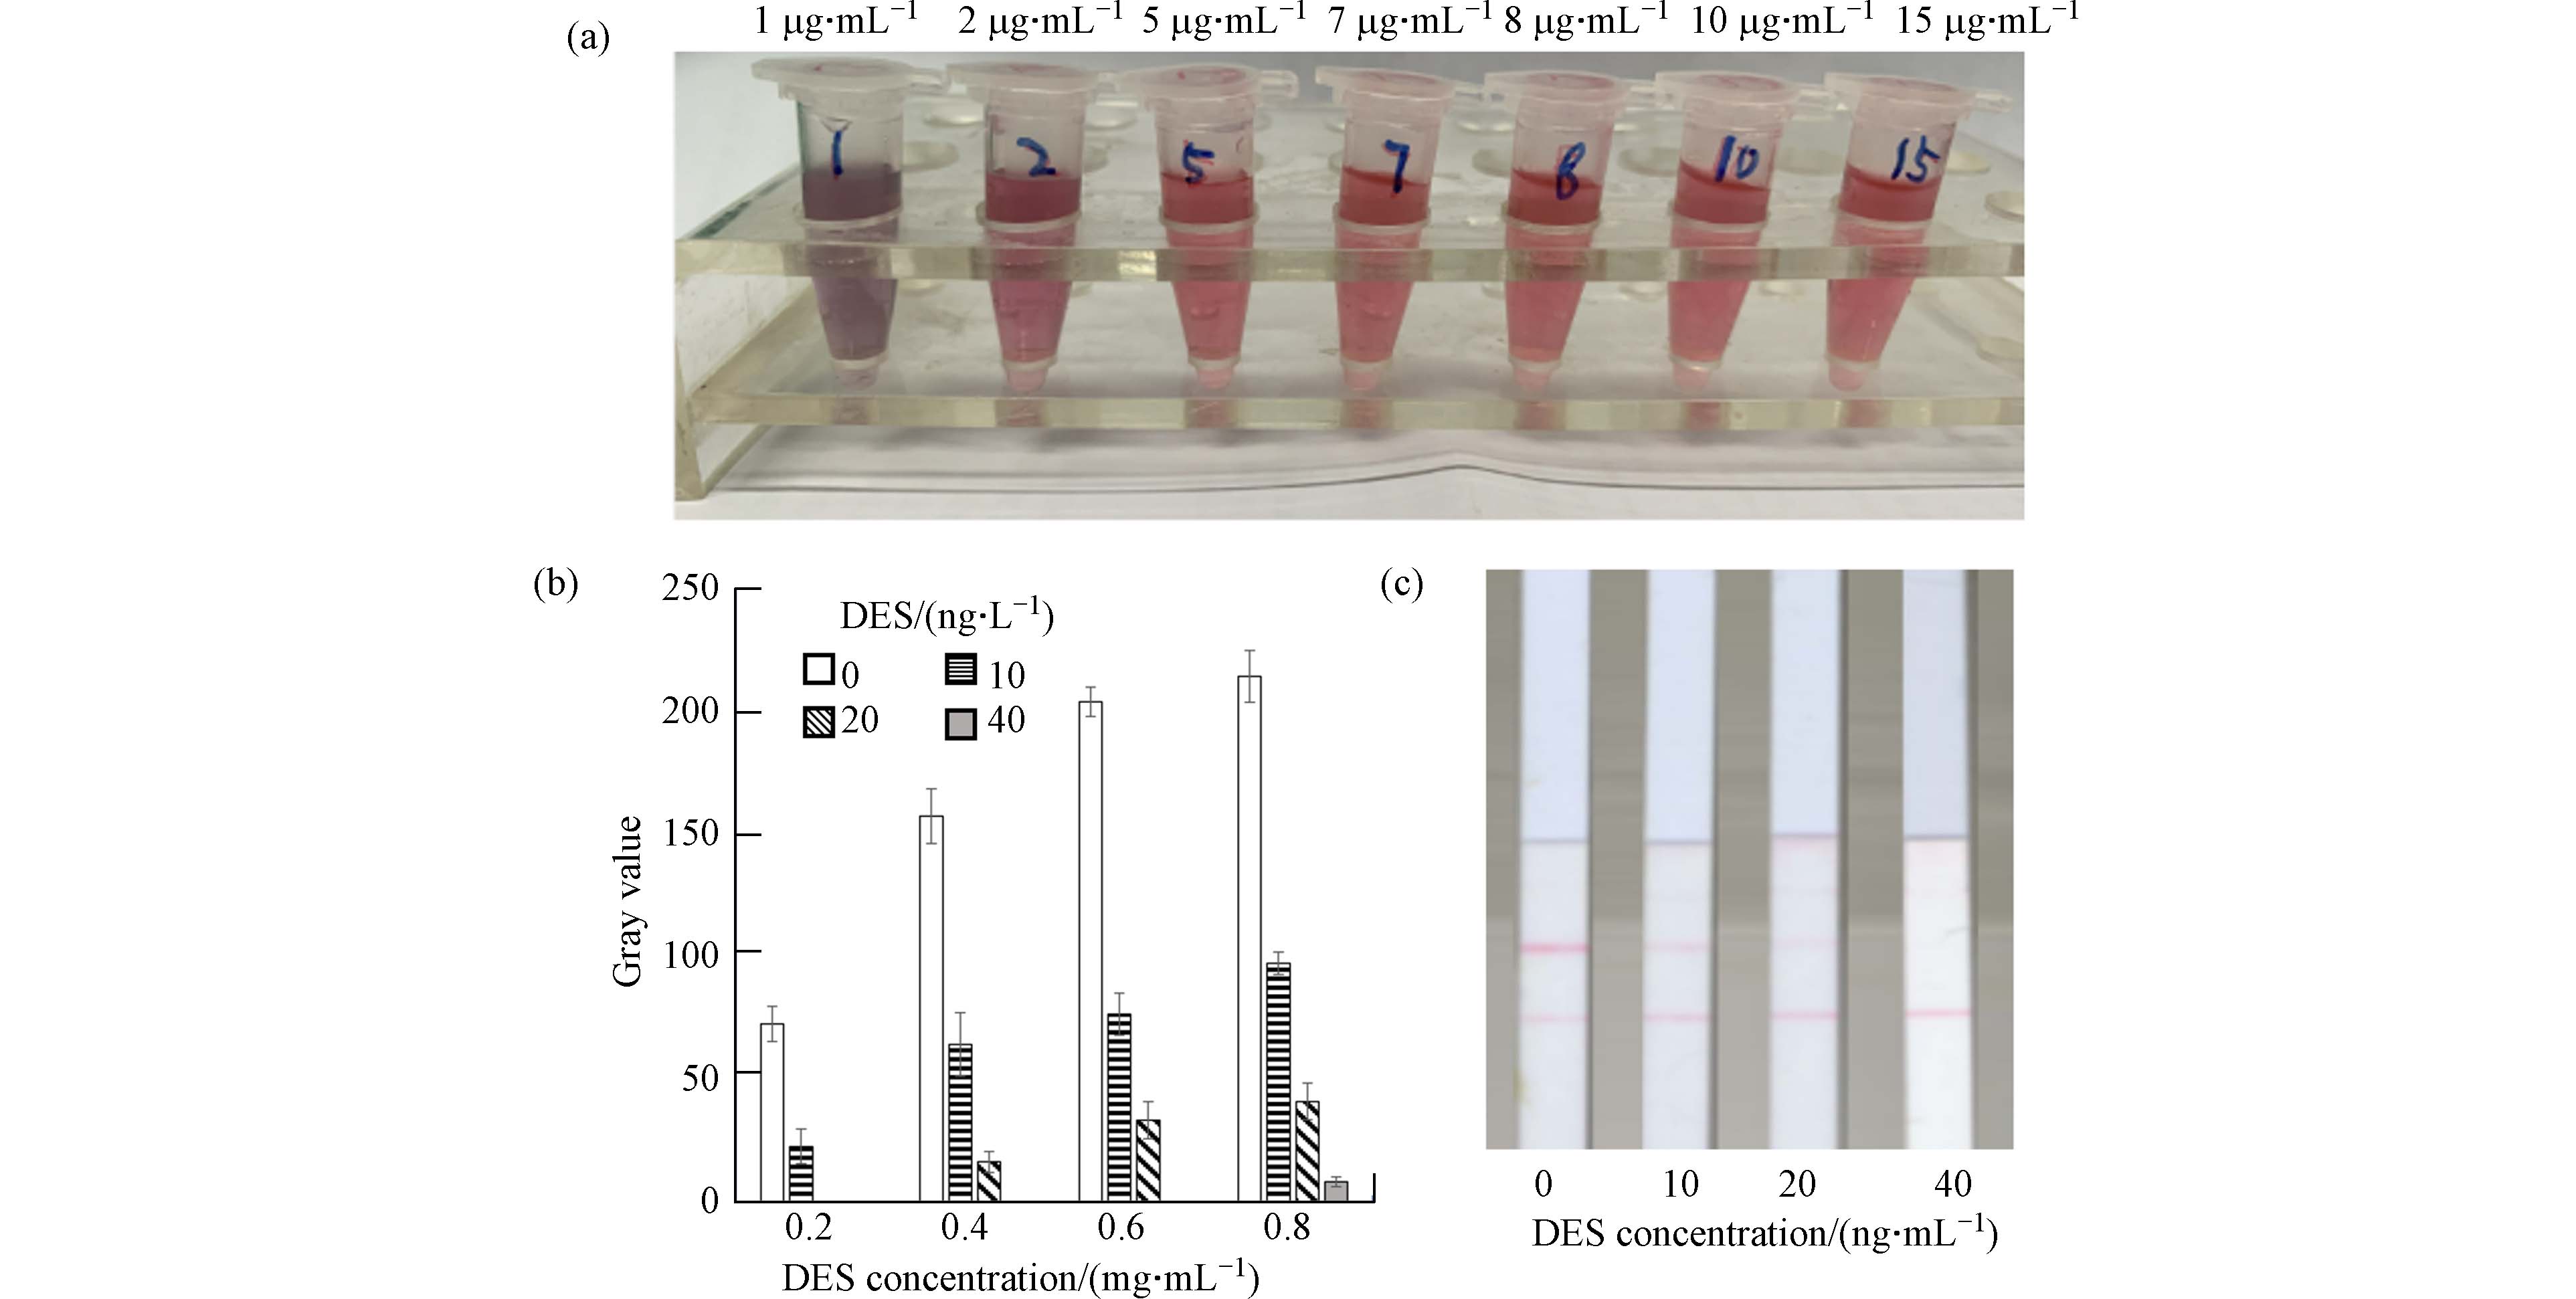
首先对DES单克隆抗体在胶体金上的标记浓度进行了优化. 由图2a可见,当DES单克隆抗体的标记浓度为5 μg·mL−1胶体金及以上时,向胶体金中加入饱和NaCl不会导致胶体金颜色的变化,提示5 μg·mL−1胶体金为DES抗体的稳定标记浓度. 为保证DES抗体对胶体金的充分结合,在此标记浓度基础上增加20%,即6 μg·mL−1胶体金作为DES单克隆抗体的标记浓度. 图2b是以不同浓度DES-BSA包被NC膜得到的检测试纸T线在不同浓度DES下的显色,可以看到,随DES-BSA浓度增加,T线显色呈加深的趋势. 由于DES-BSA浓度为0.6 mg·mL−1时对阴性样本显色较深(灰度值>200),且在40 ng·mL−1DES样本完全消线,所以将其作为最优DES-BSA包被浓度.
 图 2 DES单克隆抗体的标记浓度及DES-BSA包被浓度的优化Figure 2. Optimization of DES monoclonal antibody labeling concentration and DES-BSA coating concentrationa.加入饱和NaCl后不同浓度DES单抗标记的胶体金颜色变化;b.检测试纸T线在不同浓度DES时的灰度值;c.检测试纸对不同浓度DES的显色效果a. The color changes of colloidal gold labeled with DES monoclonal antibodies at different concentrations after adding saturated NaCl; b. The gray values of the T-line of the test strip at different concentrations of DES; c. The images of the test paper on different concentrations of DES.
2.2 IgY标金浓度及羊抗IgY包被浓度的优化
首先用” 2.1”所述的方法优化出IgY的标金浓度为5 μg·mL−1胶体金. 然后,按照”1.4”所述方法,确定了3条定量参考线的羊抗IgY包被浓度在0.1、0.2、0.3 mg·mL−1附近,然后经进一步微调,最终确定3条定量参考线(C1、C2、C3)的羊抗IgY包被浓度依次为0.1、0.17、0.25 mg·mL−1.
在优化条件下制备的试纸条如图3a所示,目视观察可以看到,当样品中不含DES或DES含量低于5 ng·mL−1时,T线显色比三条定量参考线深,当DES浓度为5、10、20 ng·mL−1时,T线显色分别与C3、C2、C1相近,当样品中DES含量大于20 ng·mL−1时,T线显色比C1浅. 利用ImageJ软件对试纸进行分析,可以看到当DES浓度为5、10、20 ng·mL−1时,T线灰度值分别与C3、C2、C1的灰度值相近(图3b). 因此试纸条对DES残留的半定量检测区间为≤5、5—10、10—20、≥20 ng·mL−1.
 图 3 DES半定量检测试纸Figure 3. DES semi-quantitative detection test strip.a.不同DES浓度时试纸的显色. b.对各试纸条的ImageJ分析,峰高对应T线或C线的灰度值.a. The images of the test strip at different DES concentrations. b. Plotting of the gray value spectrum of the strip image by ImageJ, and the peak height corresponds to the gray value of the T line or C line.
2.3 温度与湿度对DES半定量试纸检测结果的影响
首先考察了16、25、35°C 3个温度对DES半定量试纸检测结果的影响,结果如图4所示. 由图4可见,随环境温度升高,试纸条的显色逐渐加深,尤其在16°C和25°C之间显色变化最为显著,这可能是温度影响了抗体与抗原的免疫反应速度所导致的.
考察了35%和55%两个湿度条件对DES试纸检测的影响,实验温度为25°C. 结果显示,在高湿度条件下,DES的显色显著低于低湿度条件. 图4和图5的结果说明,如果采用固定色卡与T线显色做对比来进行半定量测定会产生很大的偏差. 温度、湿度会显著影响胶体金的释放速度及在NC膜上的扩散速度,并且温度还会影响抗体与抗原的分子热运动进而影响免疫反应速度,所以不同温湿度下,胶体金免疫层析试纸上T、C线的显色速度会受到较大影响. 而由于金标DES抗体和DES-BSA反应体系以及组成“动态色卡”体系的金标IgY与羊抗IgY反应体系是在同一条检测试纸上受到相同的温湿度的影响,因此,T线和参考线的显色速度变化趋势则是基本相同的. 本实验结果证明了在检测试纸上集成“动态色卡”这种设计的可行性,它有助于消除温湿度变化对于胶体金侧向流免疫层析试纸显色结果判定的不利影响,从而提高目视检测的准确度.
2.4 地表水中DES的检测及验证
分别用本文制备的DES检测卡及市售的DES酶联免疫试剂盒(检测限为0.1 ng·mL−1)检测了山东省王屋水库采集的3个水样,均未检出己烯雌酚. 在水库中心水样中添加了己烯雌酚,使其终浓度分别为5、10、20 ng·mL−1,然后分别用本文制备的检测卡及己烯雌酚ELISA试剂盒对加标样品进行了检测,二者的检测结果如表1所示. 结果表明本研究所制备的DES检测卡对加标水样的检测结果与市售ELISA试剂盒的实测结果一致.
表 1 DES半定量检测试纸和ELISA检测试剂盒对实际样品的检测结果Table 1. The detection results of DES semi-quantitative test strip and ELISA kit on actual samples采样位置Sample collection site 加标浓度/ (ng·mL−1) Spiked concentration 试纸检测值/ (ng·mL−1)Results from test strip ELISA试剂盒检测值/ (ng·mL−1)Results from ELISA kit 黄水河入库口Reservoir mouth — ND* ND 水库中心Reservoir center — ND ND 5 ≤5 4.18 10 5-10 8.49 20 10-20 17.30 水库大坝Reservoir Dam — ND ND *ND., 未检出. ND., not detected. 3. 结论(Conclusion)
本研究通过将不同浓度的羊抗IgY包被在NC膜上,与金标IgY结合,在DES检测试纸上构建了一个独立于检测线免疫反应的“动态色卡”,由于受相同温湿度的影响,色卡的半定量参考线在不同温度和湿度下的显色与DES检测线基本一致,因此可以在不同温度和湿度的环境中实现对DES的半定量检测. 制备的试纸条对DES残留的半定量检测区间为≤5 ng·mL−1;5—10 ng·mL−1,10—20 ng·mL−1,≥20 ng·mL−1,对地表水样品中DES的目视半定量检测结果与ELISA试剂盒检测结果一致. 本研究克服了传统免疫层析试纸条的检测结果易受环境温湿度等因素影响的缺点,能够在野外环境中实现对己烯雌酚的现场检测. 同时,由于组成“动态色卡”的反应体系独立于DES的反应体系,本研究所提出的“动态色卡”设计思路可以应用于其它抗原的免疫层析试纸检测,在环境监测、体外诊断、食品安全等对现场快速检测有较大需求的领域有可观的应用前景.
-
表 1 甘肃省“碳达峰”不同情景设计
Table 1. Different scenarios designs of “emission peak” in Gansu Province
一级情景 二级情景 情景描述 情景支撑 基准情景 未采取任何节能减排措施 甘肃省能源结构、产业结构、电力结构均冻结在2020年 2015—2020年能源消费总量平均年均增加 甘肃省能源消费总量年均增长1.63% 节能发展 能源结构调整 甘肃省能源结构、产业结构、电力结构均冻结在2020年 2021—2025年化石能源年均增长1.63%2026—2030年化石能源年均增长1.45%2031—2050年化石能源年均降低0.5%2051—2060年化石能源年均降低0.8% [35] 清洁发展 能源结构调整 2021—2025年化石能源年均增长1.63%2026—2030年化石能源年均增长1.45%2031—2050年化石能源年均降低0.5%2051—2060年化石能源年均降低0.8% [35] 2021—2030年:煤炭消费量年均下降2.1%,石油、天然气消费年均增长0.8%、4% 2031—2050年:煤炭、石油消费量年均下降0.22%、0.17%,天然气消费量在2031—2040年年均增长10.44%,之后年均降低10.58% 2051—2060年:煤炭、石油、天然气消费量年均下降6.37%、7.20%、10.58% 电力结构低碳化 风电、光电等清洁能源年均使用率提高1% [13] 绿色发展 能源结构调整 2021—2025年化石能源年均增长1.63%2026—2030年化石能源年均增长1.45%2031—2050年化石能源年均降低0.5%2051—2060年化石能源年均降低0.8% [35] 2021—2030年:煤炭消费量年均下降3%,石油、天然气消费年均增长0.4%、2% 2031—2050年:煤炭、石油消费量年均下降0.25%、0.2%,天然气消费量在2031—2040年年均增长5.22%,之后年均降低12% 2051—2060年:煤炭、石油、天然气消费量年均下降6.37%、7.20%、10.58% 产业结构调整 服务业年均就业率提高3% [13,36] 能源效率提升 能源利用效率提升1% [13] 电力结构低碳化 风电、光电等清洁能源年均使用率提高1.5% [13] 电网输送损失降低1% [13] 从2040年起燃煤电厂逐步实行碳捕集与封存改造,年均改造率增加10% [37] 表 2 不同情景下甘肃省各市(州)CO2排放量预测
Table 2. CO2 emissions forecasting of cities in Gansu Province under different scenarios
107 tCO2 市(州) 分配系数 节能发展 清洁发展 绿色发展 2025 a 2030 a 2060 a 2025 a 2030 a 2060 a 2025 a 2030 a 2060 a 兰州 0.234 4.696 4.838 4.229 4.272 4.287 2.211 4.117 4.019 1.819 嘉峪关 0.119 2.383 2.454 2.146 2.167 2.175 1.122 2.089 2.039 0.923 白银 0.110 2.216 2.283 1.995 2.015 2.022 1.043 1.942 1.896 0.858 平凉 0.103 2.060 2.122 1.855 1.874 1.881 0.970 1.806 1.763 0.798 酒泉 0.077 1.549 1.596 1.395 1.409 1.414 0.729 1.358 1.326 0.600 庆阳 0.070 1.399 1.441 1.260 1.272 1.277 0.659 1.226 1.197 0.542 天水 0.062 1.236 1.273 1.113 1.124 1.128 0.582 1.083 1.057 0.479 金昌 0.050 0.999 1.029 0.900 0.909 0.912 0.470 0.876 0.855 0.387 武威 0.040 0.797 0.821 0.718 0.725 0.728 0.375 0.699 0.682 0.309 张掖 0.039 0.790 0.814 0.711 0.718 0.721 0.372 0.693 0.676 0.306 陇南 0.032 0.646 0.665 0.582 0.587 0.589 0.304 0.566 0.553 0.250 定西 0.031 0.631 0.650 0.568 0.574 0.576 0.297 0.553 0.540 0.244 临夏 0.022 0.437 0.450 0.394 0.398 0.399 0.206 0.383 0.374 0.169 甘南 0.011 0.219 0.226 0.197 0.199 0.200 0.103 0.192 0.188 0.085 合计 1 20.057 20.663 18.063 18.244 18.308 9.444 17.584 17.164 7.770 -
[1] IPCC, 2018. Special report on global warming of 1.5°C[R]. UK: Cambridge University Press, 2018. [2] 王兆夺, 祝超伟, 于东生. 全球气候变化背景下对“温室效应”的思考[J]. 辽宁师范大学学报(自然科学版), 2017, 40(3): 407 − 414. [3] MIKHAYLOV A, MOISEEV N, ALESHIN K, et al. Global climate change and greenhouse effect[J]. Entrepreneurship and sustainability issues, 2020, 7(4): 2897 − 2913. doi: 10.9770/jesi.2020.7.4(21) [4] 胡海超. 《京都议定书》与应对气候变化的国际博弈研究[D]. 兰州: 西北师范大学, 2013. [5] 丁治平. 《京都议定书》下温室气体减排机制研究[D]. 上海: 华东政法大学, 2008. [6] ARROW K. Global climate change: A challenge to policy[J]. The economists’ voice, 2007, 4(3): 1 − 5. [7] ZHAO Q . A review of pathways to carbon neutrality from renewable energy and carbon capture[J]. E3S web of conferences, 2021, 245(1–4): 01018. [8] GAO Y. China's response to climate change issues after Paris Climate Change Conference[J]. Advances in climate change research, 2016, 7(4): 235 − 240. doi: 10.1016/j.accre.2016.10.001 [9] 唐雯, 柴洪, 谈存峰. 甘肃省产业结构与能源消费关系研究——基于VAR模型[J]. 中国能源, 2021, 43(5): 73 − 80. doi: 10.3969/j.issn.1003-2355.2021.05.011 [10] 卢昌彩. 绿色革命与国际合作的范式: “碳达峰、碳中和”与“一带一路”双赢选择[J]. 决策咨询, 2022(1): 76 − 82. doi: 10.3969/j.issn.1006-3404.2022.01.021 [11] 闫新杰, 孙慧. 基于STIRPAT模型的新疆“碳达峰”预测与实现路径研究[J]. 新疆大学学报(自然科学版)(中英文), 2022, 39(2): 206 − 212. [12] 关敏捷, 袁艳红, 冉木希, 等. 基于STIRPAT模型的山西省能源碳排放影响因素及峰值预测[J]. 中国煤炭, 2021, 47(9): 48 − 55. doi: 10.3969/j.issn.1006-530X.2021.09.007 [13] 宋鹏, 张慧敏, 毛显强. 面向碳达峰目标的重庆市碳减排路径[J]. 中国环境科学, 2022, 42(3): 1446 − 1455. doi: 10.3969/j.issn.1000-6923.2022.03.051 [14] 席细平, 谢运生, 王贺礼, 等. 基于IPAT模型的江西省碳排放峰值预测研究[J]. 江西科学, 2014, 32(6): 768 − 772. doi: 10.13990/j.issn1001-3679.2014.06.005 [15] 聂锐, 张涛, 王迪. 基于IPAT模型的江苏省能源消费与碳排放情景研究[J]. 自然资源学报, 2010, 25(9): 1557 − 1564. doi: 10.11849/zrzyxb.2010.09.015 [16] 芦颖, 李旭东, 杨正业. 贵州省能源碳排放现状及峰值预测[J]. 环境科学与技术, 2018, 41(11): 173 − 180. doi: 10.19672/j.cnki.1003-6504.2018.11.028 [17] 郑松华. 基于随机前沿模型的中国西部地区碳排放效率评价研究[J]. 柴达木开发研究, 2014(1): 37 − 39. doi: 10.3969/j.issn.1005-6718.2014.01.012 [18] 董棒棒, 李莉, 唐洪松, 等. 环境规制、FDI与能源消费碳排放峰值预测——以西北五省为例[J]. 干旱区地理, 2019, 42(3): 689 − 697. [19] QIANG L, GU A, FEI T, et al. Peaking China's CO2 emissions: trends to 2030 and mitigation potential[J]. Energies, 2017, 10(2): 209. doi: 10.3390/en10020209 [20] GREEN F, STERN N. China's changing economy: implications for its carbon dioxide emissions[J]. Climate policy, 2017, 17(1-4): 423 − 442. [21] 焦文献, 陈兴鹏. 基于IPAT等式的甘肃省能源消费碳排放特征分析及情景预测[J]. 干旱区资源与环境, 2012, 26(10): 180 − 184. doi: 10.13448/j.cnki.jalre.2012.10.020 [22] 闫楷若. 甘肃省能源消费结构研究——基于动态偏离份额模型[J]. 甘肃科学学报, 2015, 27(4): 114 − 117. doi: 10.16468/j.cnki.issn1004-0366.2015.04.025 [23] 钱娇. 甘肃省服务业发展碳排放变动及影响因素分析[D]. 兰州: 西北师范大学, 2015. [24] DANISH, ZCAN B, ULUCAK R. An empirical investigation of nuclear energy consumption and carbon dioxide (CO2) emission in India: Bridging IPAT and EKC hypotheses[J]. Nuclear engineering and technology, 2020, 53(6): 2056 − 2065. [25] CHONTANAWAT J. Decomposition analysis of CO2 emission in ASEAN: An extended IPAT model[J]. Energy procedia, 2018, 153: 186 − 190. doi: 10.1016/j.egypro.2018.10.057 [26] HWANG Y, UM J, SCHLUTER S. Evaluating the mutual relationship between IPAT/Kaya identity index and ODIAC-based GOSAT fossil-fuel CO2 flux: Potential and constraints in utilizing decomposed variables[J]. International journal of environmental research and public health, 2020, 17(16): 5976. doi: 10.3390/ijerph17165976 [27] KASHEM M, RAHMAN M. CO2 emissions and development indicators: a causality analysis for Bangladesh[J]. Environmental processes, 2019, 6(2): 433 − 455. doi: 10.1007/s40710-019-00365-y [28] EHRLICH P, HOLDREN J. Impact of population growth[J]. Science, 1971, 171(3977): 1212 − 1217. doi: 10.1126/science.171.3977.1212 [29] LI M, LIU H, GENG G, et al. Anthropogenic emission inventories in China: a review[J]. National science review, 2017, 4(6): 834 − 866. doi: 10.1093/nsr/nwx150 [30] ZHENG B, TONG D, LI M, et al. Trends in China’s anthropogenic emissions since 2010 as the consequence of clean air actions[J]. Atmospheric chemistry and physics, 2018, 18: 14095 − 14111. doi: 10.5194/acp-18-14095-2018 [31] IPCC. 2006 IPCC Guidelines for National Greenhouse Gas Inventory [R]. UK: Cambridge University Press, 2006. [32] IPCC. 2019 Refinement to the 2006 IPCC Guidelines for National Greenhouse Gas Inventory [R]. UK: Cambridge University Press, 2019. [33] 国家统计局工业交通统计司. 中国能源统计年鉴[M]. 北京: 中国统计出版社, 2001. [34] 朱智文, 张娟娟. 甘肃省能源消费、产业结构和经济增长的关系[J]. 开发研究, 2015(1): 84 − 88. doi: 10.13483/j.cnki.kfyj.2015.01.020 [35] 王陆新, 王越, 王永臻. 碳达峰碳中和背景下我国能源发展多情景研究[J]. 石油科技论坛, 2022, 41(1): 78 − 86. doi: 10.3969/j.issn.1002-302x.2022.01.010 [36] 刘飞, 关键, 祁志福, 等. 燃煤电厂碳捕集、利用与封存技术路线选择[J]. 华中科技大学学报(自然科学版), 2022, 50(7): 1 − 13. [37] LI R, WANG Q, LIU Y, et al. Per-capita carbon emissions in 147 countries: The effect of economic, energy, social, and trade structural changes[J]. Sustainable production and consumption, 2021, 7(27): 1149 − 1164. -


 下载:
下载:


