-
水资源是人类赖以生存的必需品和维持经济发展的命脉[1]。流经城镇的河段会因接纳沿岸较为密集的生活、工业、农牧业等污染源,若产生的污染负荷超过水体自净能力将对水生态造成冲击,影响其为沿岸居民提供观赏休憩的功能。河流水体有机物污染是河流综合治理的关键,对河流有机物进行溯源有助于定位污染源头,可有针对性地采取有效的治理措施。因此,为保障水安全、推动经济社会高质量发展、保持稳生态稳定,对河流污染物进行溯源具有重要意义。
可溶性有机物(dissolved organic matter,DOM)是由多种有机物组成的一种复杂混合物,包含单分子和小分子物质(氨基酸、单糖、低分子量有机酸等)和高分子量物质(腐殖物质、蛋白质、多糖等),表现出高度多样性,常被用来评估水质和预测潜在污染[2]。DOM普遍存在于自然水体和废水中,即使是经过深度处理的工业废水仍残留大量DOM。水生生态系统中的DOM来源分为内源(原位水生植物、浮游植物和微生物的生产和分解等)和外源(污水、降水、径流等)[3]。人类活动导致DOM的外源输入显著增加[4]。而不同来源的DOM的化学成分和生物有效性可能存在较大差异[5]。
常规的水质指标如化学需氧量(COD)、生化需氧量(BOD)和总有机碳(TOC)能反映水体有机污染物的总量,但无法表示有机物质结构组成[6]。傅立叶红外变换光谱(FTIR)、气相-质谱联用(GC-MS)、高效液相色谱 (HPLC) 等技术能表征有机物的结构,但通常需要耗费时力对样品进行提取和纯化[3,7]。三维荧光光谱(3D-EEM)技术可用以研究水生环境中DOM的有色和荧光组分,能获得水质样品中DOM荧光团数量、性质和丰度信息,具有快速、灵敏度高、无损样品、成本低等优点。结合平行因子分析(PARAFAC),还可科学地识别水体中相互干扰与叠加的DOM,促进了3D-EEM在DOM结构分析中的应用[8]。
水体3D-EEM的图谱形状、荧光峰位置、荧光峰强度、荧光峰个数信息及荧光参数可以作为荧光特征被用于污染源追溯。TANG等[9]运用三维荧光结合平行因子法(EEM-PARAFAC)分析城市流域和城市周边流域的DOM组成,揭示了流域之间独特的DOM组成归因于不同的人类活动。WANG等[10]运用EEM-PARAFAC对太湖水体中污染物进行溯源,识别出的荧光组分与纺织废水、农业活动和生活废水高度相关,从而发现研究区域受到多种污染源影响。宋庆斌等[11]利用EEM-PARAFAC快速有效地识别出东海区域中有色溶解性有机质(CDOM)的来源,研究结果说明了长江冲淡水等陆源输入对CDOM的显著影响。
本研究拟采用三维荧光及平行因子分析对南昌市某河流进行研究,以期了解水体中DOM的荧光光谱特征,分析水体DOM荧光物质组分组成、类型及对污染物的指征特性,并通过分析不同DOM成分的相对贡献和荧光特征参数对水体DOM溯源,进而诊断该河流存在的主要问题,为城市内地表水的生态环境改善和保护提供参考。
-
南昌市某河全长约6.5 km,其中主河道约5.3 km,西侧支流约1.2 km,平均水深1~2 m,平均河宽40~50 m,平均流量20 m3·s−1。两岸分布有各类食品、饲料、建材、电子产品类工厂。本研究沿河每隔200~300 m设置1个河流断面采样点,于枯水期(11月,平均流速0.6 m3·s−1)对20个河流断面及18个有排水的入河排口进行了水样采集,根据水流方向及沿河涉水排口位置,将该河分为上游段(D01~D04)、支流段(D05~D07)、中游段(D08~D17)和下游段(D18~D20),采样点如图1所示。水质样品的采集参照《地表水和污水监测技术规范》(HJ/T 91-2002)和《水质 采样技术指导》(HJ 494-2009),水样的保存和运输参照《水质 样品的保存和管理技术规定》(HJ 493-2009)。采集的水样在测试完需现场测试的项目后放入低温保温箱于4 ℃避光保存,立即送回实验室后用0.45 μm滤膜过滤待测其他实验室指标。
-
常规水质指标检测参照《水和废水监测分析方法》。pH、溶解氧(DO)、蓝绿藻、叶绿素a(Chla)使用YSI EXO多参数水质分析仪现场测定,化学需氧量(COD)和高锰酸盐指数(CODMn)使用快速消解仪(DR6000,哈希)测定,氨氮 ([NH3-N]) 、总氮 (TN) 、总磷 (TP) 分别采用纳氏试剂分光光度法、碱性过硫酸钾消解紫外分光光度法、钼酸铵分光光度法并利用紫外分光光度计(UV-1800,岛津)测定。
-
经0.45 μm滤膜过滤后的待测水样使用超纯水(Milli-Q,Millipore,>18.2 Ω)稀释至吸光度A254<0.05,使用荧光分光光度计(F7100,日立)配以1 cm×1 cm四面透光石英比色皿测试水样EEM。仪器光源采用150 W氙灯,光电倍增管电压为700 V,激发波长 (λEx) 为200~400 nm,发射波长 (λEm) 为220~550 nm,激发和发射波长狭缝宽度均为5 nm,扫描速度为30 000 nm·min−1。以Milli-Q超纯水为空白样。
-
PARAFAC是基于三线性分解理论,采用交替最小二乘法实现的一种数学模型方法[12],将EEM数据集分解为一组三线性项和一个剩余数组。PARAFAC模型计算公式如式(1)所示。
式中:Xijk为第i个样品在激发波长为k、发射波长为j处的荧光强度值;ain为第n个组分的浓度i个样品浓度的比例;bjn、ckn为模型参数,分别与发射波长为j和激发波长为k时第n个组分的荧光量子效率线性相关;N为载荷矩阵列数,表示正确拟合模型所需要的组分数;εijk为残差矩阵[13]。
-
荧光指数(FI)是指当λEx为370 nm时,λEm在450 nm和500 nm处的荧光强度比值(式(2))[14]。腐殖化指数(HIX)为λEx在254 nm时,λEm扫描范围为435~480 nm与300~345 nm的荧光强度积分值比率(式(3))[15]。生物指数(BIX)是指当λEx为310 nm时,λEm在380 nm和430 nm处的荧光强度比值(式(4))[16]。其中,I为特定激发/发射波长对应的荧光强度值。
当FI>1.9时,DOM主要来源于水生生物;当FI<1.4时,植物、土壤有机质分解等陆源输入占主导地位;当1.4<FI<1.9时,DOM组分同时受陆源和生物源DOM影响[17]。当BIX<0.8时,DOM主要为陆源输入;当0.8<BIX<1时,DOM为陆源输入和内源输入的混合型;当BIX>1时,DOM主要为内源输入[18]。HIX>4时腐殖化程度较高,HIX值越高则DOM的腐殖化程度越高,芳香性越强,DOM越稳定[16]。
-
使用Matlab 2020软件中的dreem 6.0及N-Way工具箱对20个样品的EEM数据进行PARAFAC分析。样品扣除Millipore超纯水空白的拉曼和瑞利散射影响得到实际荧光强度,荧光强度归一化为拉曼单位(R.U.)[19]。荧光数据与在线光谱库(the OpenFluor website,http://www.openfluor.org)公布的数据进行比较,OpenFluor数据库鉴别出的相似荧光峰的激发和发射波长的显著性水平均大于0.95[20]。数据拟合分析和绘图使用OriginLab Origin 2018。使用IBM SPSS Statistics 26进行数据的统计分析,采用皮尔逊方法进行相关性分析,p<0.05为达到显著检测水平,p<0.01为极显著水平。水体富营养化指数(EI)采用对数型幂函数普适指数公式计算,n项富营养指标的EI计算公式如式(5)、式(6)所示。
式中:EIj为指标j的富营养化评价普适指数;xj为指标j的“规范值”,根据文献[21]中各指标的“规范变换式”计算得到;Wj为指标j归一化权重值,本研究将各指标视作等权重[21]。
-
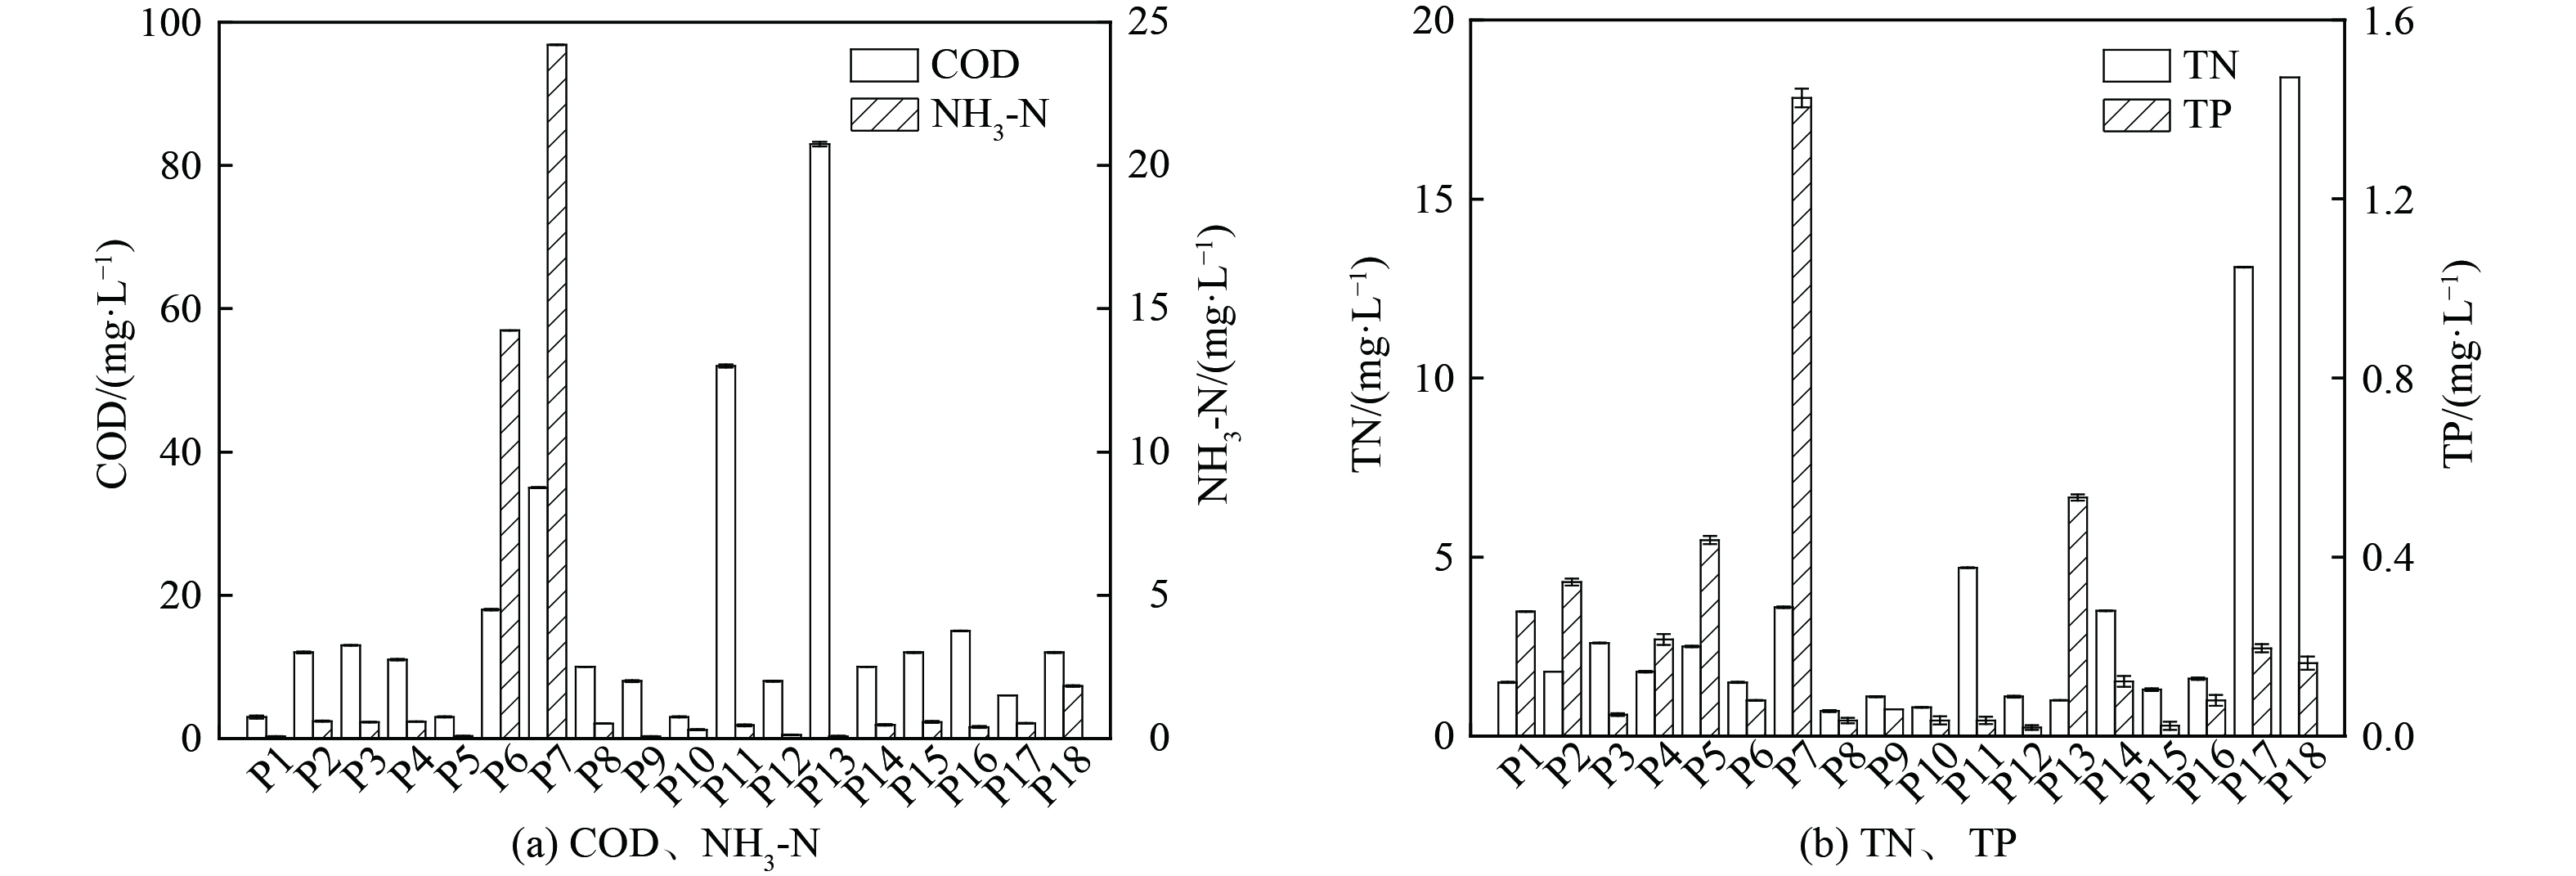
河流断面及涉水排口的水质指标测试结果分别如图2、图3所示。河流水体pH为6.50~7.39,DO为7.33~8.73 mg·L−1(地表水III类水DO标准限值为≥5 mg·L−1),COD为4~18 mg·L−1(地表水III类水COD标准限值为≤20 mg·L−1),TN为0.3~10.2 mg·L−1,蓝绿藻质量浓度为0.09~1.66 μg·L−1,Chla质量浓度为0.80~12.79 μg·L−1,[NH3-N]为0.13~0.68 mg·L−1(地表水III类水[NH3-N]标准限值为≤1 mg·L−1)。TP为0.056~0.204 mg·L−1,其中断面D07的TP(0.204 mg·L−1)超过地表水III类水TP标准限值(0.2 mg·L−1),结合该断面的DO(8.32 mg·L−1)来看,断面D07整体呈好氧状态,排口P07出水TP高达1.43 mg·L−1。这说明是排口外源性输入导致断面D07的TP浓度上升,故该河基本满足地表水III类水质标准。
选取DO、CODMn、[NH3-N]、TN、TP、Chla作为评价指标,计算该河流水体富营养化指数。对各断面部分水质指标(CODMn、[NH3-N]、TN、TP、蓝绿藻、Chla)、氮磷比(N/P)及EI进行皮尔逊相关性分析,结果如表1所示。蓝绿藻与叶绿素a呈极显著正相关,这说明该河的浮游植物主要为蓝绿藻。EI与[NH3-N]和TN呈极显著正相关,与TP和N/P呈显著相关。
表2为4个河段水质指标情况,支流段和下游段的DO有显著性差异。中游段和下游段的COD有显著性差异,由于下游段无涉水排口且该河流量较小,中游段的排口出水COD负荷占该河后端环境容量比例较大,是导致下游段COD上升的关键。上游段和支流段、支流段和中游段、支流段和下游段的TP和蓝绿藻均表现出显著性差异,全河段TP与蓝绿藻表现出显著相关,支流段和中游段TP和蓝绿藻差异可能是排口P7的高TP排水所导致。
-
采用EEM-PARAFAC对该河20个河流断面水样的3D-EEM数据进行处理,分析得到该河DOM共有3种荧光组分(图4),分别是C1(λEx/λEm=245 nm/430 nm)、C2(λEx/λEm=240,300 nm/365 nm)、C3(λEx/λEm=225,275 nm/335 nm)。荧光组分C1在OpenFluor数据库中匹配的成分数量有76个,是典型的陆源类腐殖质,主要来源于陆源输入和植物腐烂分解[22]。该组分在河流[23]、湖泊[24]、海洋[25]和地下水[26]的研究中被普遍检出。荧光组分C2在OpenFluor数据库中匹配的成分数量仅为7个,在其他研究中少有发现。组分C2的发射光谱较宽,在该种程度上与类腐殖质相似,但其最大λEm为365 nm,小于典型类腐殖质的400~500 nm。组分C2的第1个峰(λEx/λEm=240 nm/365 nm)同时涵盖了类色氨酸和类腐殖质的荧光光谱[27]。第2个峰(λEx/λEm=300 nm/365 nm)的λEx比常见的类氨基酸次级λEx最大值(270~280 nm)要大,表现为以色氨酸为主导并伴有类腐殖质的特性[28]。因此,组分C2不能单独归类为类氨基酸或类腐殖酸,可能是类氨基酸和类腐殖质组分的混合物[29]。荧光组分C3在OpenFluor数据库中匹配的数量有90个,是典型的类色氨酸组蛋白质[30-31],组分C3的2个峰分别表示低激发光类色氨酸和高激发光类色氨酸,与微生物等内源生物活动有关[18],广泛存在于多种水生生态系统中[32]。
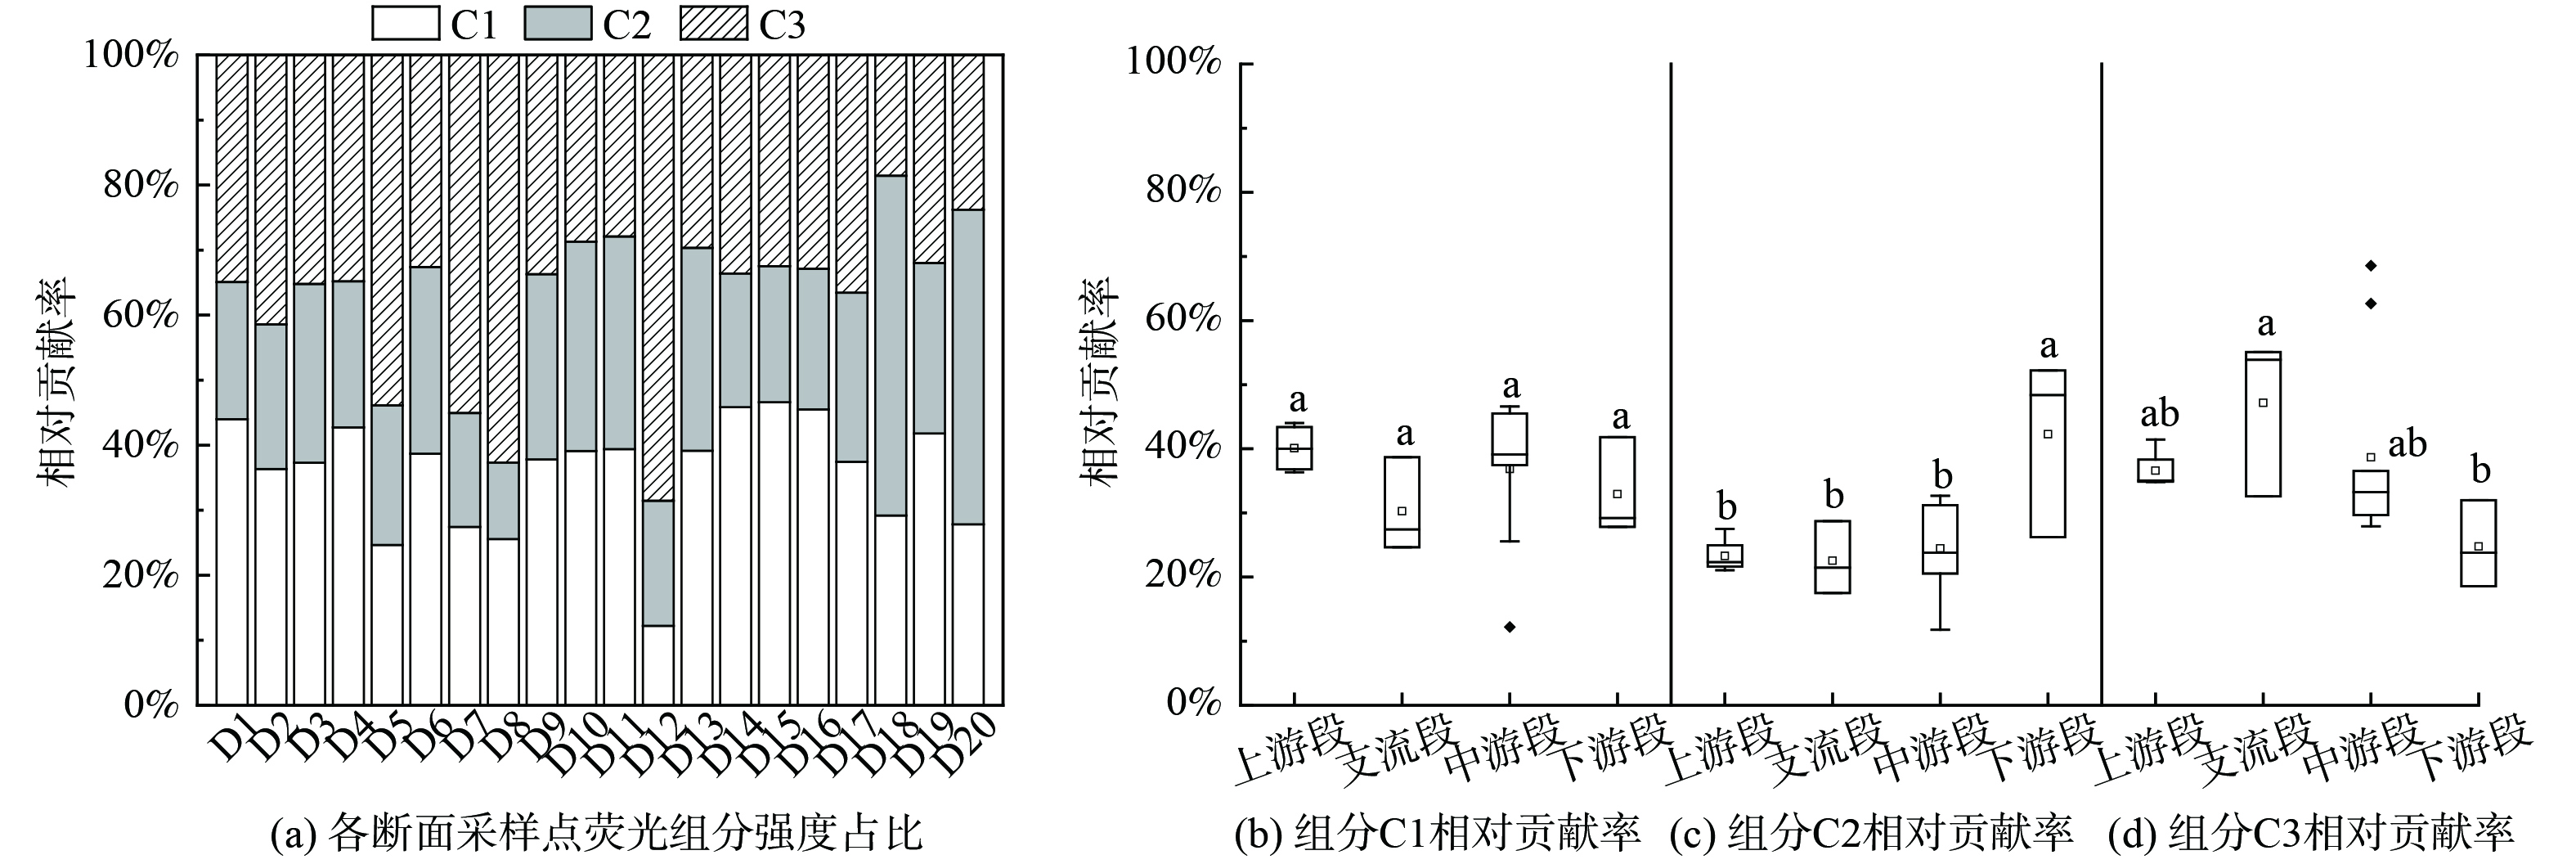
根据EEM-PARAFAC得到所有样点中各个荧光组分的最大荧光强度(Fmax),计算每个样点中各组分荧光的相对贡献率,并分别考察了4个河段中3种荧光组分的相对贡献率(图5)。在河流20个断面中,类腐殖质(C1)占总荧光组分的平均值为35.93%,类氨基酸和类腐殖质混合物(C2)占总组分的26.62%,类色氨酸(C3)占总组分的37.45%。在4个河段中,组分C1的相对贡献率无明显差异。下游段组分C2的相对贡献率与上游段、支流段、中游段存在明显差异。支流段组分C3的相对贡献率与下游段存在明显差异。
-
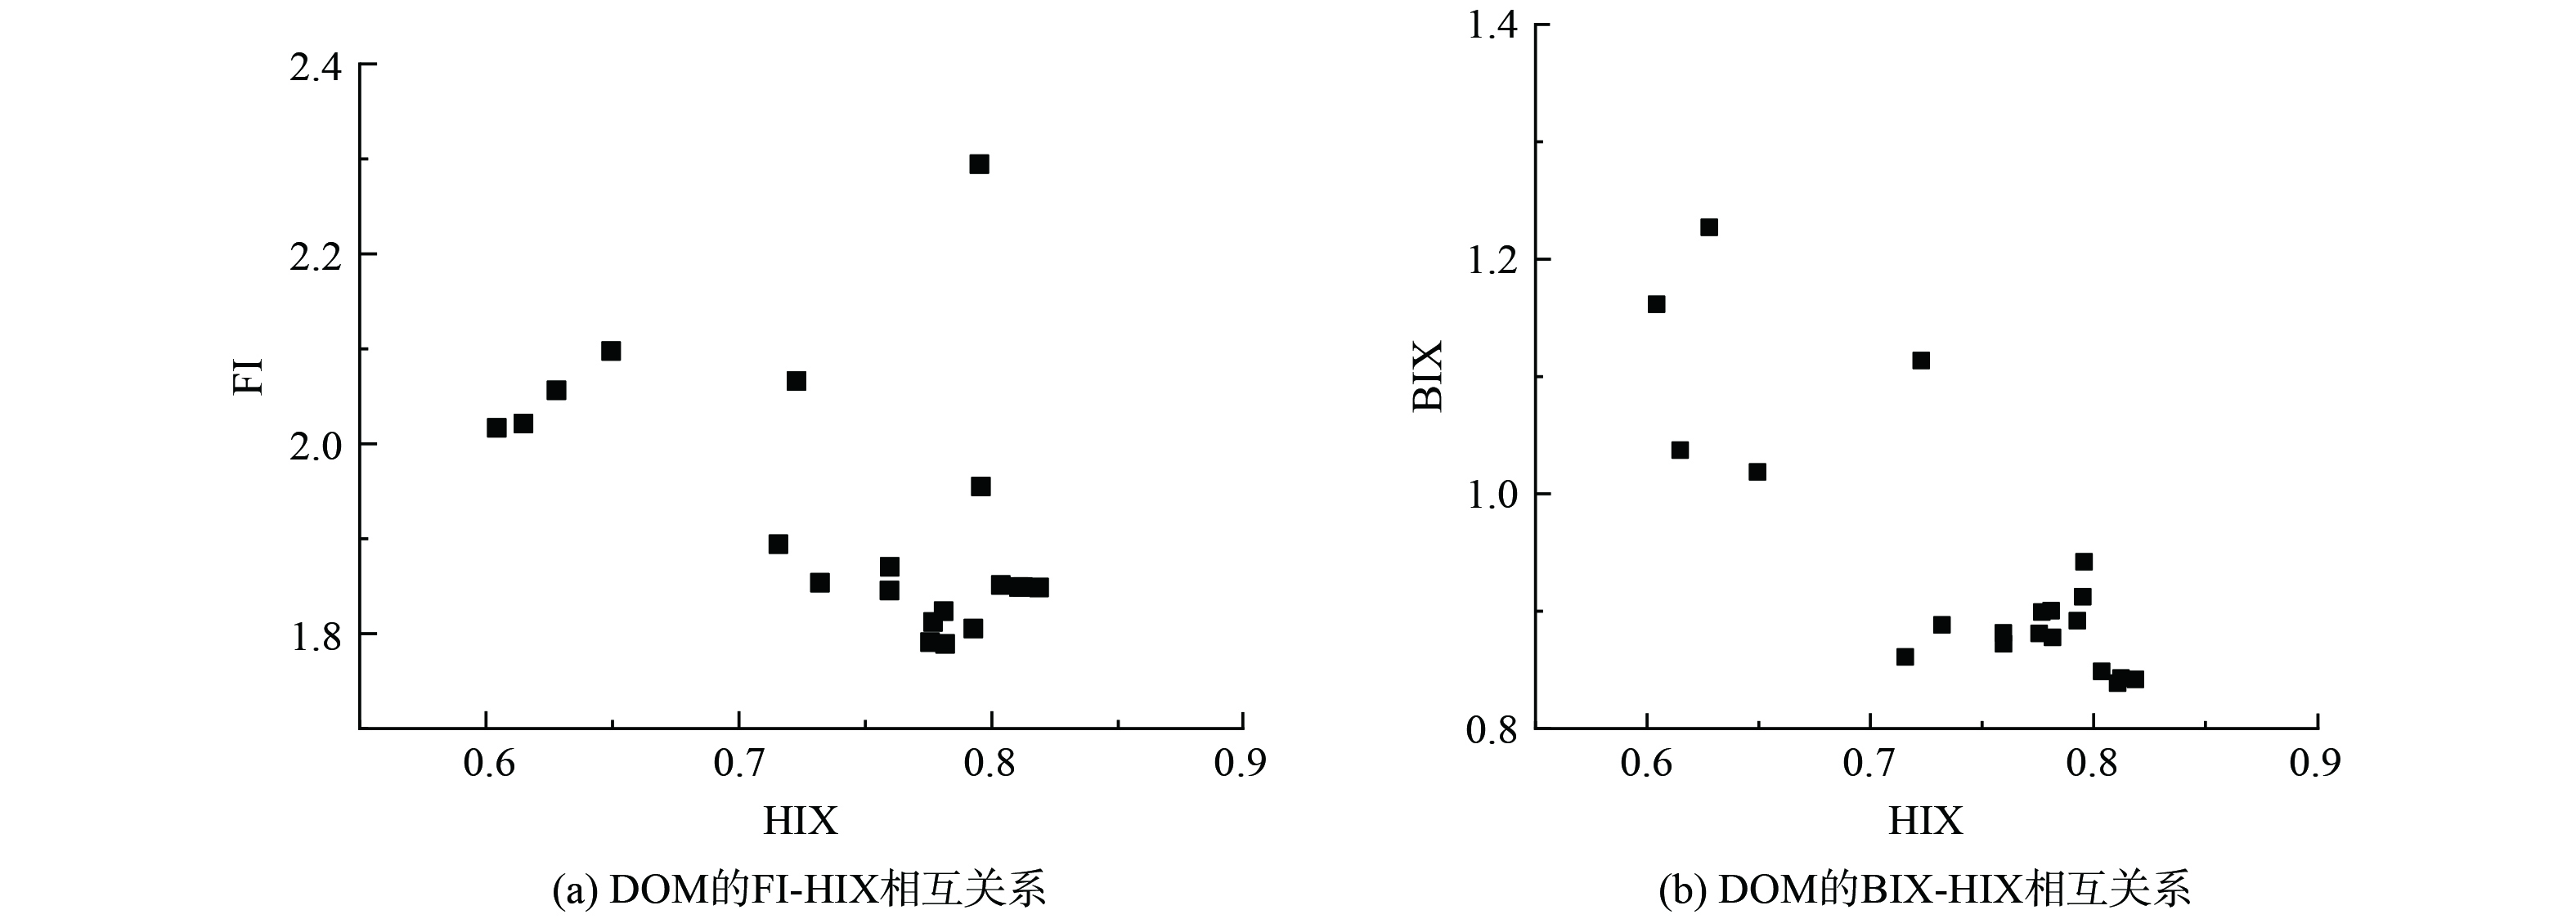
为进一步探究该河DOM的来源和腐殖化程度,采用荧光指数FI、生物指数BIX和腐殖化指数HIX对比分析该河DOM来源特征(图6)。荧光指数FI与DOM芳香性呈负相关,FI越高说明DOM的自生性越强,生物来源比陆地来源更显著。生物指数BIX用来衡量自生源有机质的贡献率,较高的BIX意味着DOM主要来自生物源,包括浮游植物和细菌代谢产物,较低的BIX表示陆源输入贡献更大。腐殖化指数HIX用来表示DOM的腐殖化程度。
水样中DOM的FI、BIX和HIX分别为1.789~2.295,0.839~1.227和0.604~0.819,平均值分别为1.920、0.937和0.746。所有水样FI均大于1.7,同时受陆源和生物源DOM影响。所有水样BIX指数均高于0.8,这说明该河DOM为陆源输入和内源输入混合型,主要由微生物近期自身活动产生[33]。所有水样HIX均小于1.5,这表明所有水样的腐殖化程度偏低,生物活性较强,DOM具有自生源特征,腐殖质主要为微生物或水生细菌来源[16]。FI、BIX、HIX分析一致表明水样中DOM腐殖化程度较低,生物活性较强,主要来源于浮游植物和微生物代谢降解以及沉积物在冲击和水力作用下产生的内源污染。
-
将各DOM组分的荧光峰值(FC1、FC2、FC3)和相对贡献率(C1%、C2%、C3%),与水质指标(DO、COD、[NH3-N]、TN、TP、N/P、蓝绿藻、叶绿素a)及荧光参数(FI、BIX、HIX)进行皮尔逊相关性分析,结果如表3所示。TN与组分C1的相对贡献率呈显著负相关,N/P与组分C1的相对贡献率呈极显著负相关。TP与各荧光组分的荧光峰值和相对贡献率均无显著相关,可能与河流中磷的复杂来源和循环有关[9]。FI与组分C1、C2的荧光峰值呈显著负相关,BIX与组分C1、C2的荧光峰值呈极显著负相关,这说明河流中类氨基酸和类腐殖质混合物(C2)可能以类腐殖酸为主。HIX与组分C1的荧光峰值和相对贡献率均呈极显著正相关,这说明河流中类腐殖质(C1)主要来源于植物腐烂。
-
根据溯源解析,该河DOM主要来源于浮游植物和微生物代谢降解以及沉积物在冲击和水力作用下的内源污染,可分别从控制浮游植物和微生物代谢降解、消除或钝化沉积物中有机物及长效环境管理措施等角度提出对该河DOM内源污染的治理策略。
1) 浮游生物调控。对于河流上覆水体浮游植物自身腐烂分解和微生物代谢降解产生的DOM,可通过采取固体微生物技术或布设生态浮岛,达到污染物净化效果,降低水体中DOM的含量[13]。在流动性较差的河段采用曝气手段,通过布设水体复氧机进行曝气来提高水体流动性,增加溶解氧,加速水体从厌氧、缺氧状态迅速恢复至好氧状态,促进浮游植物和微生物的新陈代谢,抑制厌氧微生物分解和藻类的生长。
2) 沉积物治理。沉积物中的有机物内源污染一方面来源于沉积物中微生物进行生命过程时不断产生的类蛋白物质,另一方面来源于逐渐沉降至底泥表层并积累的外源有机物。当河流底泥被扰动时,底泥和上覆水之间的物质交换平衡被打破,沉积物中的有机物进入水体,并且会促进水体中藻类生长、繁殖和死亡,加速内源污染物的累积[33]。内源污染的异位治理技术主要有环保疏浚技术,能快速减少底部有机物的积累、增加水体容量,实现水体净化。但是具有成本高、破坏沉积物微生态和河流生态、易产生二次污染等缺点。有机物内源污染的原位治理可采取原位覆盖技术或生态修复技术。原位覆盖适用于水流速度缓慢的河段且需要考虑对覆盖范围内建筑、水道正常使用的影响,具有一定局限性[34]。生态修复是通过投加微生物菌剂或利用特定水生动、植物,对污染物进行降解、转化、吸收或富集,达到去除污染物的目的,成本相对较低且可改善生态景观。
3) 长效环境管理。在规范排污口设置、加强城市排水管网建设、实施排污口长效管理等方面持续防止河流引入外源污染。根据各内源污染治理技术的适用范围和优缺点,结合该河水文条件、DOM来源及水质状况,考虑对该河采用简单有效的潜流人工湿地、生态浮岛并辅助水体曝气系统,并对该河实施长效环境管理,有助于实现可持续改善河流水质的目标。
-
1) 通过EEM-PARAFAC技术快速解析河流DOM组成,分析得到3种荧光组分,分别为类腐殖质荧光组分C1(λEx/λEm=245 nm/430 nm)、类氨基酸和类腐殖质组分的混合物C2(λEx/λEm=240,300 nm/365 nm)和类色氨酸荧光组分C3(λEx/λEm=225,275 nm/335 nm)。2) 该河基本满足地表水III类水质标准,个别入河涉水排口排水会降低相关河流断面水质。河流中浮游植物主要为蓝绿藻,河流中磷的来源复杂。3) 荧光指数FI(>1.7)、生物指数BIX(>0.8)、腐殖化指数HIX(<1.5)等特征参数分析一致表明,该河DOM腐殖化程度较低,生物活性较强,主要来源于浮游植物和微生物代谢降解以及沉积物在冲击和水力作用下的内源污染。
基于三维荧光及平行因子分析的南昌市某河可溶性有机物溯源及治理策略
Dissolved organic matter source identification and treatment strategies of a river in Nanchang based on three-dimensional excitation emission matrix fluorescence spectroscopy and parallel factor analysis
-
摘要: 地表河流污染物溯源对污染物防治及河流生态环境改善具有重要意义。三维荧光光谱(3D-EEM)的图谱形状、荧光峰位置、荧光峰强度、荧光峰个数信息和荧光参数可作为水体中可溶性有机物(DOM)的荧光特征。结合平行因子分析(PARAFAC)对南昌市某河的3D-EEMs进行分析并进行DOM溯源研究,结果表明,该河DOM主要包含3个荧光组分,分别为类腐殖质荧光组分C1(λEx/λEm=245 nm/430 nm)、类氨基酸和类腐殖质组分的混合物C2(λEx/λEm=240,300 nm/365 nm)和类色氨酸荧光组分C3(λEx/λEm=225,275 nm/335 nm),分别占总荧光组分的35.93%,26.62%和37.45%。该河基本满足地表水环境质量标准(GB 3838-2002)III类水标准,浮游植物主要为蓝绿藻,河流中磷的来源复杂。污染物溯源结果表明,该河DOM腐殖化程度较低,生物活性较强,主要来源于浮游植物和微生物代谢降解和沉积物在冲击和水力作用下产生的内源污染。建议该河采用生态修复技术并辅助水体曝气系统治理DOM污染,并持续防止河流引入外源污染。Abstract: Pollution source identification of surface river is of great significance for pollution control and improving river ecological environment. The shape, fluorescence peak position, peak intensity, peak number of the there-dimensional excitation emission matrix (3D-EEM) and fluorescence indices are the fluorescence characteristics of dissolved organic matter (DOM). 3D-EEMs of a river in Nanchang were analyzed coupled with parallel factor analysis (PARAFAC) and DOM source identification was conducted. Results showed that the DOM mainly contained three fluorescent components. The components were humic-like component C1 (λEx/λEm=245 nm/430 nm), mixture of amino acid-like and humic-like components C2 (λEx/λEm=240, 300 nm/365 nm) and tryptophan-like component C3 (λEx/λEm=225, 275 nm/335 nm). The contribution rates of the three components to the total fluorescence intensity were 35.93%, 26.62% and 37.45%, respectively. The quality of the river basically reached the class III level of the surface water environmental quality standard (GB 3838-2002). The phytoplankton were mainly blue-green algae, and the sources of phosphorus were complex. The results of pollution source identification showed that DOM in the river had low humification degree and strong biological activity. DOM in this river mainly came from endogenous pollution generated by the metabolic degradation of phytoplankton and microorganisms and sediments under shock and hydraulic action. Results suggested that ecological restoration technology and auxiliary aeration system could be adopted for pollution control of the river, and the exogenous pollution should be prevented continually.
-
水资源是人类赖以生存的必需品和维持经济发展的命脉[1]。流经城镇的河段会因接纳沿岸较为密集的生活、工业、农牧业等污染源,若产生的污染负荷超过水体自净能力将对水生态造成冲击,影响其为沿岸居民提供观赏休憩的功能。河流水体有机物污染是河流综合治理的关键,对河流有机物进行溯源有助于定位污染源头,可有针对性地采取有效的治理措施。因此,为保障水安全、推动经济社会高质量发展、保持稳生态稳定,对河流污染物进行溯源具有重要意义。
可溶性有机物(dissolved organic matter,DOM)是由多种有机物组成的一种复杂混合物,包含单分子和小分子物质(氨基酸、单糖、低分子量有机酸等)和高分子量物质(腐殖物质、蛋白质、多糖等),表现出高度多样性,常被用来评估水质和预测潜在污染[2]。DOM普遍存在于自然水体和废水中,即使是经过深度处理的工业废水仍残留大量DOM。水生生态系统中的DOM来源分为内源(原位水生植物、浮游植物和微生物的生产和分解等)和外源(污水、降水、径流等)[3]。人类活动导致DOM的外源输入显著增加[4]。而不同来源的DOM的化学成分和生物有效性可能存在较大差异[5]。
常规的水质指标如化学需氧量(COD)、生化需氧量(BOD)和总有机碳(TOC)能反映水体有机污染物的总量,但无法表示有机物质结构组成[6]。傅立叶红外变换光谱(FTIR)、气相-质谱联用(GC-MS)、高效液相色谱 (HPLC) 等技术能表征有机物的结构,但通常需要耗费时力对样品进行提取和纯化[3,7]。三维荧光光谱(3D-EEM)技术可用以研究水生环境中DOM的有色和荧光组分,能获得水质样品中DOM荧光团数量、性质和丰度信息,具有快速、灵敏度高、无损样品、成本低等优点。结合平行因子分析(PARAFAC),还可科学地识别水体中相互干扰与叠加的DOM,促进了3D-EEM在DOM结构分析中的应用[8]。
水体3D-EEM的图谱形状、荧光峰位置、荧光峰强度、荧光峰个数信息及荧光参数可以作为荧光特征被用于污染源追溯。TANG等[9]运用三维荧光结合平行因子法(EEM-PARAFAC)分析城市流域和城市周边流域的DOM组成,揭示了流域之间独特的DOM组成归因于不同的人类活动。WANG等[10]运用EEM-PARAFAC对太湖水体中污染物进行溯源,识别出的荧光组分与纺织废水、农业活动和生活废水高度相关,从而发现研究区域受到多种污染源影响。宋庆斌等[11]利用EEM-PARAFAC快速有效地识别出东海区域中有色溶解性有机质(CDOM)的来源,研究结果说明了长江冲淡水等陆源输入对CDOM的显著影响。
本研究拟采用三维荧光及平行因子分析对南昌市某河流进行研究,以期了解水体中DOM的荧光光谱特征,分析水体DOM荧光物质组分组成、类型及对污染物的指征特性,并通过分析不同DOM成分的相对贡献和荧光特征参数对水体DOM溯源,进而诊断该河流存在的主要问题,为城市内地表水的生态环境改善和保护提供参考。
1. 材料与方法
1.1 研究区域与样品采集
南昌市某河全长约6.5 km,其中主河道约5.3 km,西侧支流约1.2 km,平均水深1~2 m,平均河宽40~50 m,平均流量20 m3·s−1。两岸分布有各类食品、饲料、建材、电子产品类工厂。本研究沿河每隔200~300 m设置1个河流断面采样点,于枯水期(11月,平均流速0.6 m3·s−1)对20个河流断面及18个有排水的入河排口进行了水样采集,根据水流方向及沿河涉水排口位置,将该河分为上游段(D01~D04)、支流段(D05~D07)、中游段(D08~D17)和下游段(D18~D20),采样点如图1所示。水质样品的采集参照《地表水和污水监测技术规范》(HJ/T 91-2002)和《水质 采样技术指导》(HJ 494-2009),水样的保存和运输参照《水质 样品的保存和管理技术规定》(HJ 493-2009)。采集的水样在测试完需现场测试的项目后放入低温保温箱于4 ℃避光保存,立即送回实验室后用0.45 μm滤膜过滤待测其他实验室指标。
1.2 水质指标分析
常规水质指标检测参照《水和废水监测分析方法》。pH、溶解氧(DO)、蓝绿藻、叶绿素a(Chla)使用YSI EXO多参数水质分析仪现场测定,化学需氧量(COD)和高锰酸盐指数(CODMn)使用快速消解仪(DR6000,哈希)测定,氨氮 ([NH3-N]) 、总氮 (TN) 、总磷 (TP) 分别采用纳氏试剂分光光度法、碱性过硫酸钾消解紫外分光光度法、钼酸铵分光光度法并利用紫外分光光度计(UV-1800,岛津)测定。
1.3 三维荧光光谱测定
经0.45 μm滤膜过滤后的待测水样使用超纯水(Milli-Q,Millipore,>18.2 Ω)稀释至吸光度A254<0.05,使用荧光分光光度计(F7100,日立)配以1 cm×1 cm四面透光石英比色皿测试水样EEM。仪器光源采用150 W氙灯,光电倍增管电压为700 V,激发波长 (λEx) 为200~400 nm,发射波长 (λEm) 为220~550 nm,激发和发射波长狭缝宽度均为5 nm,扫描速度为30 000 nm·min−1。以Milli-Q超纯水为空白样。
1.4 PARAFAC分析
PARAFAC是基于三线性分解理论,采用交替最小二乘法实现的一种数学模型方法[12],将EEM数据集分解为一组三线性项和一个剩余数组。PARAFAC模型计算公式如式(1)所示。
Xijk=∑Nn=1ainbjnckn+ϵijk,i=1,⋯,I;j=1,⋯,J;k=1,⋯,K (1) 式中:Xijk为第i个样品在激发波长为k、发射波长为j处的荧光强度值;ain为第n个组分的浓度i个样品浓度的比例;bjn、ckn为模型参数,分别与发射波长为j和激发波长为k时第n个组分的荧光量子效率线性相关;N为载荷矩阵列数,表示正确拟合模型所需要的组分数;εijk为残差矩阵[13]。
1.5 荧光指数分析
荧光指数(FI)是指当λEx为370 nm时,λEm在450 nm和500 nm处的荧光强度比值(式(2))[14]。腐殖化指数(HIX)为λEx在254 nm时,λEm扫描范围为435~480 nm与300~345 nm的荧光强度积分值比率(式(3))[15]。生物指数(BIX)是指当λEx为310 nm时,λEm在380 nm和430 nm处的荧光强度比值(式(4))[16]。其中,I为特定激发/发射波长对应的荧光强度值。
FI=IλEm=450nmIλEm=500nm,λEx=370nm (2) HIX=∑480nm435nmIλEm∑345nm300nmIλEm,λEx=254nm (3) BIX=IλEm=380nmIλEm=430nm,λEx=310nm (4) 当FI>1.9时,DOM主要来源于水生生物;当FI<1.4时,植物、土壤有机质分解等陆源输入占主导地位;当1.4<FI<1.9时,DOM组分同时受陆源和生物源DOM影响[17]。当BIX<0.8时,DOM主要为陆源输入;当0.8<BIX<1时,DOM为陆源输入和内源输入的混合型;当BIX>1时,DOM主要为内源输入[18]。HIX>4时腐殖化程度较高,HIX值越高则DOM的腐殖化程度越高,芳香性越强,DOM越稳定[16]。
1.6 数据处理
使用Matlab 2020软件中的dreem 6.0及N-Way工具箱对20个样品的EEM数据进行PARAFAC分析。样品扣除Millipore超纯水空白的拉曼和瑞利散射影响得到实际荧光强度,荧光强度归一化为拉曼单位(R.U.)[19]。荧光数据与在线光谱库(the OpenFluor website,http://www.openfluor.org)公布的数据进行比较,OpenFluor数据库鉴别出的相似荧光峰的激发和发射波长的显著性水平均大于0.95[20]。数据拟合分析和绘图使用OriginLab Origin 2018。使用IBM SPSS Statistics 26进行数据的统计分析,采用皮尔逊方法进行相关性分析,p<0.05为达到显著检测水平,p<0.01为极显著水平。水体富营养化指数(EI)采用对数型幂函数普适指数公式计算,n项富营养指标的EI计算公式如式(5)、式(6)所示。
EIj=10.77×(lnxj)1.1826 (5) EI=∑nj=1Wj×EIj (6) 式中:EIj为指标j的富营养化评价普适指数;xj为指标j的“规范值”,根据文献[21]中各指标的“规范变换式”计算得到;Wj为指标j归一化权重值,本研究将各指标视作等权重[21]。
2. 结果与分析
2.1 河流断面及涉水排口水质特征
河流断面及涉水排口的水质指标测试结果分别如图2、图3所示。河流水体pH为6.50~7.39,DO为7.33~8.73 mg·L−1(地表水III类水DO标准限值为≥5 mg·L−1),COD为4~18 mg·L−1(地表水III类水COD标准限值为≤20 mg·L−1),TN为0.3~10.2 mg·L−1,蓝绿藻质量浓度为0.09~1.66 μg·L−1,Chla质量浓度为0.80~12.79 μg·L−1,[NH3-N]为0.13~0.68 mg·L−1(地表水III类水[NH3-N]标准限值为≤1 mg·L−1)。TP为0.056~0.204 mg·L−1,其中断面D07的TP(0.204 mg·L−1)超过地表水III类水TP标准限值(0.2 mg·L−1),结合该断面的DO(8.32 mg·L−1)来看,断面D07整体呈好氧状态,排口P07出水TP高达1.43 mg·L−1。这说明是排口外源性输入导致断面D07的TP浓度上升,故该河基本满足地表水III类水质标准。
选取DO、CODMn、[NH3-N]、TN、TP、Chla作为评价指标,计算该河流水体富营养化指数。对各断面部分水质指标(CODMn、[NH3-N]、TN、TP、蓝绿藻、Chla)、氮磷比(N/P)及EI进行皮尔逊相关性分析,结果如表1所示。蓝绿藻与叶绿素a呈极显著正相关,这说明该河的浮游植物主要为蓝绿藻。EI与[NH3-N]和TN呈极显著正相关,与TP和N/P呈显著相关。
表 1 水质指标及富营养化指数间的相关性分析Table 1. Correlation analysis based on water quality parameters and EI[NH3−N] TN TP N/P 蓝绿藻 Chla EI CODMn −0.240 −0.019 −0.053 −0.041 0.271 0.274 0.127 [NH3−N] 0.282 0.183 0.176 −0.187 −0.186 0.633** TN 0.042 0.938** −0.238 −0.311 0.598** TP −0.173 0.471* 0.383 0.526* N/P −0.282 −0.319 0.470* 蓝绿藻 0.747** 0.171 Chla 0.144 注:**表示0.01级别,相关性极显著;*表示0.05级别,相关性显著。 表2为4个河段水质指标情况,支流段和下游段的DO有显著性差异。中游段和下游段的COD有显著性差异,由于下游段无涉水排口且该河流量较小,中游段的排口出水COD负荷占该河后端环境容量比例较大,是导致下游段COD上升的关键。上游段和支流段、支流段和中游段、支流段和下游段的TP和蓝绿藻均表现出显著性差异,全河段TP与蓝绿藻表现出显著相关,支流段和中游段TP和蓝绿藻差异可能是排口P7的高TP排水所导致。
表 2 4个河段的水质指标情况Table 2. Water quality indexes of 4 river segments河段 pH DO/(mg·L−1) COD/(mg·L−1) [NH3-N]/(mg·L−1) TN/(mg·L−1) TP/(mg·L−1) 蓝绿藻/(μg·L−1) Chla/(μg·L−1) 上游段 7.28±0.12a 7.87±0.25ab 11.25±4.92a 0.18±0.03a 1.12±0.67a 0.10±0.03b 0.31±0.08b 7.25±0.58a 支流段 6.86±0.19a 8.31±0.07a 12.67±2.31a 0.25±0.17a 1.67±0.40a 0.18±0.03a 1.09±0.63a 9.83±2.56a 中游段 7.04±0.32a 7.91±0.54ab 9.40±3.03b 0.64±0.72a 2.84±2.61a 0.12±0.03b 0.41±0.37b 4.75±1.94b 下游段 6.90±0.22a 7.54±0.17b 15.00±2.65a 0.19±0.04a 4.20±5.20a 0.09±0.03b 0.17±0.06b 4.44±1.39b 注:同列数据后不同小写字母表示同一指标不同河段之间差异达到显著水平(p<0.05)。 2.2 DOM组成特征
采用EEM-PARAFAC对该河20个河流断面水样的3D-EEM数据进行处理,分析得到该河DOM共有3种荧光组分(图4),分别是C1(λEx/λEm=245 nm/430 nm)、C2(λEx/λEm=240,300 nm/365 nm)、C3(λEx/λEm=225,275 nm/335 nm)。荧光组分C1在OpenFluor数据库中匹配的成分数量有76个,是典型的陆源类腐殖质,主要来源于陆源输入和植物腐烂分解[22]。该组分在河流[23]、湖泊[24]、海洋[25]和地下水[26]的研究中被普遍检出。荧光组分C2在OpenFluor数据库中匹配的成分数量仅为7个,在其他研究中少有发现。组分C2的发射光谱较宽,在该种程度上与类腐殖质相似,但其最大λEm为365 nm,小于典型类腐殖质的400~500 nm。组分C2的第1个峰(λEx/λEm=240 nm/365 nm)同时涵盖了类色氨酸和类腐殖质的荧光光谱[27]。第2个峰(λEx/λEm=300 nm/365 nm)的λEx比常见的类氨基酸次级λEx最大值(270~280 nm)要大,表现为以色氨酸为主导并伴有类腐殖质的特性[28]。因此,组分C2不能单独归类为类氨基酸或类腐殖酸,可能是类氨基酸和类腐殖质组分的混合物[29]。荧光组分C3在OpenFluor数据库中匹配的数量有90个,是典型的类色氨酸组蛋白质[30-31],组分C3的2个峰分别表示低激发光类色氨酸和高激发光类色氨酸,与微生物等内源生物活动有关[18],广泛存在于多种水生生态系统中[32]。
根据EEM-PARAFAC得到所有样点中各个荧光组分的最大荧光强度(Fmax),计算每个样点中各组分荧光的相对贡献率,并分别考察了4个河段中3种荧光组分的相对贡献率(图5)。在河流20个断面中,类腐殖质(C1)占总荧光组分的平均值为35.93%,类氨基酸和类腐殖质混合物(C2)占总组分的26.62%,类色氨酸(C3)占总组分的37.45%。在4个河段中,组分C1的相对贡献率无明显差异。下游段组分C2的相对贡献率与上游段、支流段、中游段存在明显差异。支流段组分C3的相对贡献率与下游段存在明显差异。
2.3 DOM来源分析
为进一步探究该河DOM的来源和腐殖化程度,采用荧光指数FI、生物指数BIX和腐殖化指数HIX对比分析该河DOM来源特征(图6)。荧光指数FI与DOM芳香性呈负相关,FI越高说明DOM的自生性越强,生物来源比陆地来源更显著。生物指数BIX用来衡量自生源有机质的贡献率,较高的BIX意味着DOM主要来自生物源,包括浮游植物和细菌代谢产物,较低的BIX表示陆源输入贡献更大。腐殖化指数HIX用来表示DOM的腐殖化程度。
水样中DOM的FI、BIX和HIX分别为1.789~2.295,0.839~1.227和0.604~0.819,平均值分别为1.920、0.937和0.746。所有水样FI均大于1.7,同时受陆源和生物源DOM影响。所有水样BIX指数均高于0.8,这说明该河DOM为陆源输入和内源输入混合型,主要由微生物近期自身活动产生[33]。所有水样HIX均小于1.5,这表明所有水样的腐殖化程度偏低,生物活性较强,DOM具有自生源特征,腐殖质主要为微生物或水生细菌来源[16]。FI、BIX、HIX分析一致表明水样中DOM腐殖化程度较低,生物活性较强,主要来源于浮游植物和微生物代谢降解以及沉积物在冲击和水力作用下产生的内源污染。
2.4 荧光组成与水质参数、荧光参数的相关性
将各DOM组分的荧光峰值(FC1、FC2、FC3)和相对贡献率(C1%、C2%、C3%),与水质指标(DO、COD、[NH3-N]、TN、TP、N/P、蓝绿藻、叶绿素a)及荧光参数(FI、BIX、HIX)进行皮尔逊相关性分析,结果如表3所示。TN与组分C1的相对贡献率呈显著负相关,N/P与组分C1的相对贡献率呈极显著负相关。TP与各荧光组分的荧光峰值和相对贡献率均无显著相关,可能与河流中磷的复杂来源和循环有关[9]。FI与组分C1、C2的荧光峰值呈显著负相关,BIX与组分C1、C2的荧光峰值呈极显著负相关,这说明河流中类氨基酸和类腐殖质混合物(C2)可能以类腐殖酸为主。HIX与组分C1的荧光峰值和相对贡献率均呈极显著正相关,这说明河流中类腐殖质(C1)主要来源于植物腐烂。
表 3 水质指标、荧光组分及荧光参数间的相关性分析Table 3. Correlation analysis based on water quality parameters, fluorescence components and indices参数 DO COD [NH3−N] TN TP N/P 蓝绿藻 Chla FI BIX HIX FC1 −0.115 −0.156 0.220 −0.133 0.056 −0.272 −0.007 −0.262 −0.527* −0.913** 0.761** FC2 −0.262 0.265 −0.060 0.346 0.001 0.197 −0.061 0.293 −0.452* −0.575** 0.224 FC3 0.354 −0.036 −0.022 0.138 0.265 0.153 0.392 0.224 0.114 0.021 −0.408 C1% −0.140 −0.213 0.228 −0.476* −0.136 −0.569** −0.176 −0.220 −0.341 −0.699** 0.934** C2% −0.313 0.297 −0.112 0.275 −0.132 0.170 −0.155 −0.302 −0.393 −0.410 0.212 C3% 0.333 −0.078 −0.073 0.120 0.193 0.263 0.238 0.380 0.531* 0.791** −0.803** 注:**表示0.01级别,相关性极显著;*表示0.05级别,相关性显著。 2.5 DOM内源污染治理策略
根据溯源解析,该河DOM主要来源于浮游植物和微生物代谢降解以及沉积物在冲击和水力作用下的内源污染,可分别从控制浮游植物和微生物代谢降解、消除或钝化沉积物中有机物及长效环境管理措施等角度提出对该河DOM内源污染的治理策略。
1) 浮游生物调控。对于河流上覆水体浮游植物自身腐烂分解和微生物代谢降解产生的DOM,可通过采取固体微生物技术或布设生态浮岛,达到污染物净化效果,降低水体中DOM的含量[13]。在流动性较差的河段采用曝气手段,通过布设水体复氧机进行曝气来提高水体流动性,增加溶解氧,加速水体从厌氧、缺氧状态迅速恢复至好氧状态,促进浮游植物和微生物的新陈代谢,抑制厌氧微生物分解和藻类的生长。
2) 沉积物治理。沉积物中的有机物内源污染一方面来源于沉积物中微生物进行生命过程时不断产生的类蛋白物质,另一方面来源于逐渐沉降至底泥表层并积累的外源有机物。当河流底泥被扰动时,底泥和上覆水之间的物质交换平衡被打破,沉积物中的有机物进入水体,并且会促进水体中藻类生长、繁殖和死亡,加速内源污染物的累积[33]。内源污染的异位治理技术主要有环保疏浚技术,能快速减少底部有机物的积累、增加水体容量,实现水体净化。但是具有成本高、破坏沉积物微生态和河流生态、易产生二次污染等缺点。有机物内源污染的原位治理可采取原位覆盖技术或生态修复技术。原位覆盖适用于水流速度缓慢的河段且需要考虑对覆盖范围内建筑、水道正常使用的影响,具有一定局限性[34]。生态修复是通过投加微生物菌剂或利用特定水生动、植物,对污染物进行降解、转化、吸收或富集,达到去除污染物的目的,成本相对较低且可改善生态景观。
3) 长效环境管理。在规范排污口设置、加强城市排水管网建设、实施排污口长效管理等方面持续防止河流引入外源污染。根据各内源污染治理技术的适用范围和优缺点,结合该河水文条件、DOM来源及水质状况,考虑对该河采用简单有效的潜流人工湿地、生态浮岛并辅助水体曝气系统,并对该河实施长效环境管理,有助于实现可持续改善河流水质的目标。
3. 结论
1) 通过EEM-PARAFAC技术快速解析河流DOM组成,分析得到3种荧光组分,分别为类腐殖质荧光组分C1(λEx/λEm=245 nm/430 nm)、类氨基酸和类腐殖质组分的混合物C2(λEx/λEm=240,300 nm/365 nm)和类色氨酸荧光组分C3(λEx/λEm=225,275 nm/335 nm)。2) 该河基本满足地表水III类水质标准,个别入河涉水排口排水会降低相关河流断面水质。河流中浮游植物主要为蓝绿藻,河流中磷的来源复杂。3) 荧光指数FI(>1.7)、生物指数BIX(>0.8)、腐殖化指数HIX(<1.5)等特征参数分析一致表明,该河DOM腐殖化程度较低,生物活性较强,主要来源于浮游植物和微生物代谢降解以及沉积物在冲击和水力作用下的内源污染。
-
表 1 水质指标及富营养化指数间的相关性分析
Table 1. Correlation analysis based on water quality parameters and EI
[NH3−N] TN TP N/P 蓝绿藻 Chla EI CODMn −0.240 −0.019 −0.053 −0.041 0.271 0.274 0.127 [NH3−N] 0.282 0.183 0.176 −0.187 −0.186 0.633** TN 0.042 0.938** −0.238 −0.311 0.598** TP −0.173 0.471* 0.383 0.526* N/P −0.282 −0.319 0.470* 蓝绿藻 0.747** 0.171 Chla 0.144 注:**表示0.01级别,相关性极显著;*表示0.05级别,相关性显著。 表 2 4个河段的水质指标情况
Table 2. Water quality indexes of 4 river segments
河段 pH DO/(mg·L−1) COD/(mg·L−1) [NH3-N]/(mg·L−1) TN/(mg·L−1) TP/(mg·L−1) 蓝绿藻/(μg·L−1) Chla/(μg·L−1) 上游段 7.28±0.12a 7.87±0.25ab 11.25±4.92a 0.18±0.03a 1.12±0.67a 0.10±0.03b 0.31±0.08b 7.25±0.58a 支流段 6.86±0.19a 8.31±0.07a 12.67±2.31a 0.25±0.17a 1.67±0.40a 0.18±0.03a 1.09±0.63a 9.83±2.56a 中游段 7.04±0.32a 7.91±0.54ab 9.40±3.03b 0.64±0.72a 2.84±2.61a 0.12±0.03b 0.41±0.37b 4.75±1.94b 下游段 6.90±0.22a 7.54±0.17b 15.00±2.65a 0.19±0.04a 4.20±5.20a 0.09±0.03b 0.17±0.06b 4.44±1.39b 注:同列数据后不同小写字母表示同一指标不同河段之间差异达到显著水平(p<0.05)。 表 3 水质指标、荧光组分及荧光参数间的相关性分析
Table 3. Correlation analysis based on water quality parameters, fluorescence components and indices
参数 DO COD [NH3−N] TN TP N/P 蓝绿藻 Chla FI BIX HIX FC1 −0.115 −0.156 0.220 −0.133 0.056 −0.272 −0.007 −0.262 −0.527* −0.913** 0.761** FC2 −0.262 0.265 −0.060 0.346 0.001 0.197 −0.061 0.293 −0.452* −0.575** 0.224 FC3 0.354 −0.036 −0.022 0.138 0.265 0.153 0.392 0.224 0.114 0.021 −0.408 C1% −0.140 −0.213 0.228 −0.476* −0.136 −0.569** −0.176 −0.220 −0.341 −0.699** 0.934** C2% −0.313 0.297 −0.112 0.275 −0.132 0.170 −0.155 −0.302 −0.393 −0.410 0.212 C3% 0.333 −0.078 −0.073 0.120 0.193 0.263 0.238 0.380 0.531* 0.791** −0.803** 注:**表示0.01级别,相关性极显著;*表示0.05级别,相关性显著。 -
[1] KZAR A, JAFRI M, MUTTER K, et al. A modified hopfield neural network algorithm (MHNNA) using ALOS image for water quality mapping[J]. International Journal of Environmental Research and Public Health, 2016, 13(1): 92. [2] ZHOU Y Q, JEPPESEN E, ZHANG Y L, et al. Dissolved organic matter fluorescence at wavelength 275/342 nm as a key indicator for detection of point-source contamination in a large Chinese drinking water lake[J]. Chemosphere, 2016, 144: 503-509. doi: 10.1016/j.chemosphere.2015.09.027 [3] DERRIEN M, BROGI S R, GONÇALVES-ARAUJO R. Characterization of aquatic organic matter: Assessment, perspectives and research priorities[J]. Water Research, 2019, 163: 114908. doi: 10.1016/j.watres.2019.114908 [4] FENG L K, ZHANG J, FAN J L, et al. Tracing dissolved organic matter in inflowing rivers of Nansi Lake as a storage reservoir: Implications for water-quality control[J]. Chemosphere, 2022, 286: 131624. doi: 10.1016/j.chemosphere.2021.131624 [5] ZHUANG W E, CHEN W, CHENG Q, et al. Assessing the priming effect of dissolved organic matter from typical sources using fluorescence EEMs-PARAFAC[J]. Chemosphere, 2021, 264: 128600. doi: 10.1016/j.chemosphere.2020.128600 [6] RODRÍGUEZ-VIDAL F J, GARCÍA-VALVERDE M, ORTEGA-AZABACHE B, et al. Characterization of urban and industrial wastewaters using excitation-emission matrix (EEM) fluorescence: Searching for specific fingerprints[J]. Journal of Environmental Management, 2020, 263: 110396. doi: 10.1016/j.jenvman.2020.110396 [7] 梁月清, 刘会来, 崔康平, 等. 基于三维荧光光谱-平行因子分析法的工业园区污水溶解性有机物溯源与归趋[J]. 环境工程学报, 2022, 16(4): 1238-1247. [8] VILA DUPLÁ M. Characterization of cDOM in the Elkhorn Slough estuary using EEM spectroscopy and its potential for macrophyte monitoring[J]. Journal of Marine Systems, 2022, 226: 103661. doi: 10.1016/j.jmarsys.2021.103661 [9] TANG J F, LI X H, CAO C L, et al. Compositional variety of dissolved organic matter and its correlation with water quality in peri-urban and urban river watersheds[J]. Ecological Indicators, 2019, 104: 459-469. doi: 10.1016/j.ecolind.2019.05.025 [10] WANG X, ZHANG M, LIU L L, et al. Using EEM-PARAFAC to identify and trace the pollution sources of surface water with receptor models in Taihu Lake Basin, China[J]. Journal of Environmental Management, 2022, 321: 115925. doi: 10.1016/j.jenvman.2022.115925 [11] 宋庆斌, 王政, 陈明龙, 等. 基于有色溶解性有机质(CDOM)解析陆源污染物在东海区域的分布特征[J]. 环境科学学报, 2021, 41(5): 1950-1959. [12] 白小梅, 李悦昭, 姚志鹏, 等. 三维荧光指纹谱在水体污染溯源中的应用进展[J]. 环境科学与技术, 2020, 43(1): 172-180. [13] 张欢. 派河和南淝河溶解性有机质(DOM)光谱分析及污染源解析[D]. 合肥: 合肥工业大学, 2019. [14] MCKNIGHT D M, BOYER E W, WESTERHOFF P K, et al. Spectrofluorometric characterization of dissolved organic matter for indication of precursor organic material and aromaticity[J]. Limnology and Oceanography, 2001, 46(1): 38-48. doi: 10.4319/lo.2001.46.1.0038 [15] ZSOLNAY A, BAIGAR E, JIMENZEZ M, et al. Differentiating with fluorescence spectroscopy the sources of dissolved organic matter in soils subjected to drying[J]. Chemosphere, 1999, 38(1): 45-50. doi: 10.1016/S0045-6535(98)00166-0 [16] HUGUET A, VACHER L, RELEXANS S, et al. Properties of fluorescent dissolved organic matter in the Gironde Estuary[J]. Organic Geochemistry, 2009, 40(6): 706-719. doi: 10.1016/j.orggeochem.2009.03.002 [17] LI Y Z, ZHANG Y B, LI Z, et al. Characterization of colored dissolved organic matter in the northeastern South China Sea using EEMs-PARAFAC and absorption spectroscopy[J]. Journal of Sea Research, 2021, 180: 102159. [18] 佃柳, 海永龙, 梁玉帅, 等. 合流制管网溢流污染过程中溶解性有机污染物演替特征分析[J]. 环境科学学报, 2022, 42(3): 20-27. [19] LAWAETZ A J, STEDMON C A. Fluorescence intensity calibration using the raman scatter peak of water[J]. Applied Spectroscopy, 2009, 63(8): 936-940. doi: 10.1366/000370209788964548 [20] MURPHY K R, STEDMON C A, WENIG P, et al. OpenFluor–an online spectral library of auto-fluorescence by organic compounds in the environment[J]. Analytical Methods, 2014, 6: 658-661. doi: 10.1039/C3AY41935E [21] 李祚泳, 汪嘉杨, 郭淳. 富营养化评价的对数型幂函数普适指数公式[J]. 环境科学学报, 2010, 30(3): 664-672. [22] 周石磊, 孙悦, 张艺冉, 等. 基于UV-vis和EEMs解析白洋淀冬季冰封期间隙水DOM的光谱特征及来源[J]. 环境科学学报, 2020, 40(2): 604-614. [23] CHEN M L, KIM S H, JUNG H J, et al. Dynamics of dissolved organic matter in riverine sediments affected by weir impoundments: Production, benthic flux, and environmental implications[J]. Water Research, 2017, 121: 150-161. doi: 10.1016/j.watres.2017.05.022 [24] CABRERA J M, GARCÍA P, PEDROZO F L, et al. Dynamics of the dissolved organic matter in a stream-lake system within an extremely acid to neutral pH range: Agrio-Caviahue watershed[J]. Spectrochimica Acta Part A:Molecular and Biomolecular Spectroscopy, 2020, 235: 118278. doi: 10.1016/j.saa.2020.118278 [25] JEON M H, JUNG J, PARK M O, et al. Tracing circumpolar deep water and glacial meltwater using humic-like fluorescent dissolved organic matter in the Amundsen Sea, Antarctica[J]. Marine Chemistry, 2021, 235: 104008. doi: 10.1016/j.marchem.2021.104008 [26] STEDMON C A, SEREDYŃSKA-SOBECKA B, BOE-HANSEN R, et al. A potential approach for monitoring drinking water quality from groundwater systems using organic matter fluorescence as an early warning for contamination events[J]. Water Research, 2011, 45(18): 6030-6038. doi: 10.1016/j.watres.2011.08.066 [27] YANG, L Y, KUANG W E, CHEN C A, et al. Unveiling the transformation and bioavailability of dissolved organic matter in contrasting hydrothermal vents using fluorescence EEM-PARAFAC[J]. Water Research, 2017, 111: 195-203. doi: 10.1016/j.watres.2017.01.001 [28] COBLE P G. Marineoptical biogeochemistry: The chemistry of ocean color[J]. Chemical Reviews, 2007, 107(2): 402-418. doi: 10.1021/cr050350+ [29] 于雯超, 朱利英, 魏源送, 等. 干湿季节下再生水补给河流的溶解性有机物组成特征及其与致病菌基因的相互关系[J]. 环境科学学报, 2021, 41(1): 143-155. [30] RYAN K A, PALACIOS L C, ENCINA F, et al. Assessing inputs of aquaculture-derived nutrients to streams using dissolved organic matter fluorescence[J]. Science of the Total Environment, 2021, 807(Part 2): 150785. [31] FELLMAN J B, HOOD E, SPENCER R J L, et al. Fluorescence spectroscopy opens new windows into dissolved organic matter dynamics in freshwater ecosystems: A review[J]. Limnology & Oceanography, 2010, 55(6): 2452-2462. [32] 刘健, 程丽华, 王明月, 等. 不同水源的再生水中溶解性有机物的特性[J]. 中国给水排水, 2019, 35(21): 92-96. [33] 何杰, 朱学惠, 魏彬, 等. 基于EEMs与UV-vis分析苏州汛期景观河道中DOM光谱特性与来源[J]. 环境科学, 2021, 42(4): 1889-1900. [34] 王国冬. 水环境治理工程中的内源治理技术要点分析[J]. 工程技术研究, 2022, 7(113): 71-73. -


 下载:
下载:


