-
真空排水系统是一种依靠气压差产生高速气流裹挟污水传输的排水系统[1],与传统重力排水系统相比,具有防堵性能好、地形限制较小、施工便利等优势,在广大城市和农村地区被广泛使用。但是,真空排水系统在我国农村地区应用时也普遍存在用户端真空洁具噪声较大[2]、系统节点存在异味、北方地区冬季管道易冰冻等弊端。因此,为使真空排水系统在农村地区更加安全稳定运行,开展针对农村真空排水系统机理和技术优化的研究迫在眉睫。
一般而言,真空排水管道的密封性减少了排水系统沿线的异味散发,这在一定程度上避免了农村地区传统重力排水系统普遍存在的夏季蚊蝇滋生、污水横流、恶臭明显等问题。但真空排水系统在运行过程中,真空站与真空井等点位依然是异味逸散的热点区域,异味的扩散给当地村民的日常生活与身体健康带来潜在危害[3]。针对真空排水系统的异味问题,有关研究探索了真空排水系统真空站排气在生物法除臭前后甲烷、硫化氢、二氧化碳和一氧化碳的质量浓度变化,但却忽略了对真空排水系统全流程的异味逸散规律的探索[4]。整体而言,真空排水系统气体逸散规律的研究相对较少,制约了真空排水系统异味控制水平的提高,开展针对真空排水系统异味逸散规律性的研究具有重要的现实意义。
本研究以内蒙古自治区呼和浩特市某农村为示范基地,采用“重力流户管+真空流室外管混合多级收集模式”,对农村真空排水系统全流程的异味逸散规律进行分析,重点分析农村真空排水系统异味散发的重点区域,提出户管水封、真空井防跌水结构设计、真空站物理和生物耦合吸附等相应的异味控制措施,旨在为进一步探索农村真空排水系统的技术优化方法及实际推广应用提供参考。
-
本研究实验装置位于内蒙古自治区呼和浩特市某农村实验示范基地,采用“重力流户管+真空流室外管混合多级收集模式”,对农村真空排水系统全流程异味逸散规律进行研究。该模式是农村室外真空排水系统常采用的排水模式之一[5],应用于农村地区,具有节约建设成本(可在原有重力户管上进行改造)、排水噪声小(避免室内安装真空便器噪声较大[6])等优点。该真空排水系统主要分为家庭户管、真空井、真空管网、真空站4部分(图1)。
家庭户管由3组排水管道组成,分别为连接马桶的卫生间黑水管(toilet black water,TBW;6 m,φ110 mm×2.8 mm;联塑,中国)、连接卫生间地漏和洗脸盆的卫生间灰水管(toilet gray water,TGW;6 m,φ50 mm×2 mm;联塑,中国)、连接厨房水槽的厨房灰水管(kitchen grey water,KGW,14 m;φ75 mm×2.3 mm;联塑,中国),3组管道坡度均为3‰。真空井由容积为100 L的塑料水桶制成。真空管网(28 m, φ63 mm×2.8 mm;镀美,中国)连接真空井与真空站,坡度为2‰。真空站中真空罐为碳钢材质,容积为750 L;真空泵选取水环式真空泵(型号:2BV2061;荣峰,中国);排水泵选取射流式排水泵(型号:JET-2800;众井,中国)。
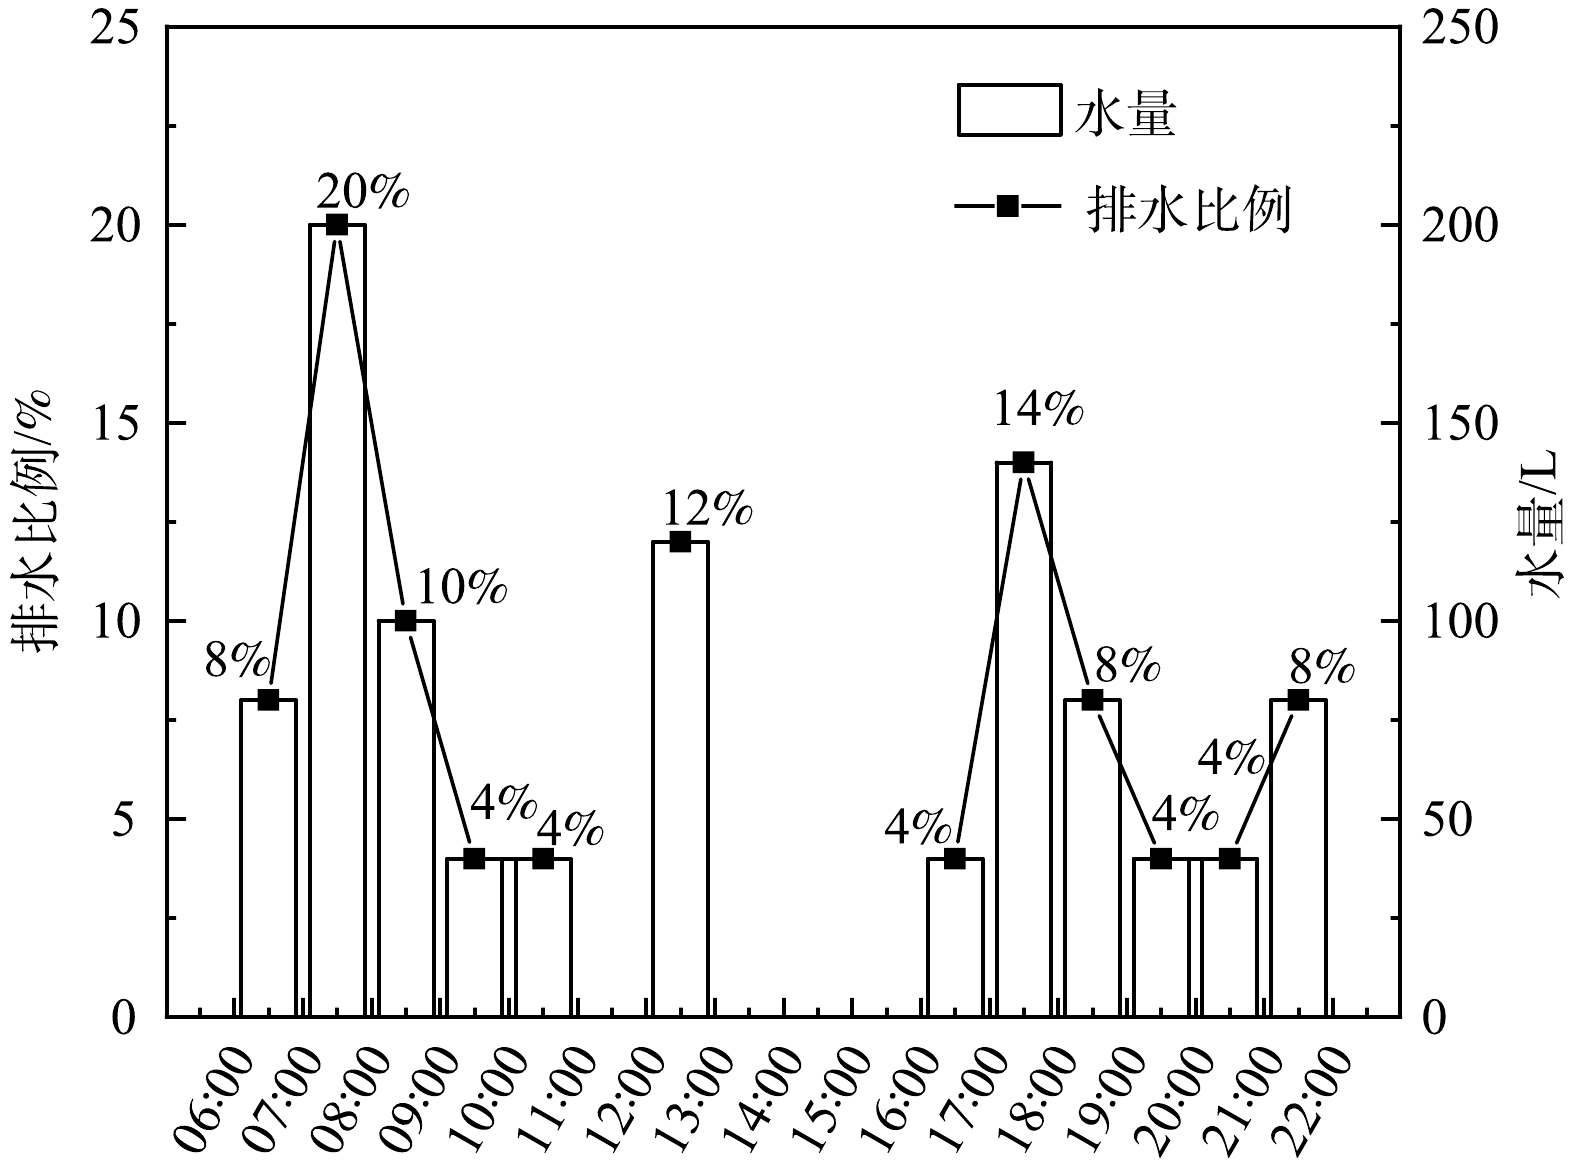
实验装置服务规模为10户,即污水收集量为1 t·d−1。根据《农村生活污水处理技术验证评价规范》 (简称《规范》) 设计真空排水系统排水流量(图2)。《规范》中农村污水排放时变化系数变化较大,相关研究[7]也表明,排水主要集中在早中晚3个时间段。由于农村夜间排水量较少[8],本系统的运行时刻设置为每日07:00—22:00。系统在此时段运行,可避免真空排水系统夜间运行产生的噪声对附近居民带来影响[6]。
在装置运行过程中,室内重力排水出户管将户内产生的生活污水排入真空井内,待污水汇入真空井内并达到100 L时,触发真空井内的液位计使真空界面阀开启。真空井内污水在系统负压的作用下,沿着真空管道汇入真空站的真空罐中。在真空排水系统运行时,采用真空泵使真空系统正常工作压力维持在−0.05~−0.07 MPa[1]。在恢复真空排水系统内正常工作压力时,真空泵启动运行时间约3 min,此时真空泵抽吸真空罐内的气体并向外排出。当真空罐内污水量达到500 L后,触发罐内液位计,自控系统可控制污水泵排放污水。
-
使用手提式气体分析仪PTM600(深圳市逸云天电子有限公司,中国)分析异味,并实时监测记录异味质量浓度数据。在夏季,对户管、真空井、真空站3处异味潜在风险区域进行异味监测,监测指标包括GB 14554-1993中规定的氨气(NH3)、三甲胺(C3H9N)、硫化氢(H2S)、甲硫醇(CH4S)、甲硫醚(C2SH6)、二甲基二硫醚(C2H6S2)、二硫化碳(CS2)、苯乙烯(C8H8)、臭气(OU)9种监测指标,并增加挥发性有机物(VOCS)、乙硫醇(C2H6S)2种监测指标,总计监测11种恶臭污染物指标。采用GB 14554-1993中规定的新建恶臭污染物厂界标准值评定异味质量浓度情况,结果如表1所示。
在家庭户管监测过程中,为便于户管异味测量,打开不同水质过水的户管清扫口,将气体分析仪监测探头置于清扫口上方10 cm位置进行监测,每次连续监测10 min,待监测数据稳定后,对户管异味数据进行记录。在真空井周围异味监测过程中,将气体分析仪监测探头置于真空井井口水平平面1 m位置,在污水汇入真空井时进行监测,每次监测30 min并记录异味质量浓度数据。在真空站异味监测过程中,真空站设施位于封闭房间内,气体分析仪监测探头放置在房间几何中心,在真空排水系统日间运行的时间段,进行异味实时监测并记录异味质量浓度数据。
-
使用SPSS 26.0统计软件对相关变量之间的斯皮尔曼(Spearman)相关性进行统计分析。所有数据结果均在P<0.05 情况下检验显著性。
-
真空排水系统中户管、真空井、真空站监测的异味峰值结果如表2所示。家庭户管TBW管道中NH3、C3H9N、OU指标峰值分别超过规定的3级厂界标准限值的1.45、5.73、5.62倍。H2S、C2H6S2质量浓度峰值分别超过规定的2级厂界标准限值,CH4S、C2SH6、CS2、C8H8、VOCS、C2H6S质量浓度峰值均达标。
在家庭户管TGW管道中,OU指标峰值超过规定的3级厂界标准限值2.67倍。C3H9N、H2S、C2H6S2质量浓度峰值超过规定的2级厂界标准限值,NH3、CH4S、C2SH6、CS2、C8H8、VOCS、C2H6S质量浓度峰值均达标。
在家庭户管KGW管道中,OU峰值超过规定的3级厂界标准限值的2.83倍。C3H9N、H2S、CH4S、质量浓度峰值超过规定的2级厂界标准限值,C2H6S2质量浓度峰值超过规定的1级厂界标准限值,NH3、C2SH6、CS2、C8H8、VOCS、C2H6S质量浓度峰值均达标。
真空井周围NH3、C3H9N、H2S、C2SH6、C2H6S2、C8H8、OU指标峰值分别超过规定的3级厂界标准限值的2.8、11.2、17.56、24.65、21.29、2.66、53.52倍,CH4S、CS2、VOCS、C2H6S质量浓度峰值均达标。
真空站周围OU峰值超过规定的3级厂界标准限值的1.88倍,H2S质量浓度峰值超过规定的2级厂界标准限值,C2H6S2质量浓度峰值超过规定的1级厂界标准限值,NH3、C3H9N、CH4S、C2SH6、CS2、C8H8、VOCS、C2H6S质量浓度峰值均达标。
由表2可知,CS2在不同热点区域的质量浓度峰值均未超过1级限定标准值,GB 14554-1993中未规定的VOCS、C2H6S异味指标在各热点区域均未监测出。不同过水水质的家庭户管中异味质量浓度不同,其中NH3、C3H9N、C2H6S2、OU在卫生间黑水管道中的质量浓度峰值远高于另外2种过水管道中的峰值。由此可见,排水管道中不同的过水水质对管道中异味的影响较大。真空井周围异味问题较为突出,多项异味指标质量浓度峰值远超规定的3级限值标准,故真空井异味问题须多加防控。真空站周围异味问题较低,但部分异味指标质量浓度峰值依然超标,因此也须制定相应的防控措施。
-
在真空排水系统中,家庭户管距离村民的生活区域较近,通常采用“水封”方式阻隔管内恶臭气体逸散至室内,但有时因为存水弯缺水、外界气压变化、采用非标管件等因素导致农户室内串味[9],因此探究管内异味逸散规律具有研究意义。H2S和NH3是排水系统中最为典型的2种恶臭气体[10]。已有研究[11-13]表明,H2S是导致排水管道释放恶臭气味的重要物质之一。H2S容易使人困乏、头晕,扩散到空气中后,还会对周边居民的生活质量造成严重的影响,质量浓度高时甚至可以造成生命危险。NH3对人体有极强的刺激性,能够使皮肤、眼睛、器官黏膜受损,使人体各种组织遭到破坏,人若吸入过多氨气,能引起肺肿胀,破坏运氧功能,甚至死亡。因此本研究对这2种恶臭气体进行重点讨论。
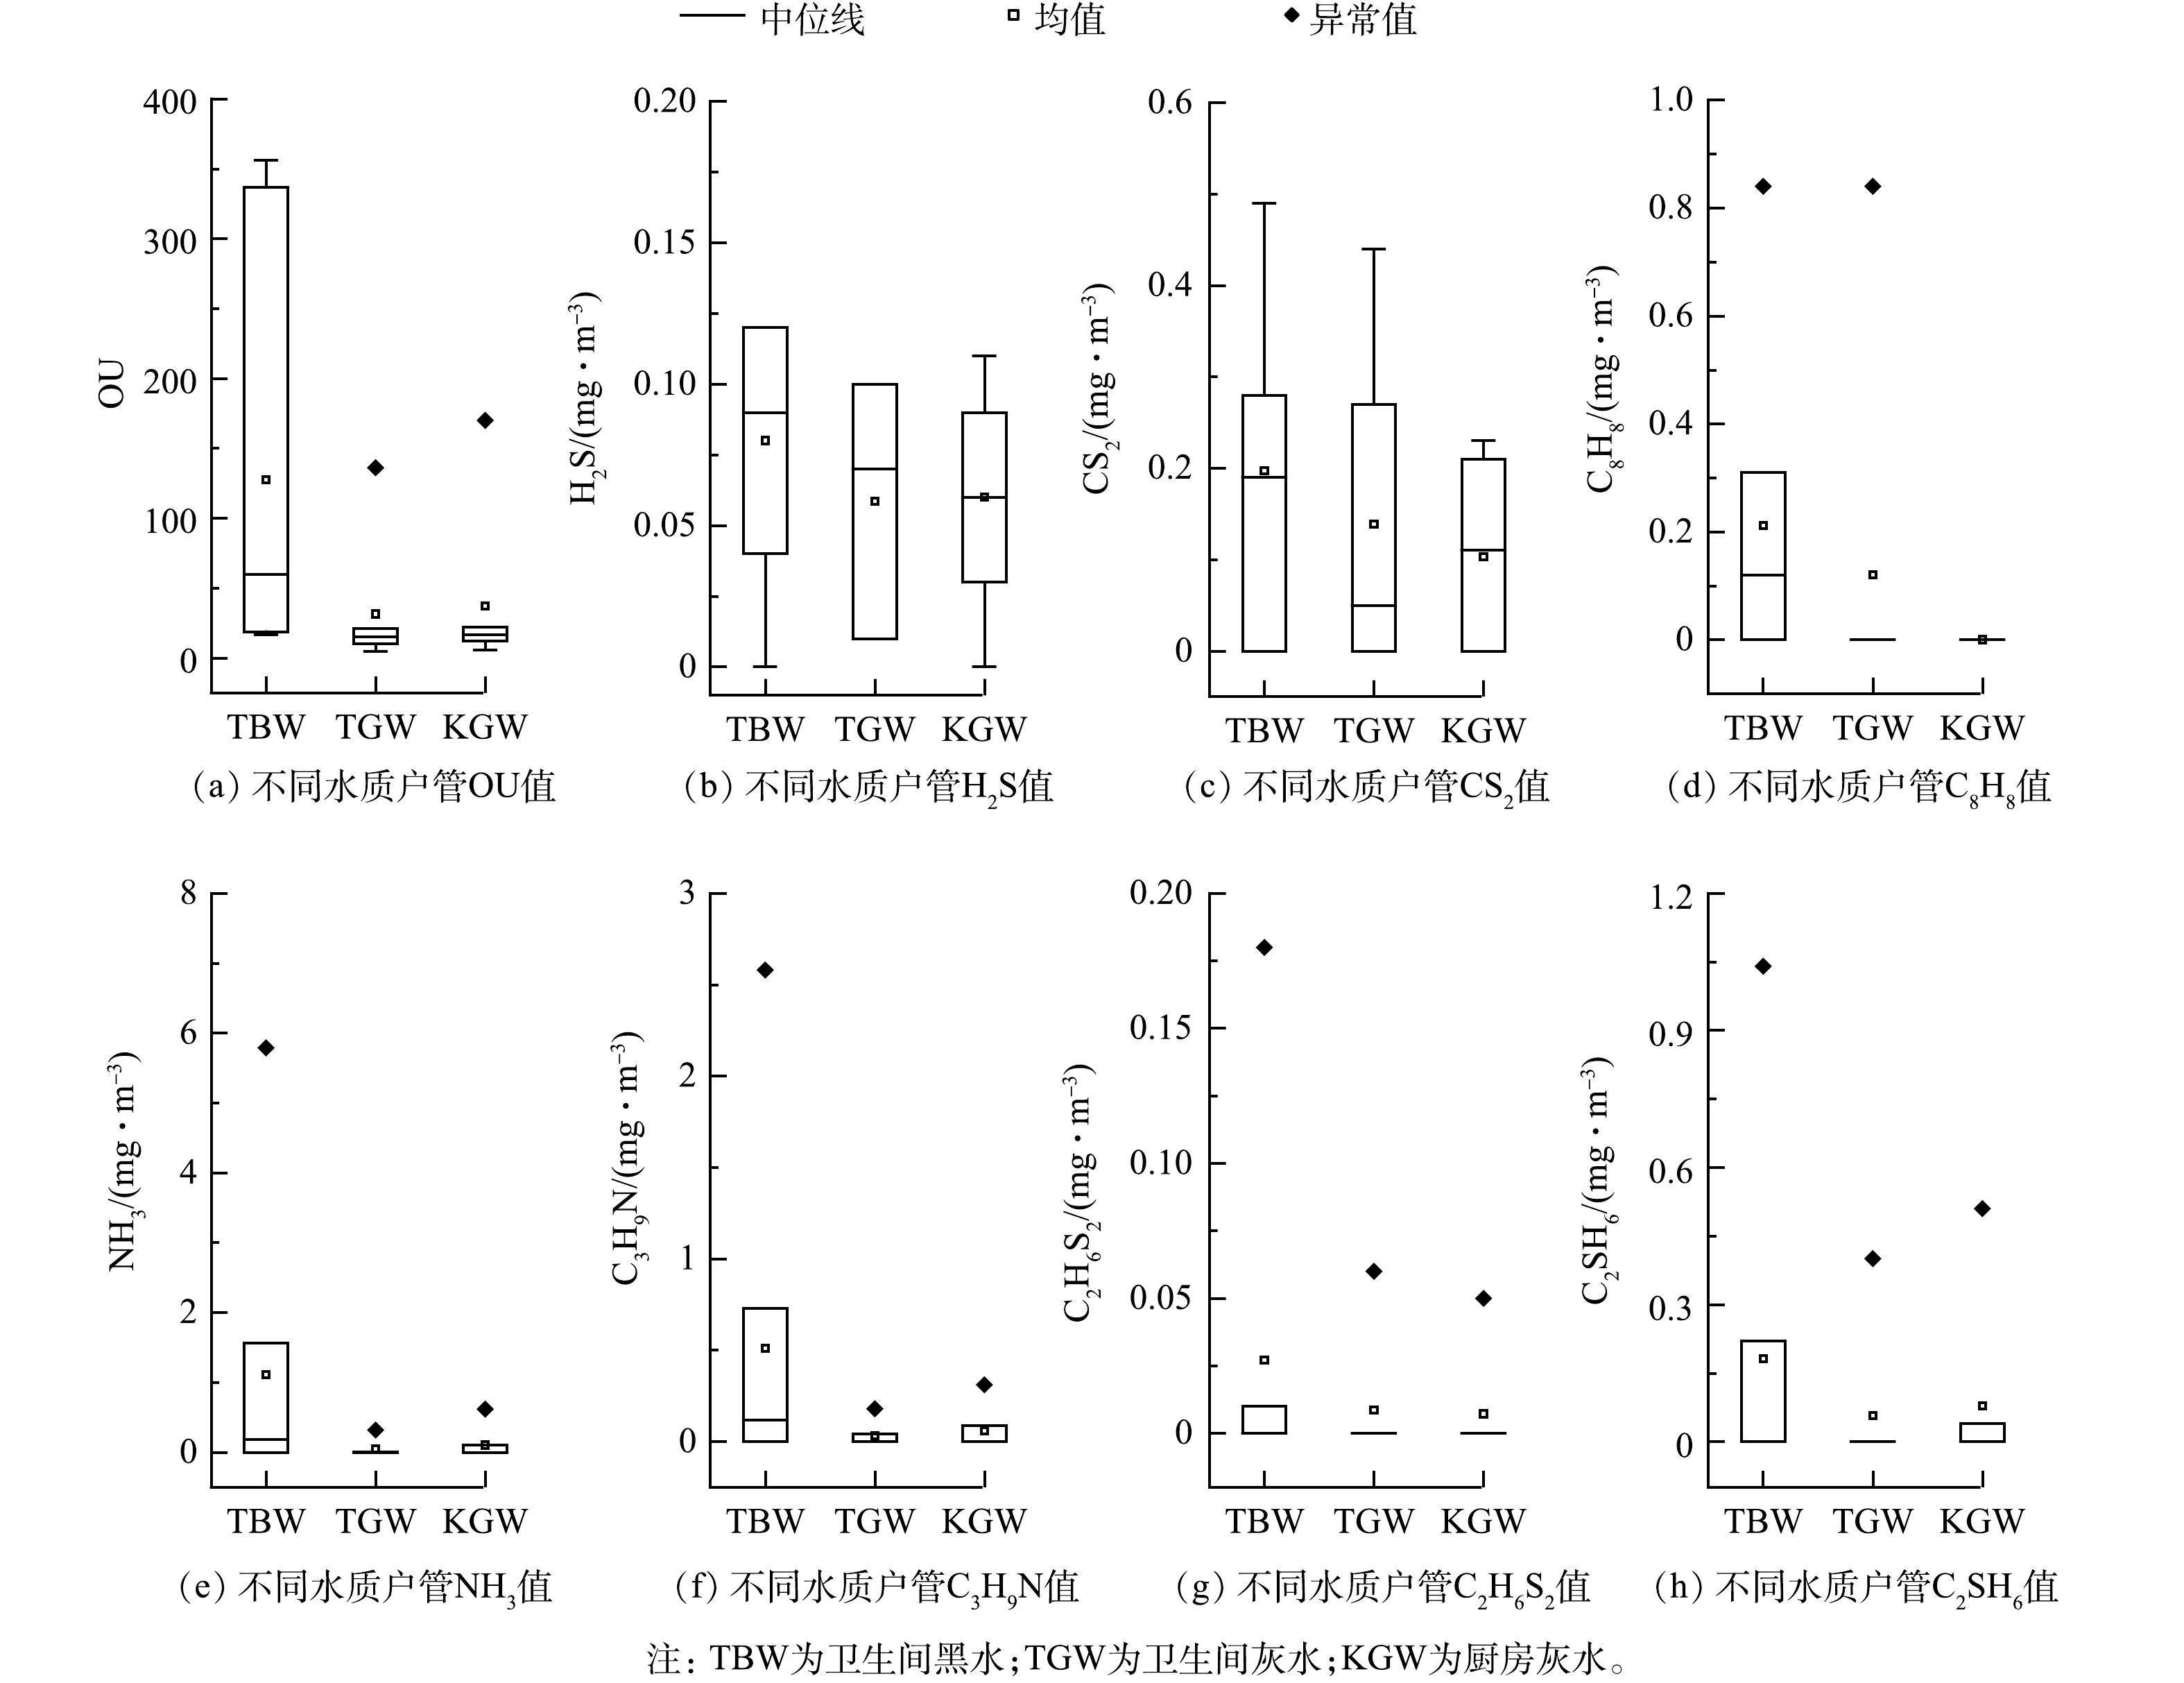
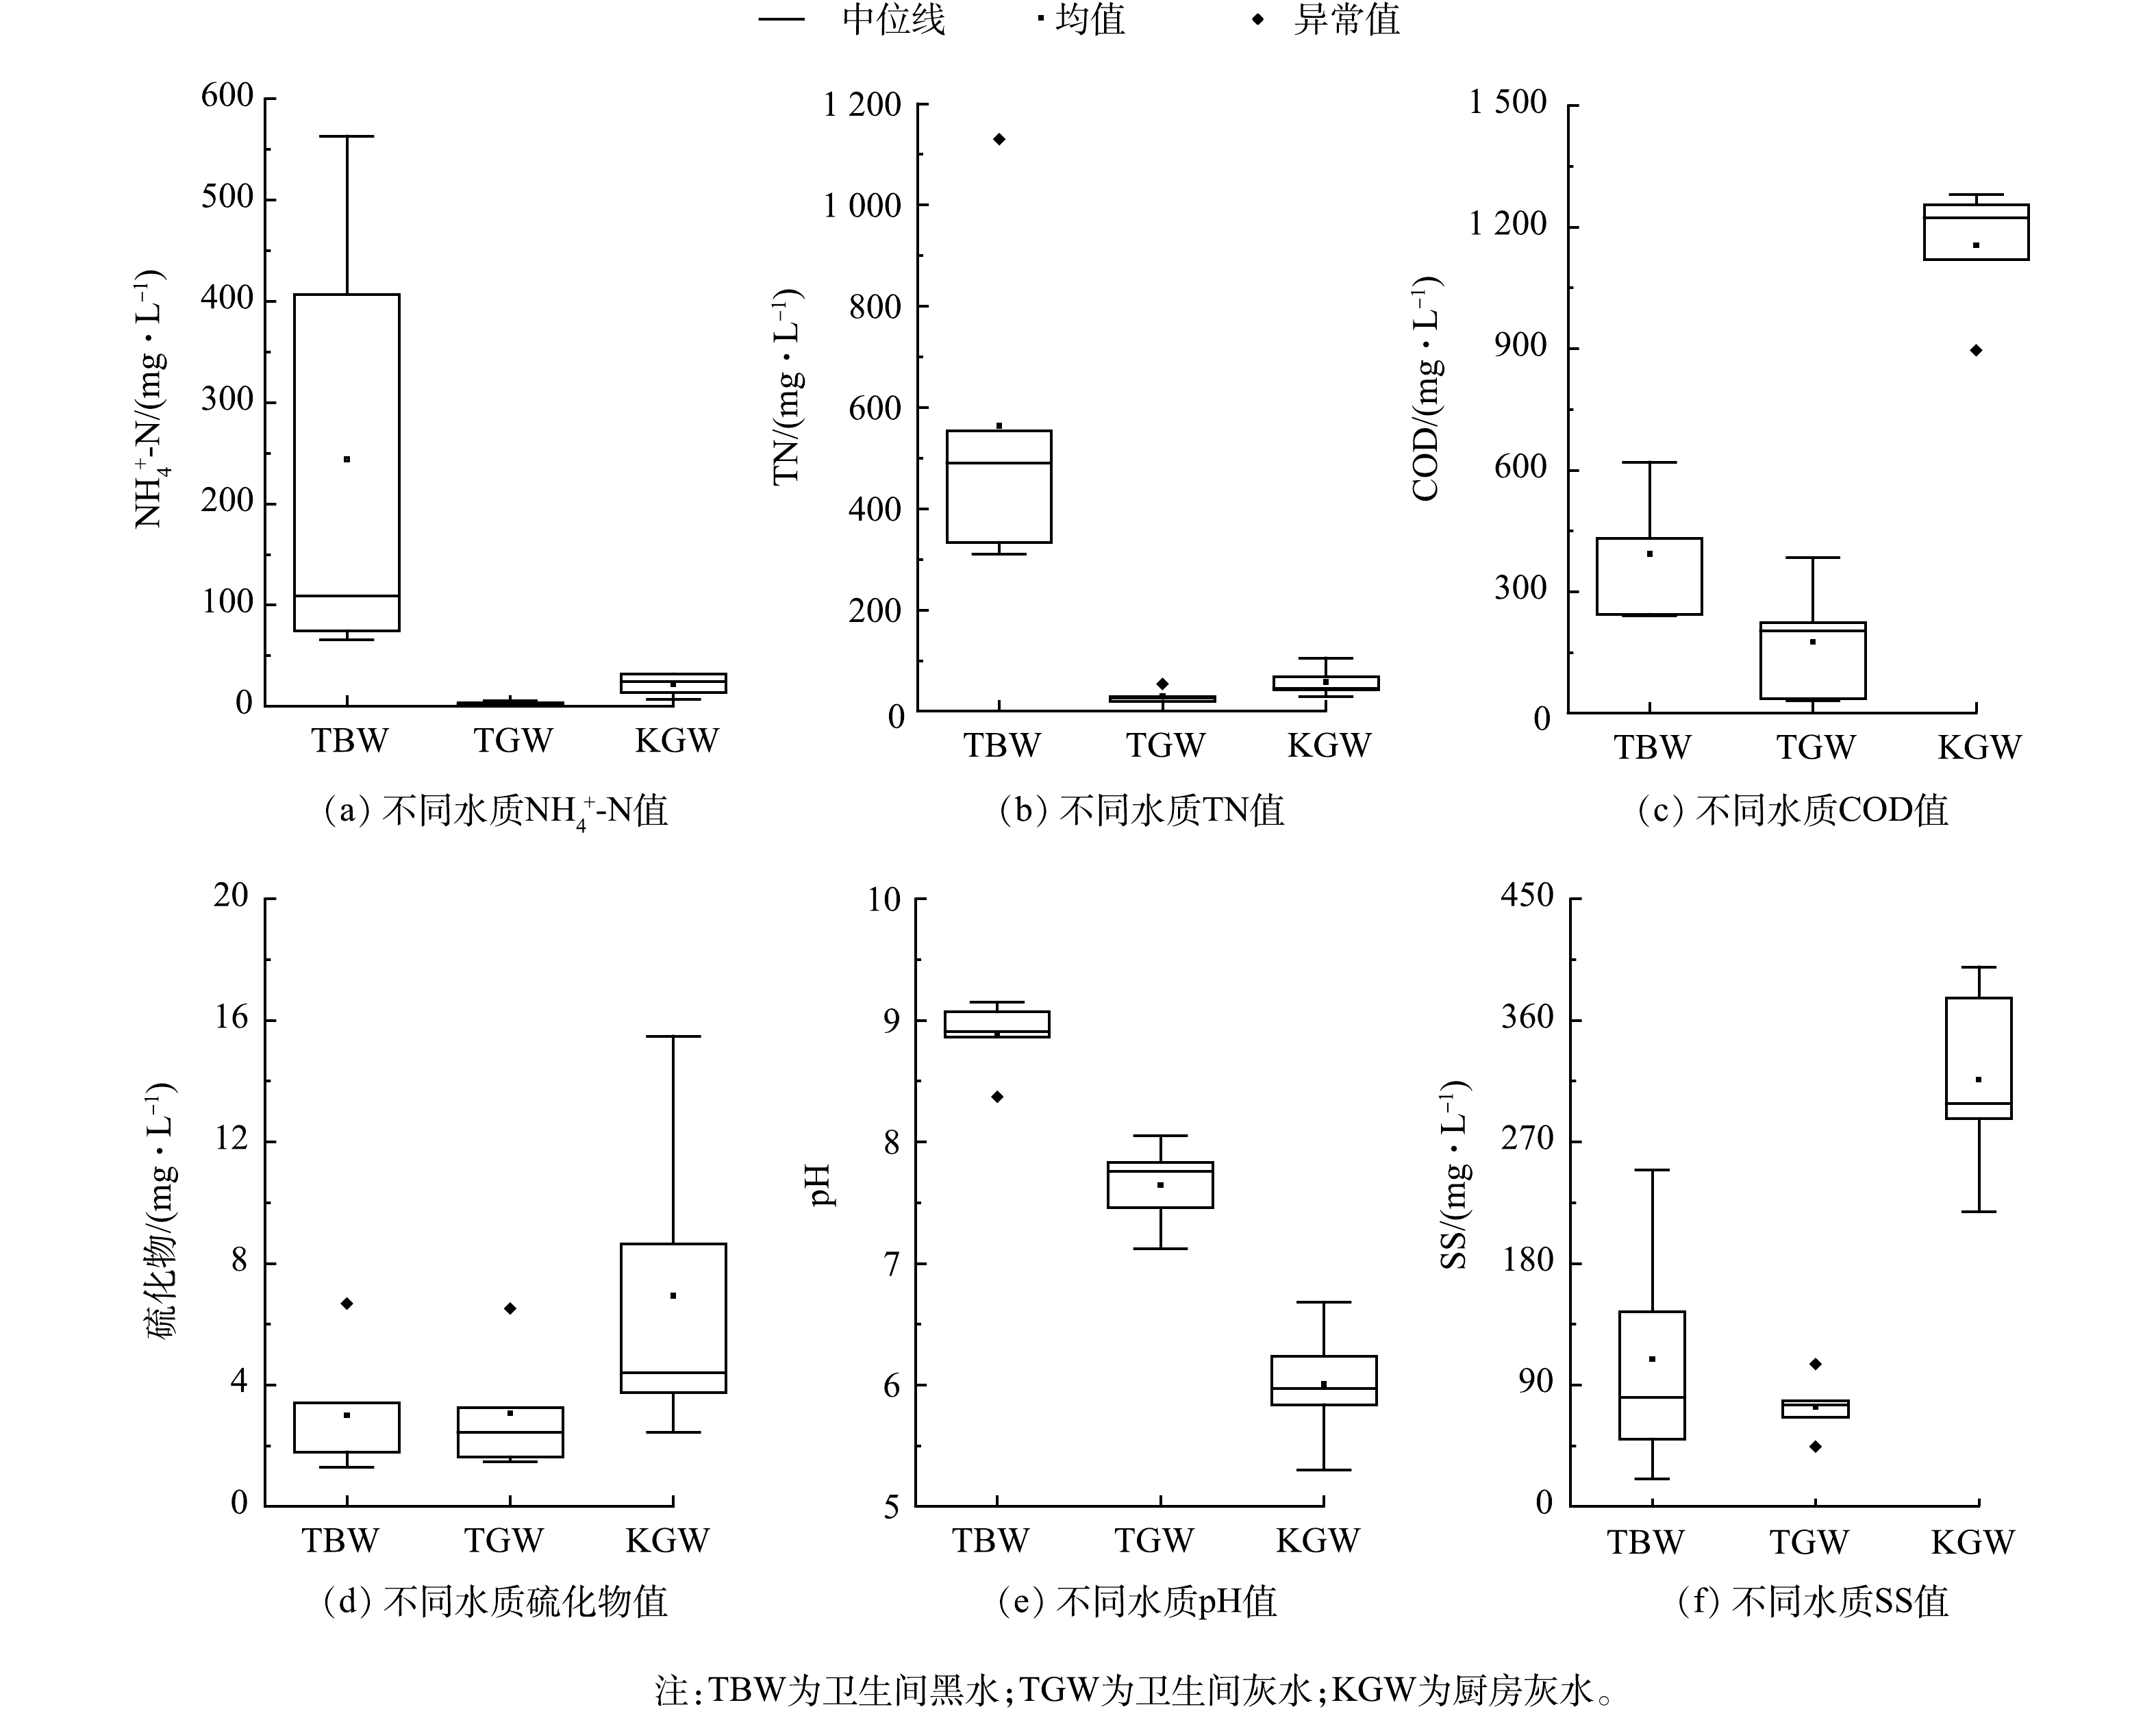
TBW管道、TGW管道、KGW管道异味监测结果如图3所示。TBW、TGW、KGW管道内H2S质量浓度均超过规定的2级限值标准(0.06 mg·m−3)。这是家庭户管内为厌氧环境,管壁中的硫酸盐还原菌在厌氧环境下将污水中的硫酸盐有机物还原生成H2S导致的[14]。TBW管道内过水携带含尿液和粪便[7],这使得卫生间黑水中的NH4+-N、TN度较高[15]。图4中管道内过水水质多次监测数据结果也证实了这一点,TBW管道内NH3气体质量浓度峰值远高于TGW和KGW管道内的质量浓度峰值,分别为TGW和KGW管道内的18.09倍和9.34倍,且超过了表1中所规定的3级限值标准值的1.45倍。KGW中的硫化物质量浓度比另外2种管道过水中的硫化物质量浓度高,但H2S质量浓度却较低,这是3种水质管道中厨房管道使用频率最低,KGW管道内异味质量浓度得到长时间稀释导致的。总体而言,TBW管道中的异味质量浓度最高,其次是KGW管道和TGW管道。对于家庭户管管道的异味防控,应采取水封、管道接口密封等相关措施,以避免异味和气溶胶的散播给村民身体健康带来的危害。
-
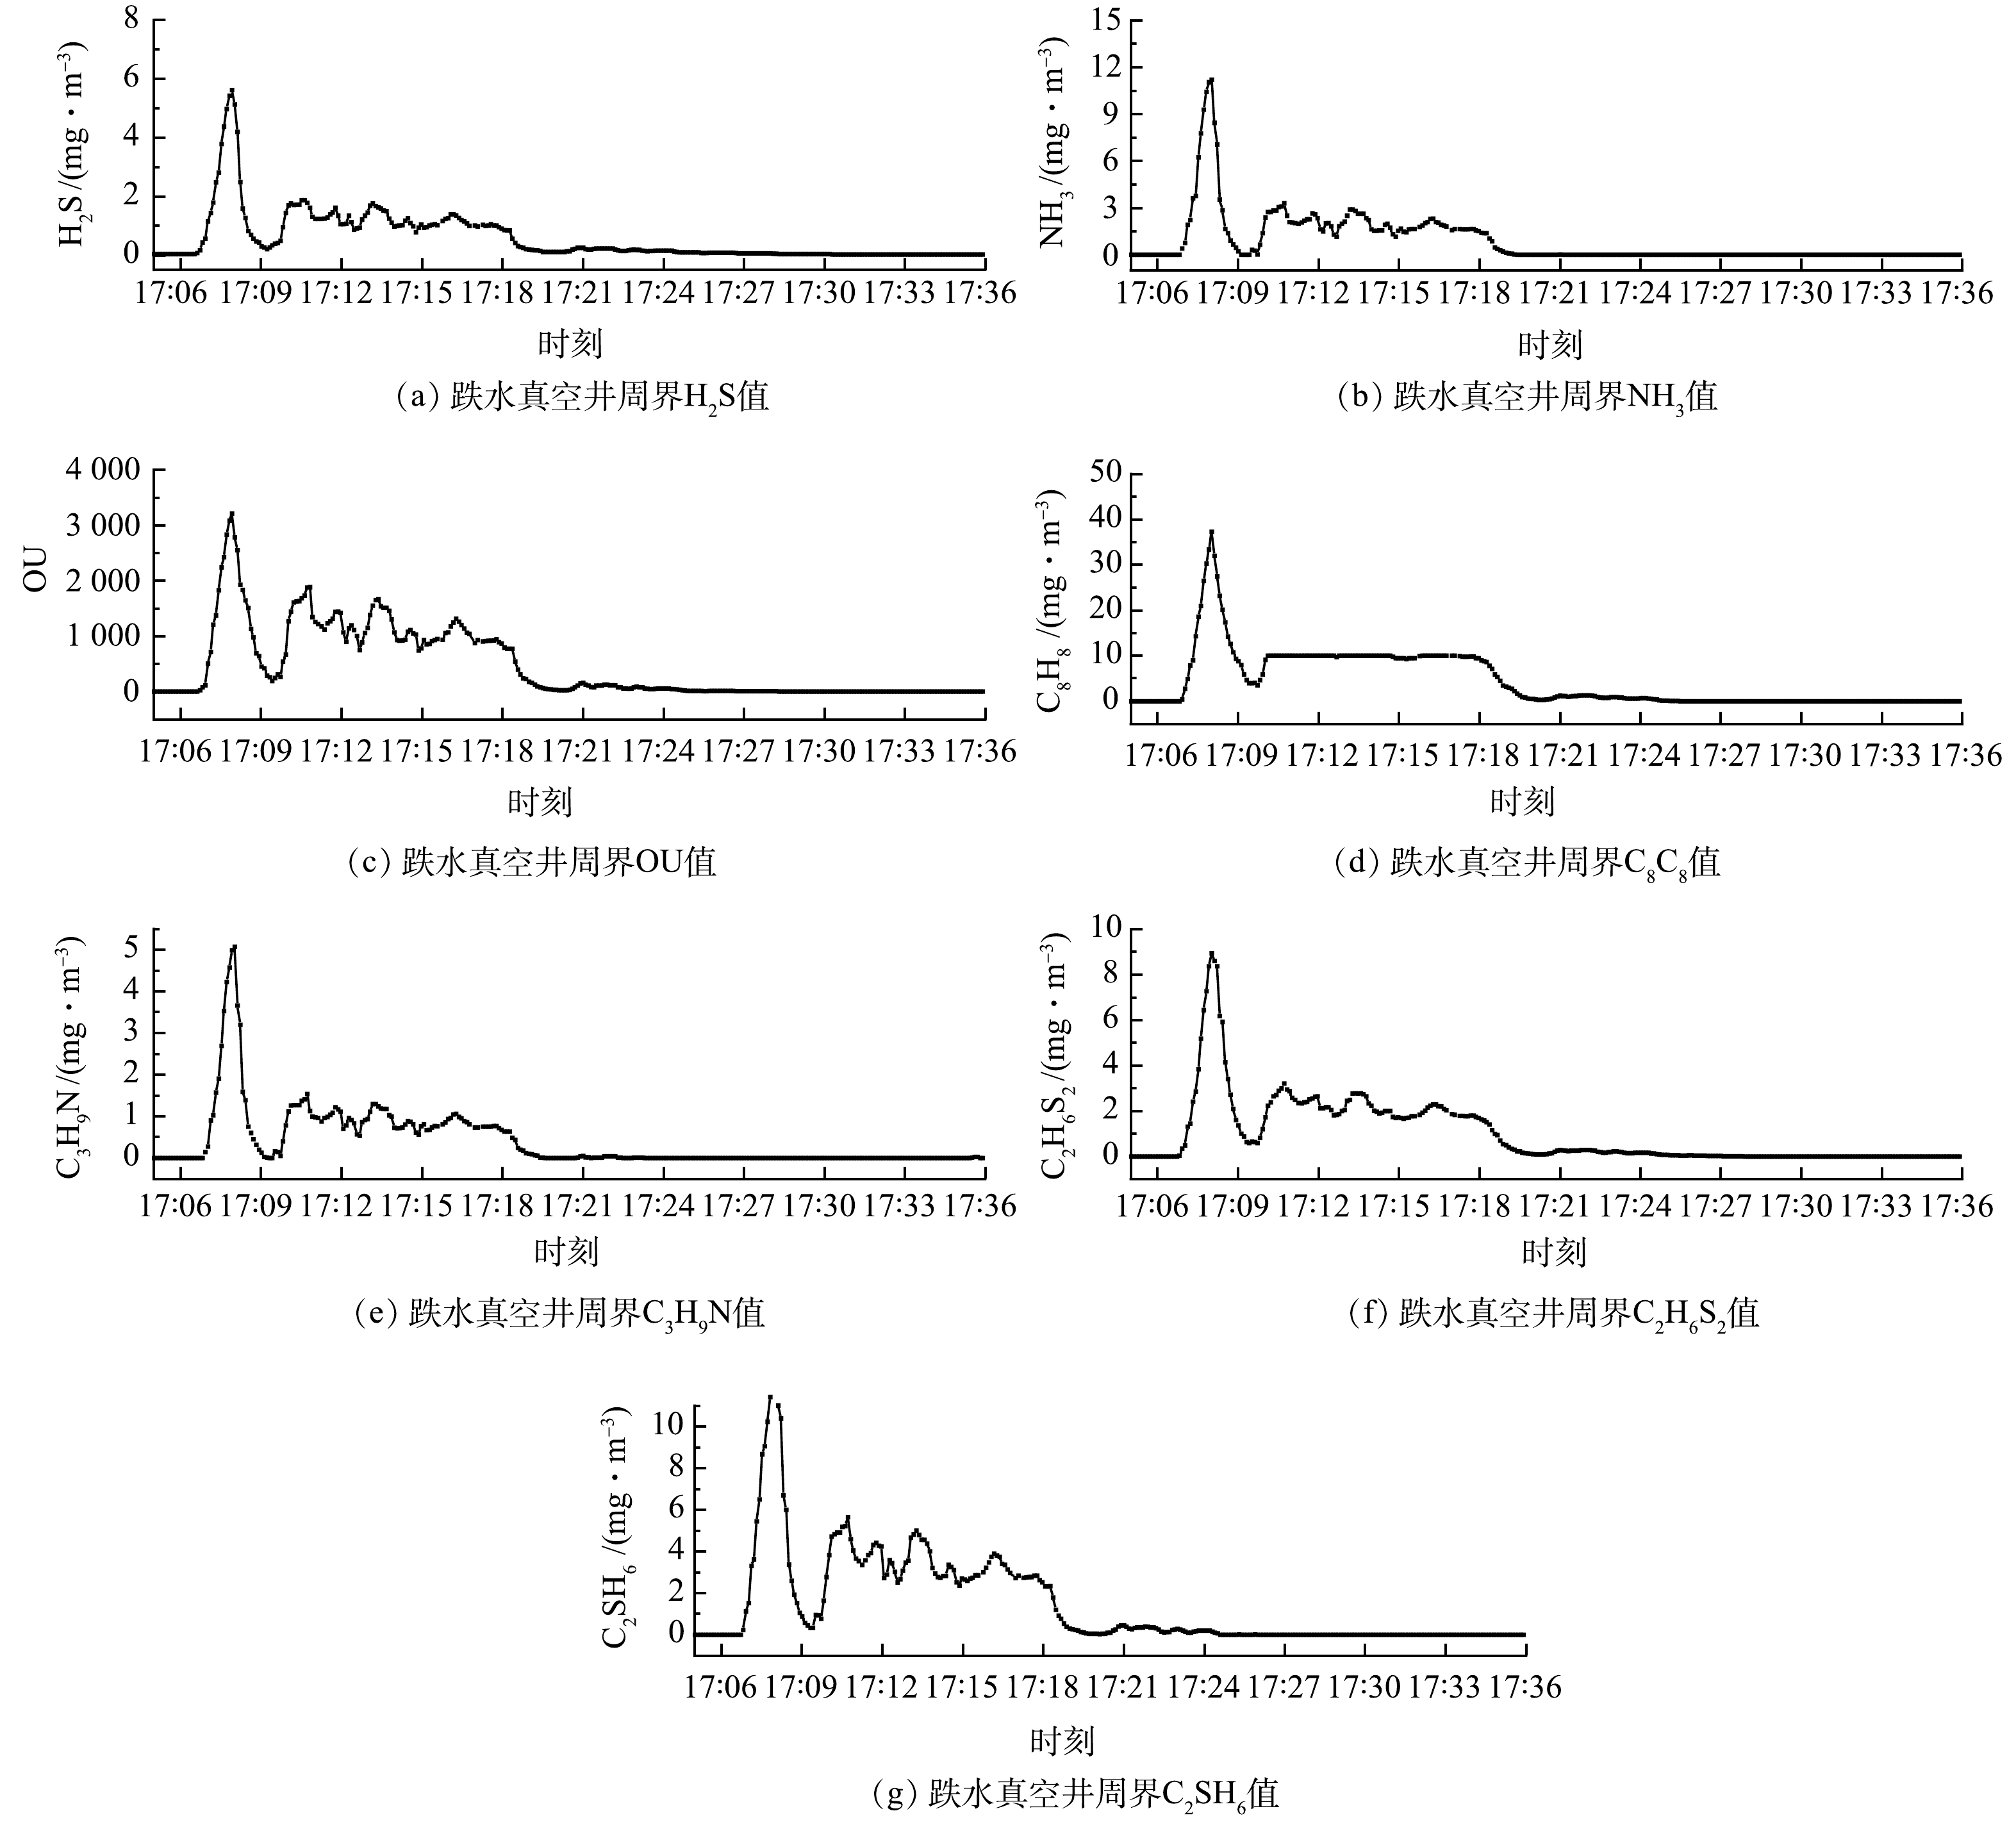
在家庭户管收集污水汇入真空井时,对真空井周围进行0.5 h的异味持续监测,监测结果如图5所示。NH3、H2S、OU、C8H8、C3H9N、C2H6S2、C2SH6峰值分别超过表1中的3级限值标准,其中NH3和H2S质量浓度峰值分别为11.21 mg·m−3和17.56 mg·m−3,超过3级限值标准的2.80和17.56倍。真空井周围异味质量浓度较高的原因是,污水进水口与真空井底部存在高差,污水跌水使真空井内污水剧烈紊动,造成污水中溶解的NH3和H2S大量逸出[16]。在该模式下的真空排水系统中,真空井是异味质量浓度最高的区域。过高的异味质量浓度给维护检修人员和附近居民均带来潜在的健康危害风险[12, 17]。因此,针对真空井周围异味质量浓度较高的问题,须采取一定的控制防范措施。
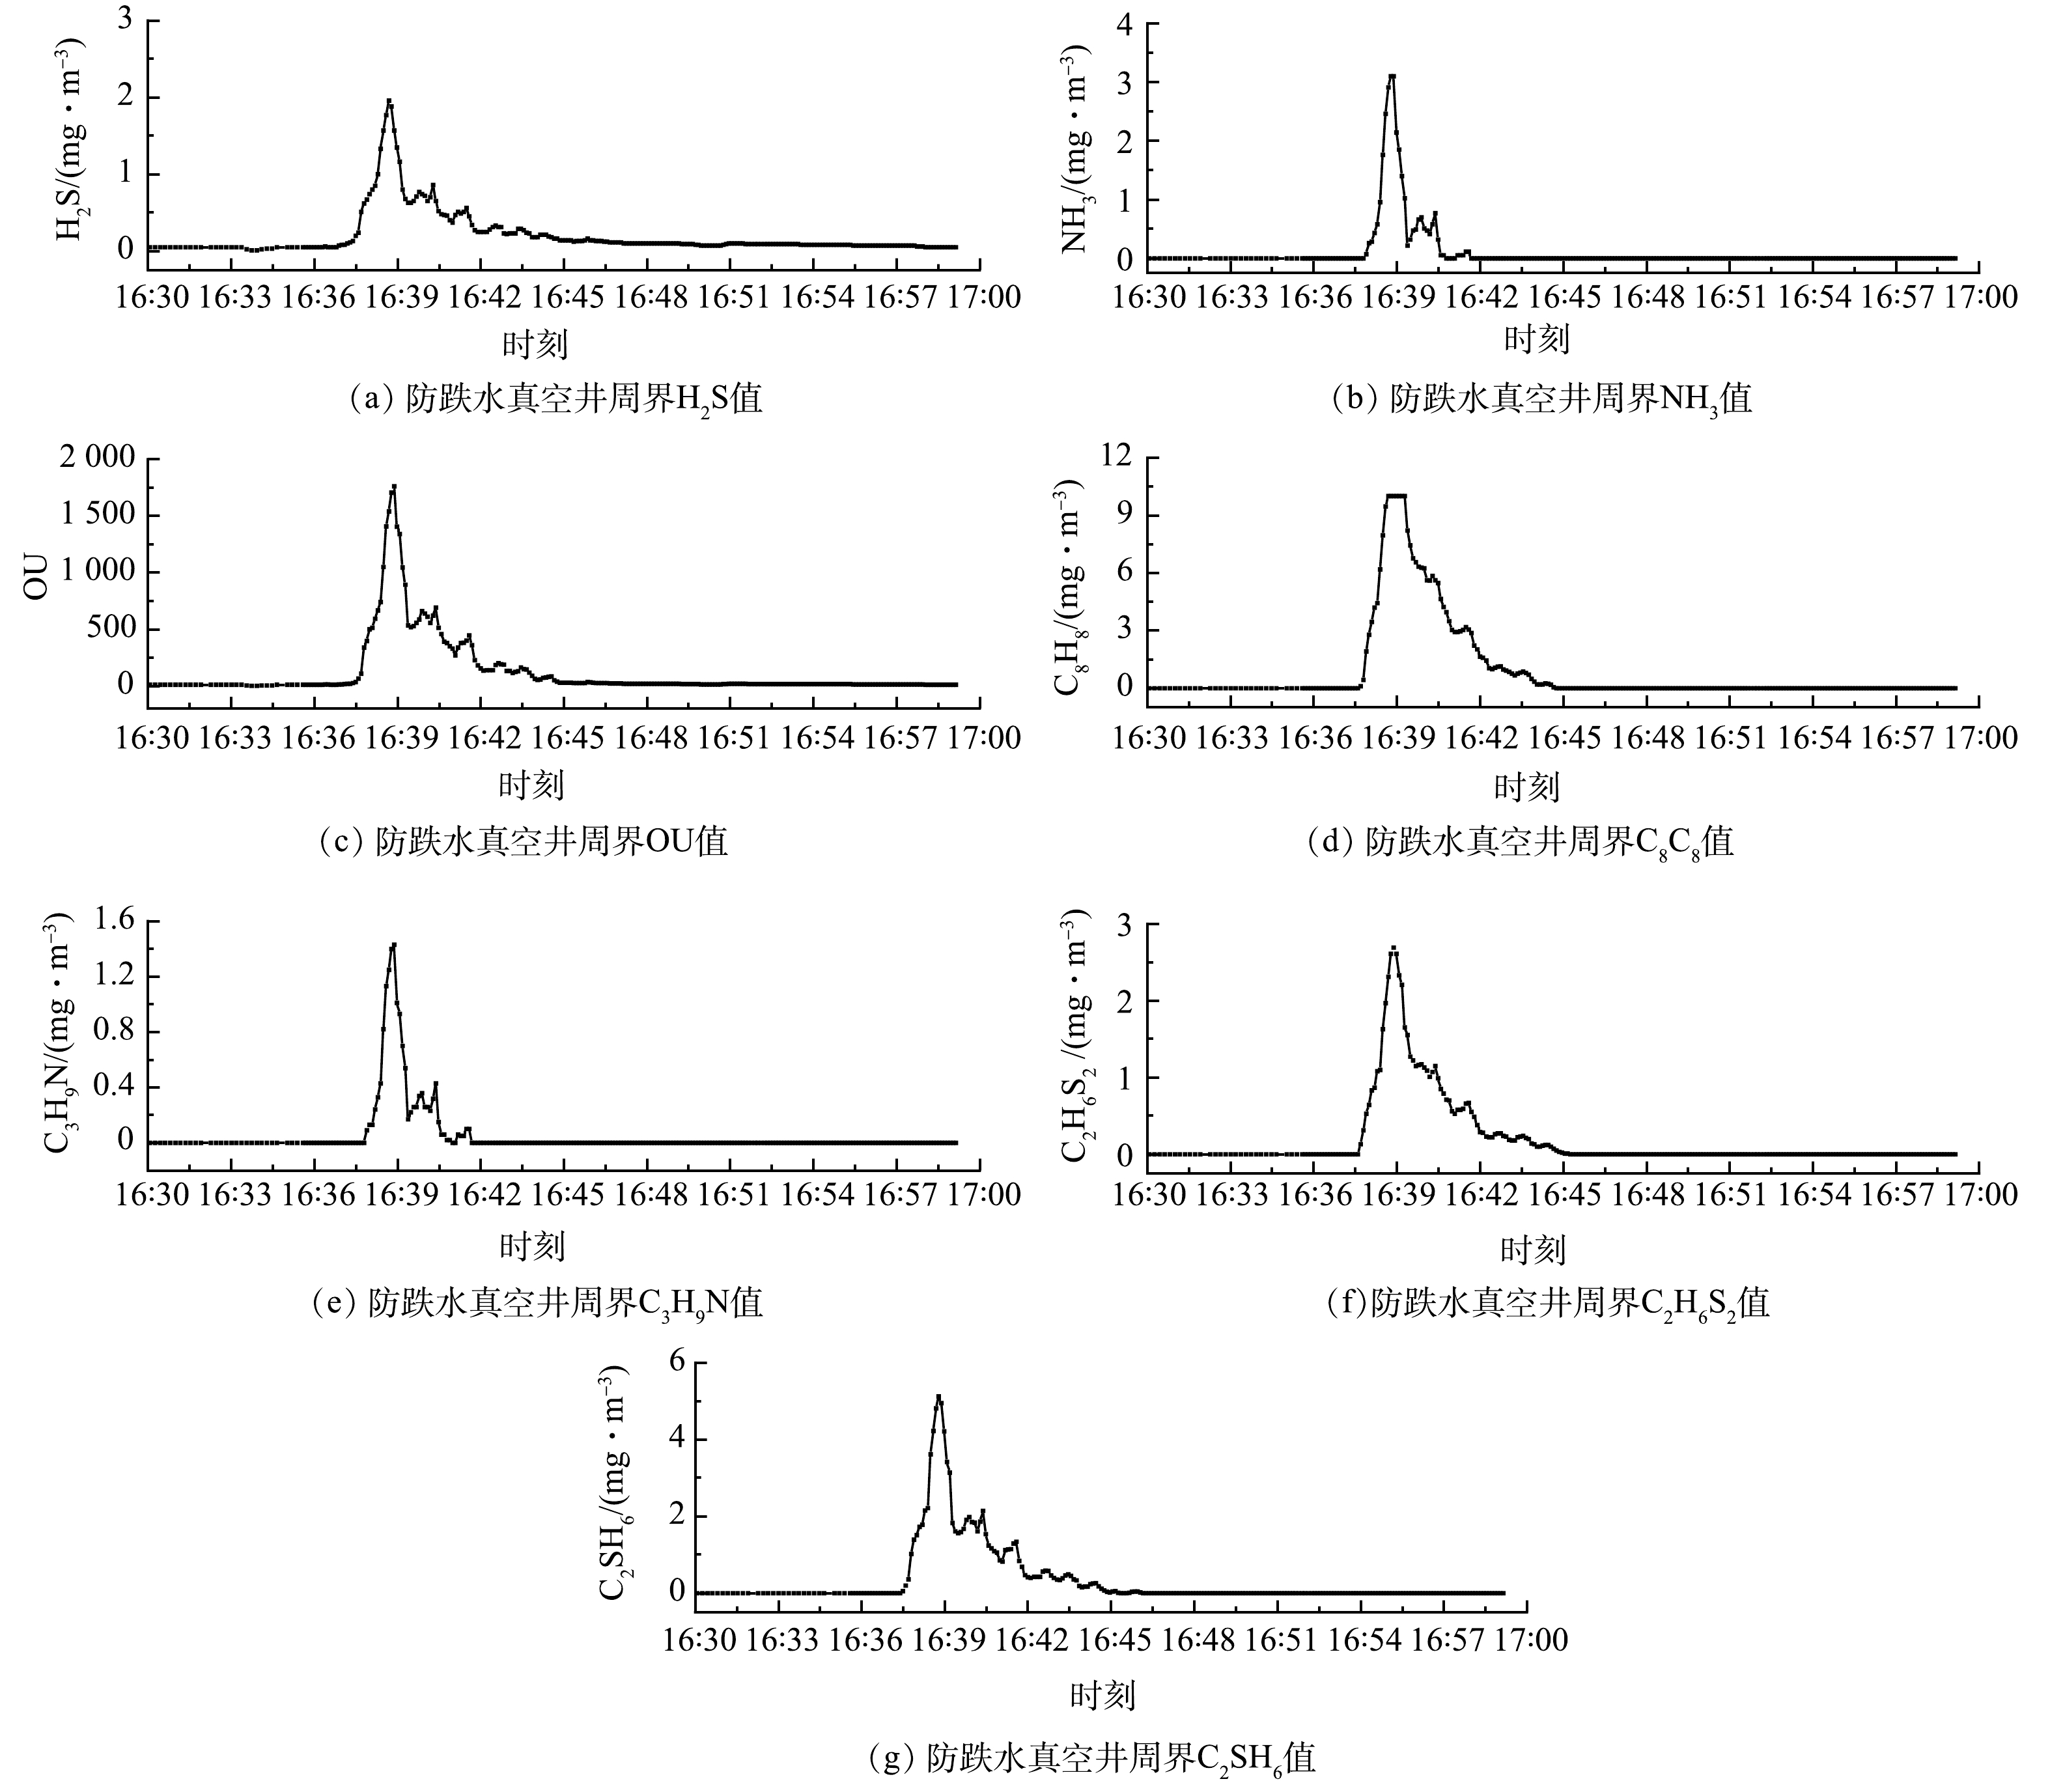
为避免污水汇入真空井内发生剧烈跌水,在真空井进水口处连接一节向真空井底部延伸的管道,该排水管管口距离井底10 cm,使得跌水高度降低约80%。在该条件下控制与跌水时相同的污水进水量后,连续0.5 h的异味监测,监测结果如图6所示。 防跌水结构设计后,NH3质量浓度峰值为3.1 mg·m−3,平均质量浓度为0.11 mg·m−3,与跌水结构相比,质量浓度峰值降低72.3%,平均质量浓度降低87.29%;H2S质量浓度峰值为1.96 mg·m−3,平均质量浓度为0.21 mg·m−3,与跌水结构相比质量浓度峰值降低65.1%,平均质量浓度降低63.00%;OU峰值为1760,平均值为131.54,与跌水结构相比峰值降低45.2%,平均值下降71.40%;C8H8质量浓度峰值为10.0 mg·m−3,平均质量浓度为0.96 mg·m−3,与跌水结构相比质量浓度峰值降低73.2%,平均质量浓度降低77.54%;C3H9N质量浓度峰值为1.43 mg·m−3,平均质量浓度为0.05 mg·m−3,与跌水结构相比质量浓度峰值降低71.8%,平均质量浓度降低86.21%;C2H6S2质量浓度峰值为2.69 mg·m−3,平均质量浓度为0.20 mg·m−3,与跌水结构相比质量浓度峰值降低69.9%,平均质量浓度降低78.73%;C2SH6质量浓度峰值为5.12 mg·m−3,平均质量浓度为0.35 mg·m−3,与跌水结构相比质量浓度峰值降低48.8%,平均质量浓度降低75.21%。
综上所述,降低跌水高度可使真空井周围异味质量浓度明显降低,各异味指标数值从开始波动到波动结束的时间也缩短。真空井跌水时,各异味指标数值开始波动到结束波动的时间约为14 min;真空井进行防跌水结构设计后,各异味指标数值开始波动到结束波动的时间约为7 min,降低跌水高度后异味持续的时间缩短约50%。因此,真空井在用井盖封盖以避免异味逸散的同时,对于结构上的设计也应尽量避免污水汇入时发生跌水,降低跌水高度可有效削弱真空井散发异味对周围居民的影响。但在进入真空井内维护维修时,工人也须做好防护措施以避免恶臭气体质量浓度过高带来的安全问题。
-
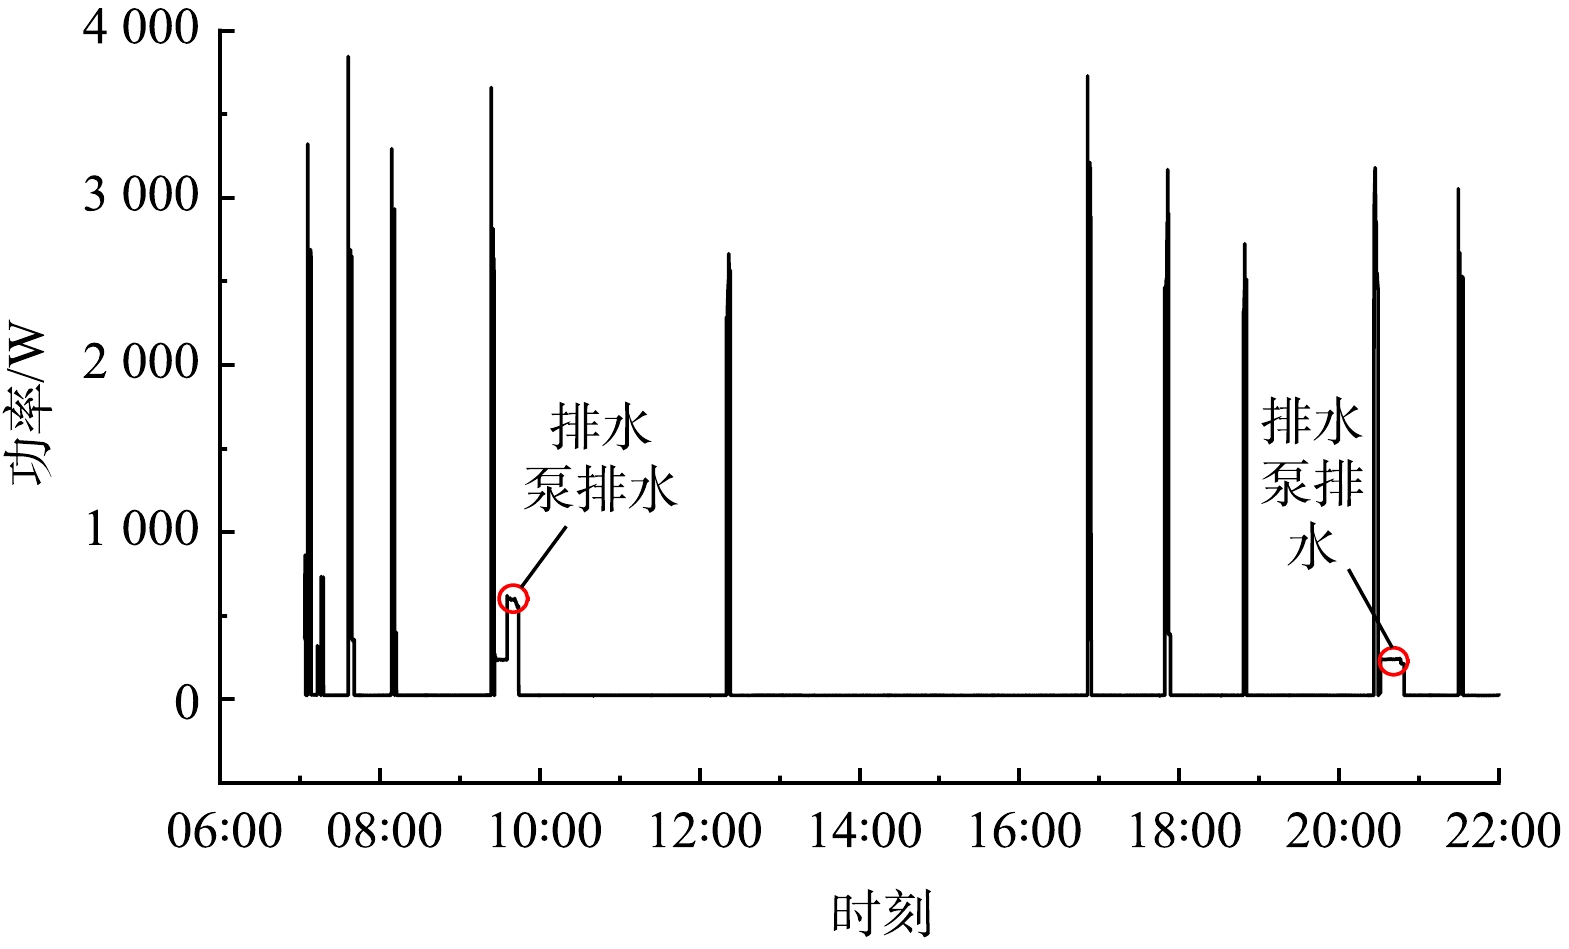
在真空排水系统运行时,实时监测真空站运行的用电功率、真空站周边异味质量浓度,探究真空站周围异味变化与真空站的运行之间的规律关系。真空站每日运行的用电功率的监测结果如图7所示。日间,用电功率在早晚用水高峰的时间段起伏较大,这与图2中的农村污水的排水规律相一致;真空泵相邻启动间隔最短时间约0.5 h,最长时间约4 h。夜间,真空排水系统停止运行,真空罐内滞留污水在夜间停留8 h。
对真空站周围异味进行连续监测,在11种异味监测指标中,未监测出VOSS、NH3、C3H9N、C2SH6、CH4S、C2H6S的质量浓度值。原因有2个方面:一方面,由于真空井跌水使得污水大部分溶解性恶臭气体逸散;另一方面,污水汇集至真空罐后,污水在真空罐内的停留时间较短,不足以使VOSS、NH3、C3H9N、C2SH6、CH4S、C2H6S这6种气体进行大量累积,使其异味质量浓度值低于监测的识别水平。
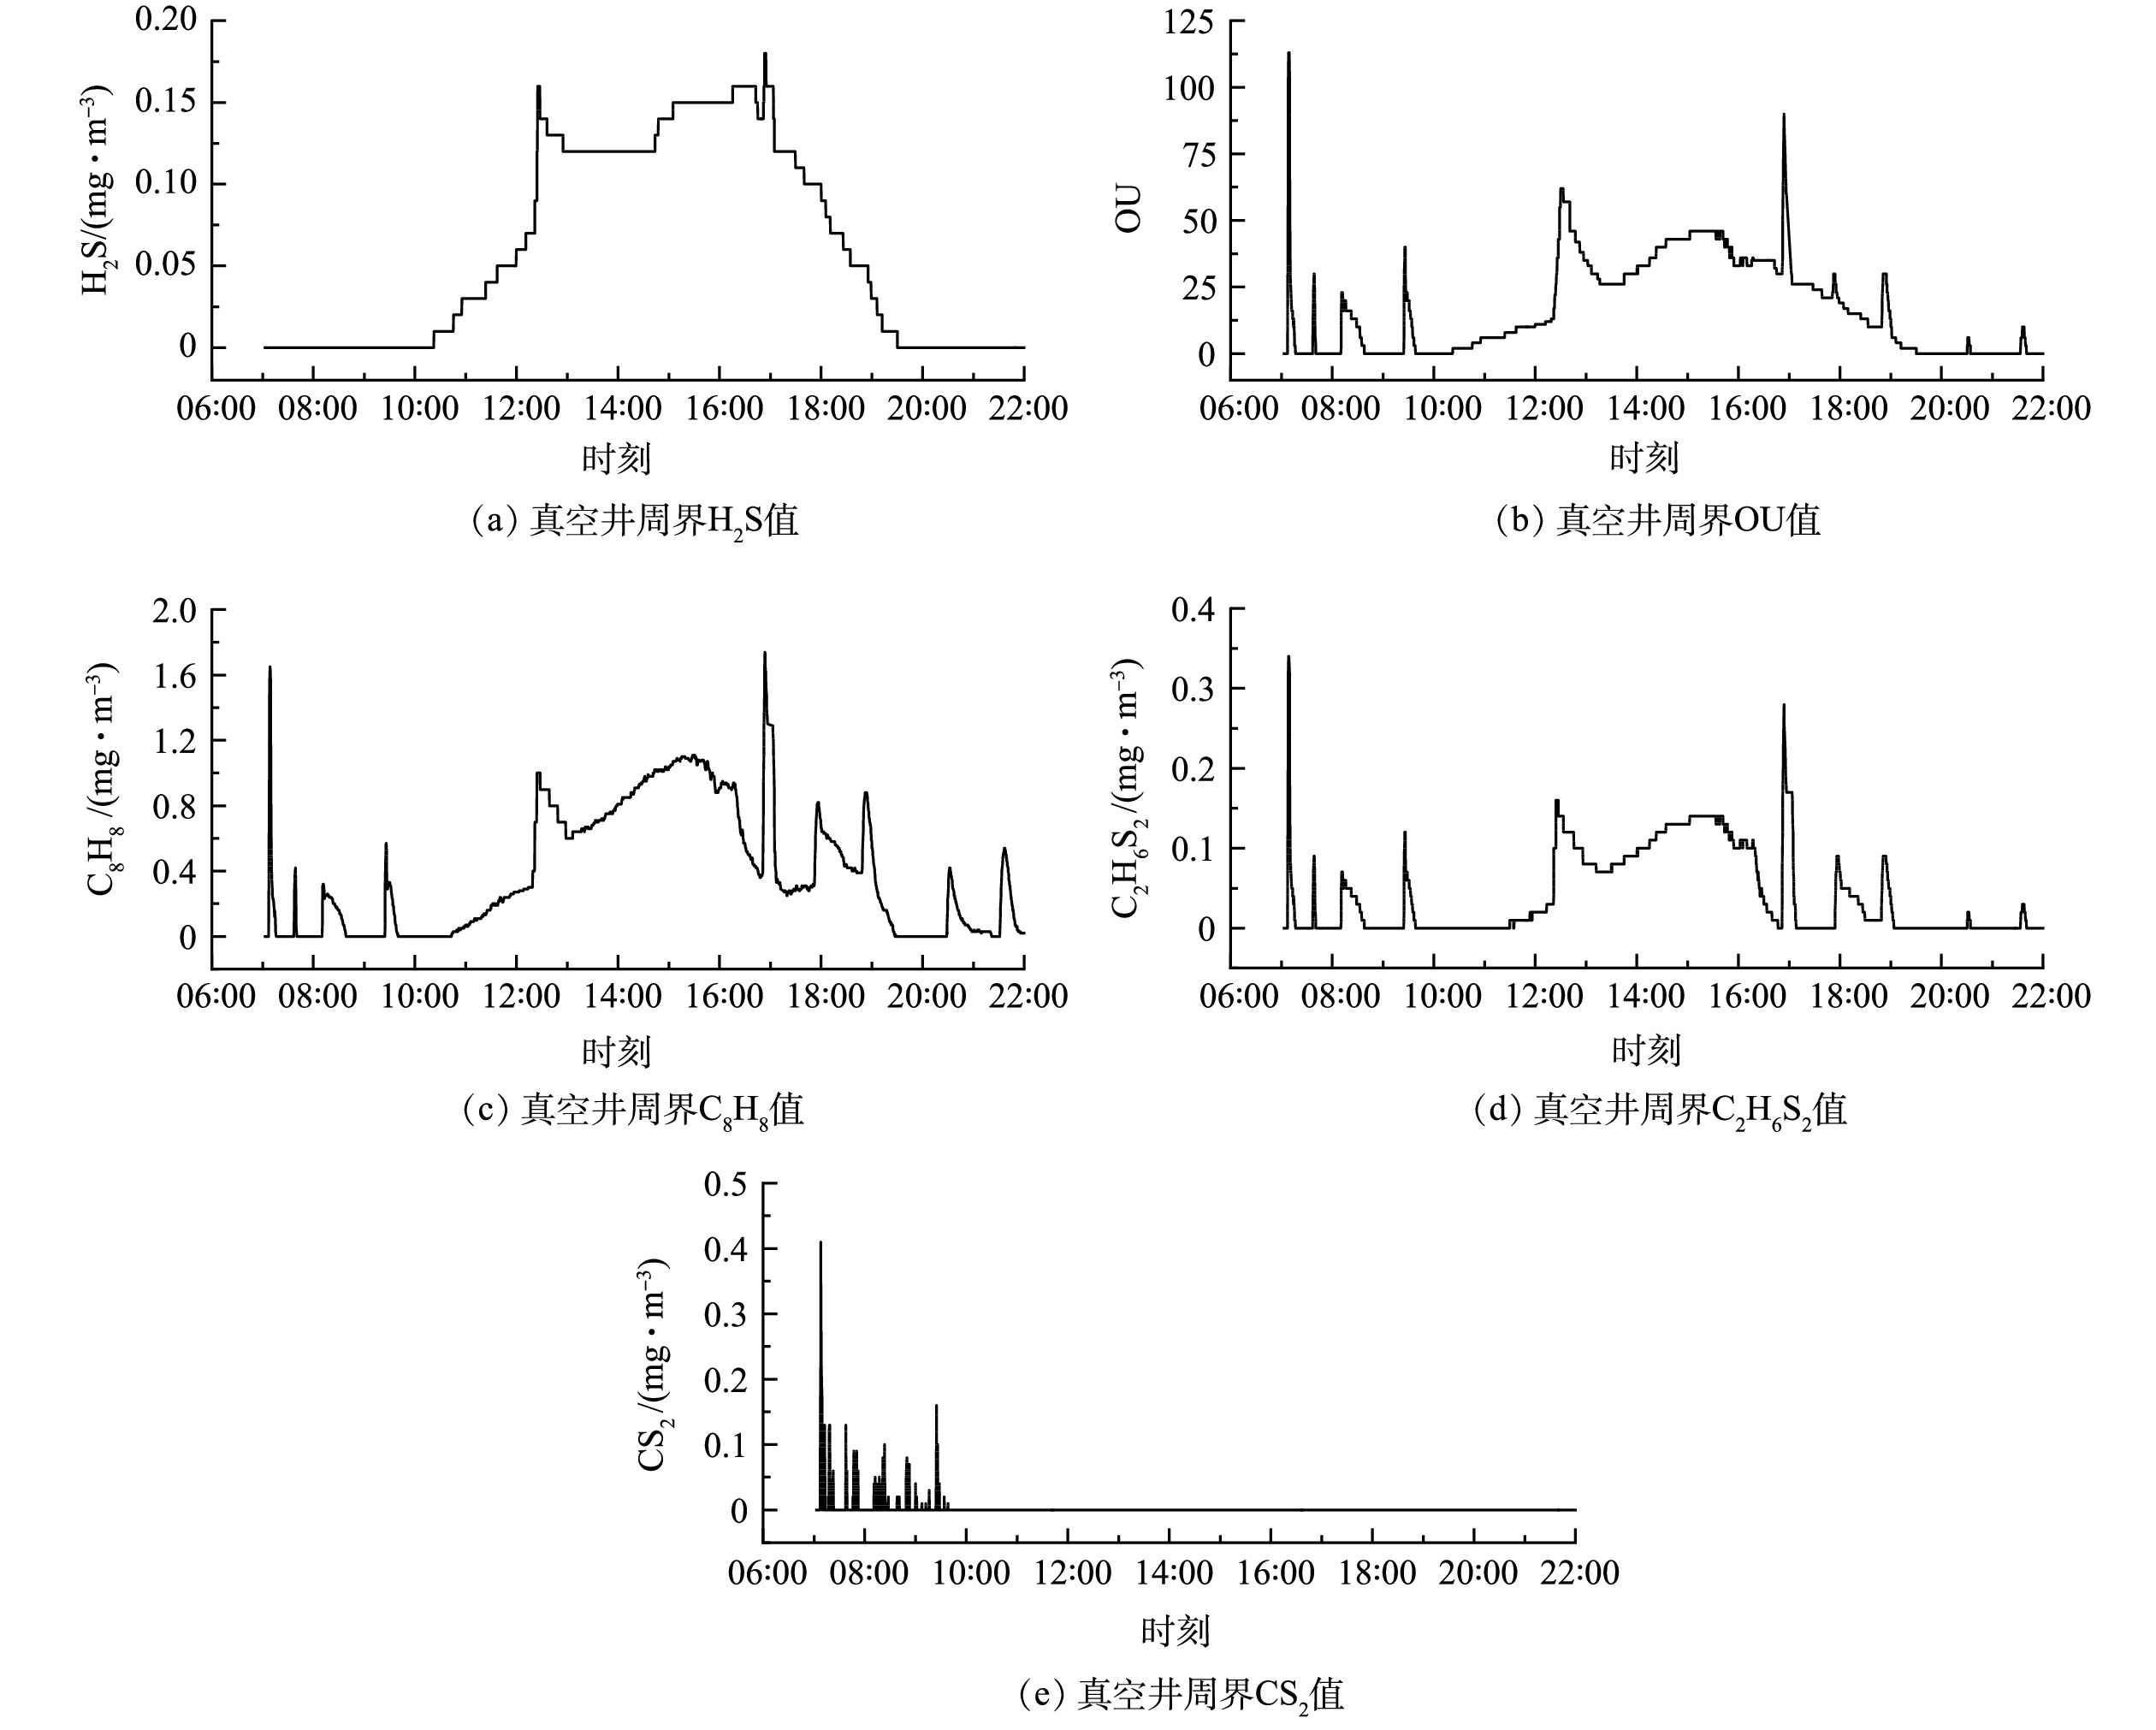
H2S 、OU、C8H8、C2H6S2、CS2恶臭气体指标监测结果如图8所示。OU、H2S、C8H8、C2H6S2指标连续监测结果整体均呈06:00—15:00异味质量浓度升高,15:00—22:00异味质量浓度下降的趋势。这与真空站所处环境温度的变化有关,已有研究[18]也表明,环境温度对异味质量浓度变化有影响。OU、C8H8、C2H6S2指标质量浓度波峰的变化受图7中真空泵的功率波峰变化的影响。在早晨07:08和下午16:53,3种异味达到质量浓度峰值,这是污水在真空罐内停留时间较长导致的:一方面,在真空罐厌氧环境下,微生物代谢产生的恶臭气体在真空罐内得到了累积;另一方面,真空罐内污水处于负压环境,根据亨利定律,微溶的气体或其他挥发性溶质在溶液中的溶解度与气体的分压成正比[19],污水中的溶解性恶臭气体在真空罐内负压作用下,从污水中抽离后在真空罐内得到了累积。在早晨07:08和下午16:53,真空泵启动抽吸真空罐内空气前,污水在真空罐内分别停留了8 h和4 h的较长时间。
H2S气体在真空站周围质量浓度波峰变化受真空泵启动的影响较小,这是真空排水系统收集的新鲜污水硫化物较小导致的[16]。新汇入的污水导致真空罐内污水紊乱,加速了污水中硫化氢的逸出,随着真空排水系统运行真空泵排放空气在真空站内的累积,硫化氢质量浓度变化也显示与OU、C8H8、C2H6S2相似的质量浓度变化趋势。CS2气体排放质量浓度满足表1中规定的1级标准,该气体排放质量浓度最高的时刻集中于早晨,后续并未检出。原因可能是,该气体主要来源于真空罐夜间留存污水的缓慢释放和累积,日间真空泵运行启动的间隔停留时间不足以使CS2大量累积。
可以看出,真空站的运行功率变化与异味质量浓度变化呈显著相关性(表3)。OU、H2S、C8H8、C2H6S2指标与功率呈负相关。原因可能是,真空泵启动排气的时间与异味质量浓度上升的时间存在时间差。由真空站运行功率和逸散质量浓度变化的实时监测结果可以看出,在真空泵开启排气后,异味质量浓度的开始波动时间延迟6~10 s。
异味气体常用的除臭方法包括直接焚烧法、催化剂氧化法、臭气氧化法、酸碱洗净法、臭气氧化法、化学反应法、生物脱臭法、活性炭物理吸附法、土壤脱臭法等[20]。真空站距离村民居住区较近,不宜采用化学处理方法,一般采用活性炭除臭或生物脱臭法除臭。但活性炭物理吸附的方式对恶臭气体的吸附有限,因此,该方式适用于真空排水系统规模较小、受冬季低温影响异味质量浓度较低的情况[21-22]。生物法脱臭通过微生物吸附分解恶臭物质。生物法通常是在常温下进行的,在北方冬季温度较低,微生物的活性降低时,该方法适用性较差。常温环境下,生物法除臭具有总体耗能低、运行维护少、去除率高、二次污染较少等优势[23]。采用活性炭除臭和生物脱臭法除臭相结合的方式进行优势互补。在冬季,受低温的影响,在生物法除臭效率降低且系统逸散异味质量浓度降低时,采用活性炭物理吸附也可达到较好的吸附效果。
-
1)不同过水水质的户内管道中H2S质量浓度均超过规定的2级限值标准,TBW管道中的NH3的质量浓度分别为TGW和KGW管道中的18.09和9.34倍。C3H9N、C2H6S2、OU在TBW管道中的质量浓度峰值也远高于另外2种过水管道中的质量浓度峰值。不同水质管道异味质量浓度最高的是TBW管道,其次是KGW管道,最后为TGW管道。
2)真空井周围是真空排水系统中异味质量浓度最高的区域,NH3、H2S、OU、C8H8、C3H9N、C2H6S2、C2SH6均超过规定的3级限值标准, NH3和H2S质量浓度峰值分别超过3级限值标准的2.80和17.56倍。真空井的防跌水改造使真空井周围异味明显降低, NH3和H2S指标的质量浓度峰值分别下降72.3%和65.1%。
3)真空站周围异味质量浓度波动与真空排水系统的真空泵启停节奏有关,针对北方农村地区真空站异味问题,可采用活性炭吸附和生物脱臭法结合的方式进行除臭。
农村真空排水系统异味产生规律及控制措施
Odor generation pattern and control measures of rural vacuum drainage system
-
摘要: 为探究农村真空排水系统异味逸散对周围居民的潜在健康风险,采用真空排水实验装置并结合异味分区监测和相关性分析等方法,研究了农村真空排水系统家庭户管、真空井、真空站等全流程的异味逸散规律。结果表明:农村家庭户管卫生间黑水(TBW)、卫生间灰水(TGW)、厨房灰水(KGW)管道中H2S质量浓度平均值分别为0.08、0.06、0.06 mg·m−3,均达到恶臭污染物厂界标准(GB 14554-1993) 2级厂界标准限值(0.06 mg·m−3); TBW管道中NH3、C3H9N、C2H6S2、OU的异味质量浓度峰值为5.79、2.58、0.18、337 mg·m−3,明显高于在TGW和KGW管道中的质量浓度峰值(0.32和0.62 mg·m−3,0.18和0.31 mg·m−3,0.06和0.05 mg·m−3,136和170 mg·m−3); 真空井周围NH3和H2S质量浓度峰值分别超过3级厂界标准限值(4.0 mg·m−3、0.32 mg·m−3)的2.80和17.56倍,真空井防跌水结构改造后NH3和H2S峰值质量浓度分别下降72.3%和65.1%;真空站周围OU、H2S、CS2、C8H8、C2H6S2质量浓度变化与其运行电功率变化的相关系数分别为−0.370、−0.452、−0.169、−0.426、−0.379。由此可知,农村真空排水系统存在H2S等异味气体质量浓度超标的现象,不同水质管道异味特征不同,真空井是整个真空排水系统异味质量浓度最高的区域,对真空井进行防跌水结构改造可使真空井周围异味质量浓度明显降低,真空站周围异味质量浓度变化与其运行功率变化具有显著相关性。该研究结果可为农村排水技术的改良设计和参数优化提供参考。Abstract: In order to investigate the potential health risk of odor escape from rural vacuum sewer system to the surrounding residents, the odor escape law of the whole process of rural vacuum sewer system, household sewer, vacuum well and vacuum station was studied by using the vacuum sewer experimental device combined with odor zoning monitoring and correlation analysis, etc. The results showed that the average H2S mass concentrations in toilet black water (TBW), toilet gray water (TGW), and kitchen gray water (KGW) sewer in rural households were 0.08, 0.06, and 0.06 mg·m−3, respectively, all of them reached the standard limit (0.06 mg·m−3) of class 2 plant boundary for malodorous pollutants (GB 14554-1993). The peak odor mass concentrations of NH3、C3H9N、C2H6S2 and OU in the TBW sewer were 5.79, 2.58, 0.18, 337 mg·m−3, respectively, which were significantly higher than the peak mass concentrations in the TGW and KGW sewers (0.32 and 0.62 mg·m−3, 0.18 and 0.31 mg·m−3, 0.06 and 0.05 mg·m−3, 136 and 170 mg·m−3). The peak mass concentrations of NH3 and H2S around the vacuum wells are 2.80 and 17.56 times higher than the standard limits of level 3 plant boundary (4.0 mg·m−3, 0.32 mg·m−3), respectively, and the peak mass concentrations of NH3 and H2S decreased by 72.3% and 65.1%, respectively after the transformation of the anti-fall water structure of vacuum wells. The correlation coefficients between the changes in mass concentrations of OU, H2S, CS2, C8H8, and C2H6S2 around the vacuum station and their changes in operating electrical power were −0.370, −0.452, −0.169, −0.426 and −0.379, respectively. This showed that over standard phenomenon occurred for the mass concentration of H2S and other odorous gases in the rural vacuum sewer system, different water quality pipes had different odor characteristics, the vacuum well was the area with the highest odor quality concentration in the whole vacuum sewer system, the anti-fall structure modification of vacuum wells could significantly reduce the odor quality concentration around vacuum wells, and the change of odor quality concentration around vacuum stations significantly correlated with the change of its operating power. The research results can provide a reference for the improvement design and parameter optimization of rural drainage technology.
-
Key words:
- vacuum sewerage /
- odor /
- prevention and control measures /
- generation pattern /
- rural
-

-
表 1 GB 14554-1993 恶臭污染物厂界标准值
Table 1. Standard value of odor pollutants factory boundary in GB 14554-1993
厂界标
准级别监测项目 氨气
(NH3)/
( mg·m−3)三甲胺
(C3H9N)/
( mg·m−3)硫化氢
(H2S)/
( mg·m−3)甲硫醇
(CH4S) /
( mg·m−3)甲硫醚
(C2SH6) /
( mg·m−3)二甲基二硫醚
(C2H6S2)/
( mg·m−3)二硫化碳
(CS2) /
( mg·m−3)苯乙烯
(C8H8) /
( mg·m−3)臭气
(OU)1级 1.0 0.05 0.03 0.004 0.03 0.03 2.0 3.0 10 2级 1.5 0.08 0.06 0.007 0.07 0.06 3.0 5.0 20 3级 4.0 0.45 0.32 0.020 0.55 0.42 8.0 14 60 表 2 真空排水系统异味质量浓度峰值
Table 2. Peak concentration of odor in vacuum drainage system
监测点位 监测项目 NH3/
(mg·m−3)C3H9N/
(mg·m−3)H2S/
(mg·m−3)CH4S/
(mg·m−3)C2SH6/
( mg·m−3)C2H6S2/
( mg·m−3)CS2/
(mg·m−3)C8H8/
(mg·m−3)OU VOCS/
(mg·m−3)C2H6S/
(mg·m−3)卫生间黑水管 5.793) 2.583) 0.122) 0 0.01 0.182) 0.49 0.84 3373) 0 0 卫生间灰水管 0.32 0.182) 0.12) 0 0 0.062) 0.44 0.84 1363) 0 0 厨房灰水管 0.62 0.312) 0.112) 0.012) 0.02 0.05 1) 0.23 0 1703) 0 0 真空井 11.213) 5.073) 5.623) 0 13.563) 8.943) 0.14 37.293) 32113) 0 0 真空站 0 0 0.182) 0 0 0.34 1) 0.41 1.74 1133) 0 0 注:1) 超过1级厂界标准限值;2) 超过2级厂界标准限值;3) 超过3级厂界标准限值。 表 3 异味质量浓度和电功率spearman分析结果
Table 3. Spearman analysis results of odor concentration and electrical power
项目 OU H2S CS2 C8H8 C2H6S2 功率 OU 1 0.906** −0.019 0.932** 0.882** −0.370** H2S 1 −0.182** 0.857** 0.738** −0.452** CS2 1 −0.57** 0.024 0.169** C8H8 1 0.904** −0.426** C2H6S2 1 −0.379** 功率 1 注: **表示在0.01水平(双侧)上显著相关。 -
[1] 陈丽琴. 真空排水在排水系统中的设计理论研究 [D]. 重庆: 重庆大学, 2011. [2] TERRYN I C, LAZAR G. Driving forces affecting the adoption of eco-innovation: A survey on vacuum sewer systems[J]. Environmental Engineering and Management Journal, 2016, 15(3): 589-598. doi: 10.30638/eemj.2016.064 [3] HUMBAL C, GAUTAM S, TRIVEDI U. A review on recent progress in observations, and health effects of bioaerosols[J]. Environmental International, 2018, 118(9): 189-193. [4] TERRYN I, COCARCEA A, LAZAR G. Mitigation of hazardous air pollutant emissions: Vacuum vs. conventional sewer system[J]. Environmental Engineering and Management Journal, 2017, 16(4): 809-819. doi: 10.30638/eemj.2017.082 [5] 叶美瀛, 王平波, 刘宇奇, 等. 室外真空排水系统及其在我国农村生活污水治理工程中的应用[J]. 环境工程技术学报, 2021, 11(6): 1196-1201. [6] 韩彦召, 程世昆, 严巾堪, 等. 负压排水真空便器冲水噪声的影响因素[J]. 环境工程学报, 2022, 16(4): 1400-1406. [7] 孙瑞敏. 我国农村生活污水排水现状分析[J]. 能源与环境, 2010(5): 33-34. [8] 李文凯, 郑天龙, 刘俊新. 农村污水管道堵塞成因分析与解决对策[J]. 环境工程学报, 2020, 14(7): 1966-1974. [9] 陶俊尧, 董泽华, 董中华. 建筑排水管道室内串味的防治技术[J]. 福建建筑, 2017(12): 79-82. [10] 张钊彬. 污水处理厂高标准除臭技术研究 [D]. 哈尔滨: 哈尔滨工业大学, 2013. [11] SMET E, LENS P, LANGENHOVE H V. Treatment of waste gases contaminated with odorous sulfur compounds[J]. Critical Reviews in Environmental Science and Technology, 1998, 28(1): 89-117. doi: 10.1080/10643389891254179 [12] ZHANG L, DE SCHRYVER P, DE GUSSEME B, et al. Chemical and biological technologies for hydrogen sulfide emission control in sewer systems: A review[J]. Water Research, 2008, 42(1/2): 1-12. [13] PUI D Y, CHEN S C, ZUO Z. PM2.5 in China: Measurements, sources, visibility and health effects, and mitigation[J]. Particuology, 2014, 13(4): 1-26. [14] 朱雁伯, 王溪蓉, 张礼文, 等. 排水系统中硫化氢的危害及预防措施[J]. 中国给水排水, 2000, 16(9): 45-47. doi: 10.3321/j.issn:1000-4602.2000.09.014 [15] MARLENI N, GRAY S, SHARMA A, et al. Impact of water source management practices in residential areas on sewer networks: A review[J]. Water Science and Technology, 2012, 65(4): 624-642. doi: 10.2166/wst.2012.902 [16] 谷天峰. 排水系统恶臭污染及挥发性有机物的控制效果与机制研究 [D]. 杭州: 浙江大学, 2019. [17] JIANG G, SUN J, SHARMA K R, et al. Corrosion and odor management in sewer systems[J]. Current Opinion in Biotechnology, 2015, 33: 192-197. doi: 10.1016/j.copbio.2015.03.007 [18] 李元元. 垃圾卫生填埋场臭气排放规律及现场除臭效果和方案研究 [D]. 武汉: 华中科技大学, 2008. [19] 李新民, 罗学科, 李文, 等. 基于亨利定律的水中臭氧浓度检测方法研究[J]. 中国环境监测, 2021, 37(4): 150-155. [20] 张静, 张樑, 陈明. 抑制城镇污水处理厂恶臭气体的产生和迁移[J]. 环境科学与管理, 2012, 37(2): 84-89. [21] 何怡. 城市污水处理厂生物过滤除臭工艺设计方法优化研究 [D]. 北京: 清华大学, 2014. [22] 李珊红, 李彩亭, 谭娅, 等. 恶臭气体的治理技术及其进展[J]. 四川环境, 2005, 24(4): 45-49. doi: 10.3969/j.issn.1001-3644.2005.04.013 [23] 王爱杰, 徐潇文, 任南琪, 等. 污水厂臭气生物处理技术研究现状与发展趋势[J]. 中国沼气, 2005, 23(3): 15-19. -


 下载:
下载:
