-

图 1 实验装置及取样点位置
Figure 1. Schematic diagram of experimental setup and sampling positions
-
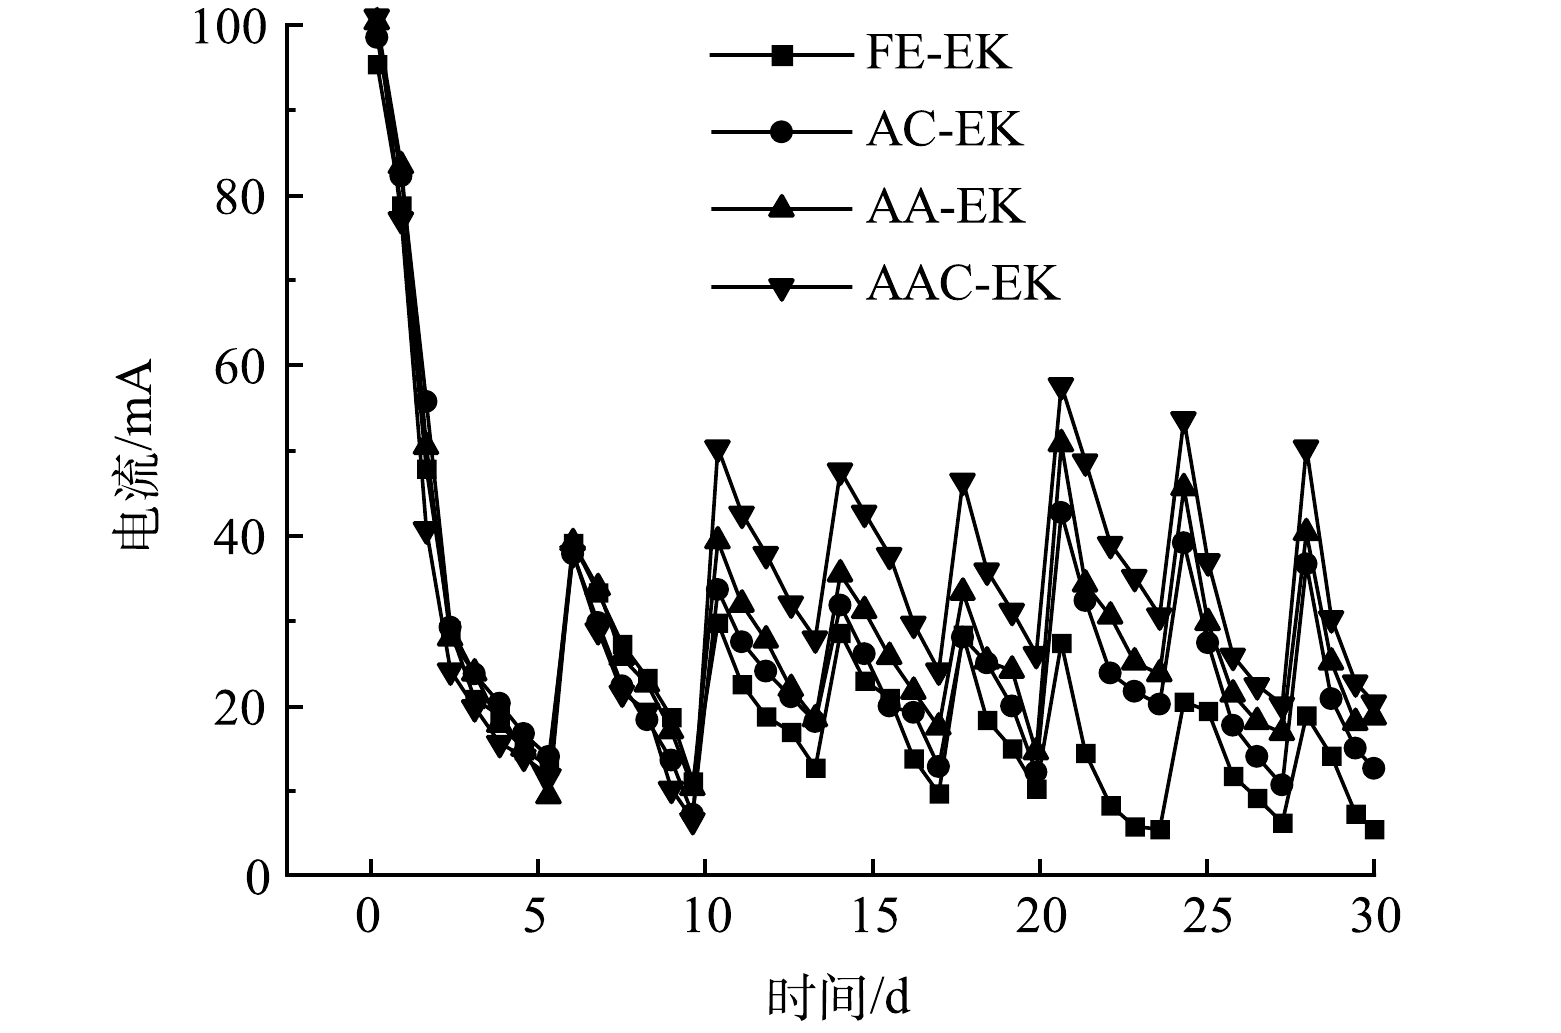
图 2 实验过程中电流变化
Figure 2. Current changes during experiment
-
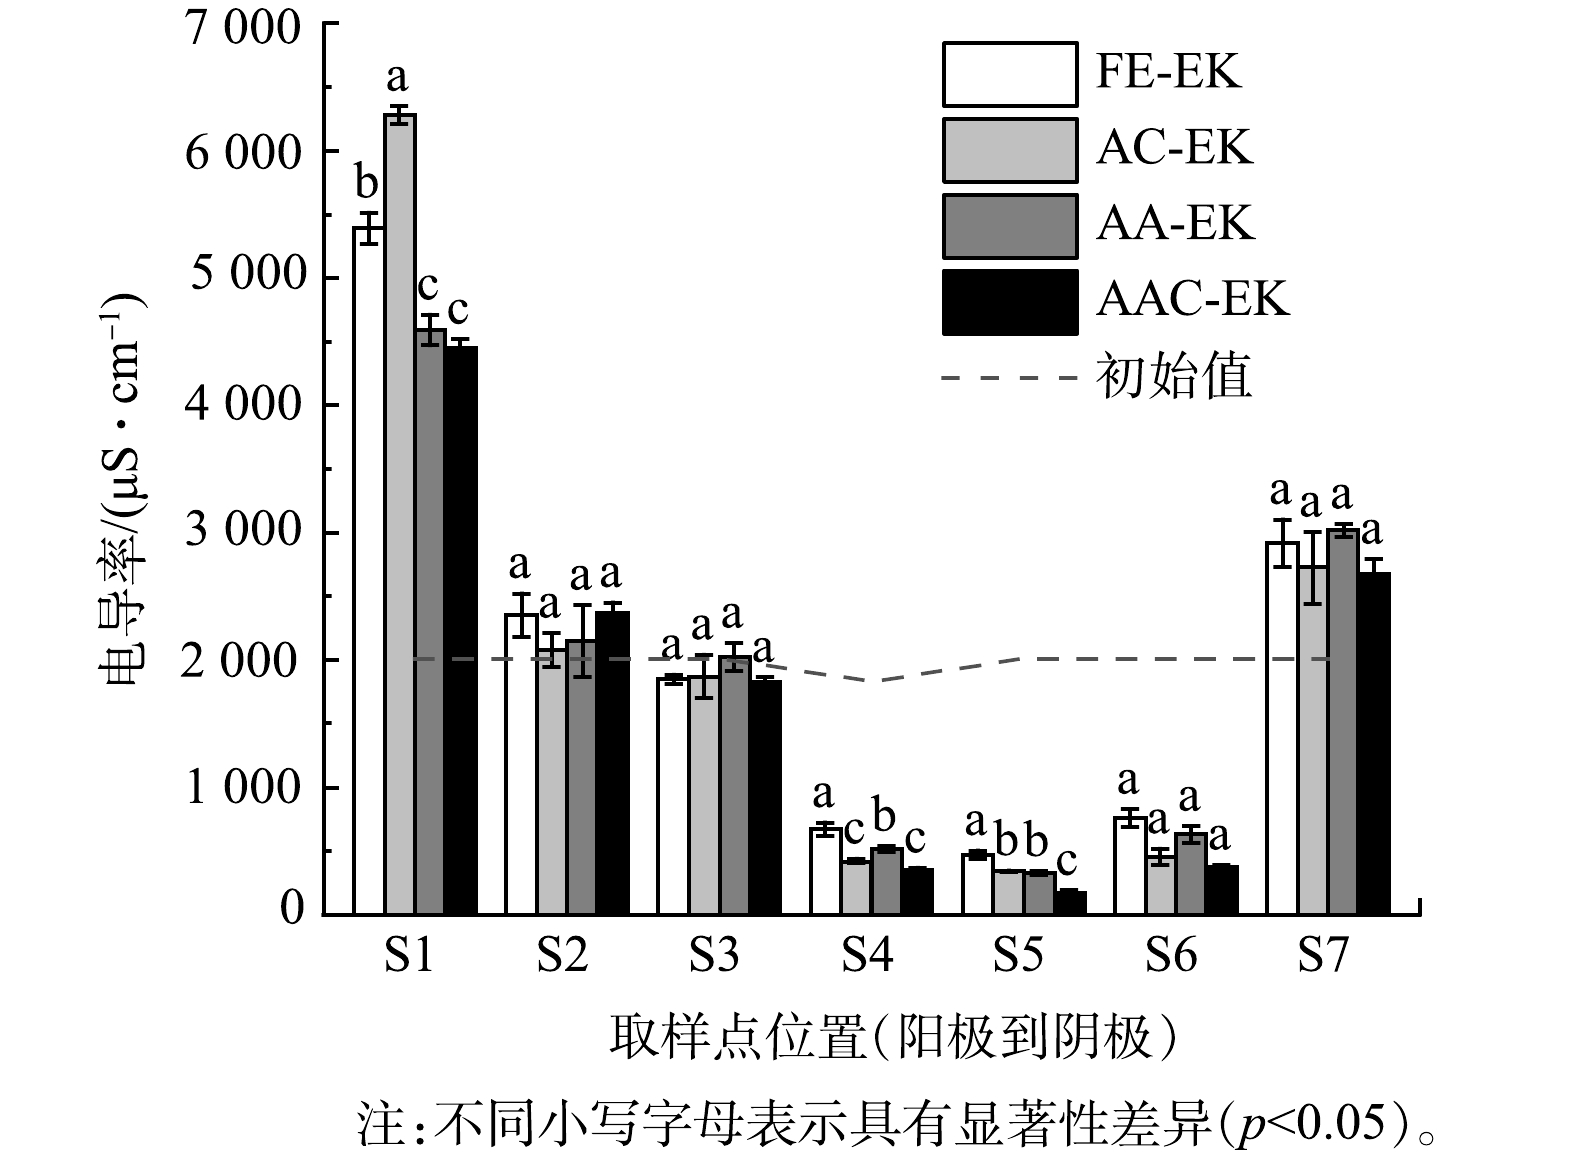
图 3 电动修复后土壤电导率分布
Figure 3. Distribution of conductivity in soil after electrokinetic treatment
-
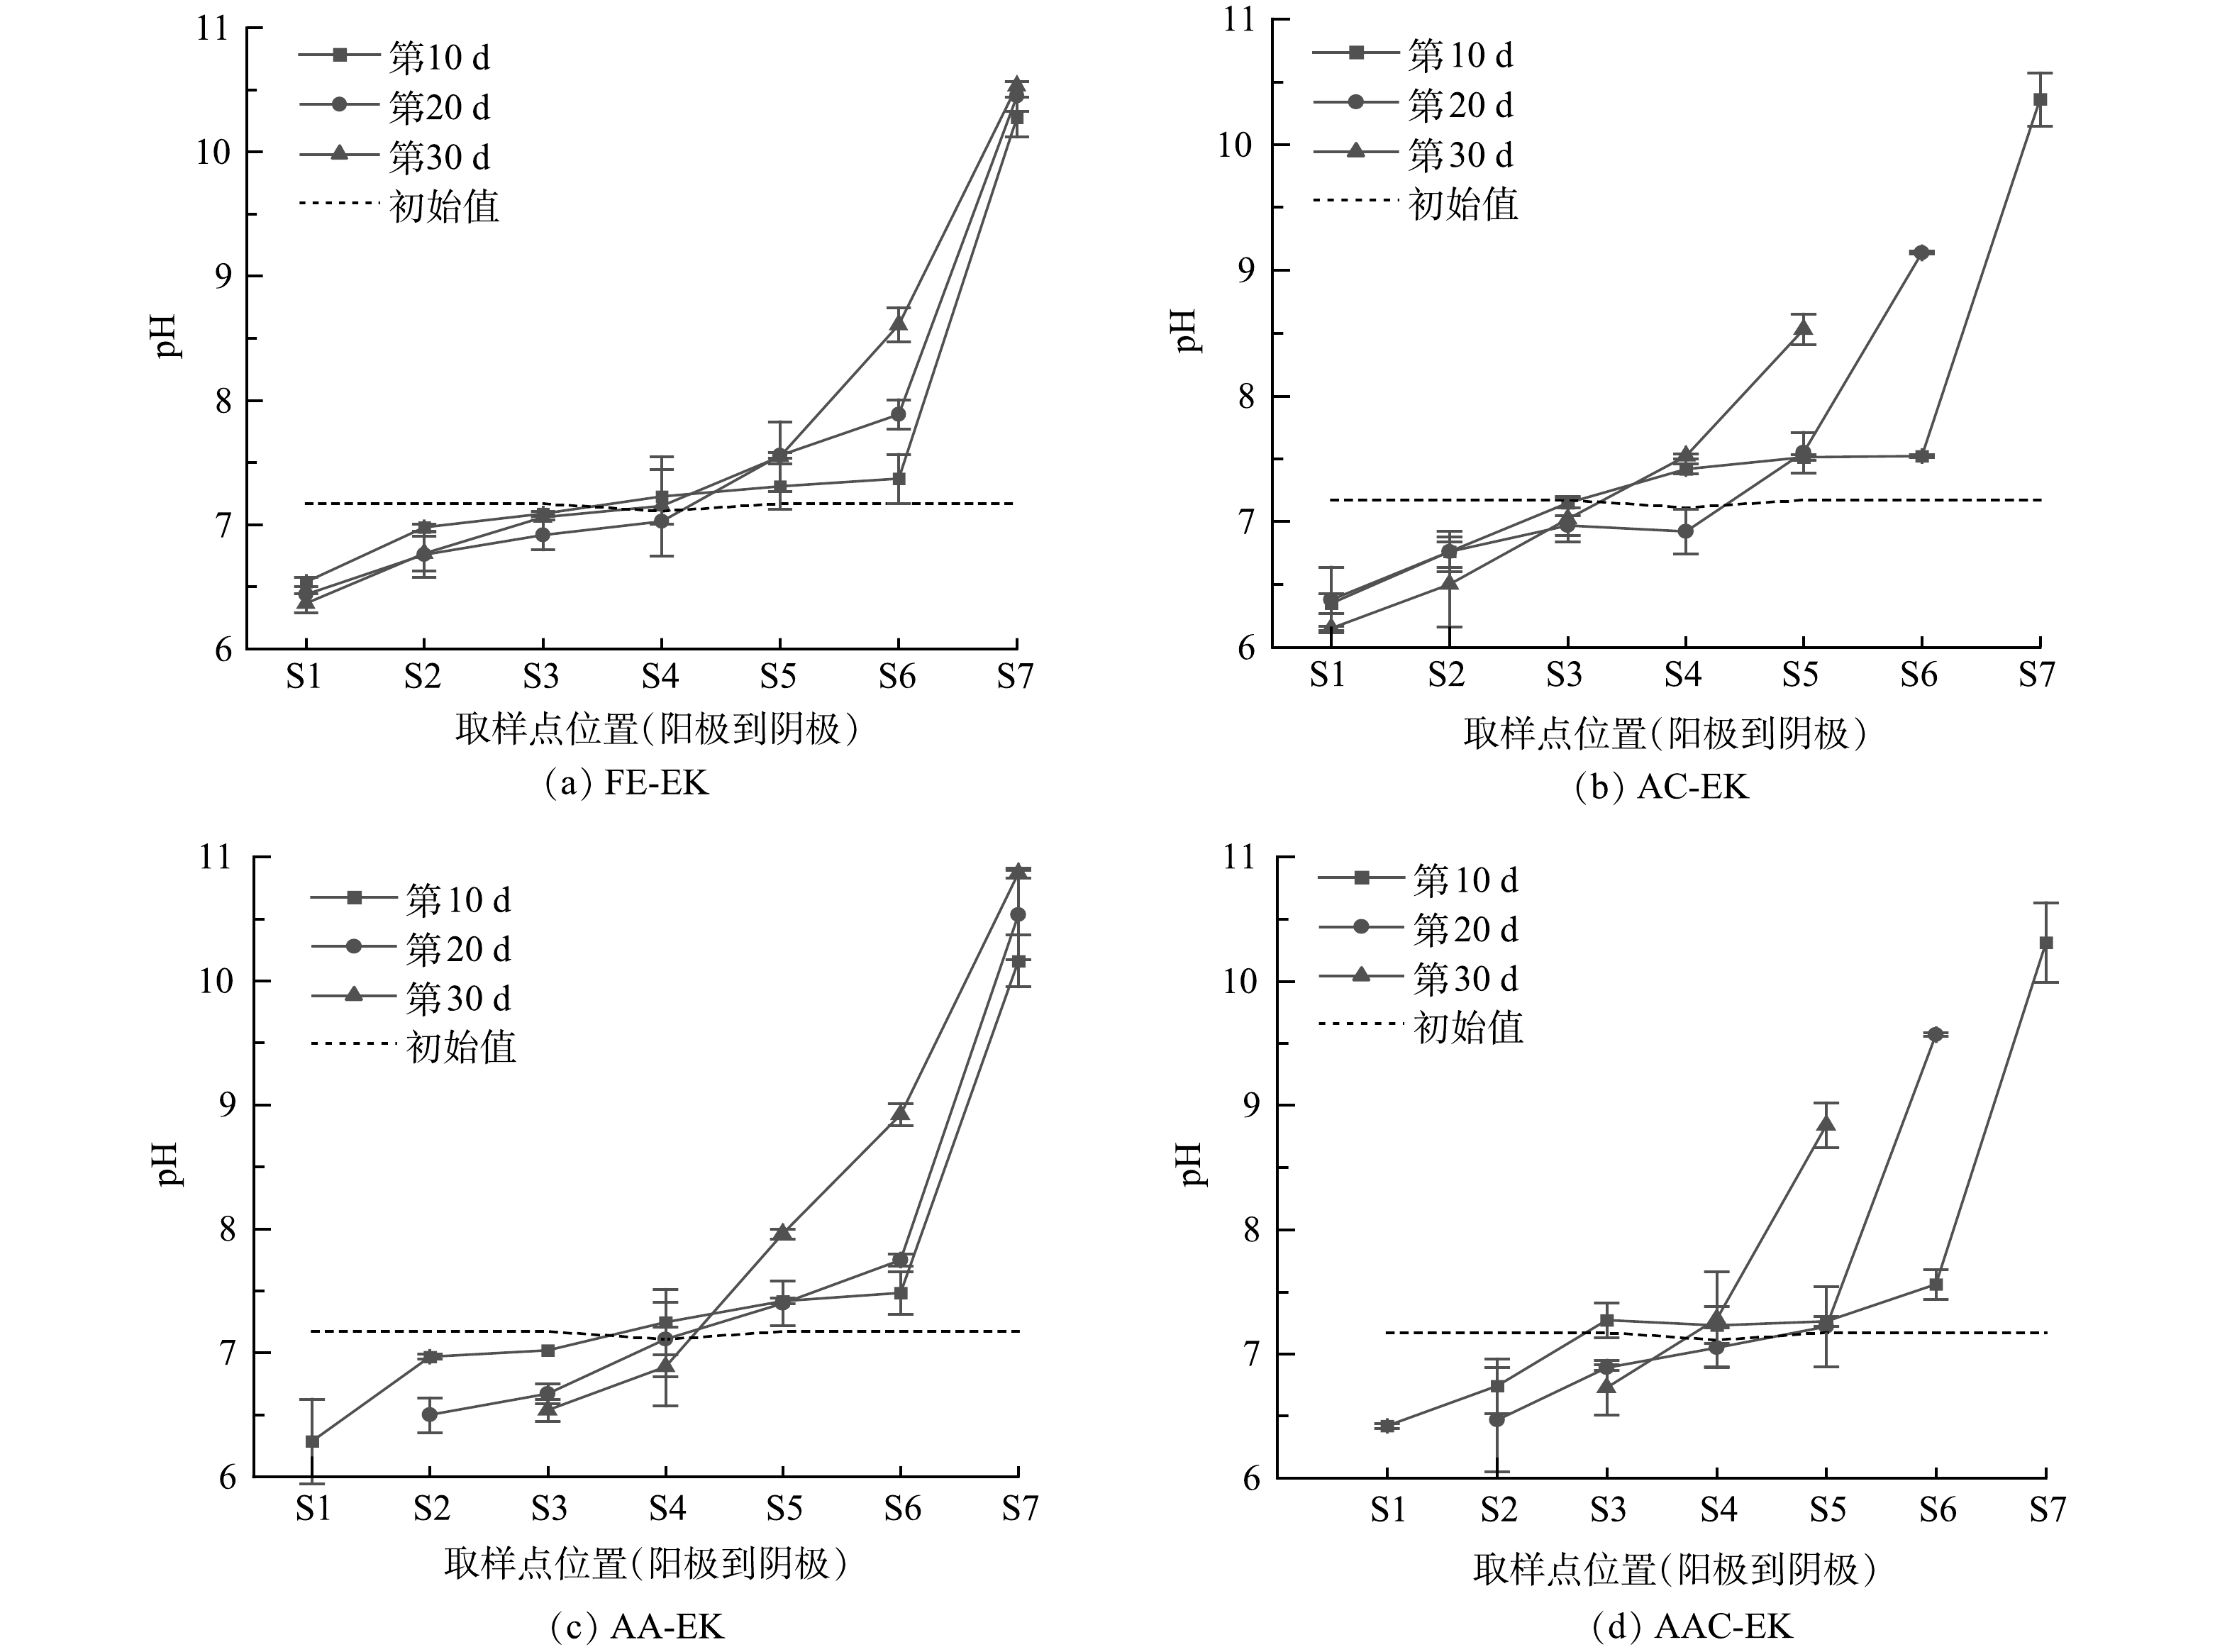
图 4 实验过程中pH变化
Figure 4. pH changes during experiment
-
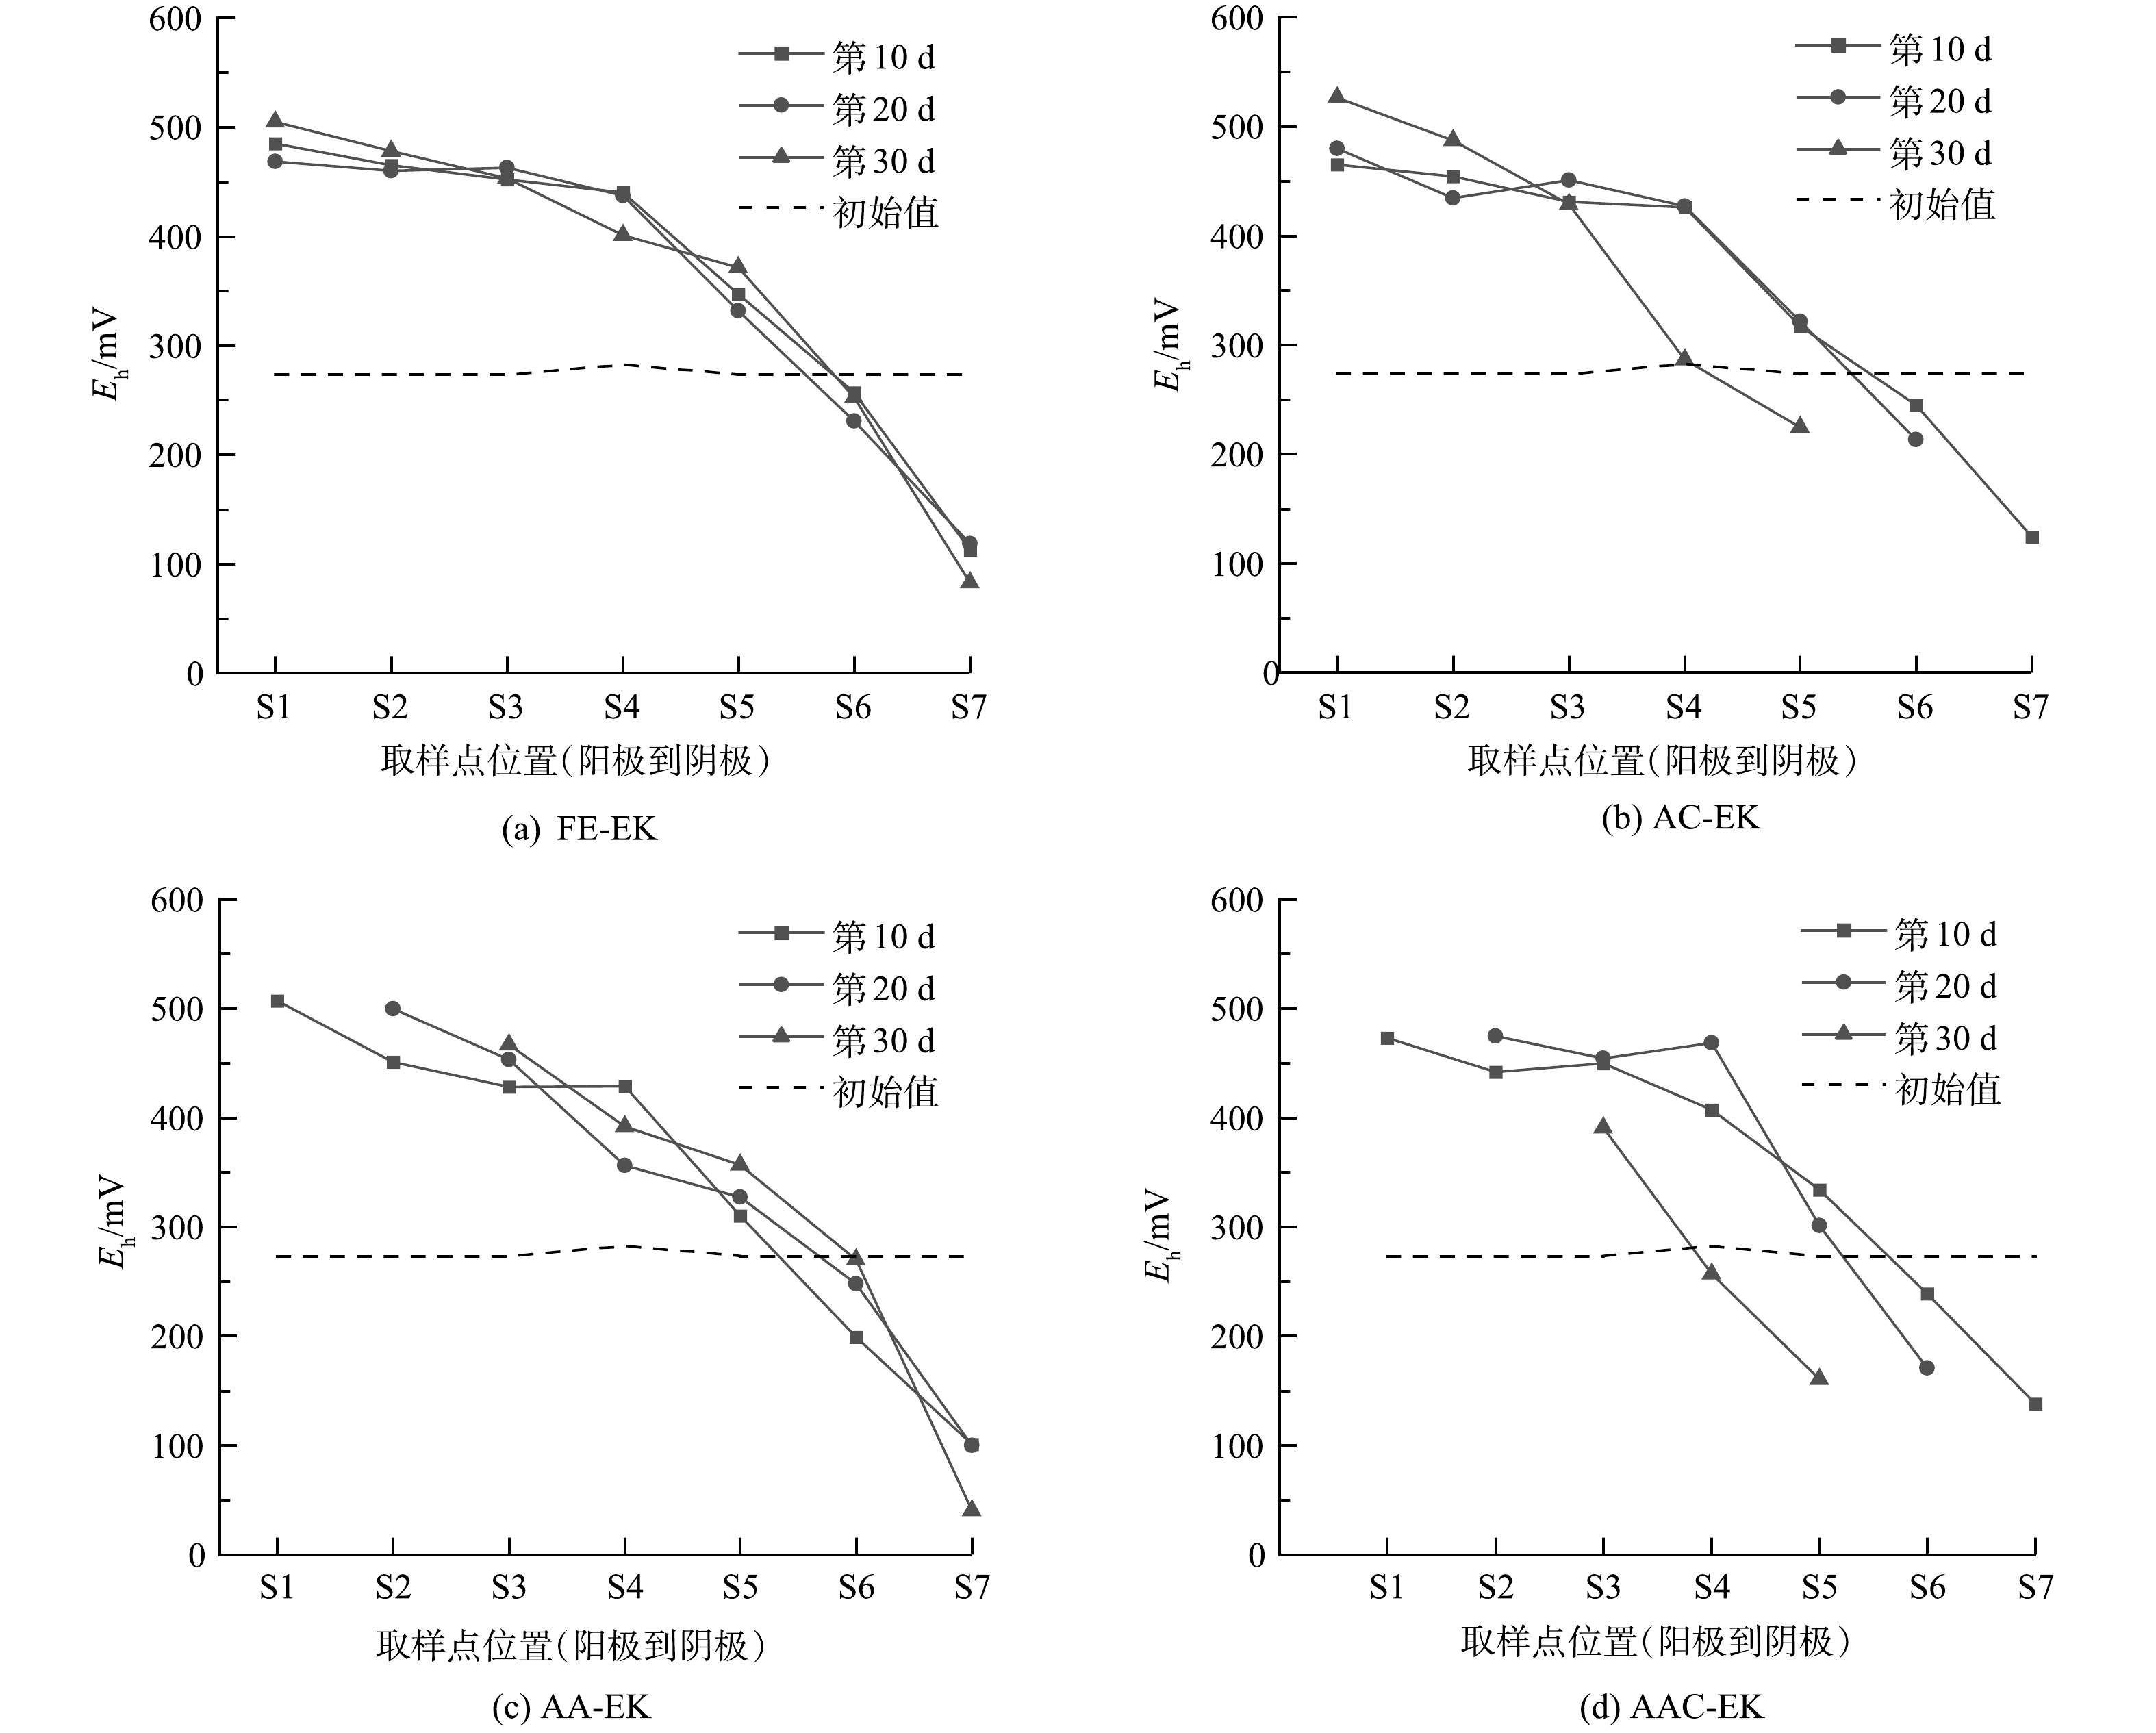
图 5 实验过程中Eh变化
Figure 5. Eh changes during experiment
-
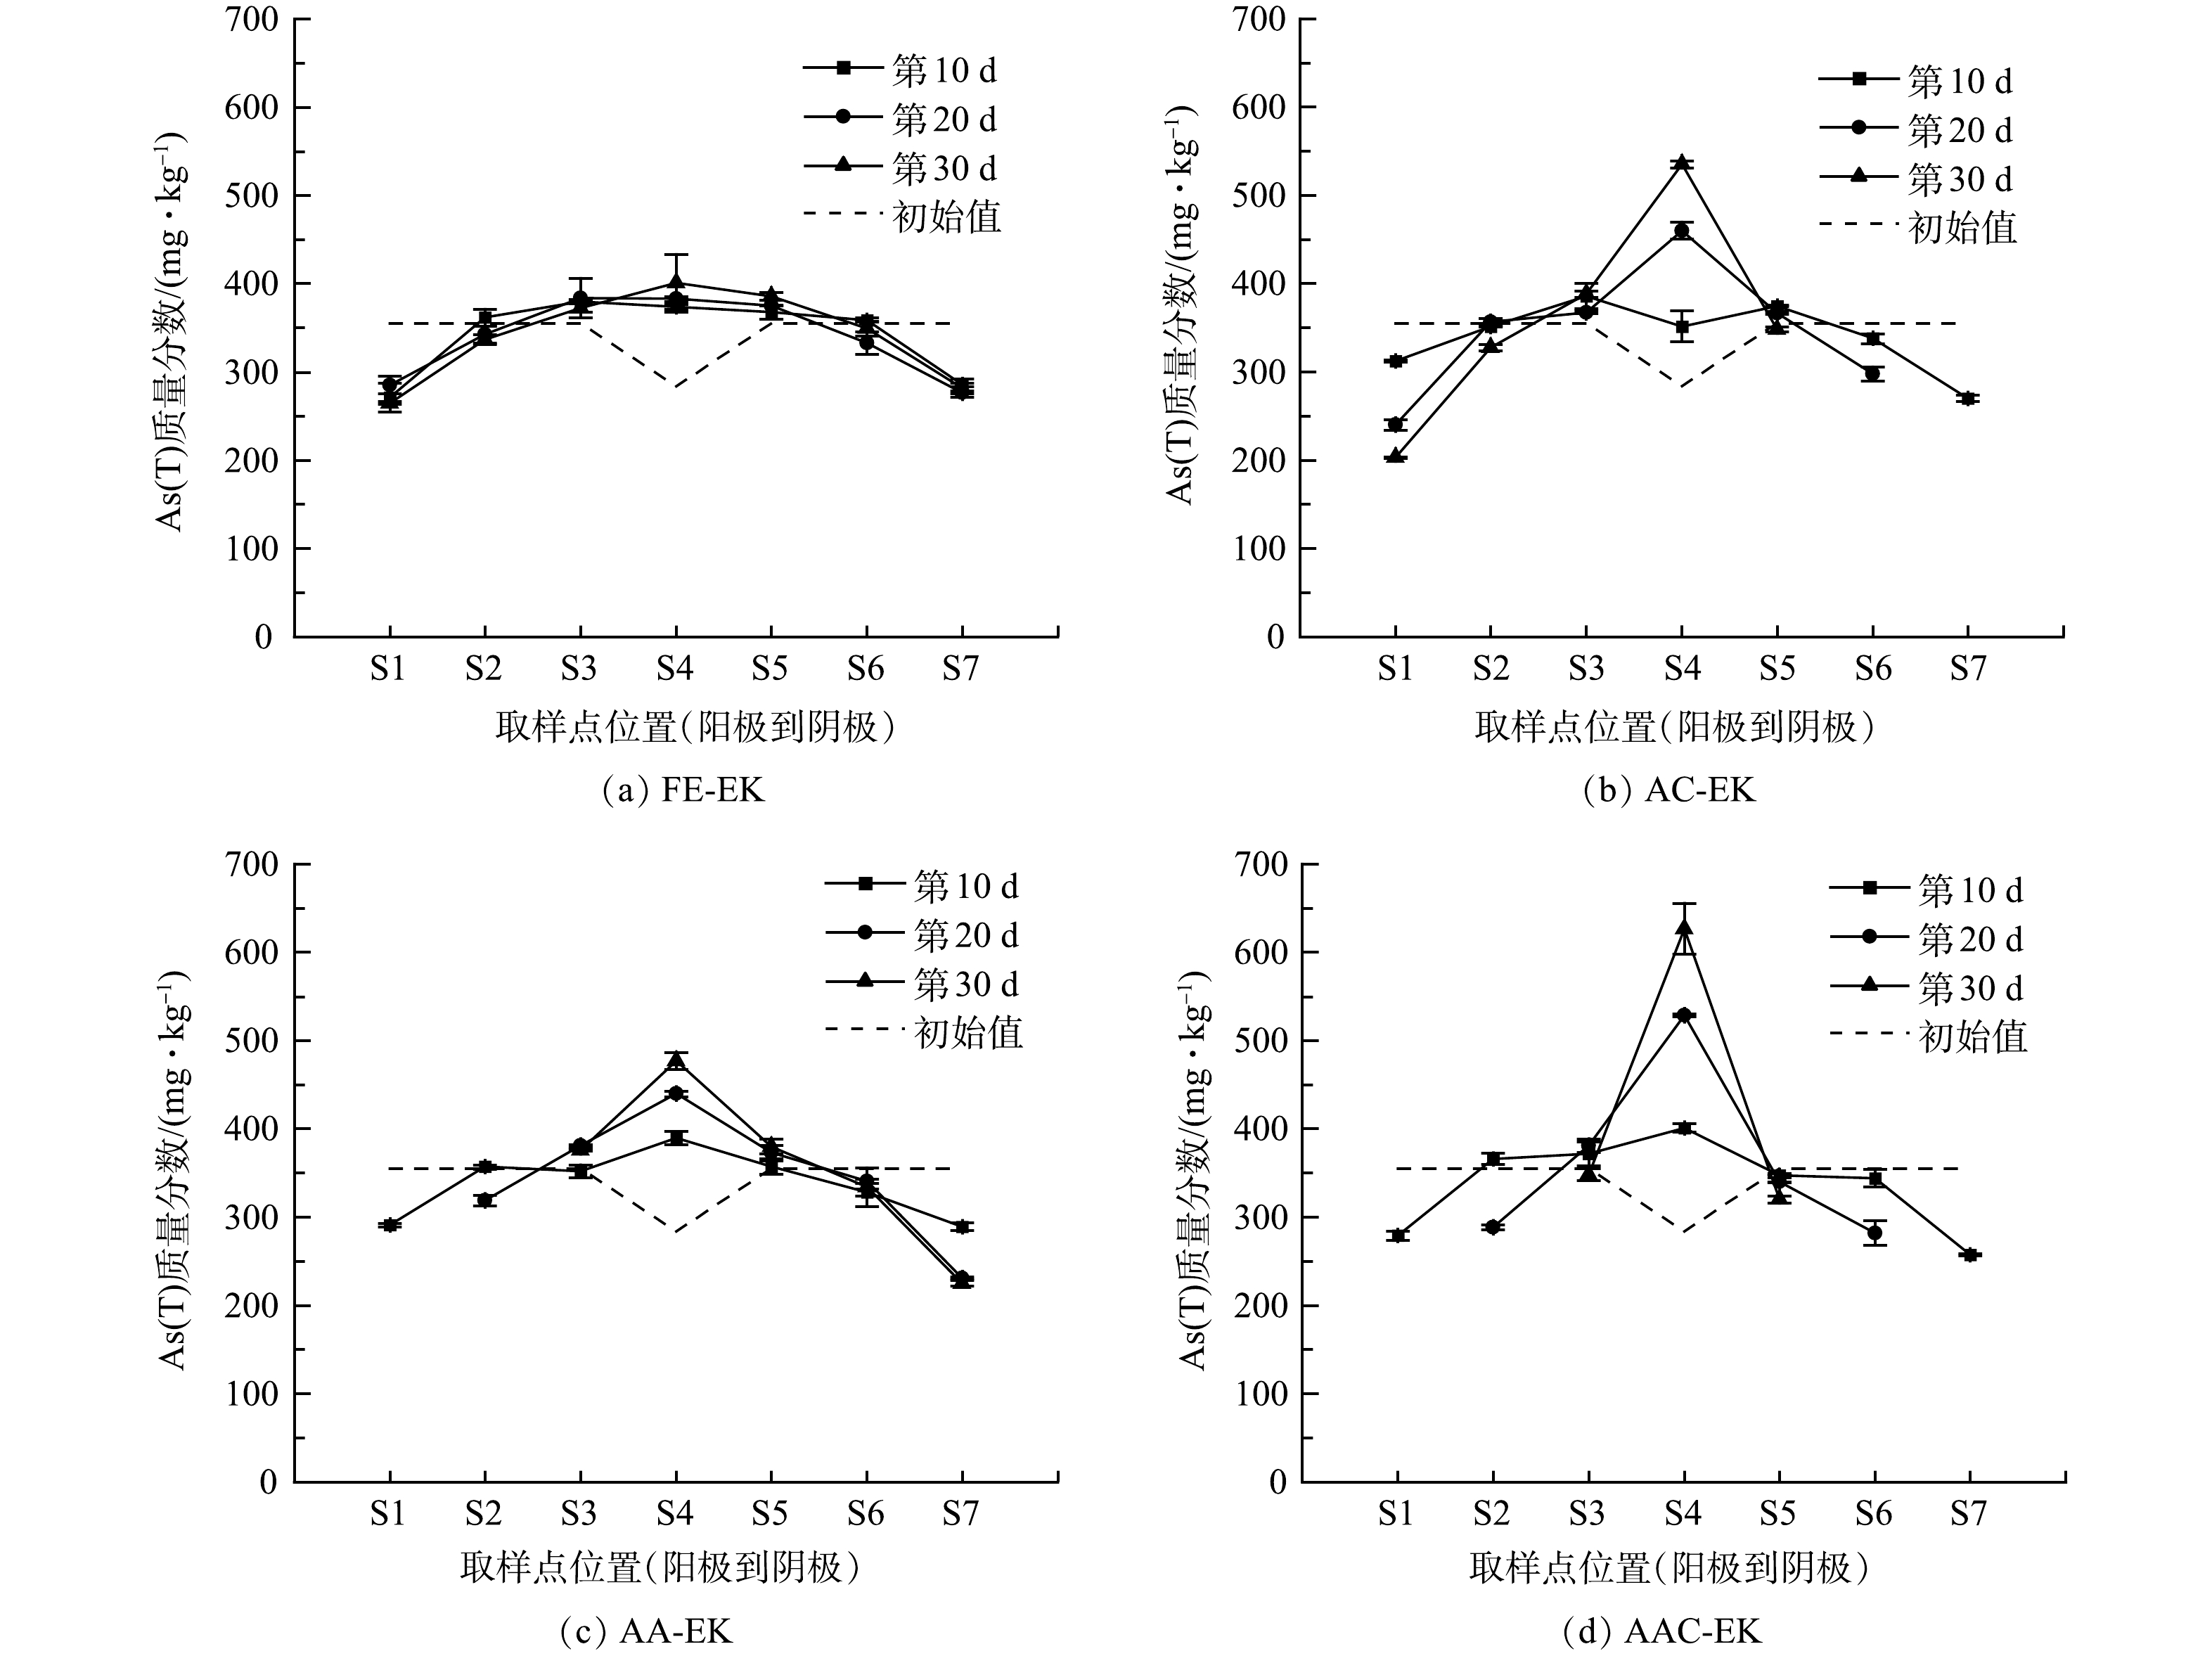
图 6 土壤中As(T)分布
Figure 6. Distributions of As(T) in soil
-
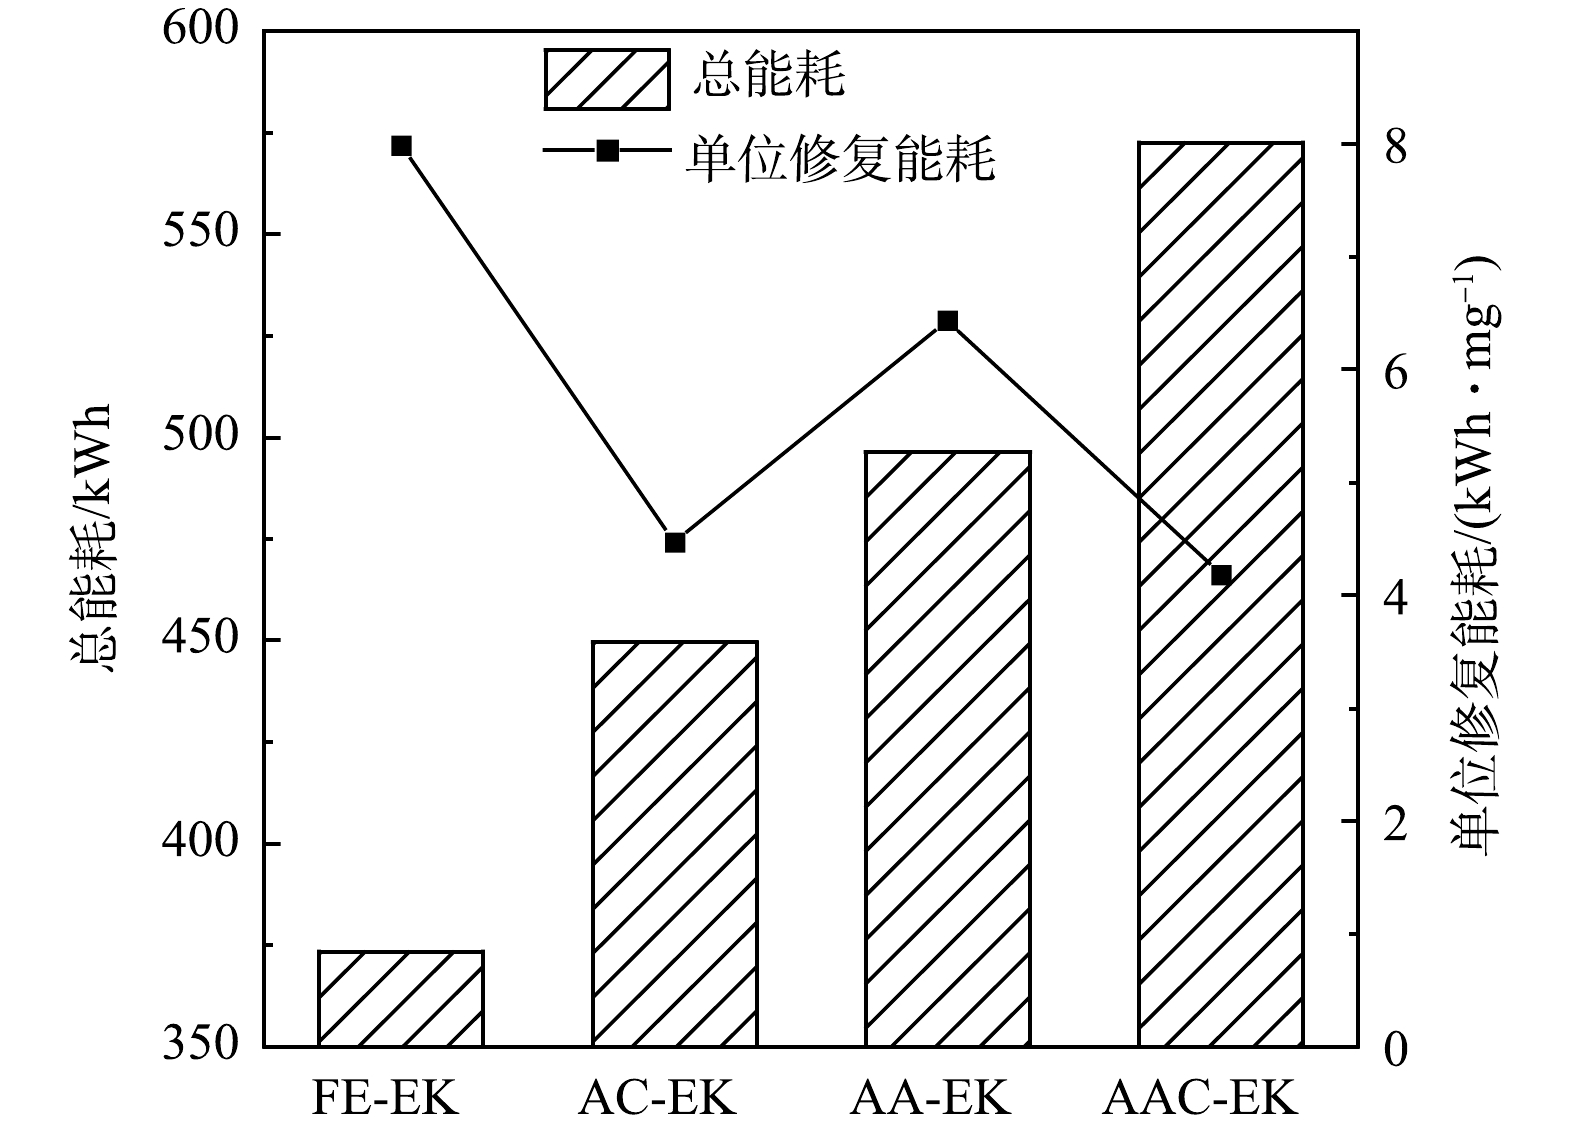
图 7 不同电动处理组总能耗及单位修复能耗
Figure 7. Total energy consumption and energy consumption per unit of remediation of different electrokinetic treatments
-

图 8 电动结束后土壤中As(V)和As(III)分布
Figure 8. Distributions of As(V) and As(III) in soil after electrokinetic treatment
-
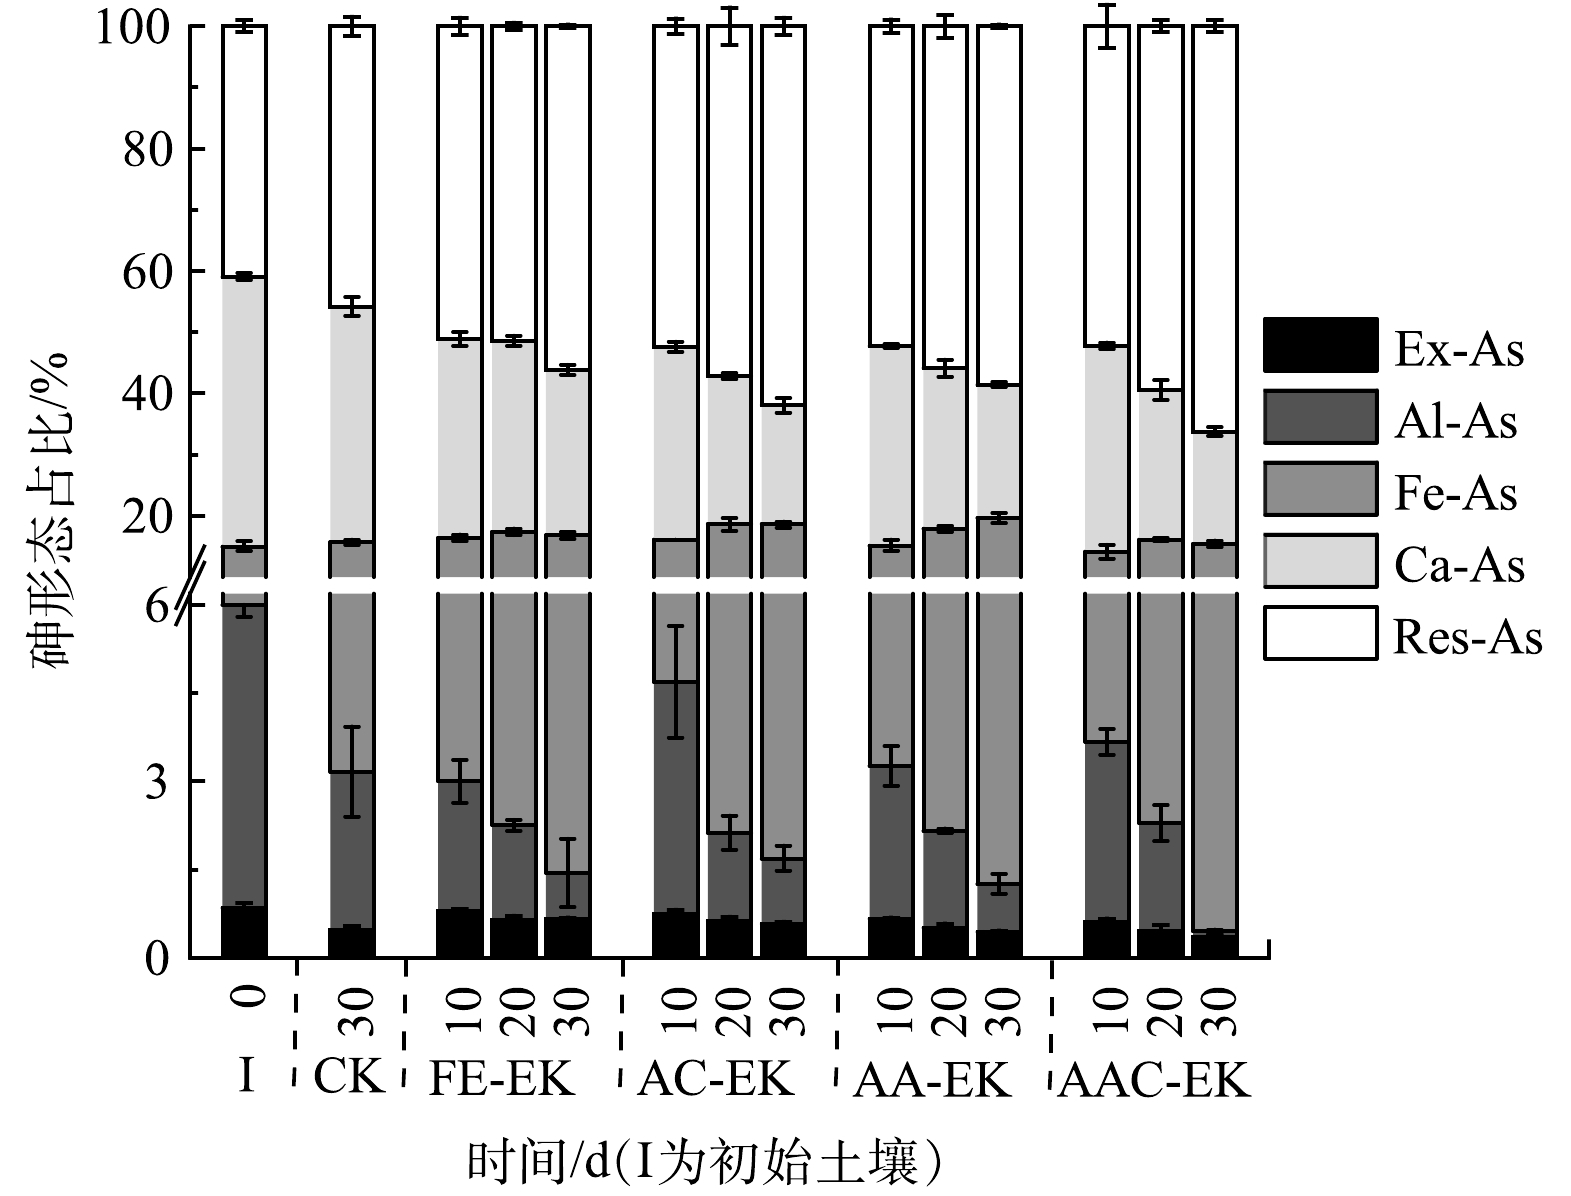
图 9 捕集室中砷形态变化
Figure 9. Fractionation change of arsenic in capture chamber
Figure
9 ,Table
0 个