-
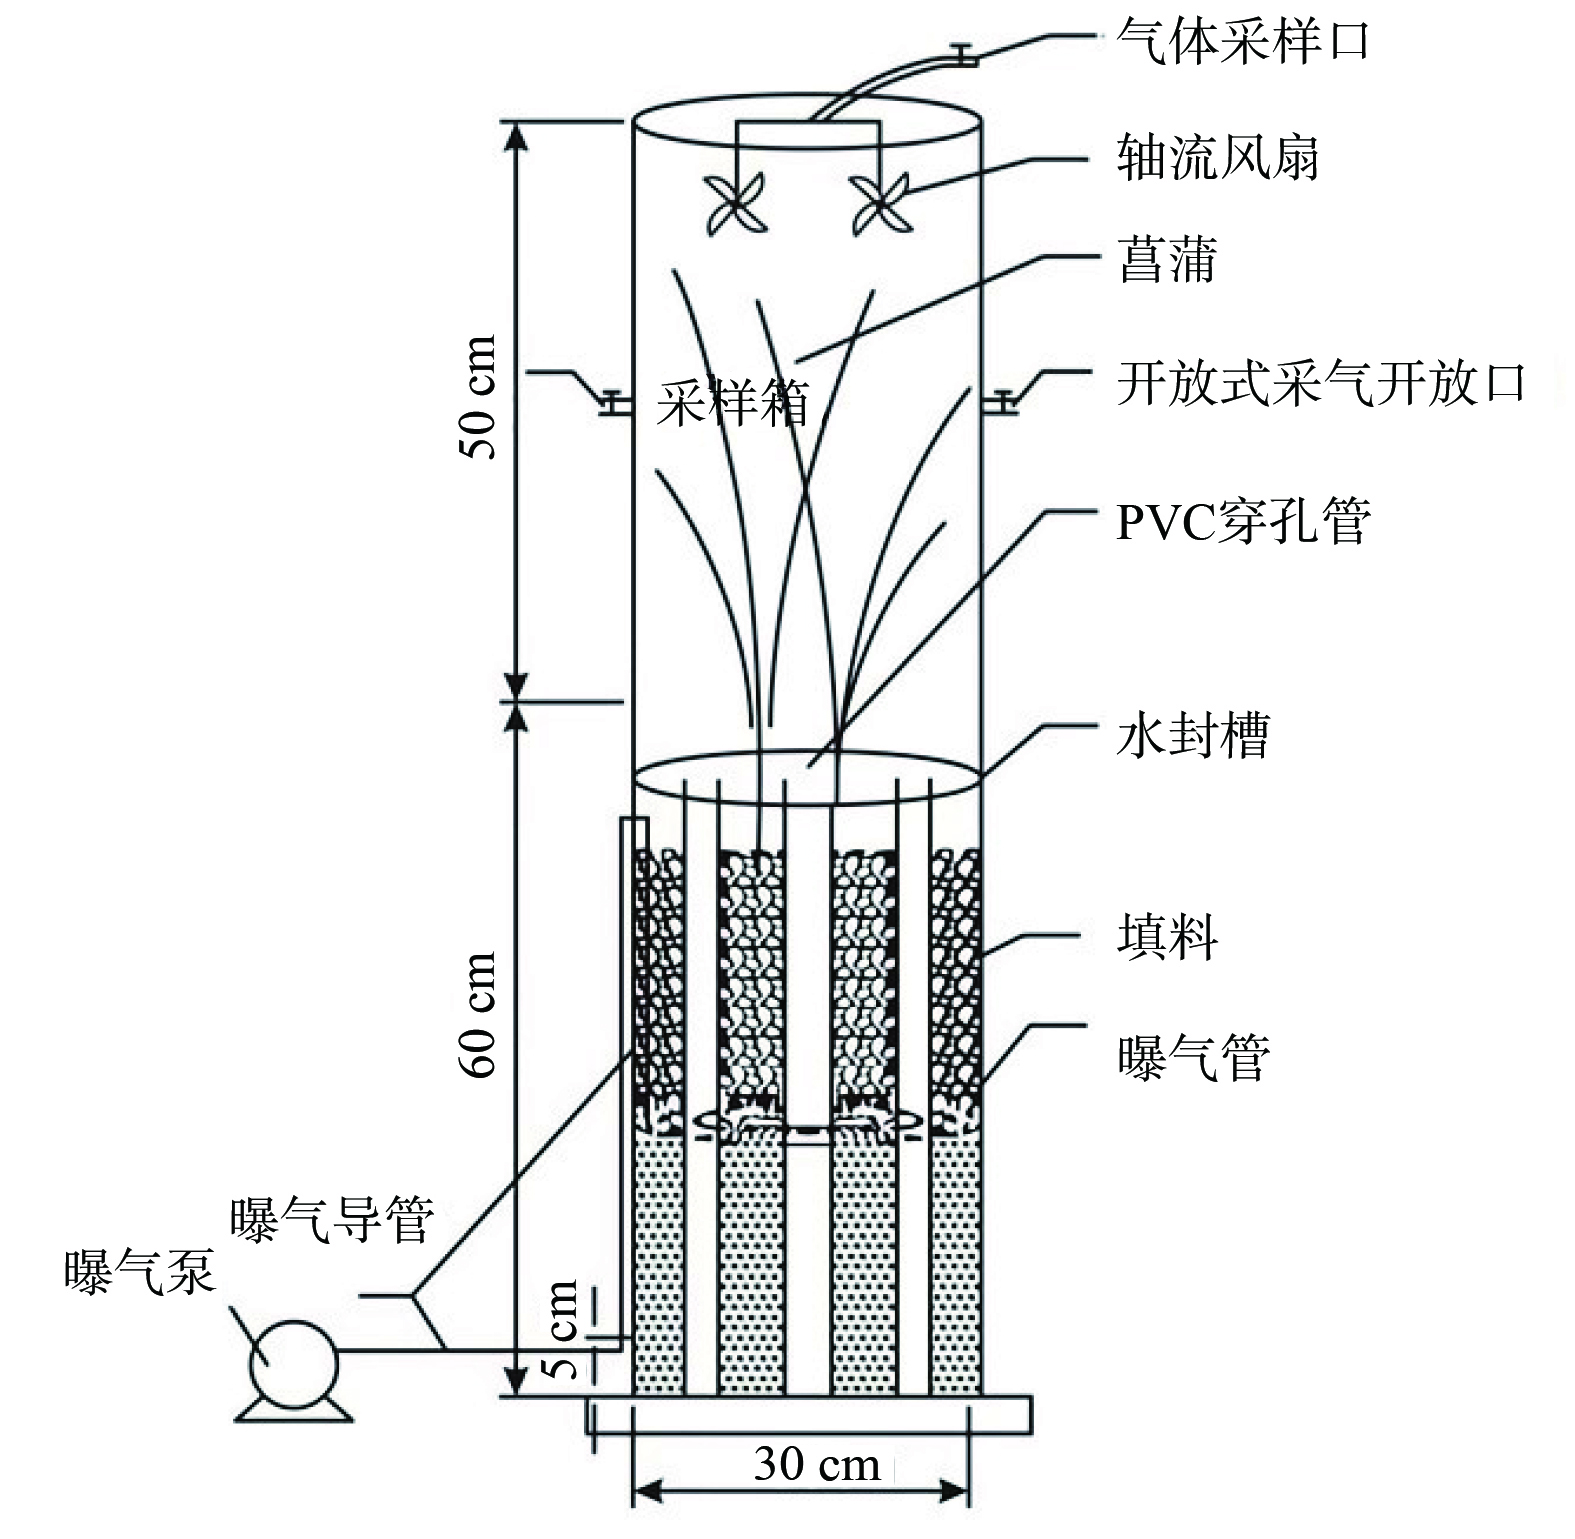
图 1 间歇曝气人工湿地装置
Figure 1. Schematic diagram of intermittent aeration constructed wetland
-
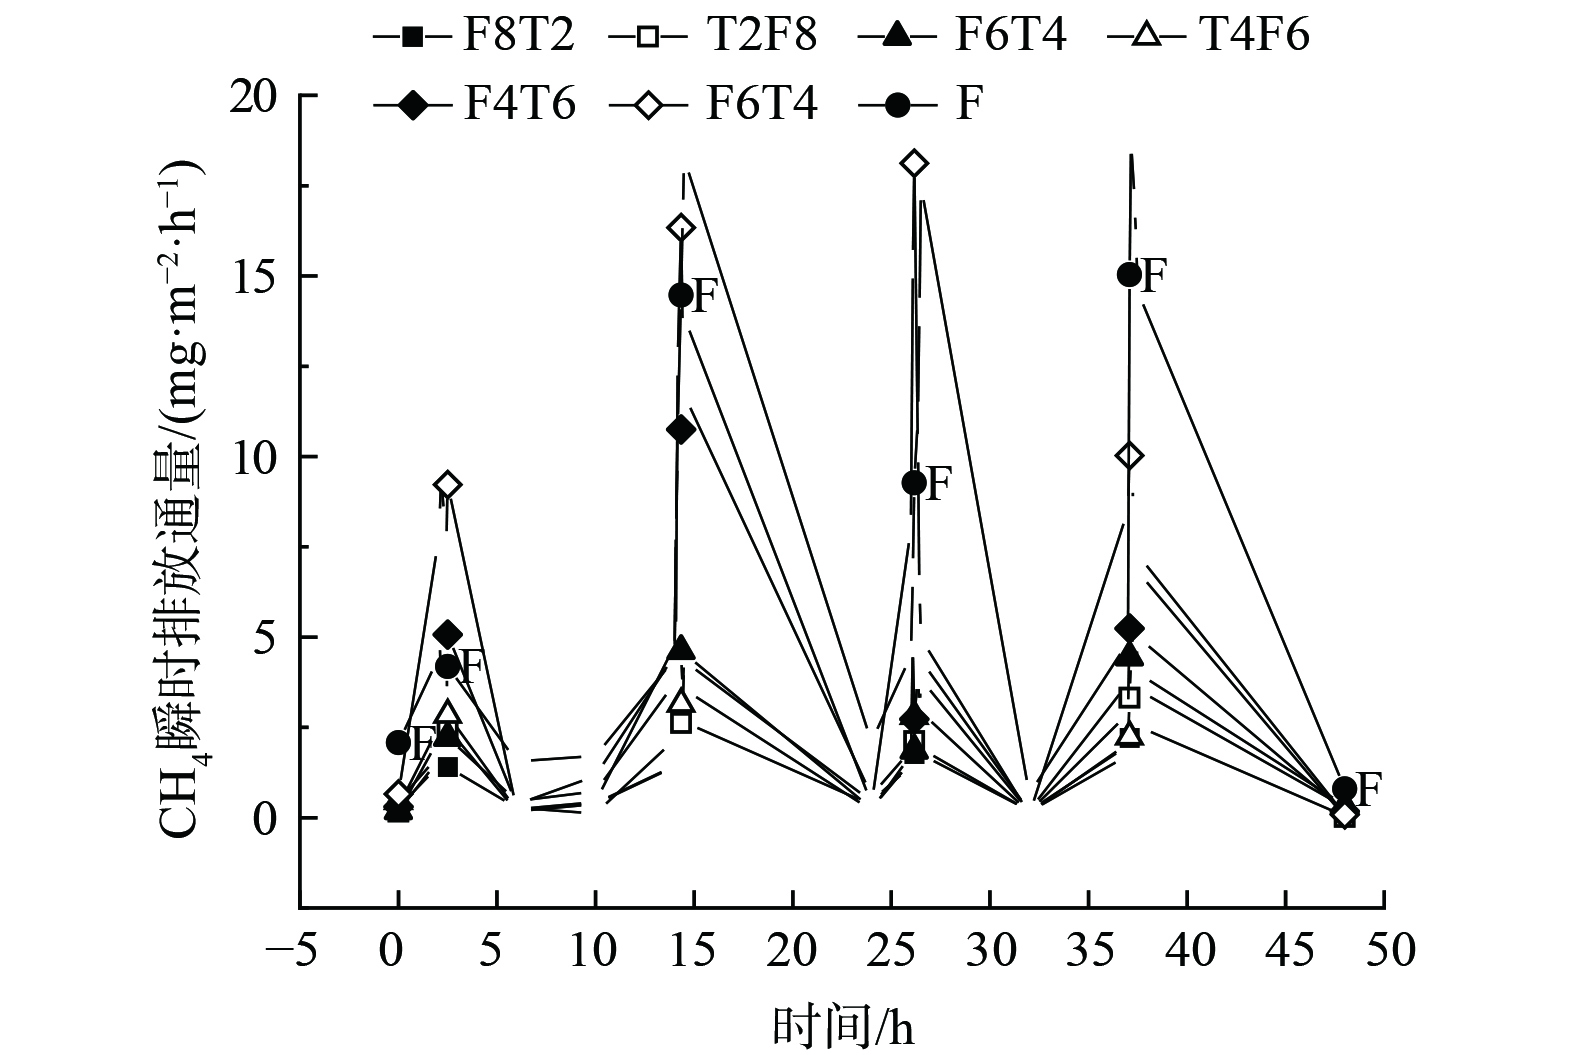
图 2 典型周期内不同人工湿地CH4瞬时排放通量
Figure 2. Transient CH4 emission fluxes from different constructed wetlands in a typical cycle
-
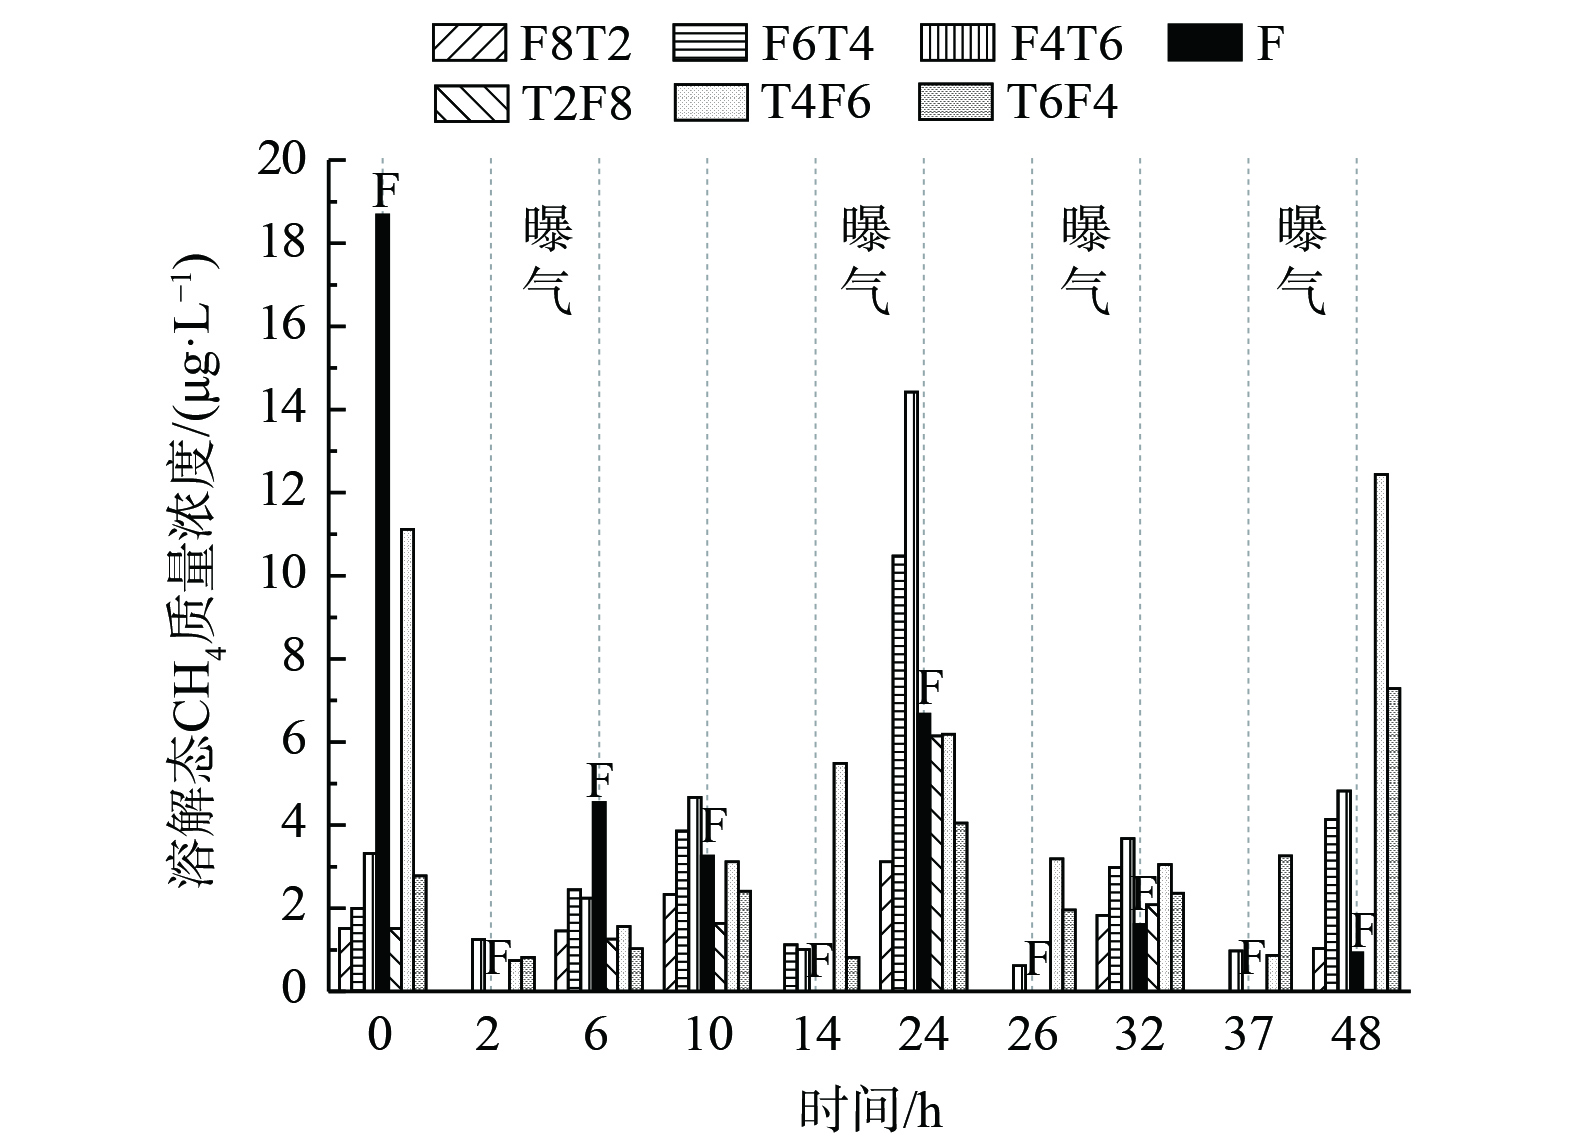
图 3 典型周期内不同人工湿地溶解态CH4质量浓度的变化
Figure 3. Changes in CH4 fluxes and dissolved CH4 content in different constructed wetlands during the typical period
-
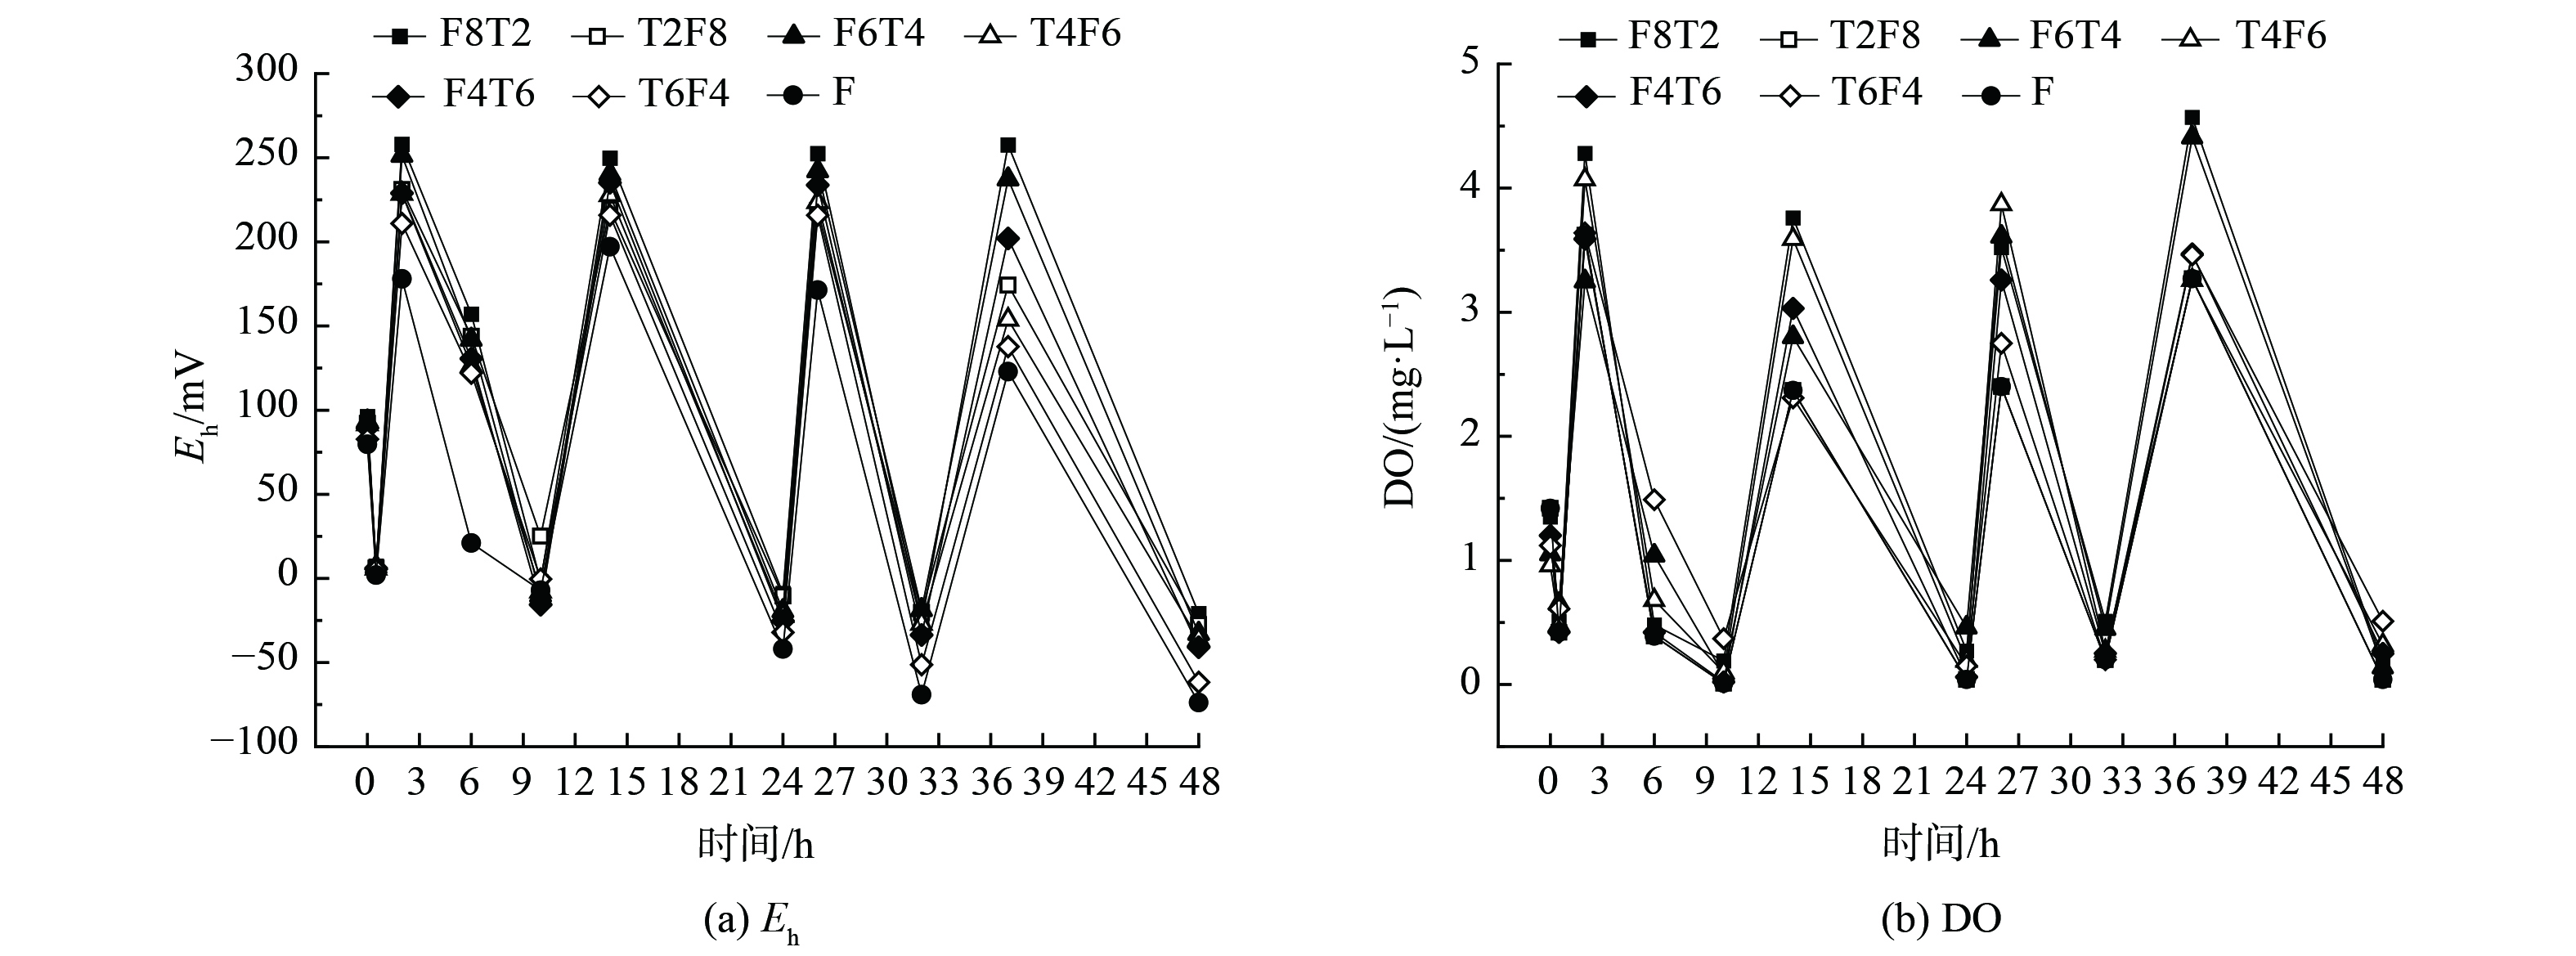
图 4 不同周期内各人工湿地 中Eh和DO的变化
Figure 4. Changes in Eh and DO in each artificial wetland in different cycles
-
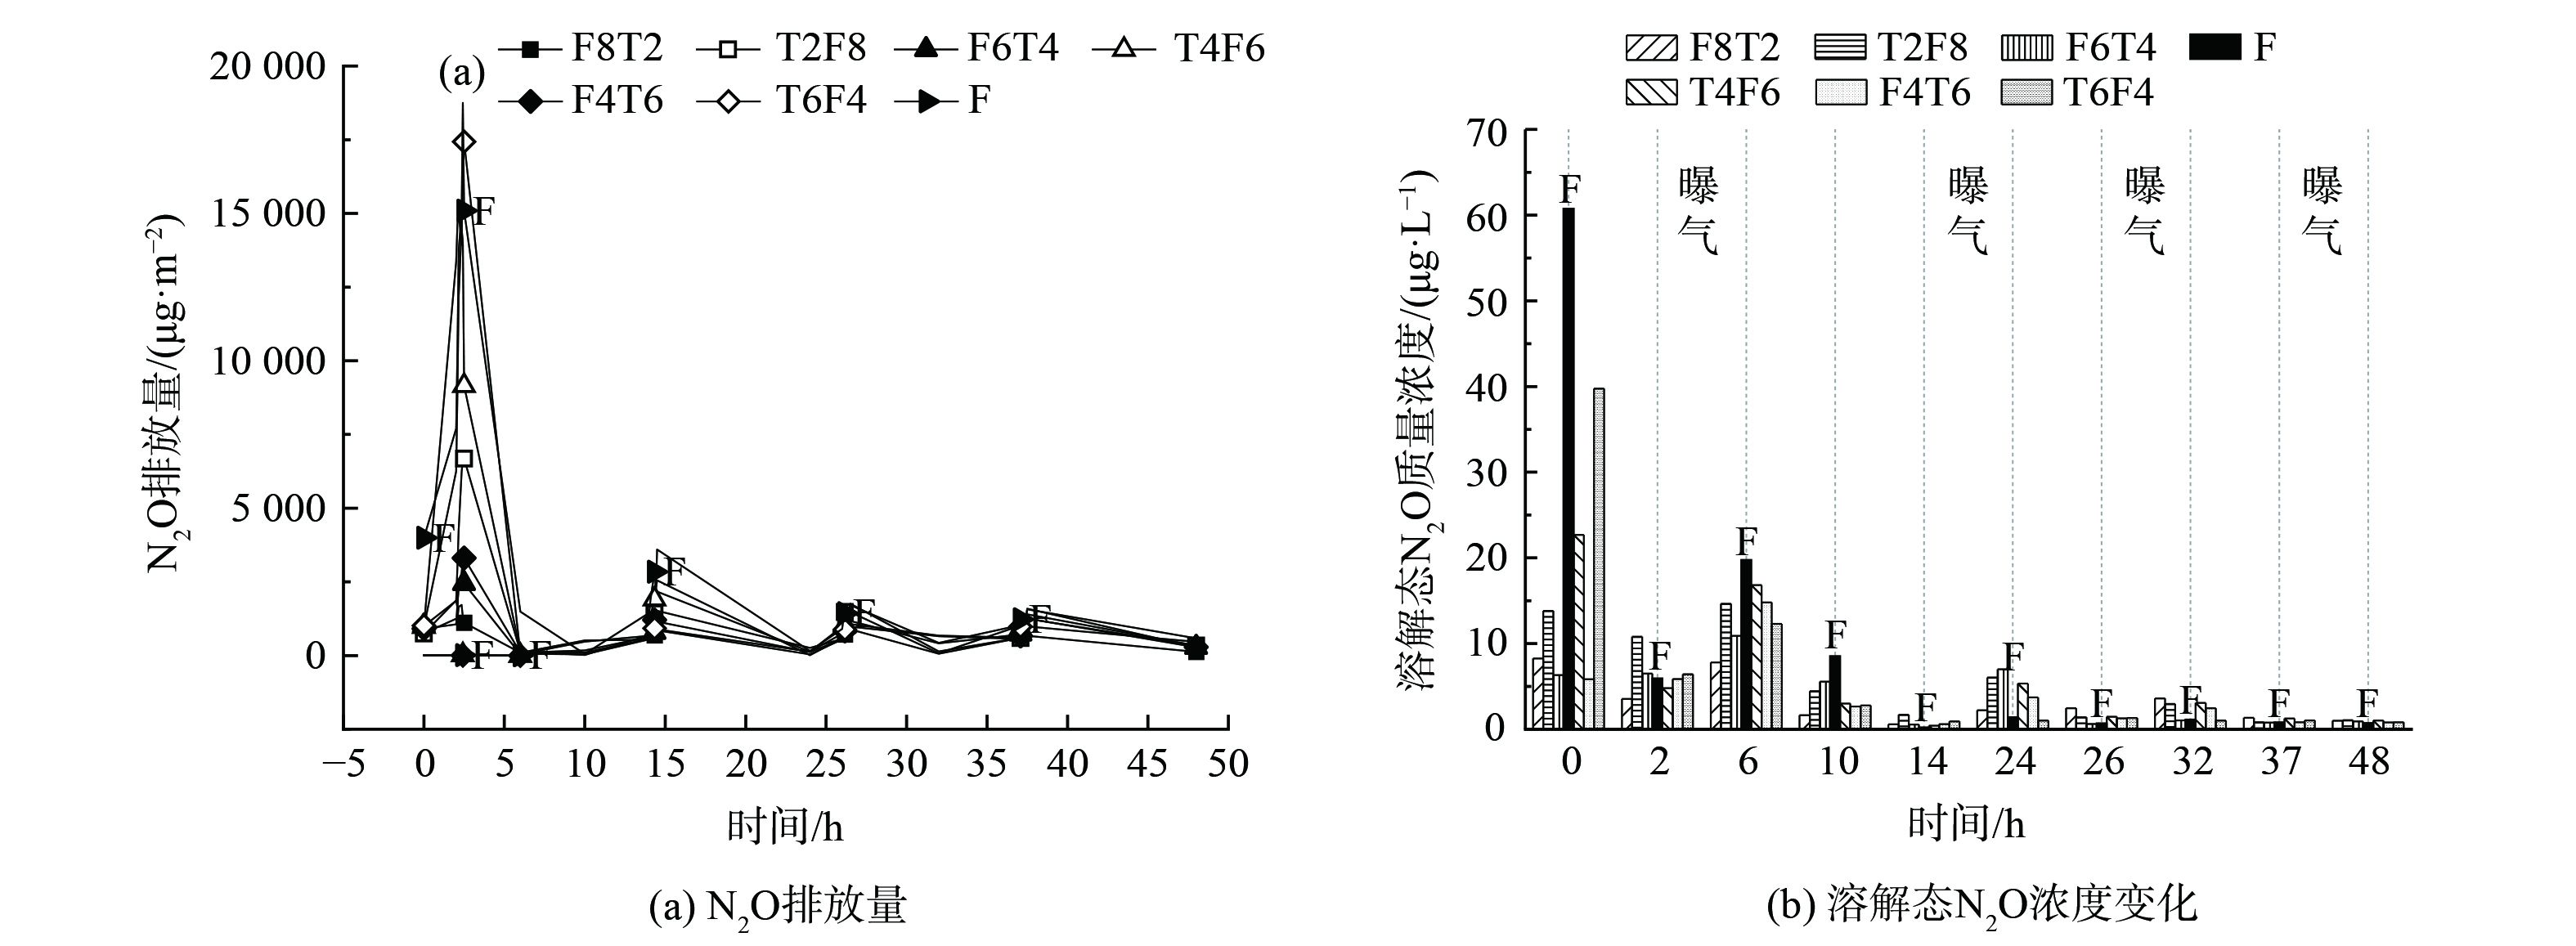
图 5 典型周期内不同人工湿地N2O排放通量和溶解态N2O浓度的变化
Figure 5. Changes in N2O fluxes and dissolved N2O content in different constructed wetlands during the typical period
Figure
5 ,Table
4 个