-

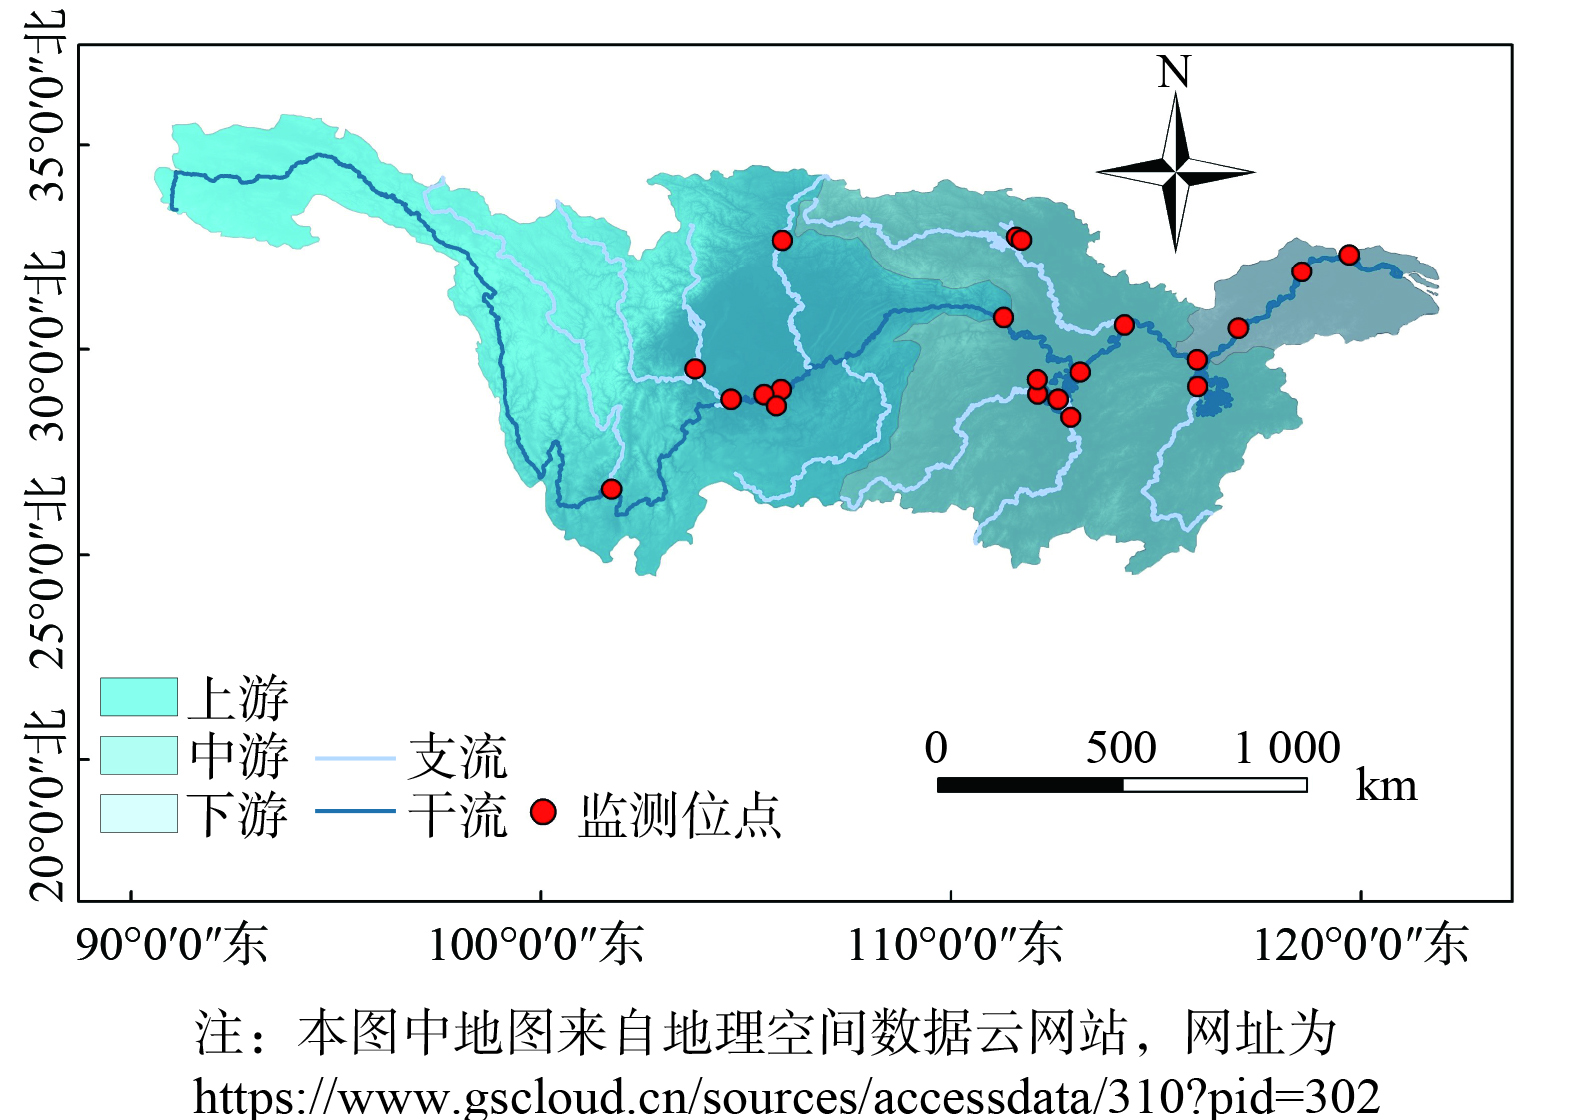
图 1 长江流域及监测位点图
Figure 1. Map of the Yangtze River Basin and monitoring sites
-

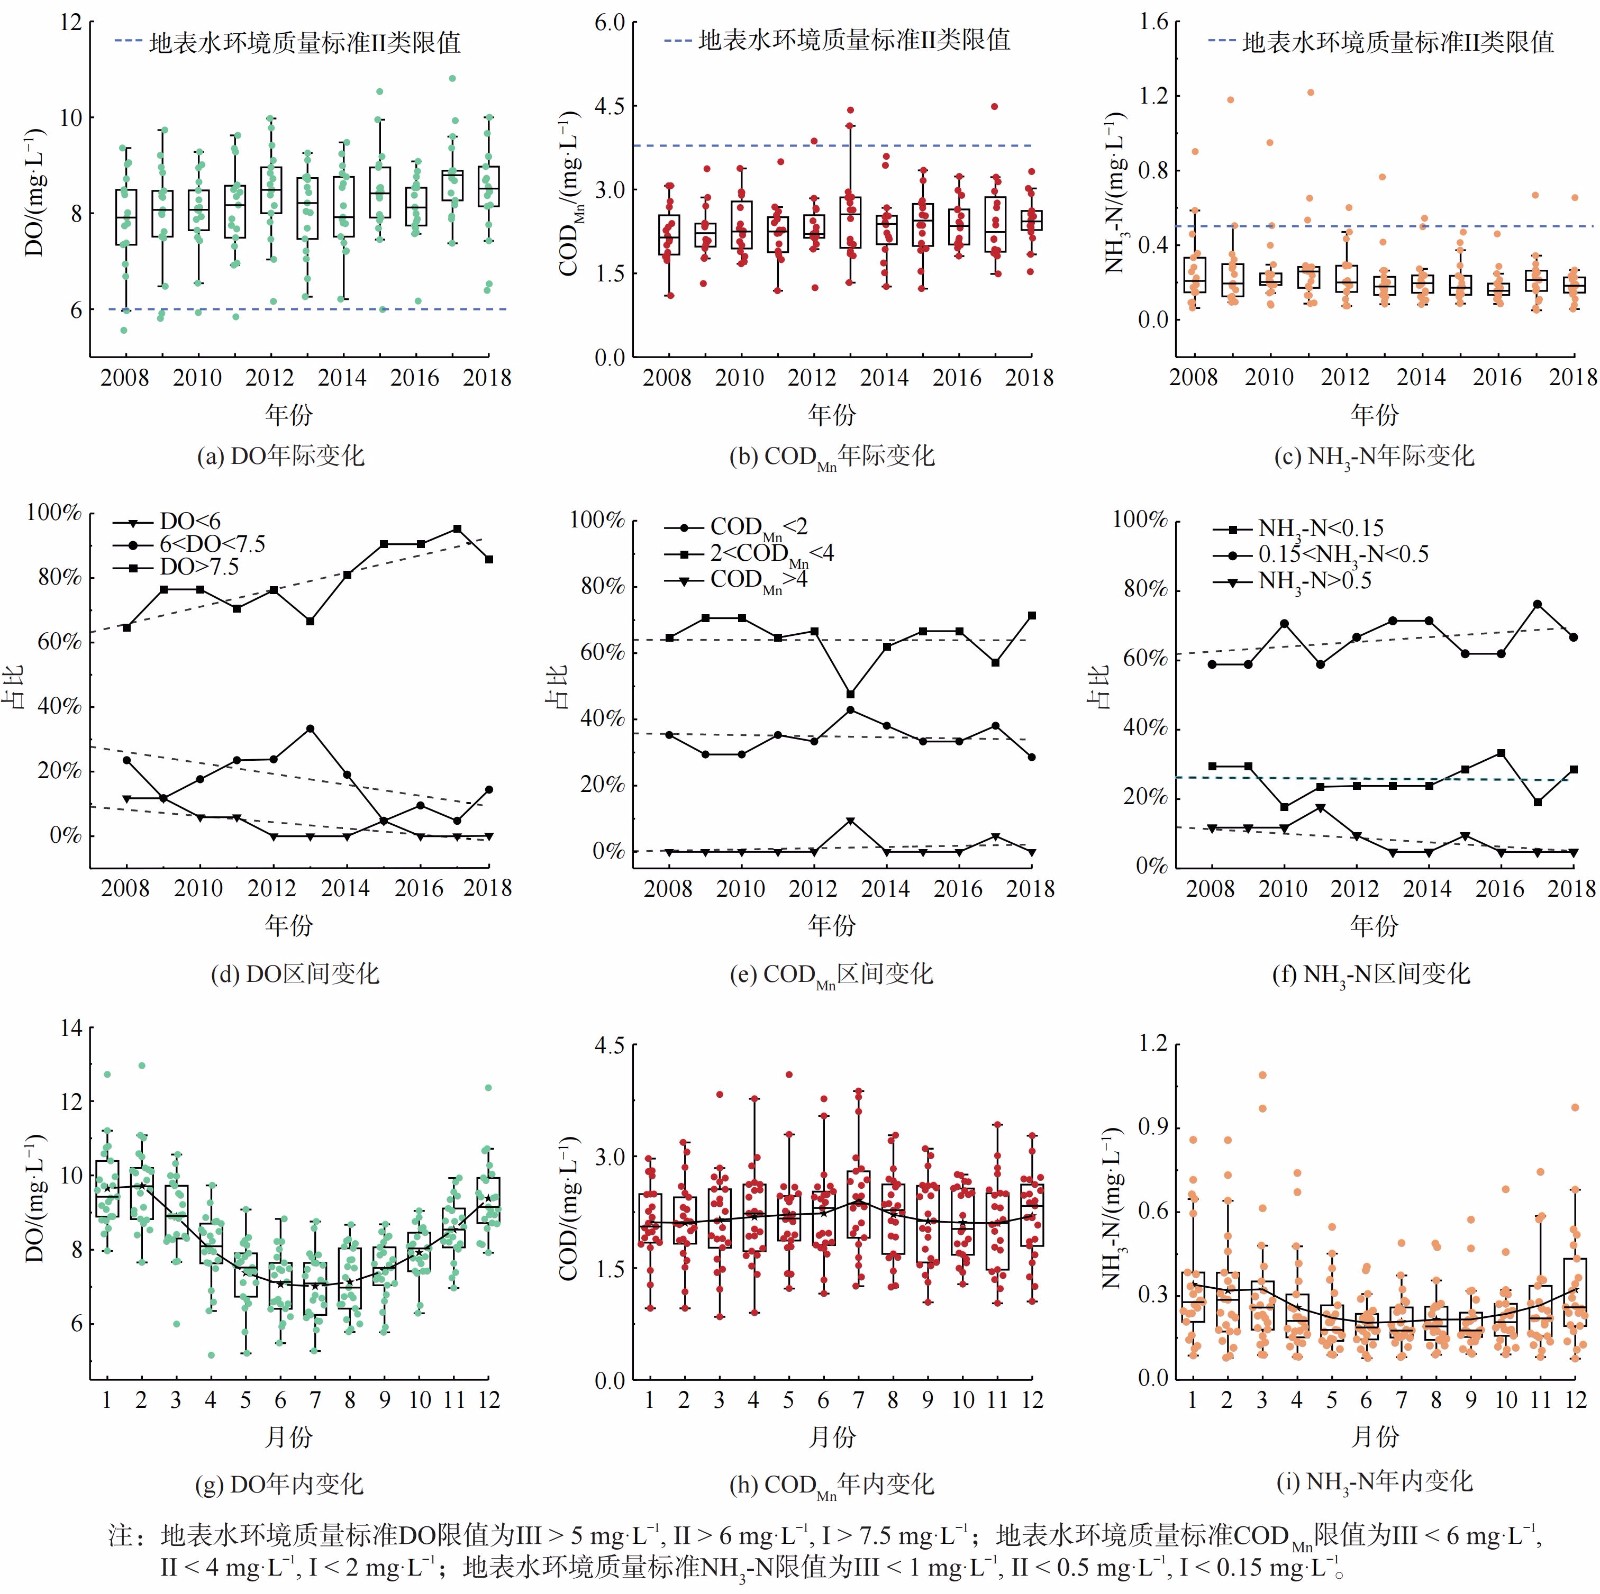
图 2 长江流域水质年际和年内水质评价占比变化
Figure 2. Changes in the percentage of water quality in the Yangtze River basin between and within years
-

图 3 长江流域各监控断面DO、CODMn和NH3-N年际与年内变化
Figure 3. Variation of DO, CODMn and NH3-N in the Yangtze River Basin between and within years
-

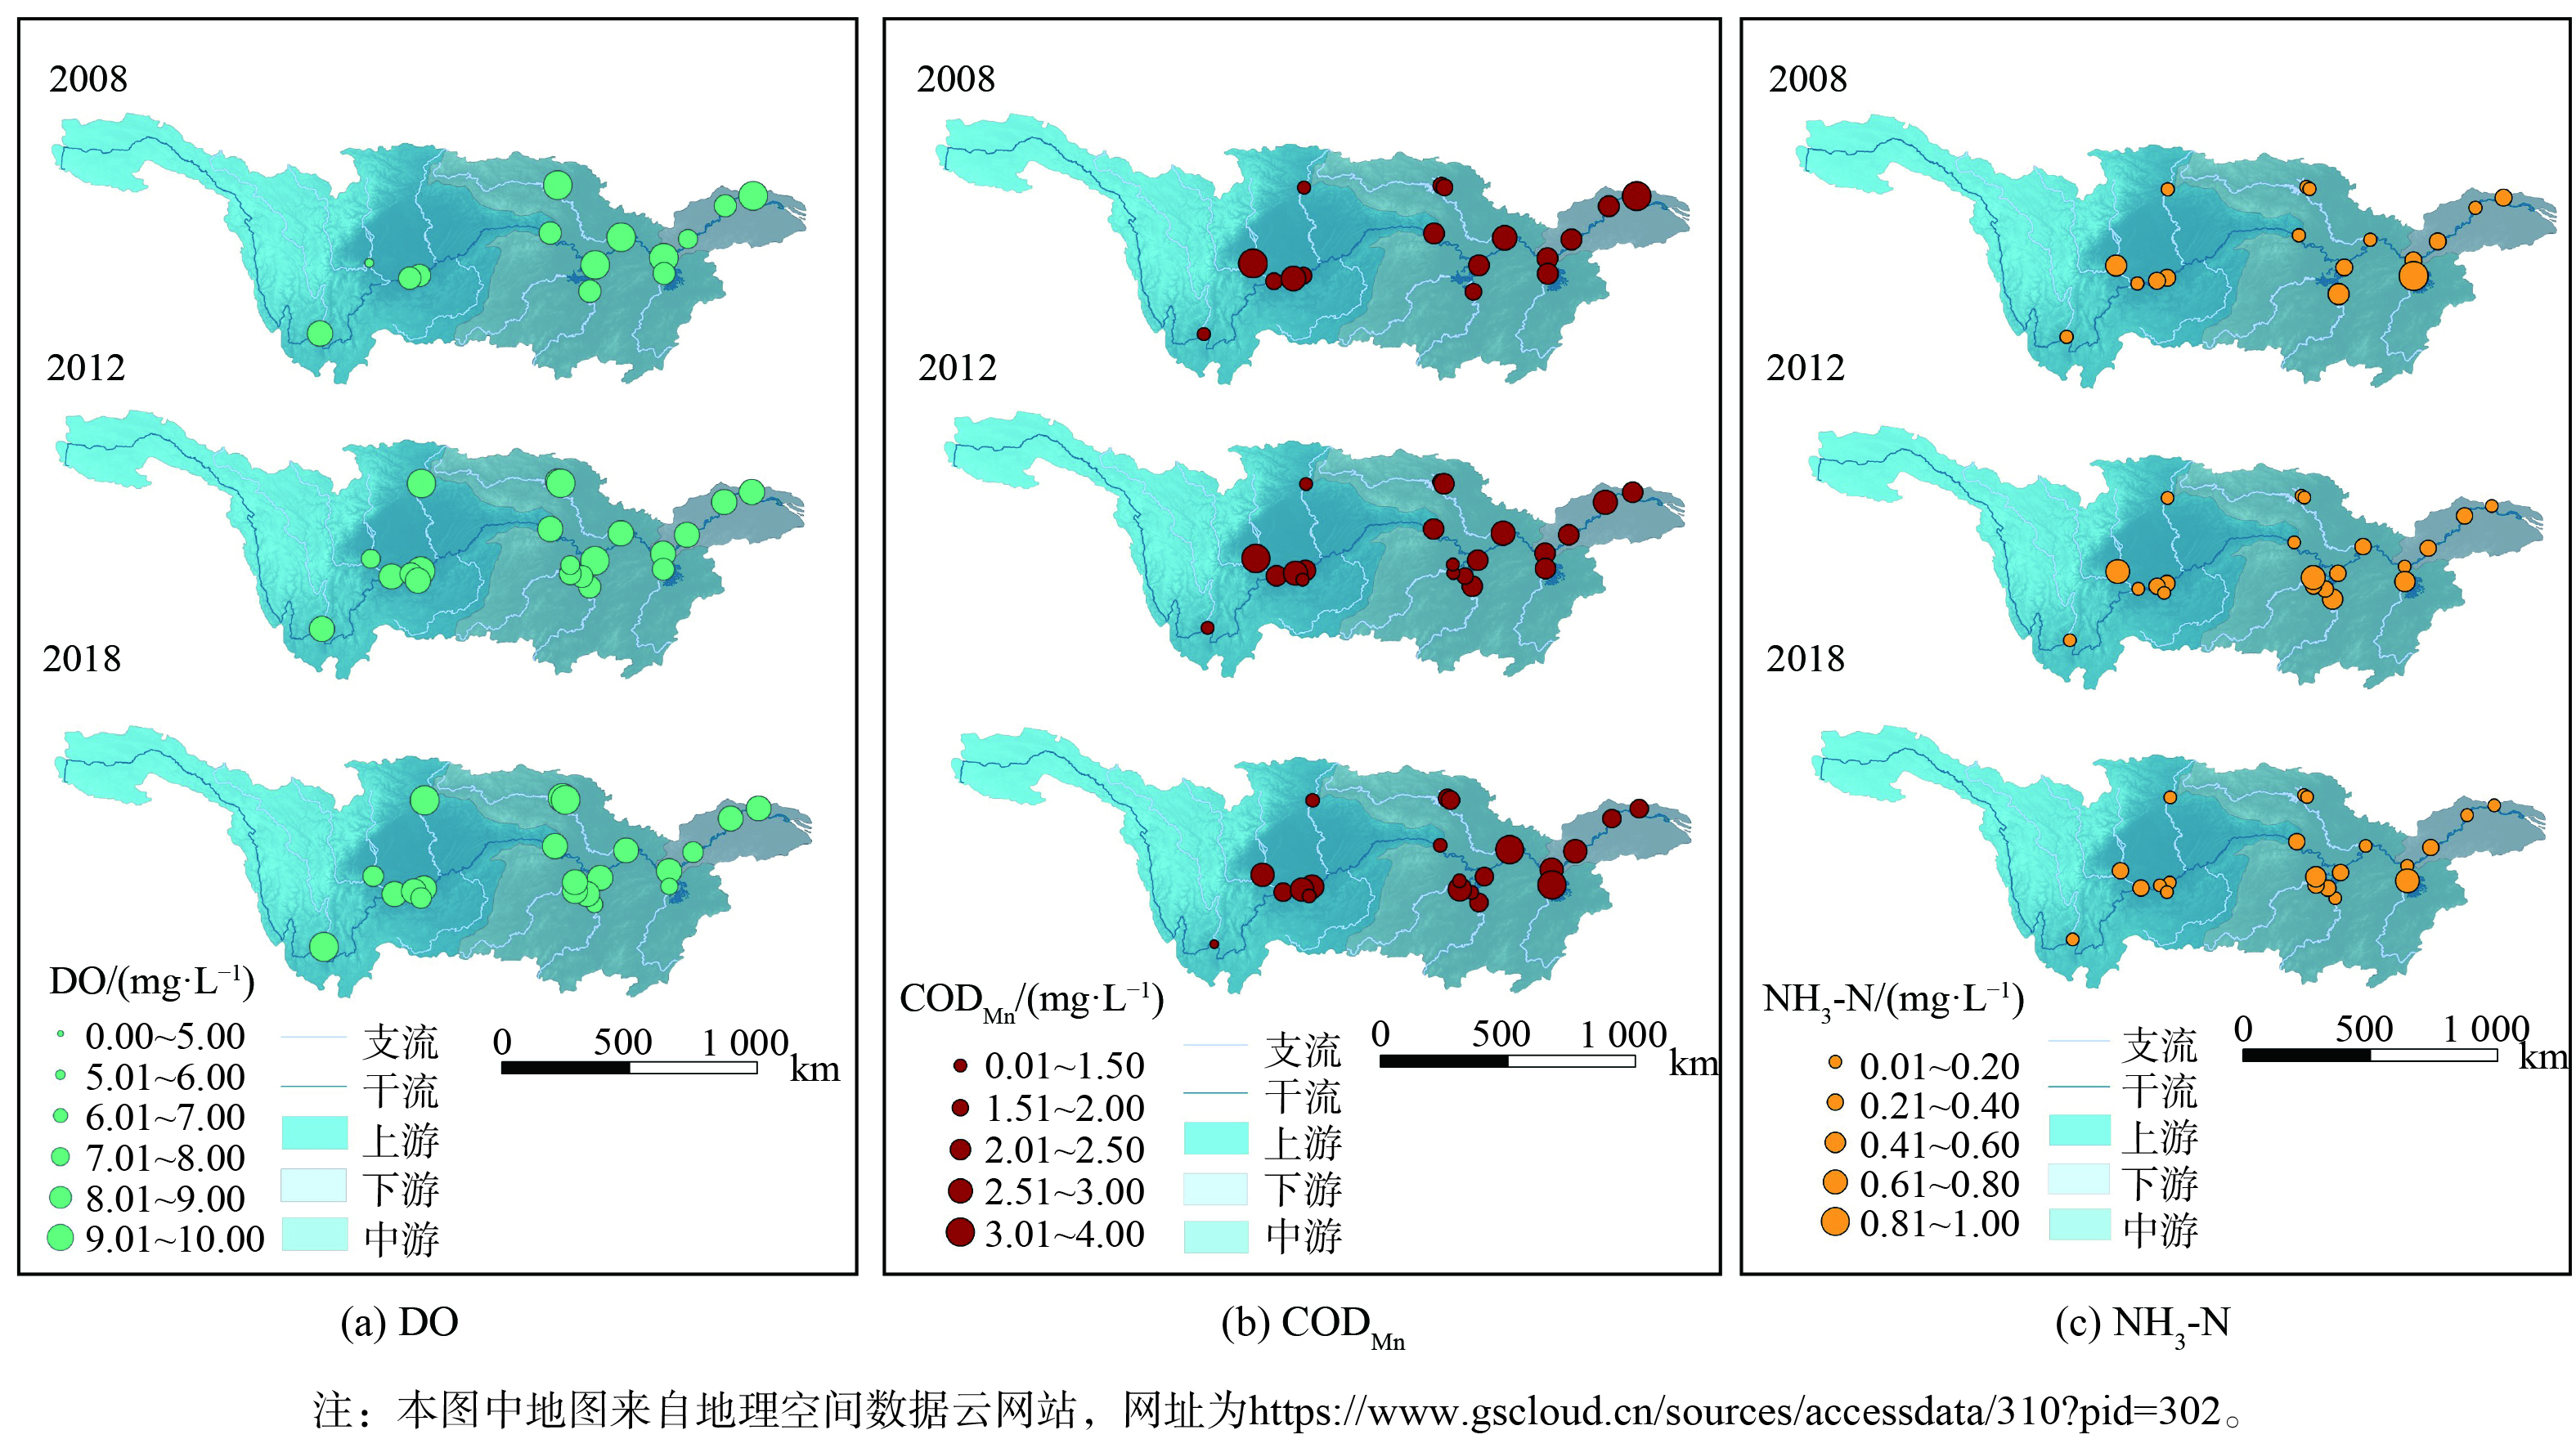
图 4 长江流域DO、CODMn和NH3-N空间分布 (2008—2018年)
Figure 4. Spatial distribution of DO, CODMn and NH3-N in the Yangtze river Basin (2008—2018)
-

图 5 DO、CODMn和NH3-N相关性图
Figure 5. Correlation diagram of DO、CODMn and NH3-N
-

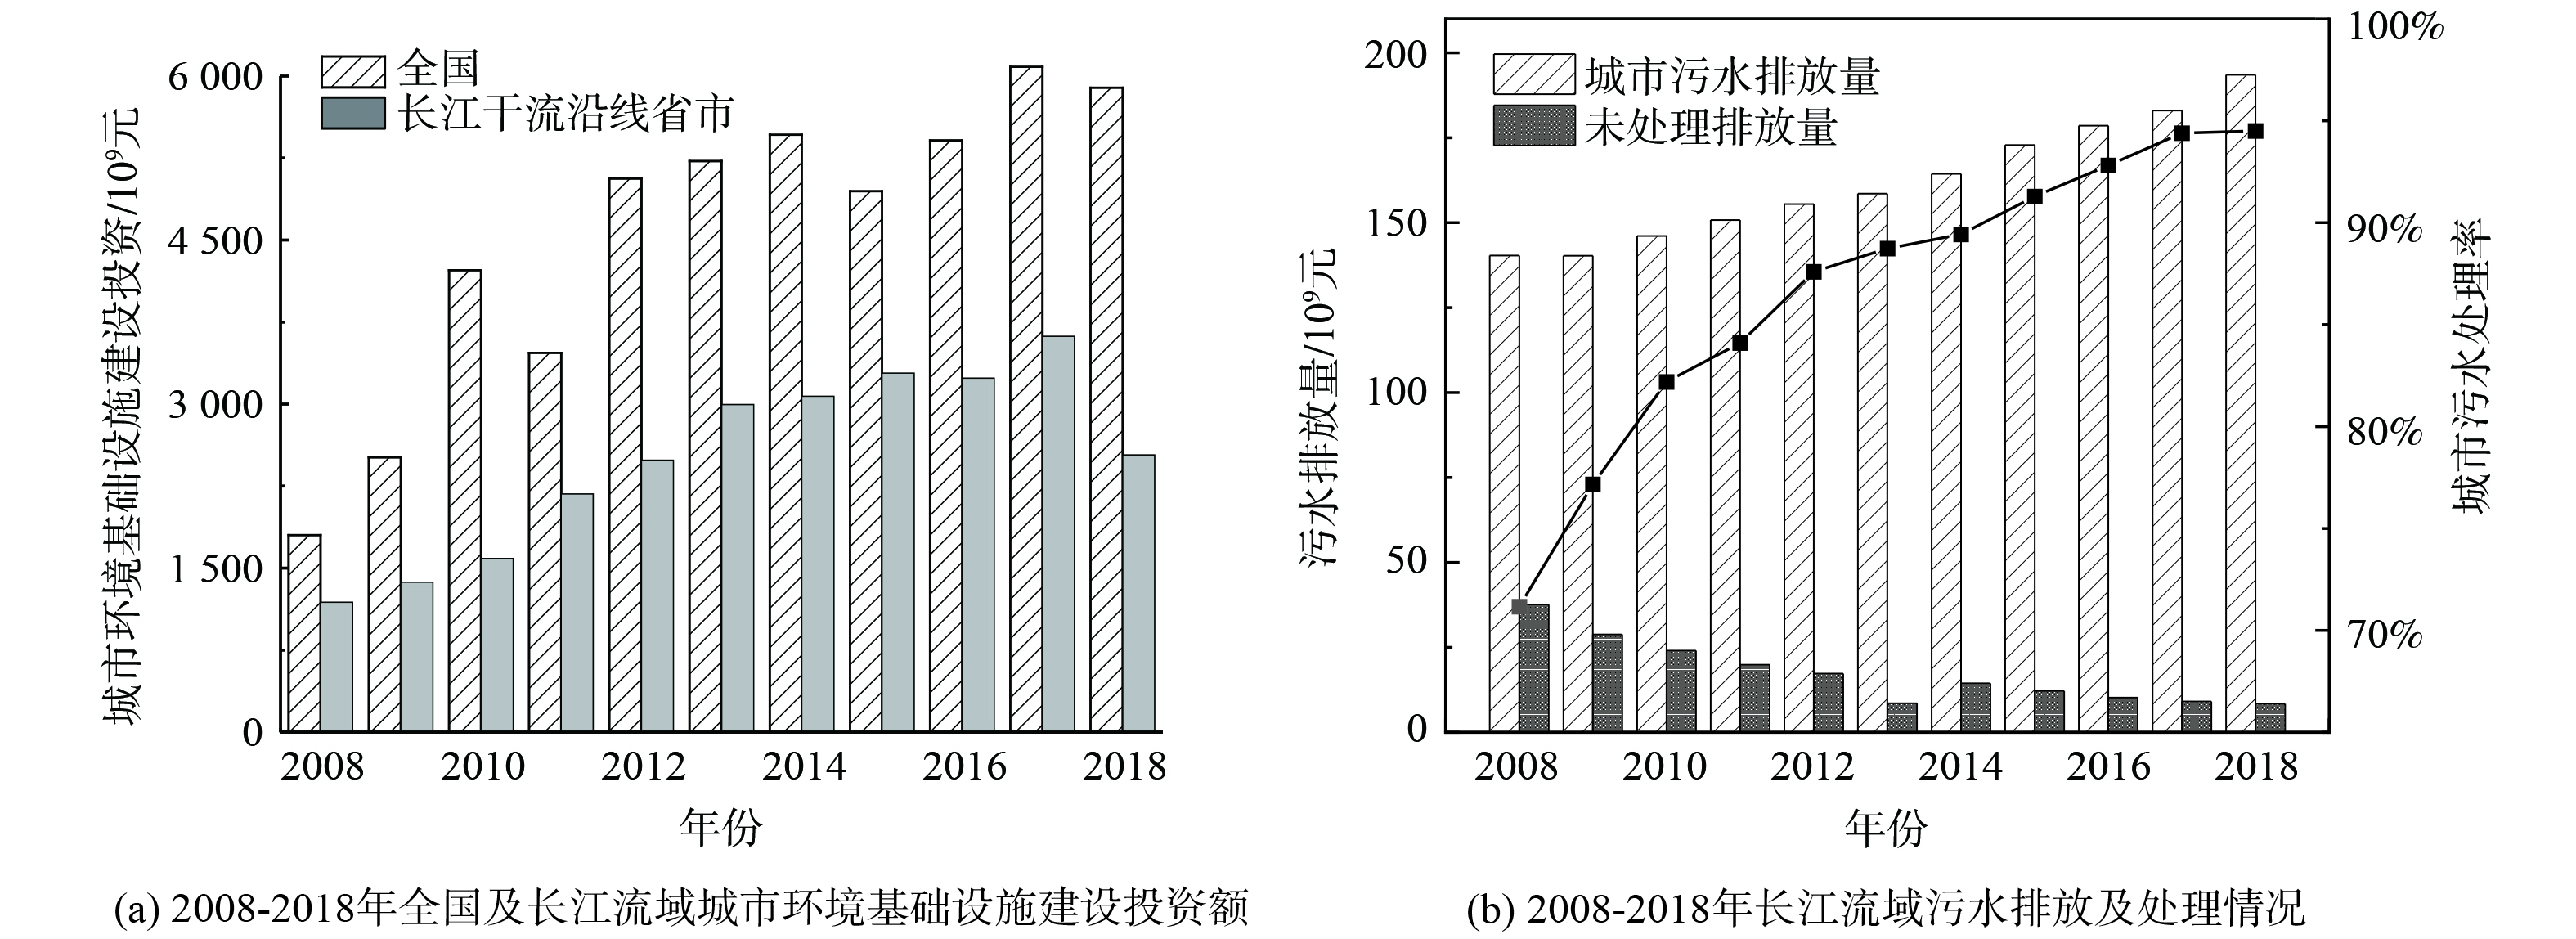
图 6 2008—2018年环境基础设施建设投资额与污水排放情况
Figure 6. The investment in environmental infrastructure construction and urban sewage emissions in cities of the Yangtze river basin from 2008 to 2018
Figure
6 ,Table
0 个