-

图 1 正渗透装置示意图
Figure 1. Structure diagram of Forward Osmosis device
-
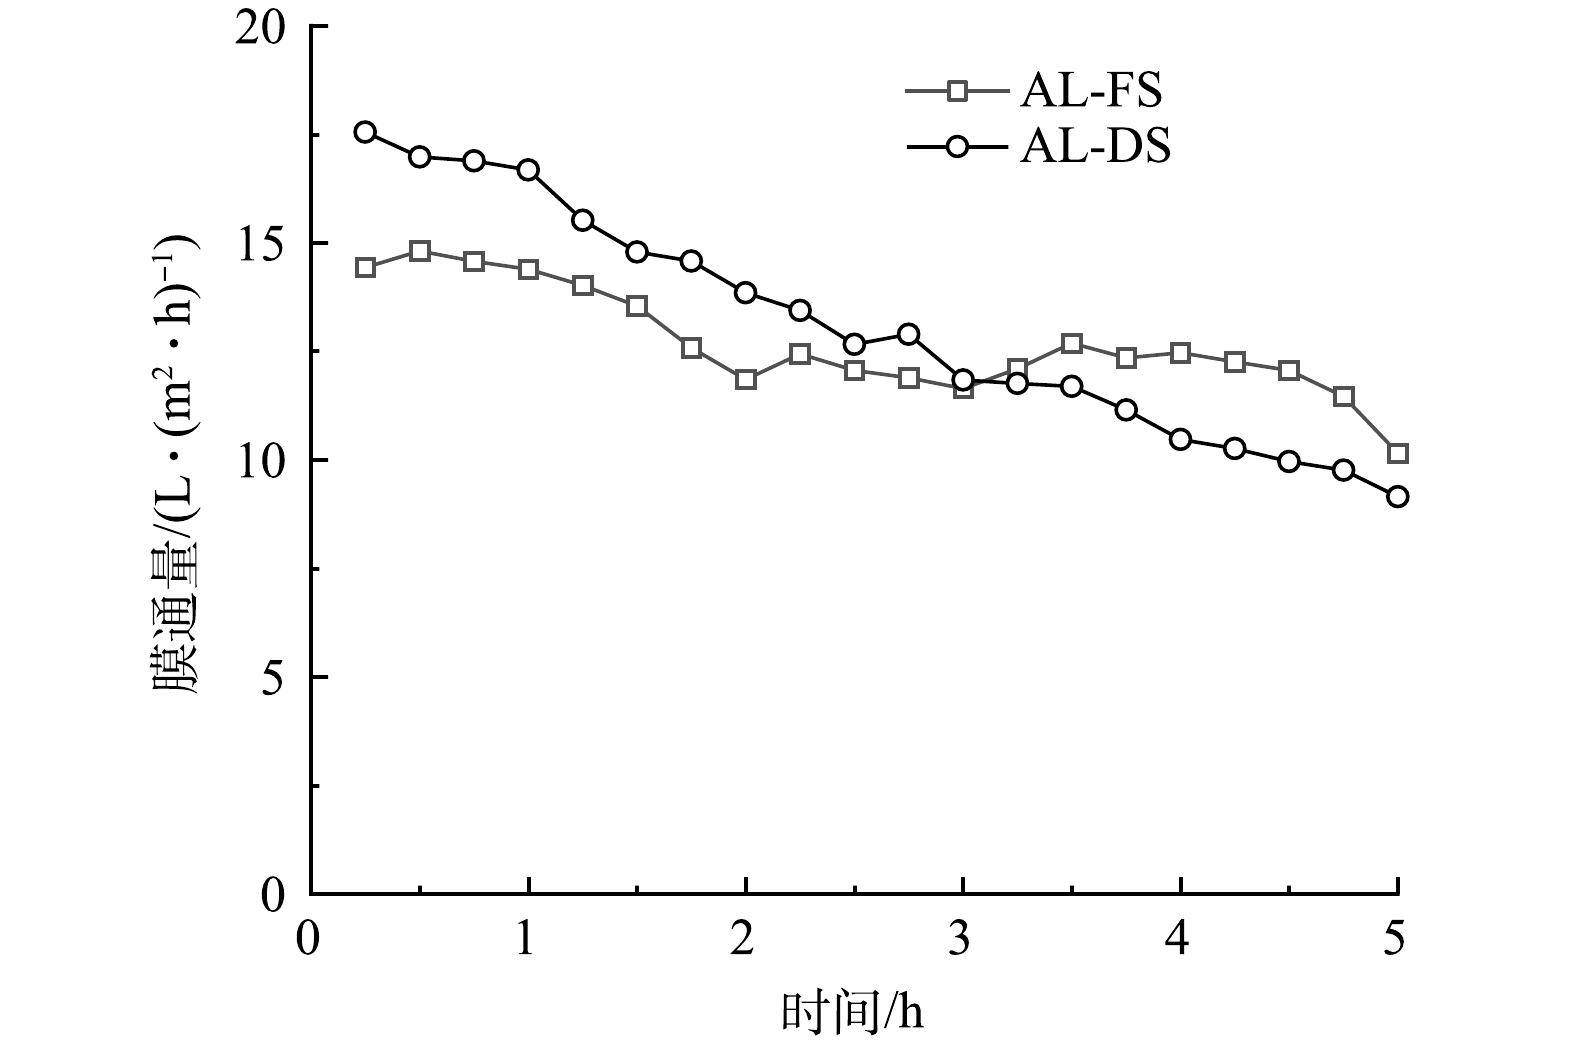
图 2 AL-DS模式和 AL-FS模式下的膜通量
Figure 2. Membrane flux for the AL-DS mode and the AL-FS mode
-
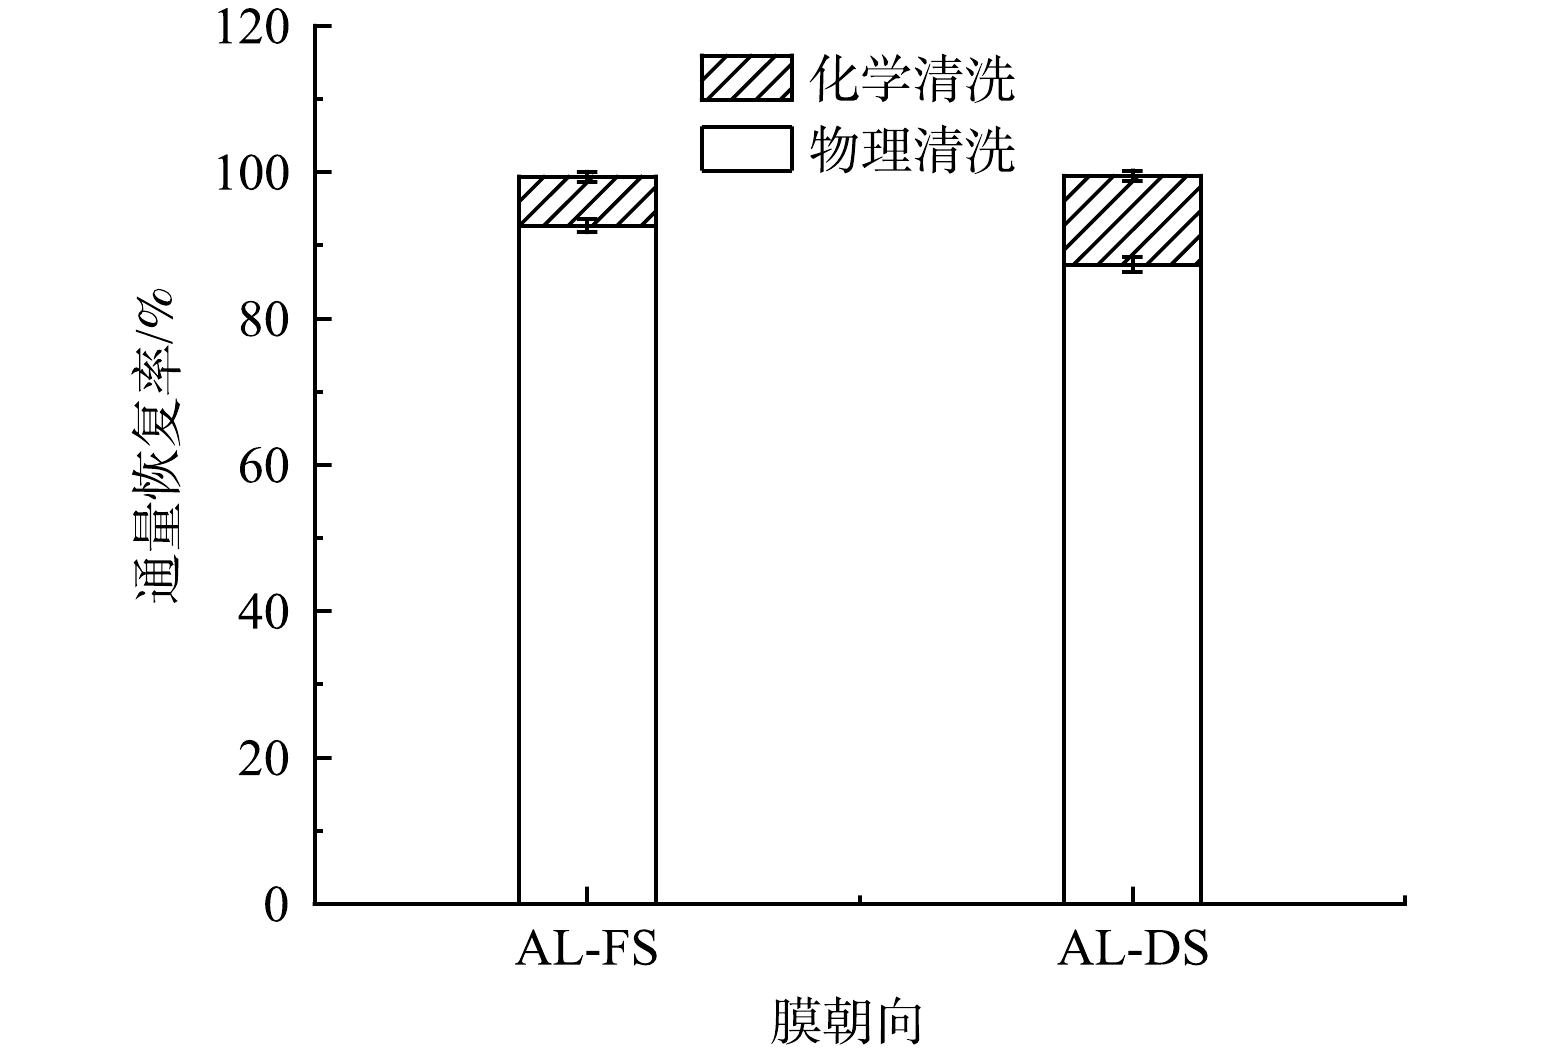
图 3 物理和化学清洗后通量恢复率
Figure 3. Flux recovery rate after physical and chemical cleaning
-

图 4 不同汲取液浓度对 FO 膜通量的影响
Figure 4. Influence of draw solution concentration on membrane flux of FO membrane
-
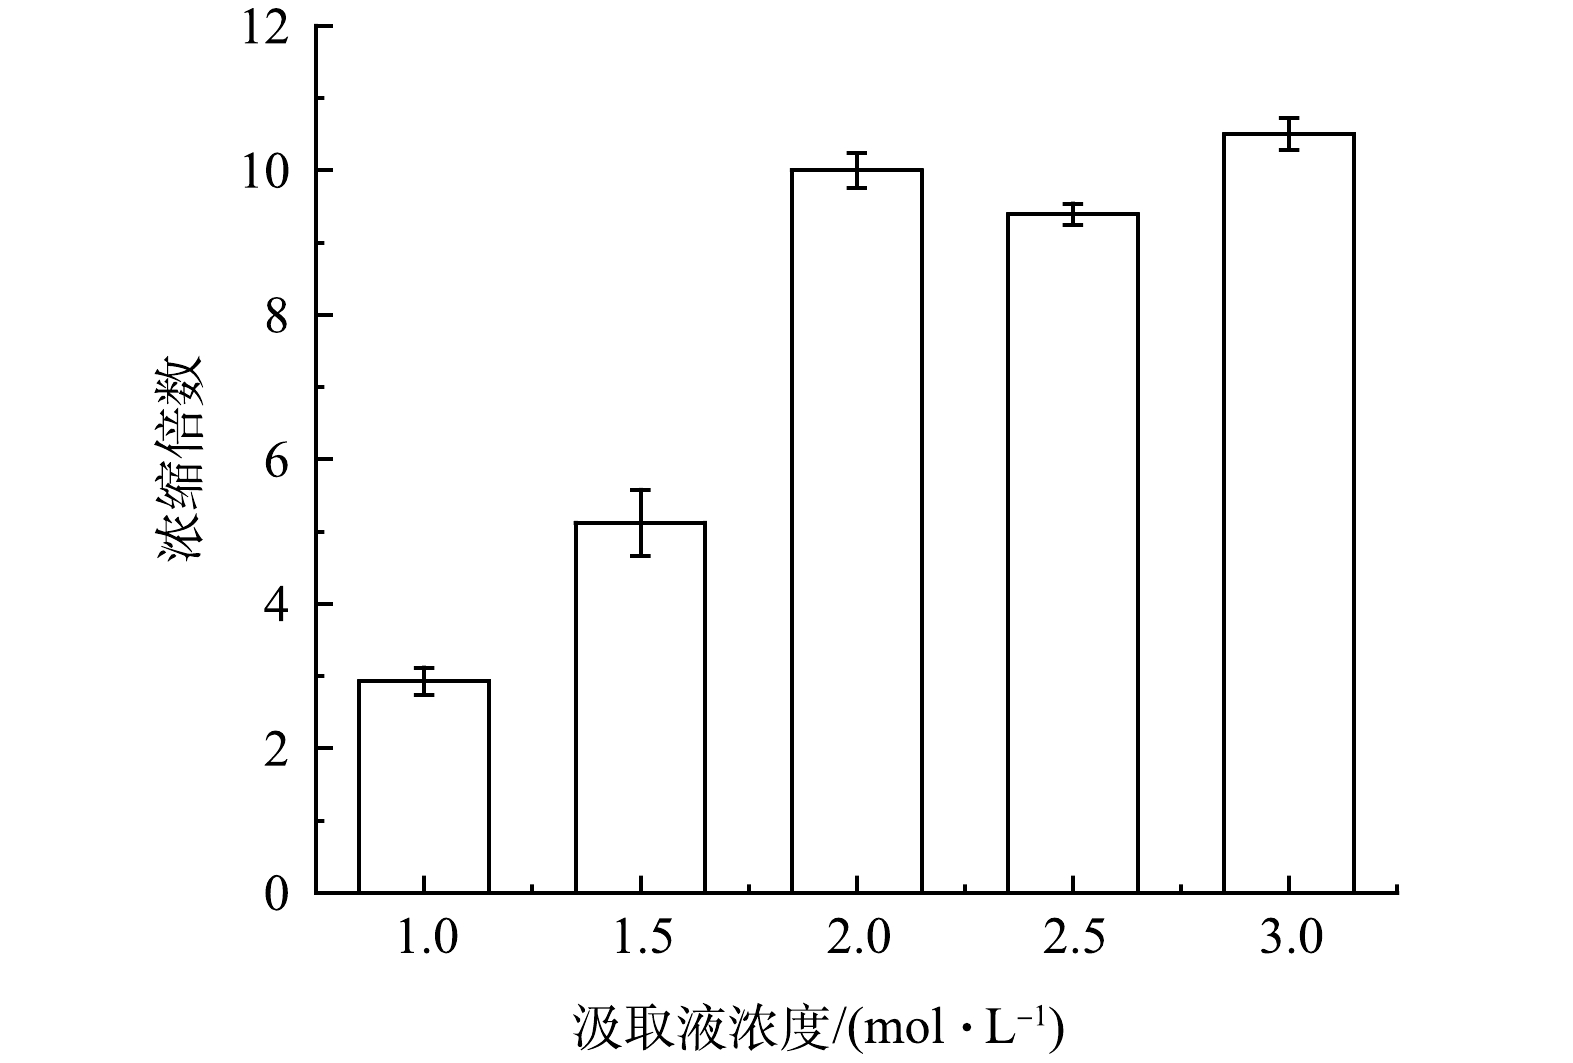
图 5 不同汲取液浓度的正渗透浓缩倍数
Figure 5. Forward osmosis concentration ratio at different draw solution concentrations
-
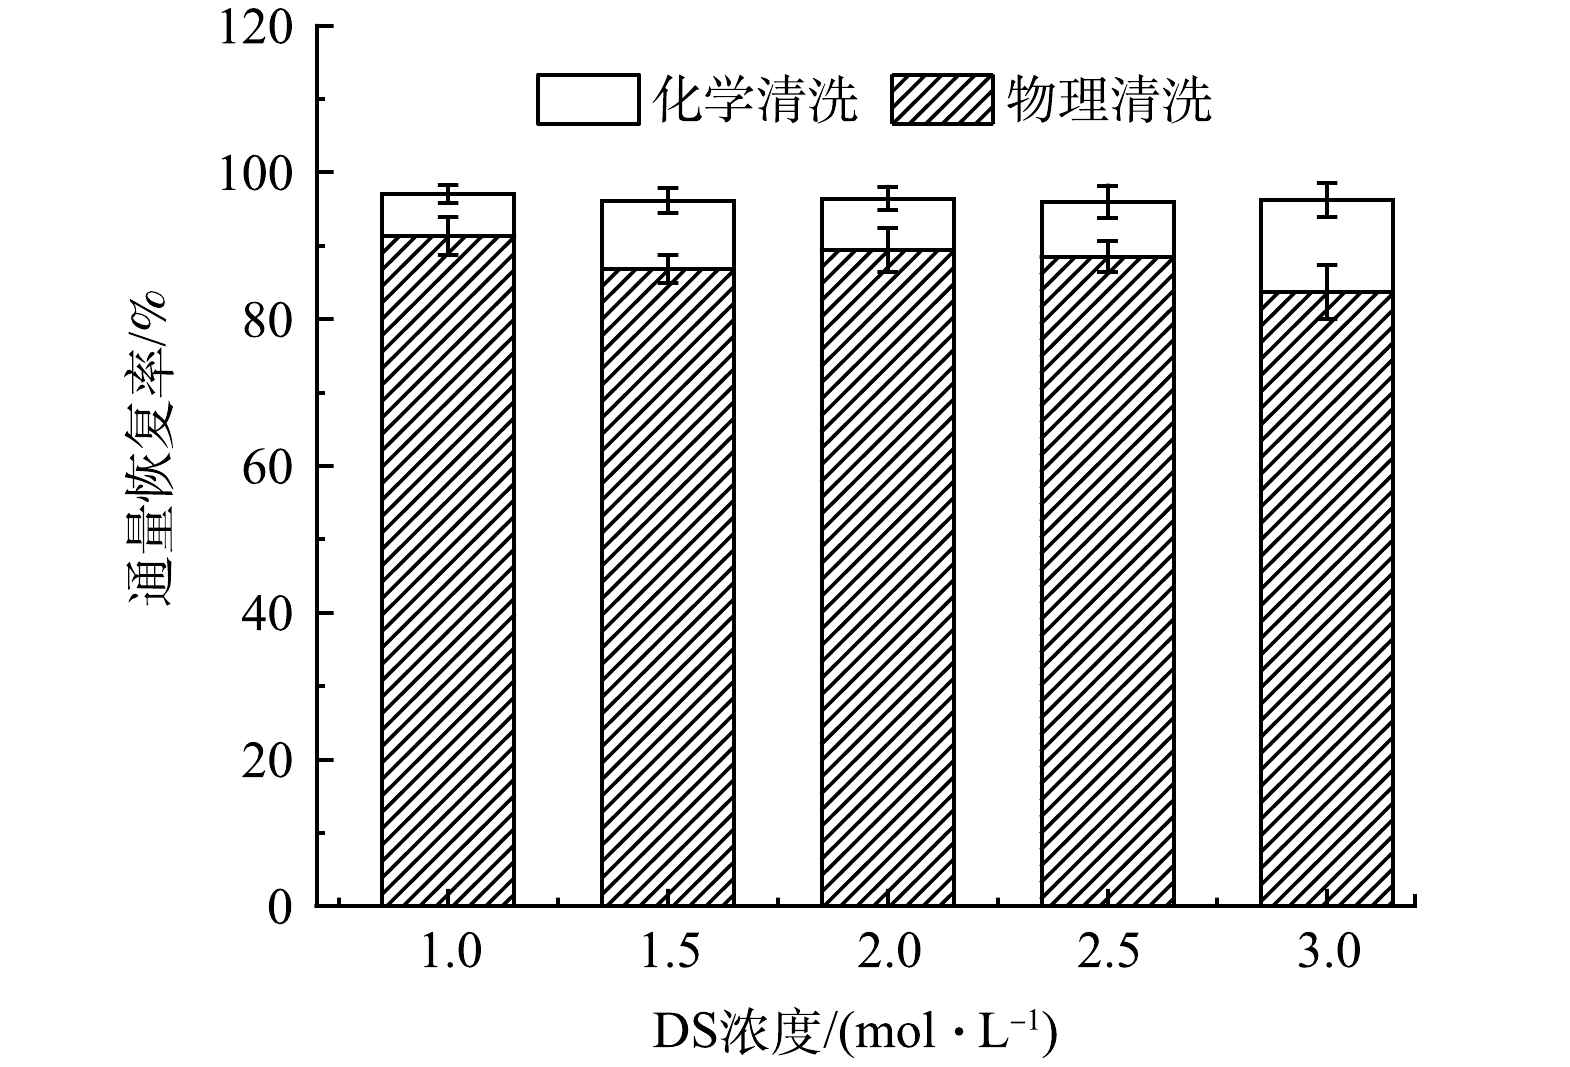
图 6 不同汲取液浓度下通量恢复情况
Figure 6. Flux recovery at different concentrations of draw solution
-

图 7 不同错流速率下的膜通量变化
Figure 7. Membrane flux changes at different cross-flow rates
-
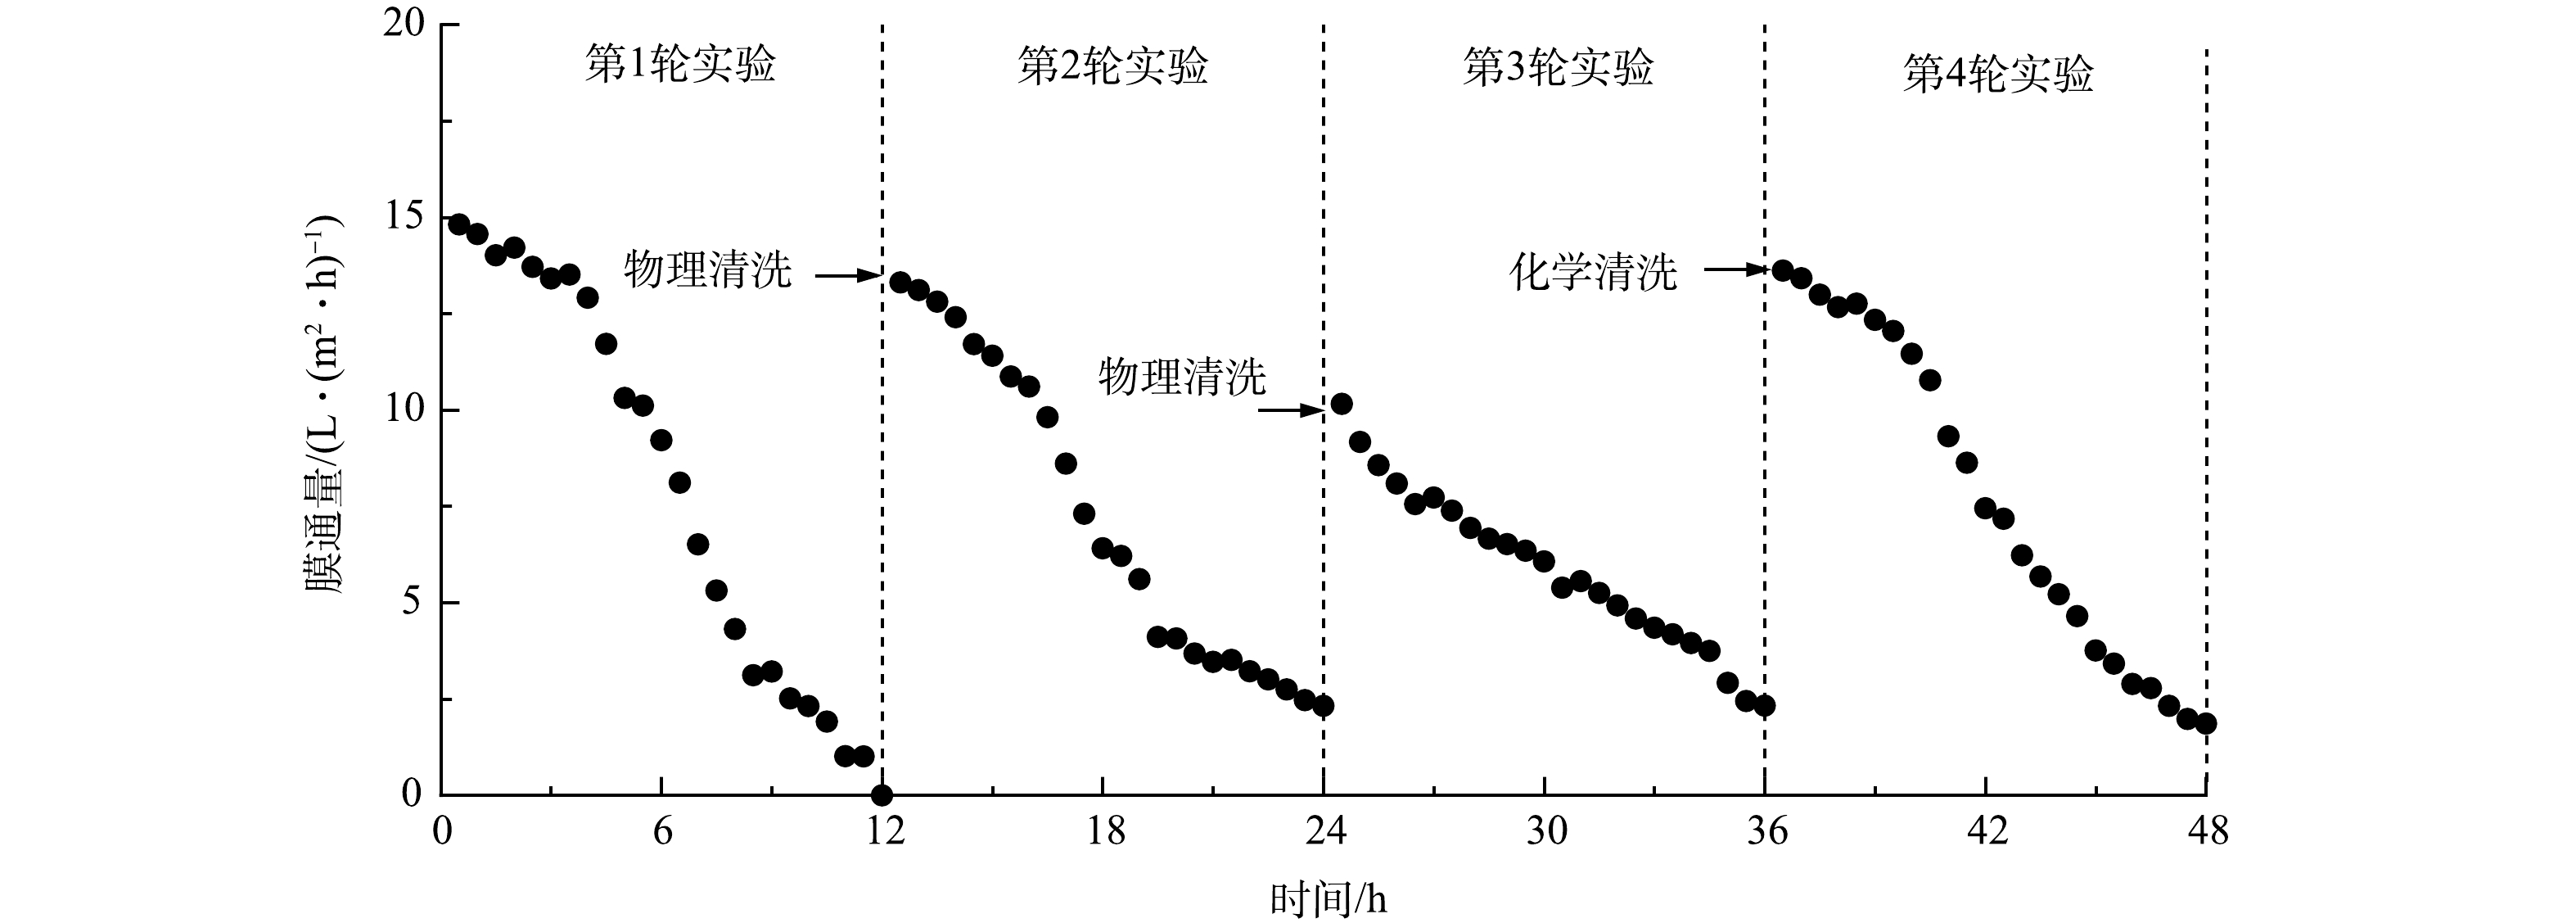
图 8 长期运行膜通量变化
Figure 8. Membrane flux changes along a long-term operation
-
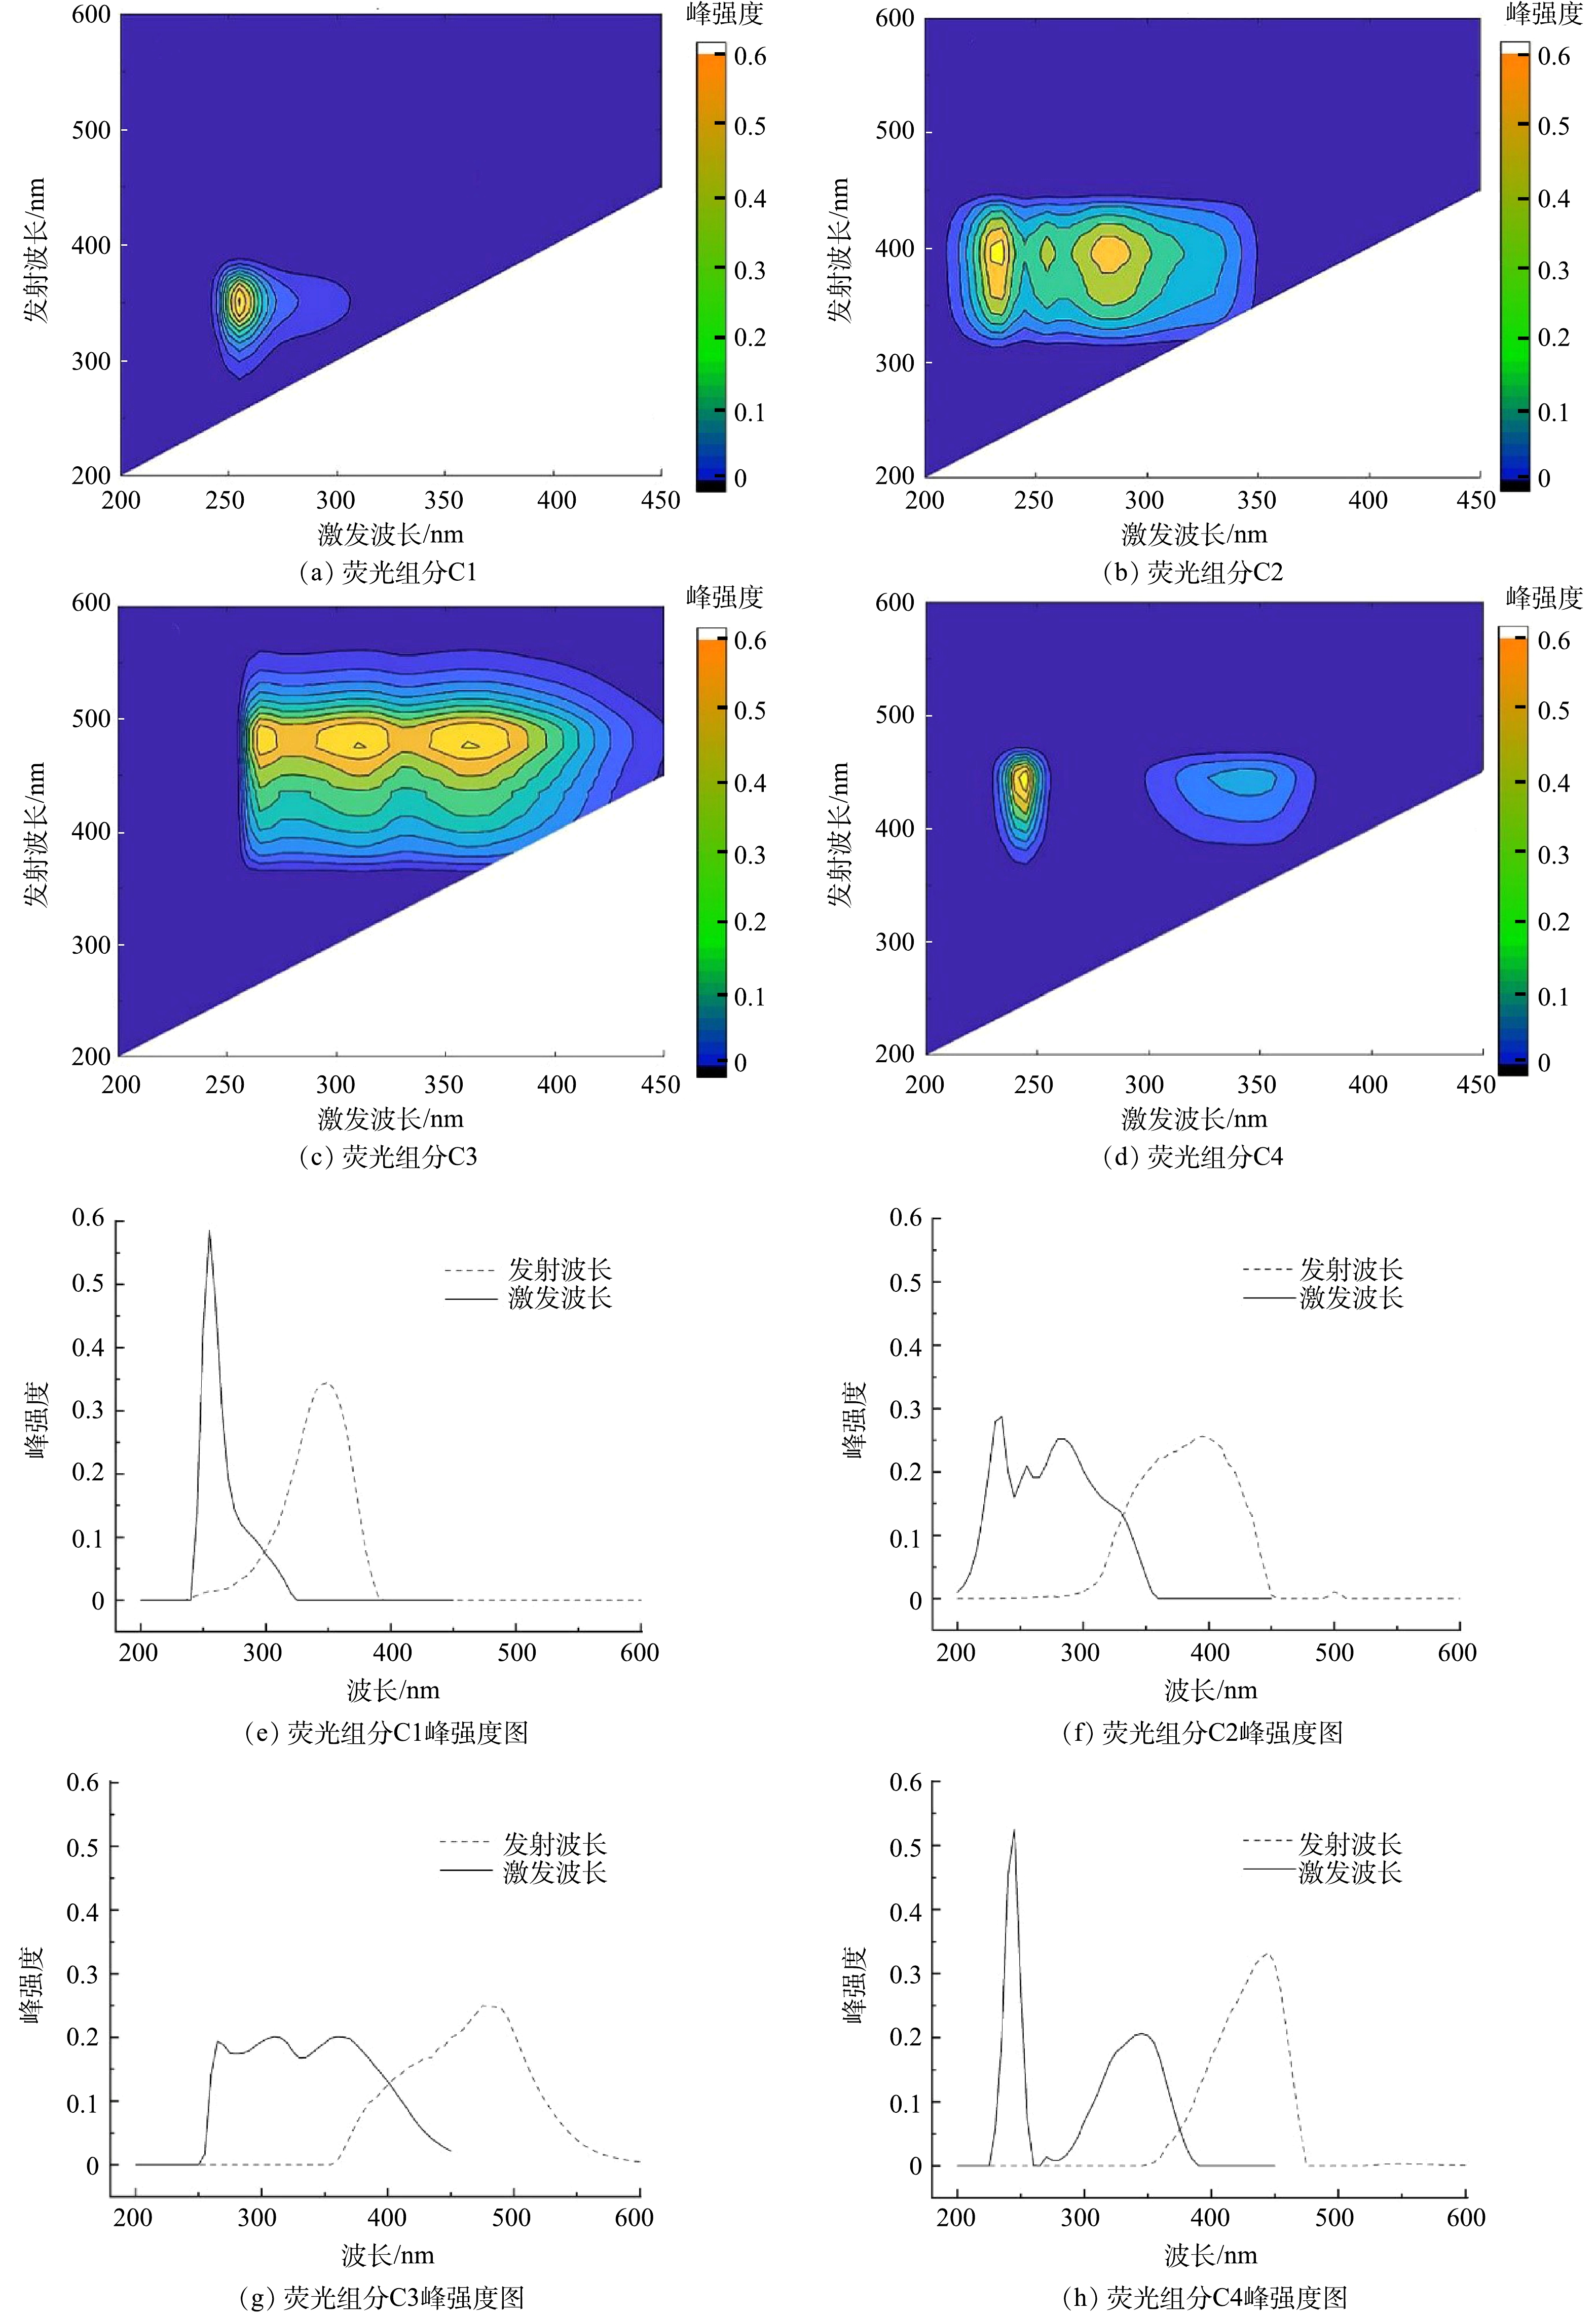
图 9 PARAFAC模型识别出的4个不同的荧光组分及其对应峰强度图
Figure 9. Four fluorescence components and the corresponding peak intensity plots identified by the PARAFAC
-
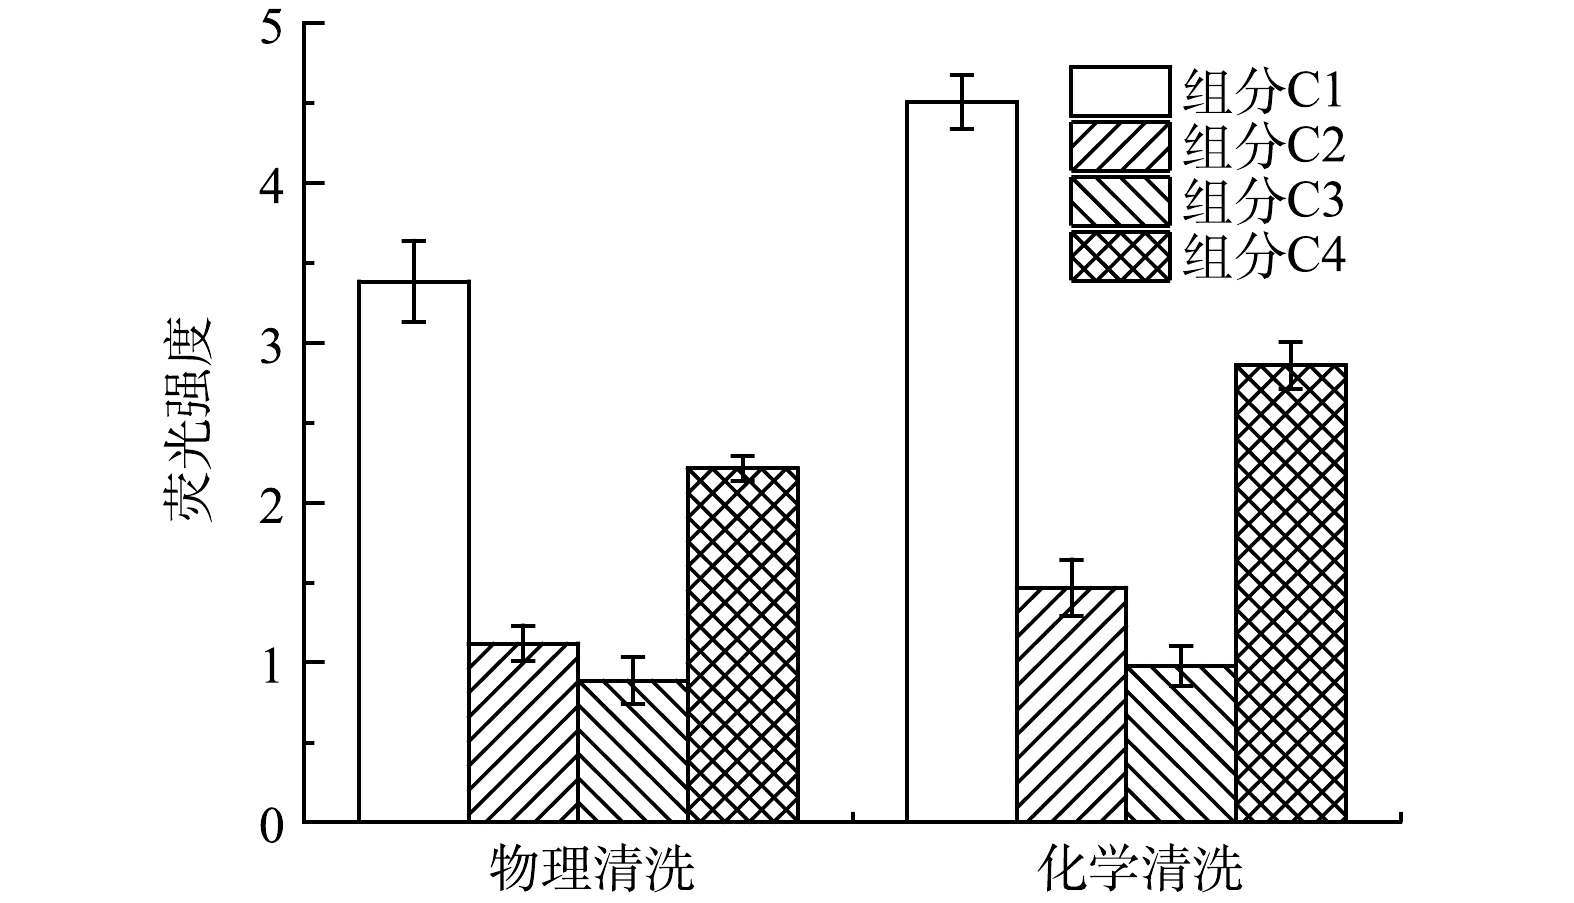
图 10 4个不同的荧光组分在膜污染中的强度
Figure 10. Intensities of four fluorescent components in the extracted membrane foulants
Figure
10 ,Table
2 个