-

图 1 膜曝气生物膜反应器(MABR)装置示意图
Figure 1. Diagram of membrane aeration biofilm reactor (MABR)
-

图 2 5个平行反应器启动运行阶段生物膜的表观结构特征
Figure 2. SEM characterization of the biofilm in the start-up operation of the reactors
-

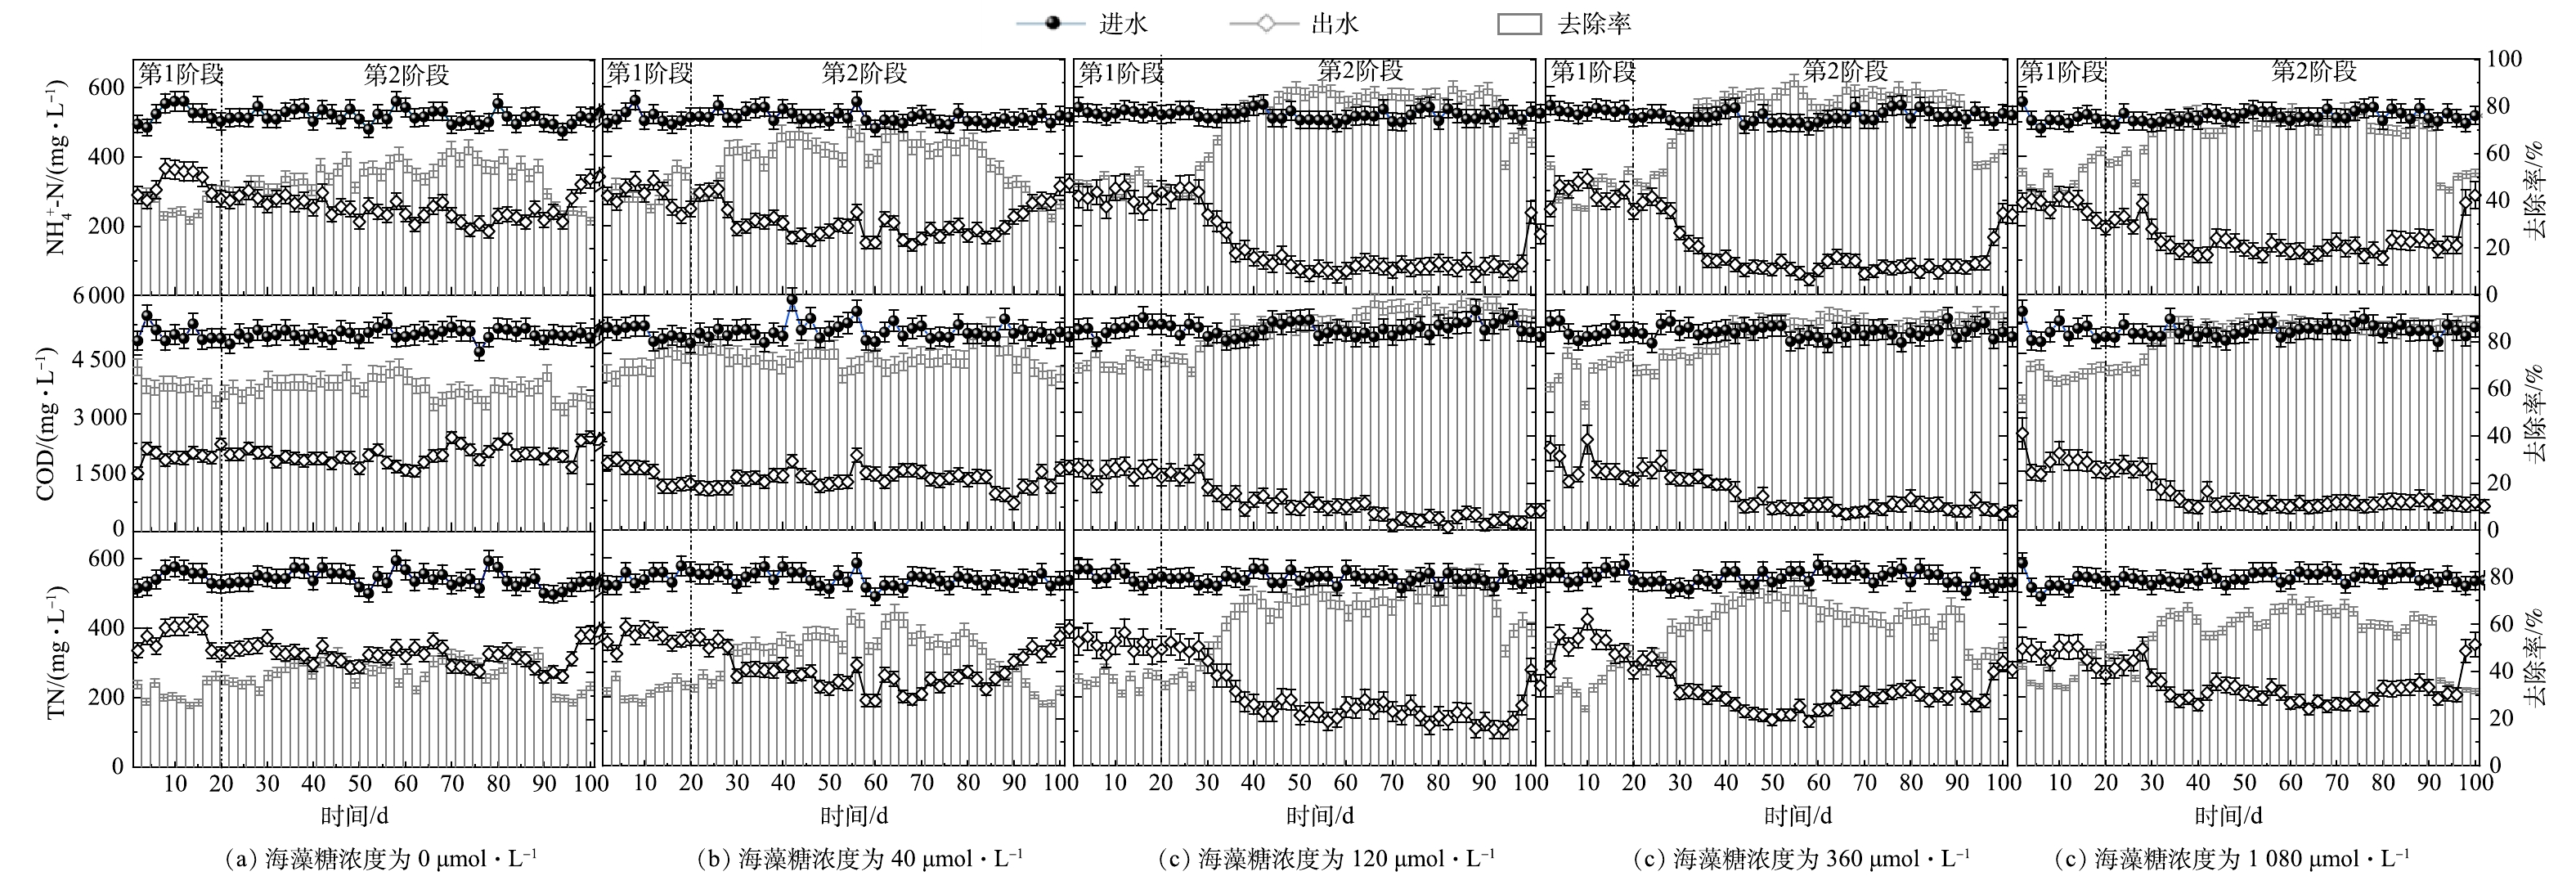
图 3 反应器启动运行性能
Figure 3. Performance of the reactors during the startup and operation
-

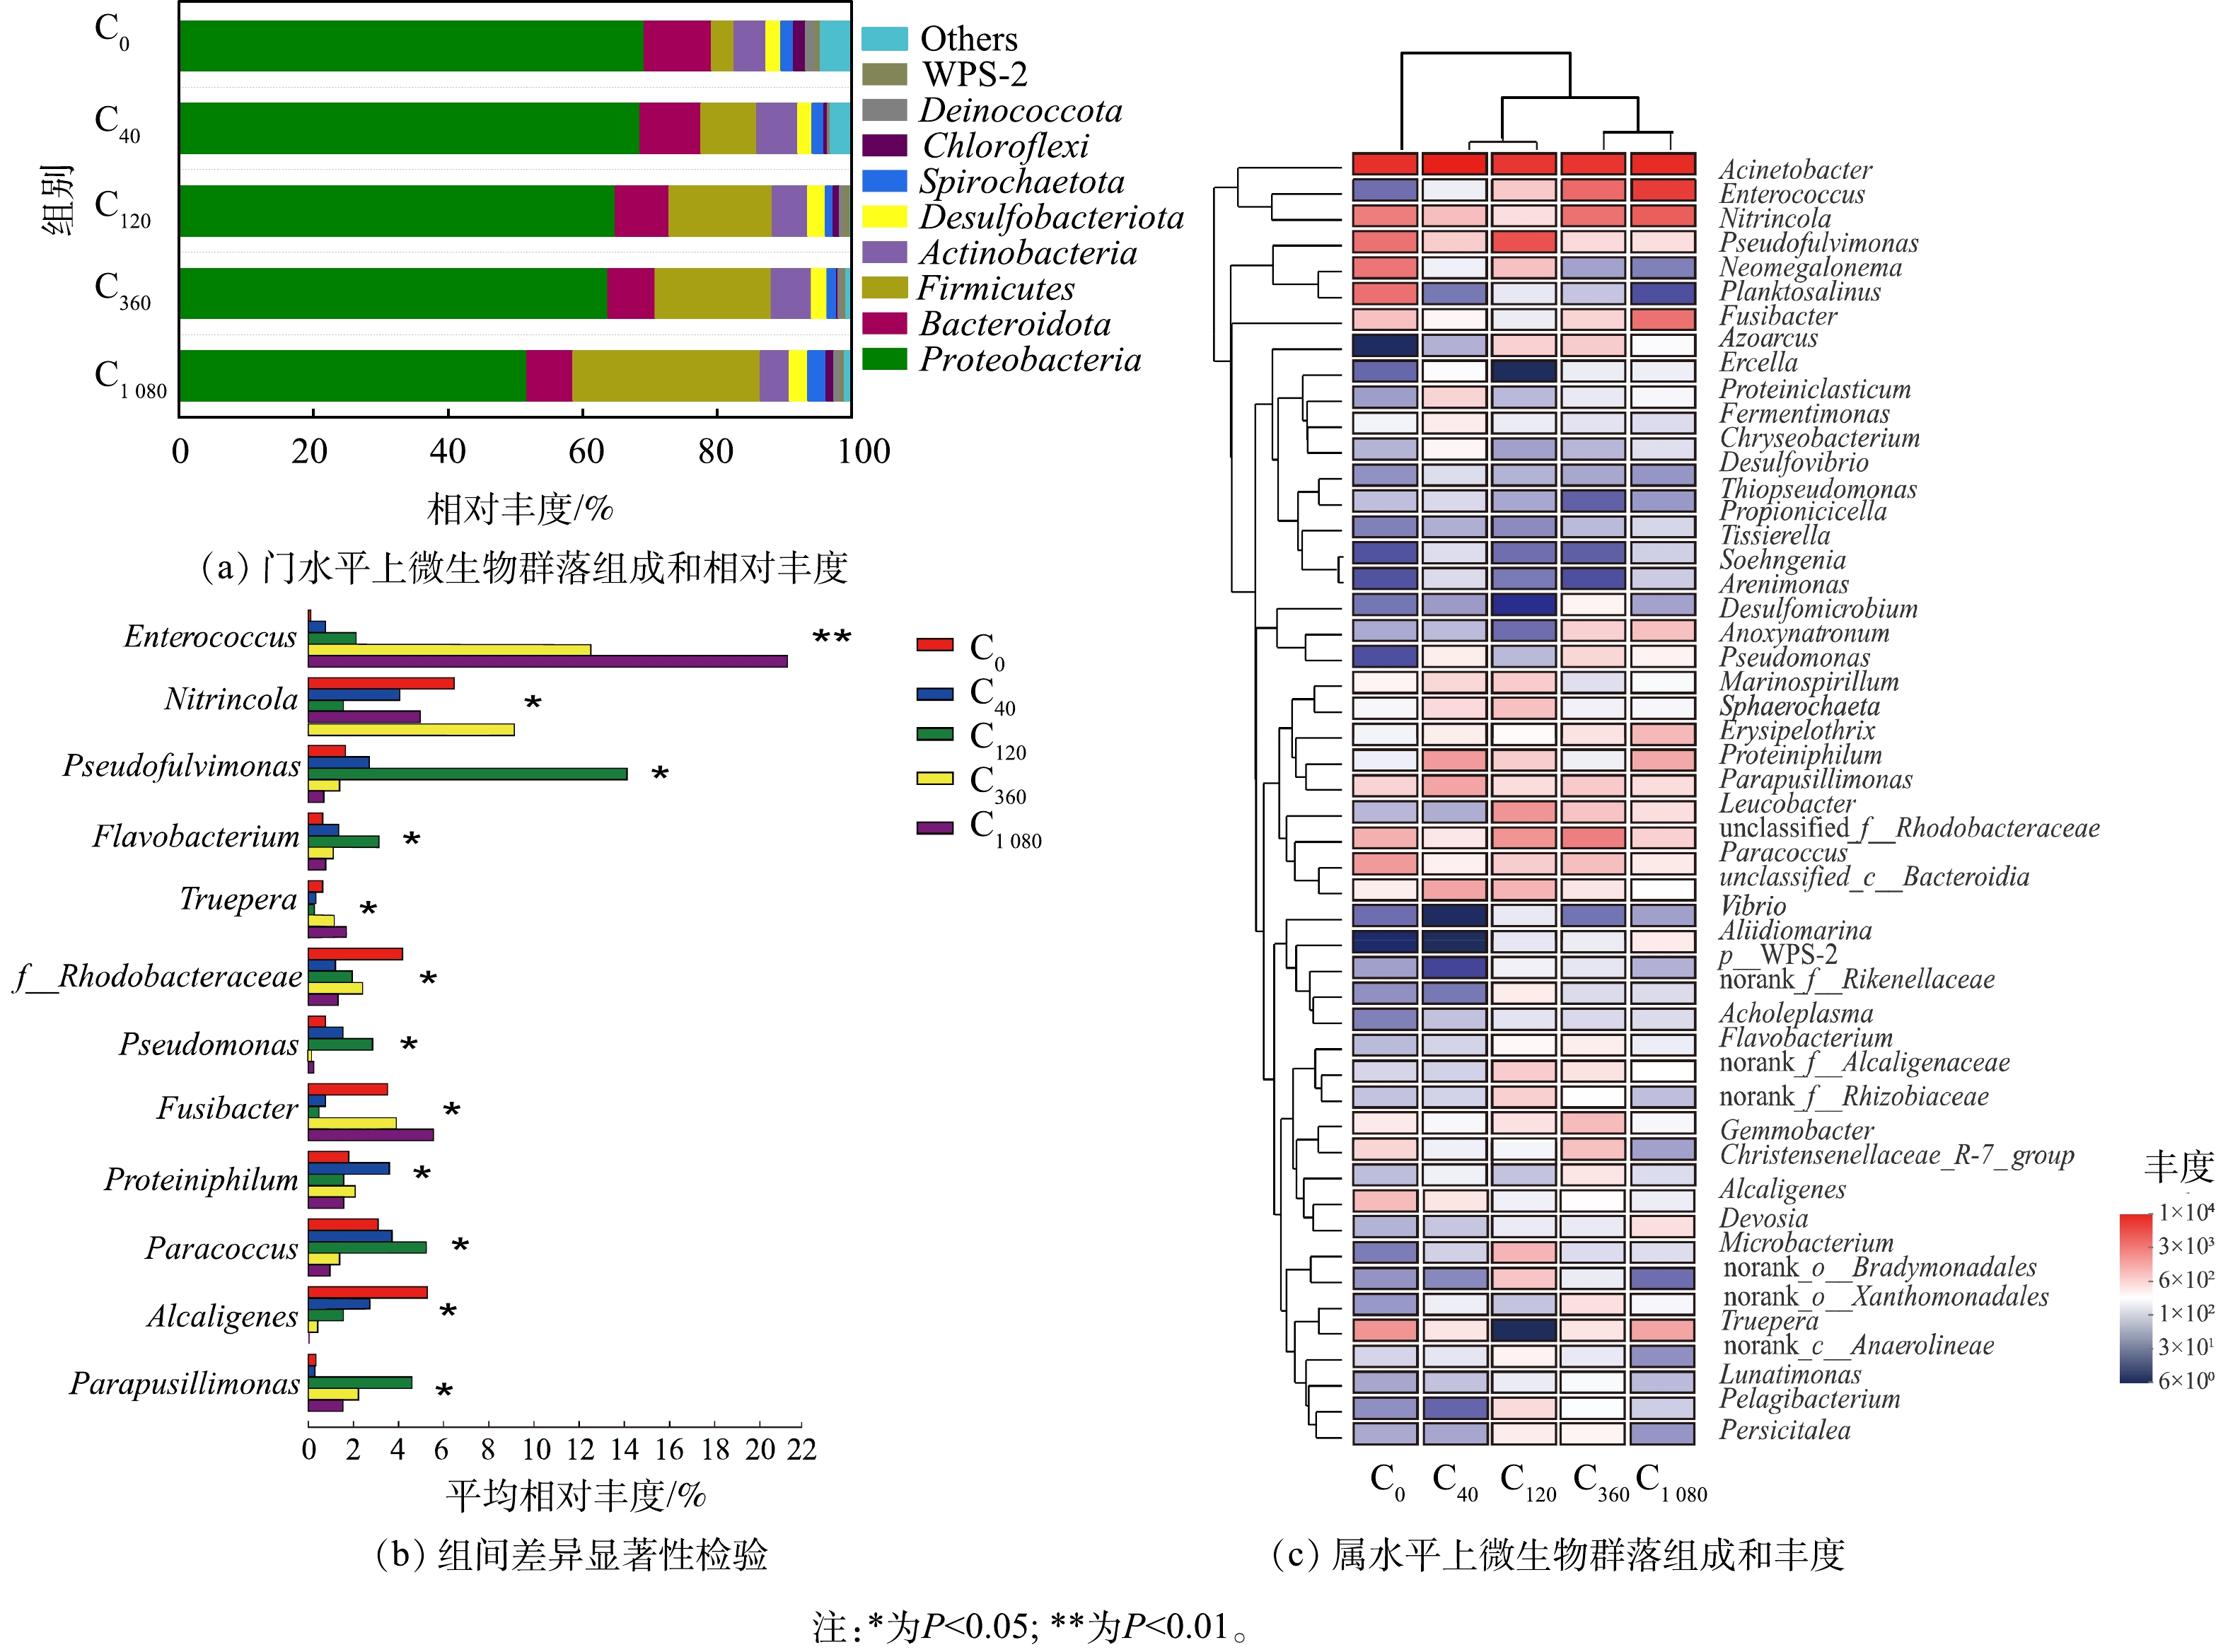
图 4 不同海藻糖浓度下微生物群落组成分析及组间差异显著性检验
Figure 4. Analysis of microbial community composition at different trehalose concentrations and significance test for differences between groups
-

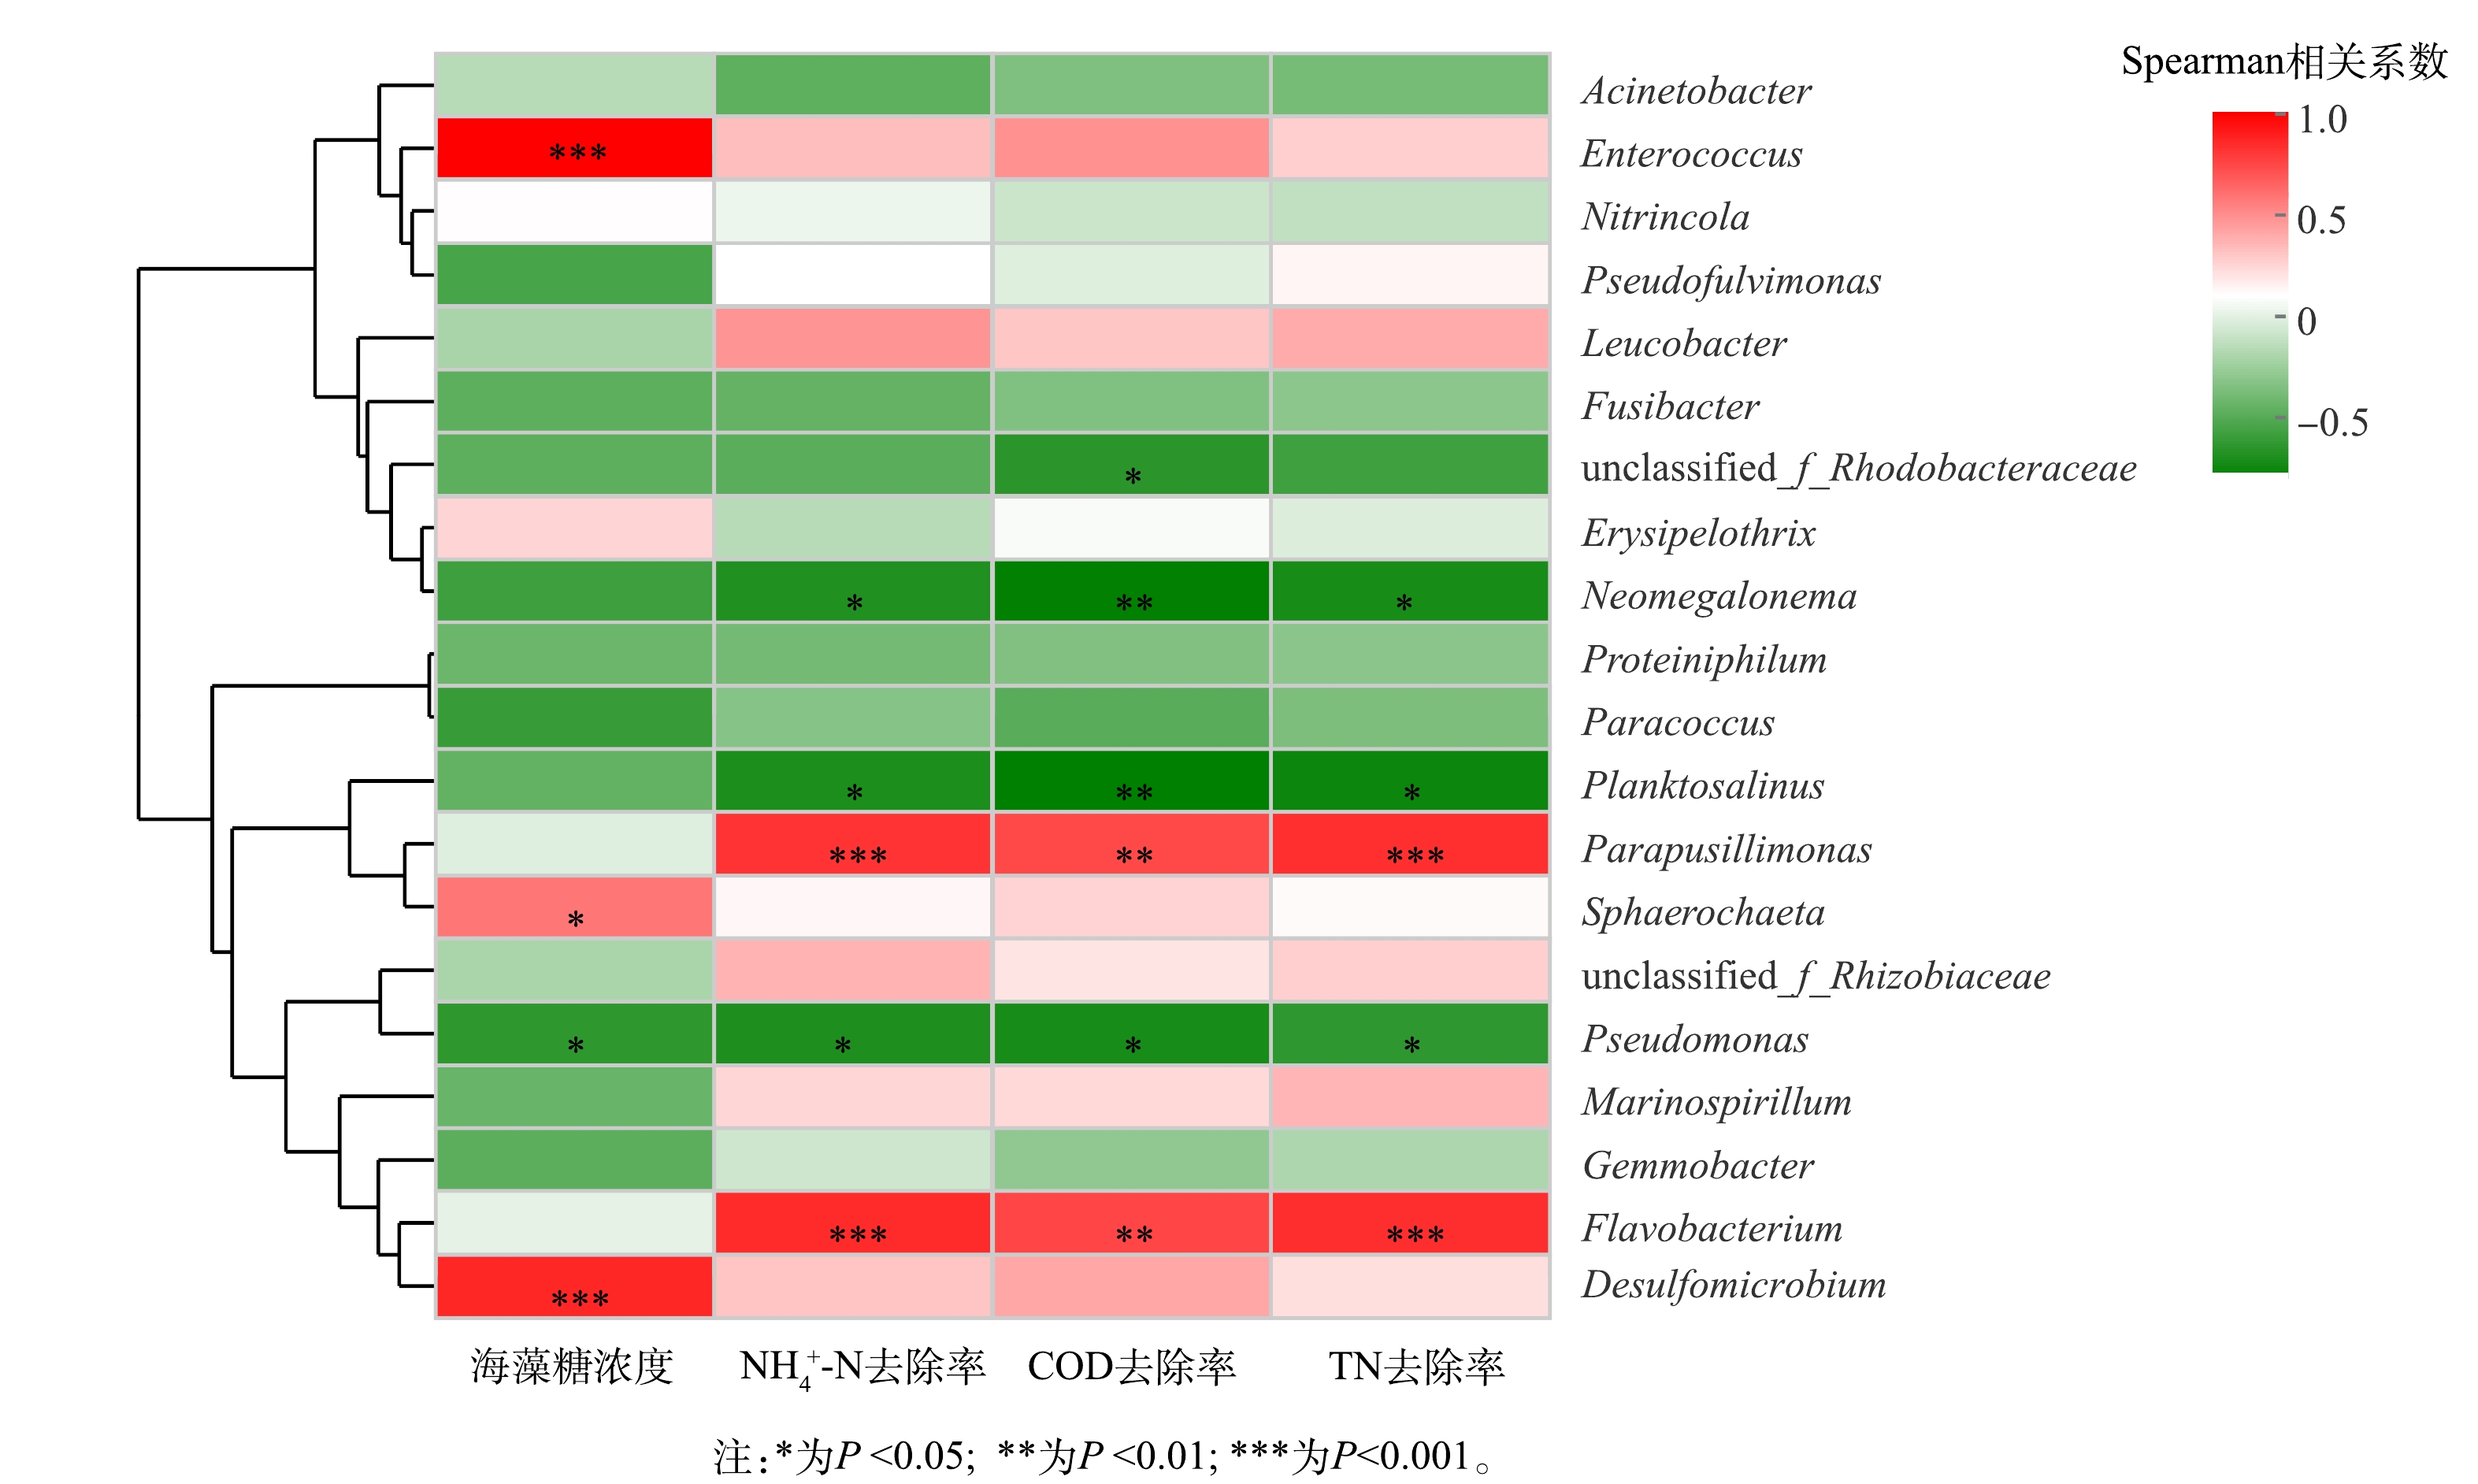
图 5 环境因子相关性分析
Figure 5. Environmental factor correlation analysis
-

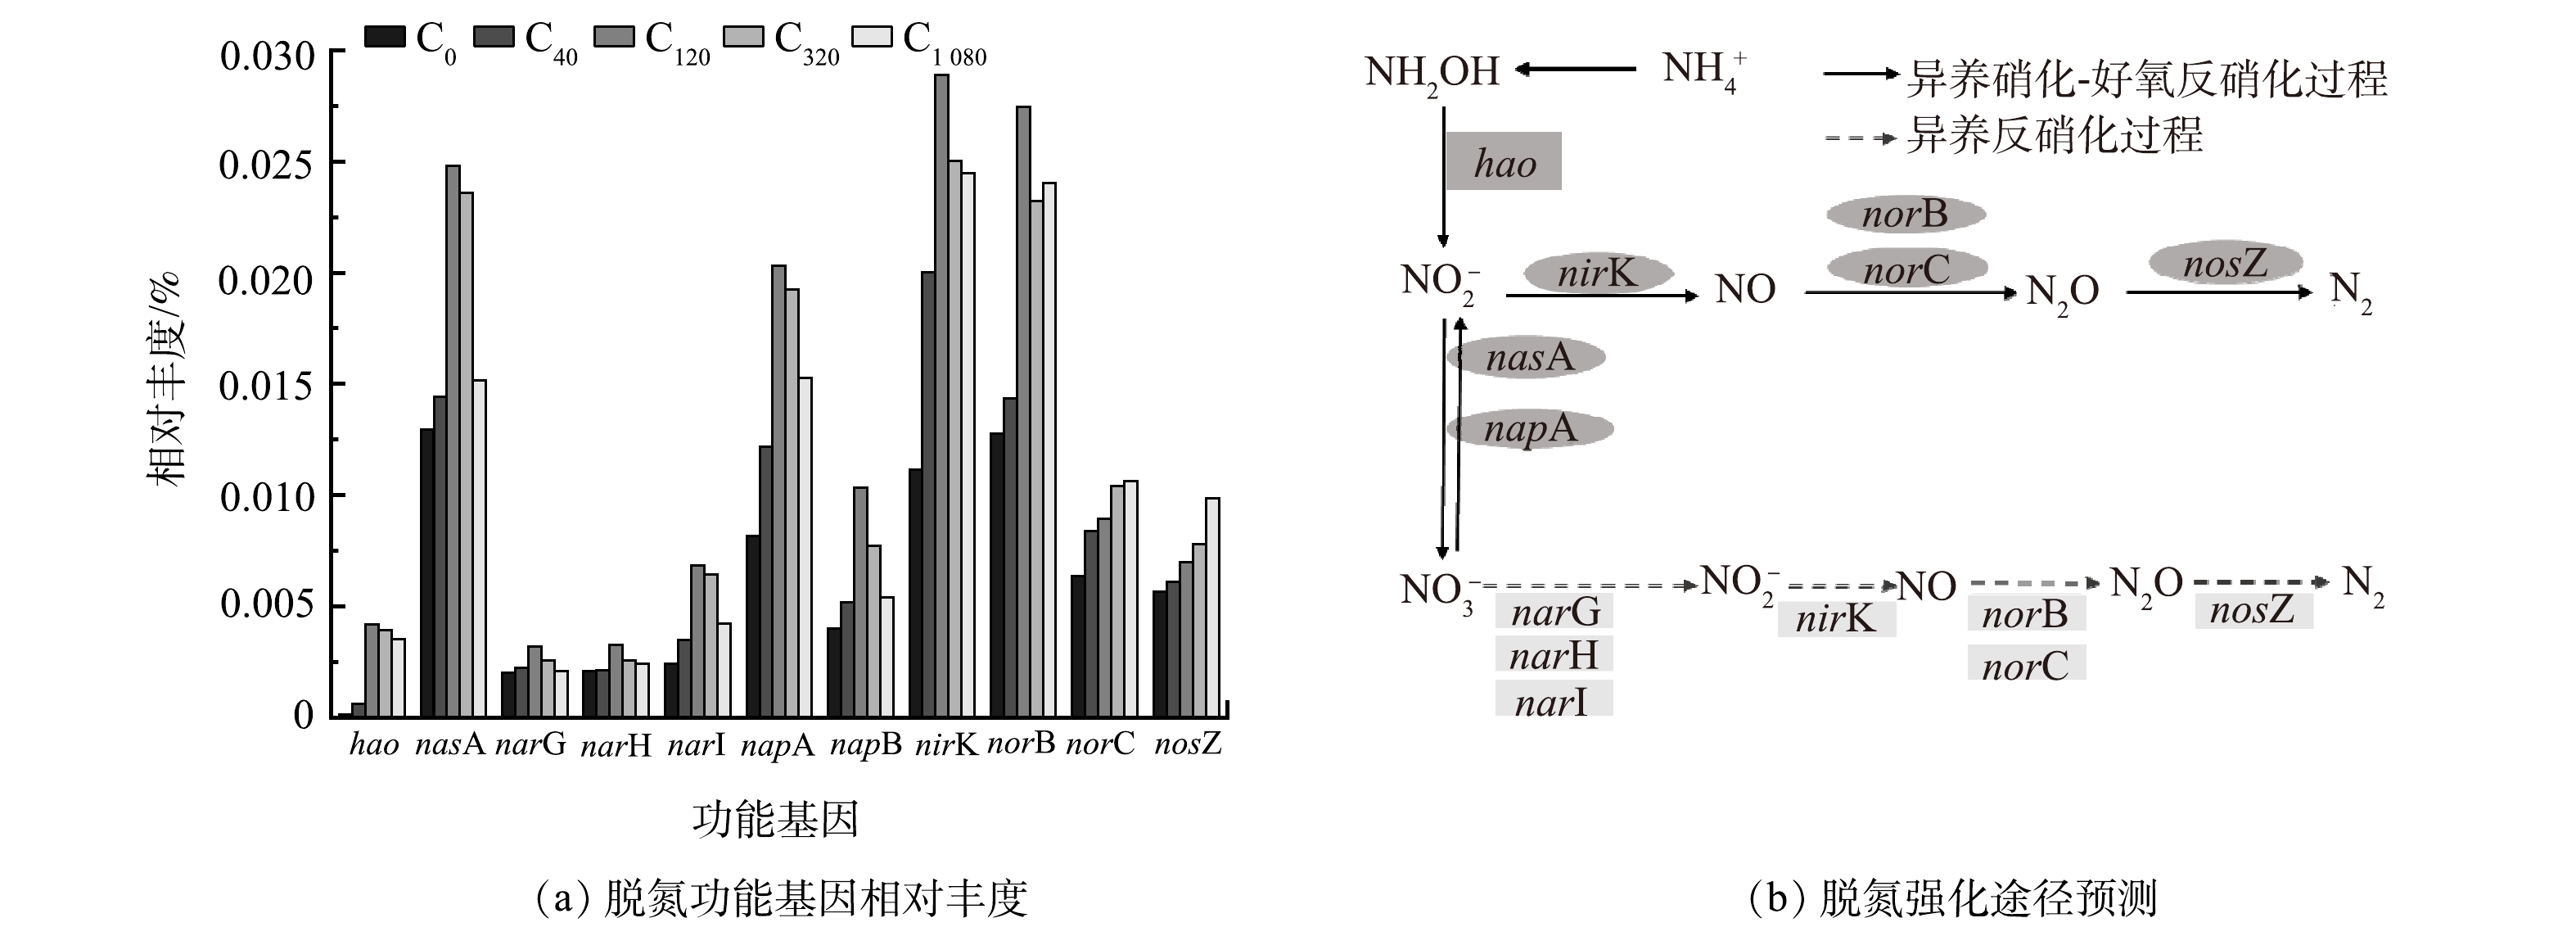
图 6 不同海藻糖浓度下脱氮功能基因相对丰度变化和及脱氮强化途径预测
Figure 6. Relative abundance of functional genes and prediction of enhanced nitrogen removal pathways under different trehalose concentrations
Figure
6 ,Table
1 个