-

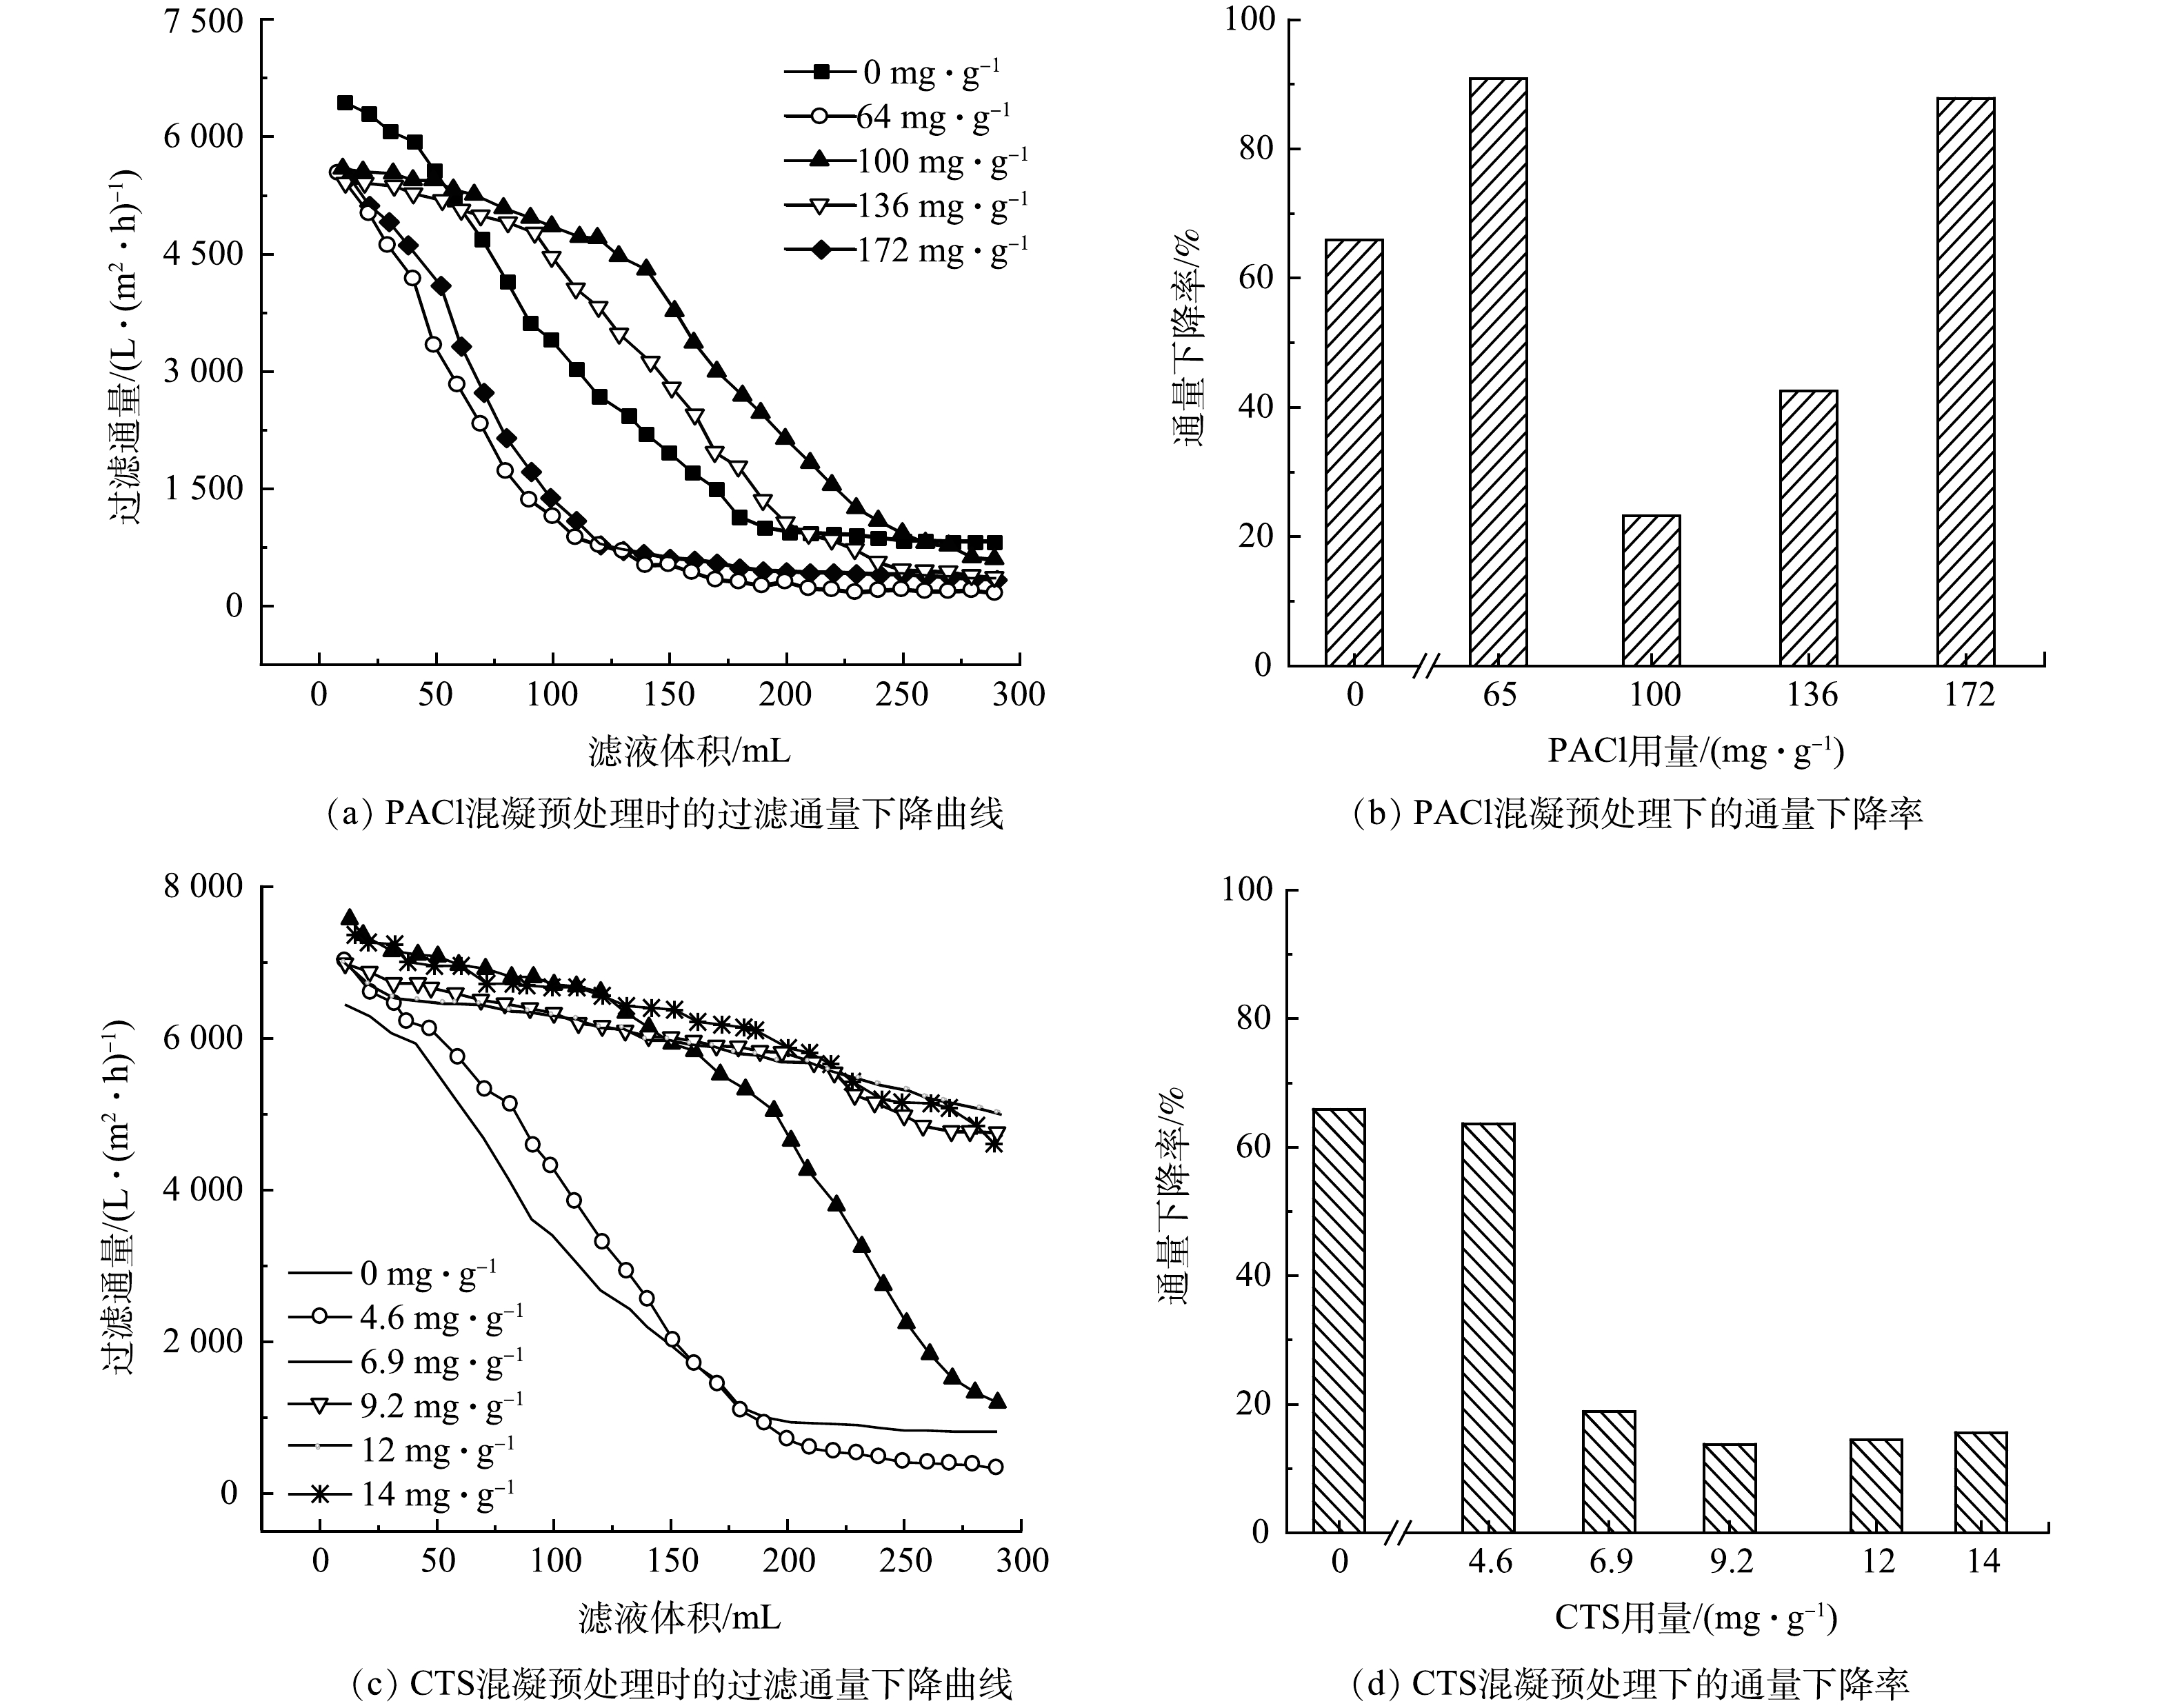
图 1 PACl和CTS预处理对水华微囊藻过滤通量下降曲线及通量下降率的影响
Figure 1. Influence of PACl and CTS pretreatment on filtration flux declining curve and flux declining rate of Microcystis flos-aquae
-

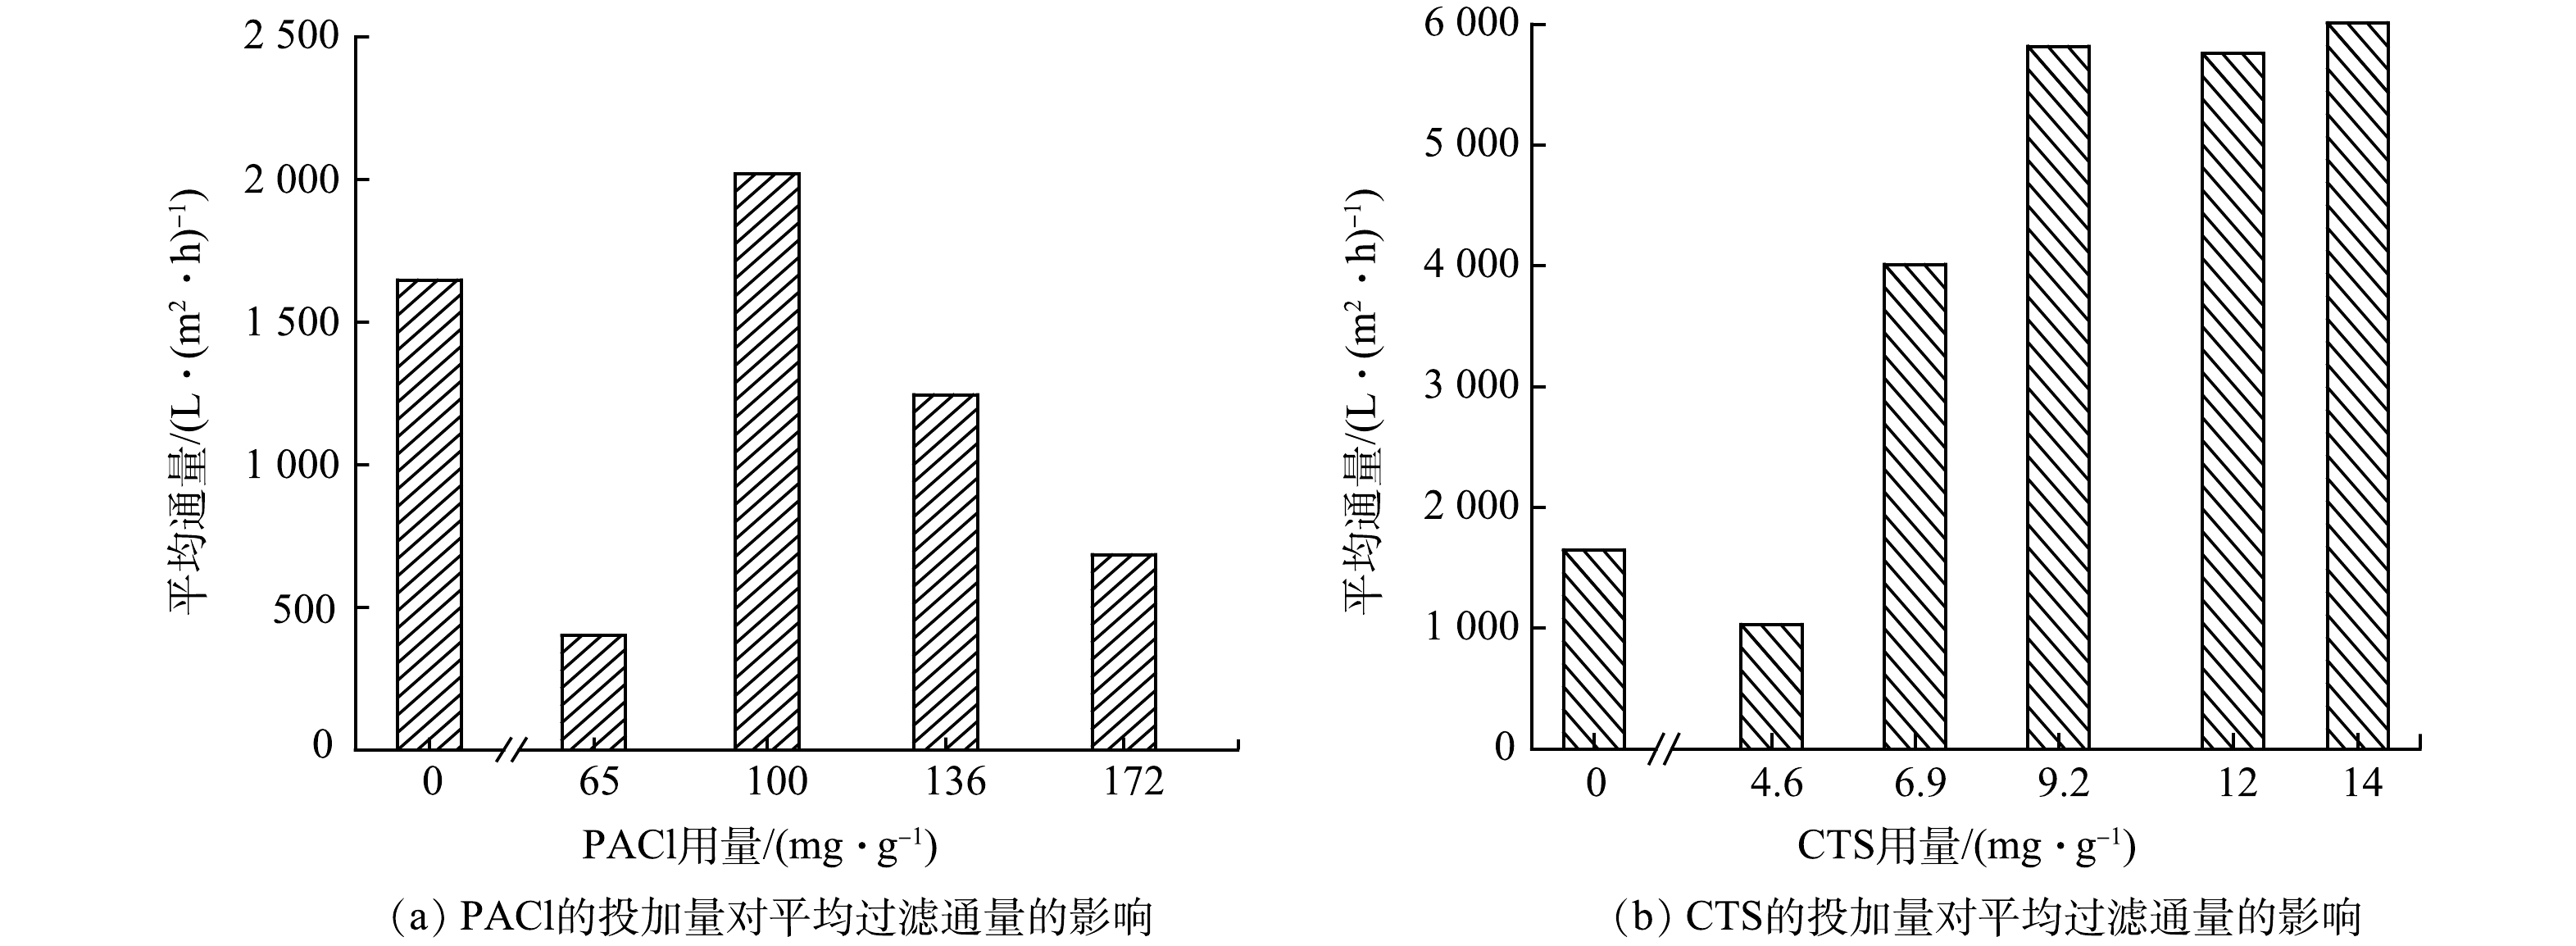
图 2 PACl和CTS的投加量对平均过滤通量的影响
Figure 2. Influence of PACl and CTS dosage on the average filtration flux
-

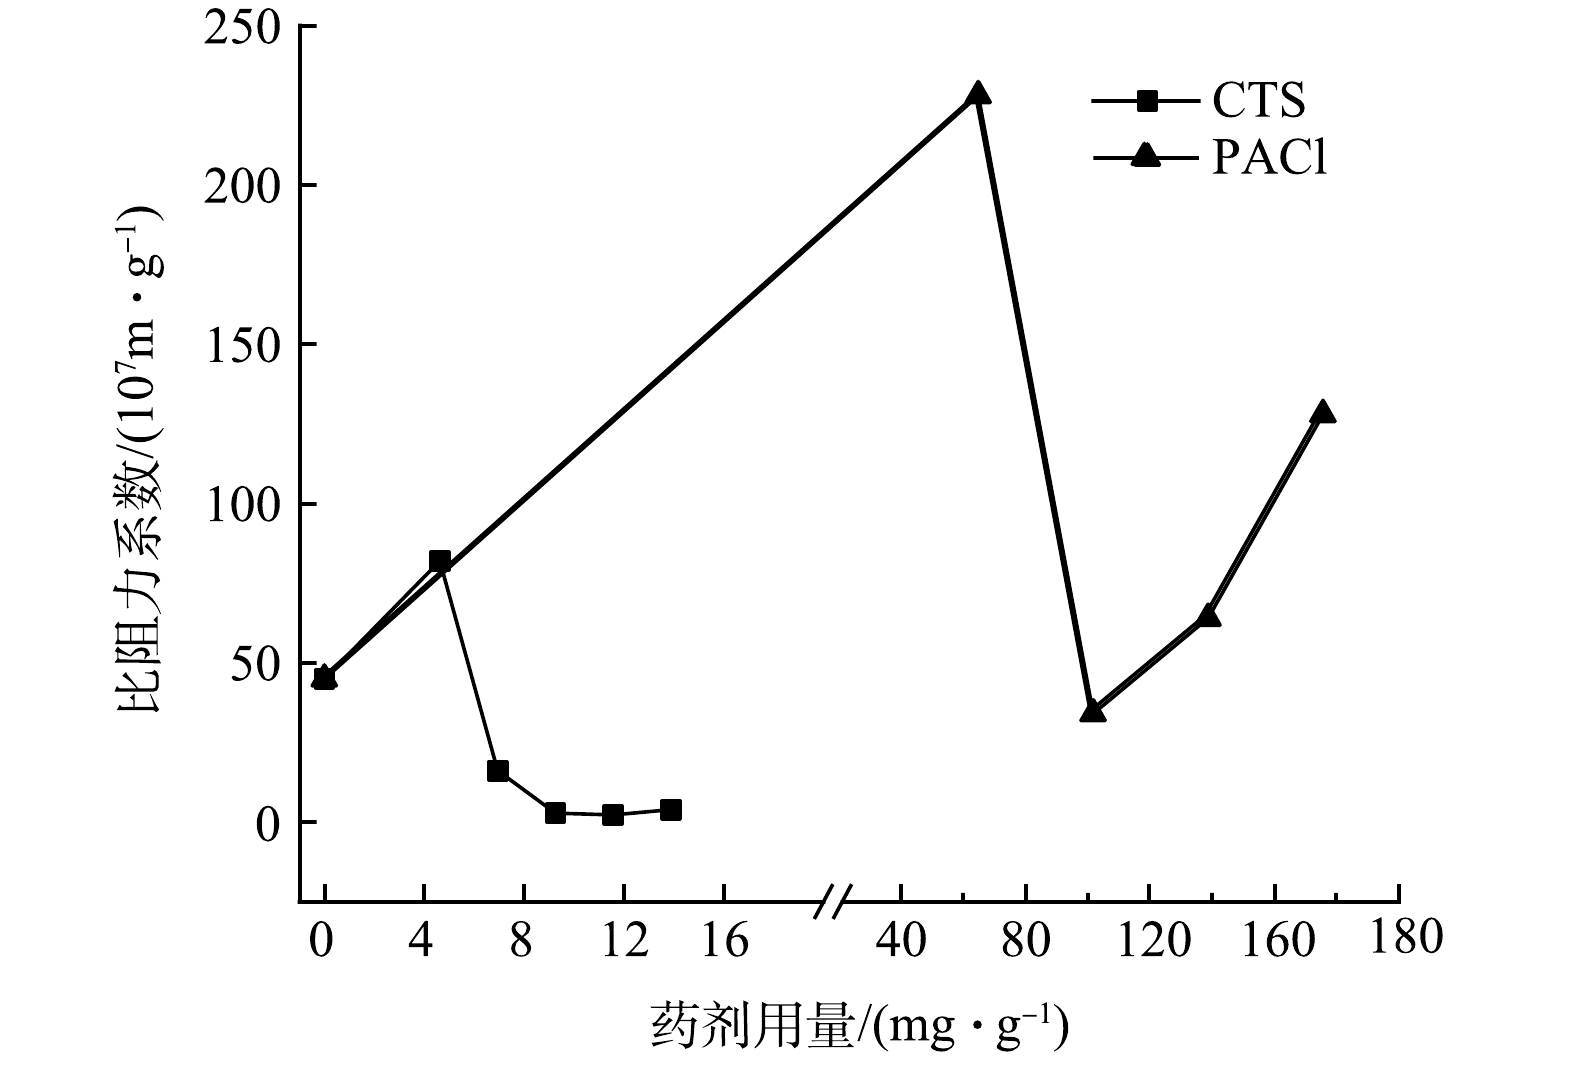
图 3 CTS和PACl预混凝对饼层比阻力系数的影响
Figure 3. Influence of CTS and PACl premix on specific cake resistance
-

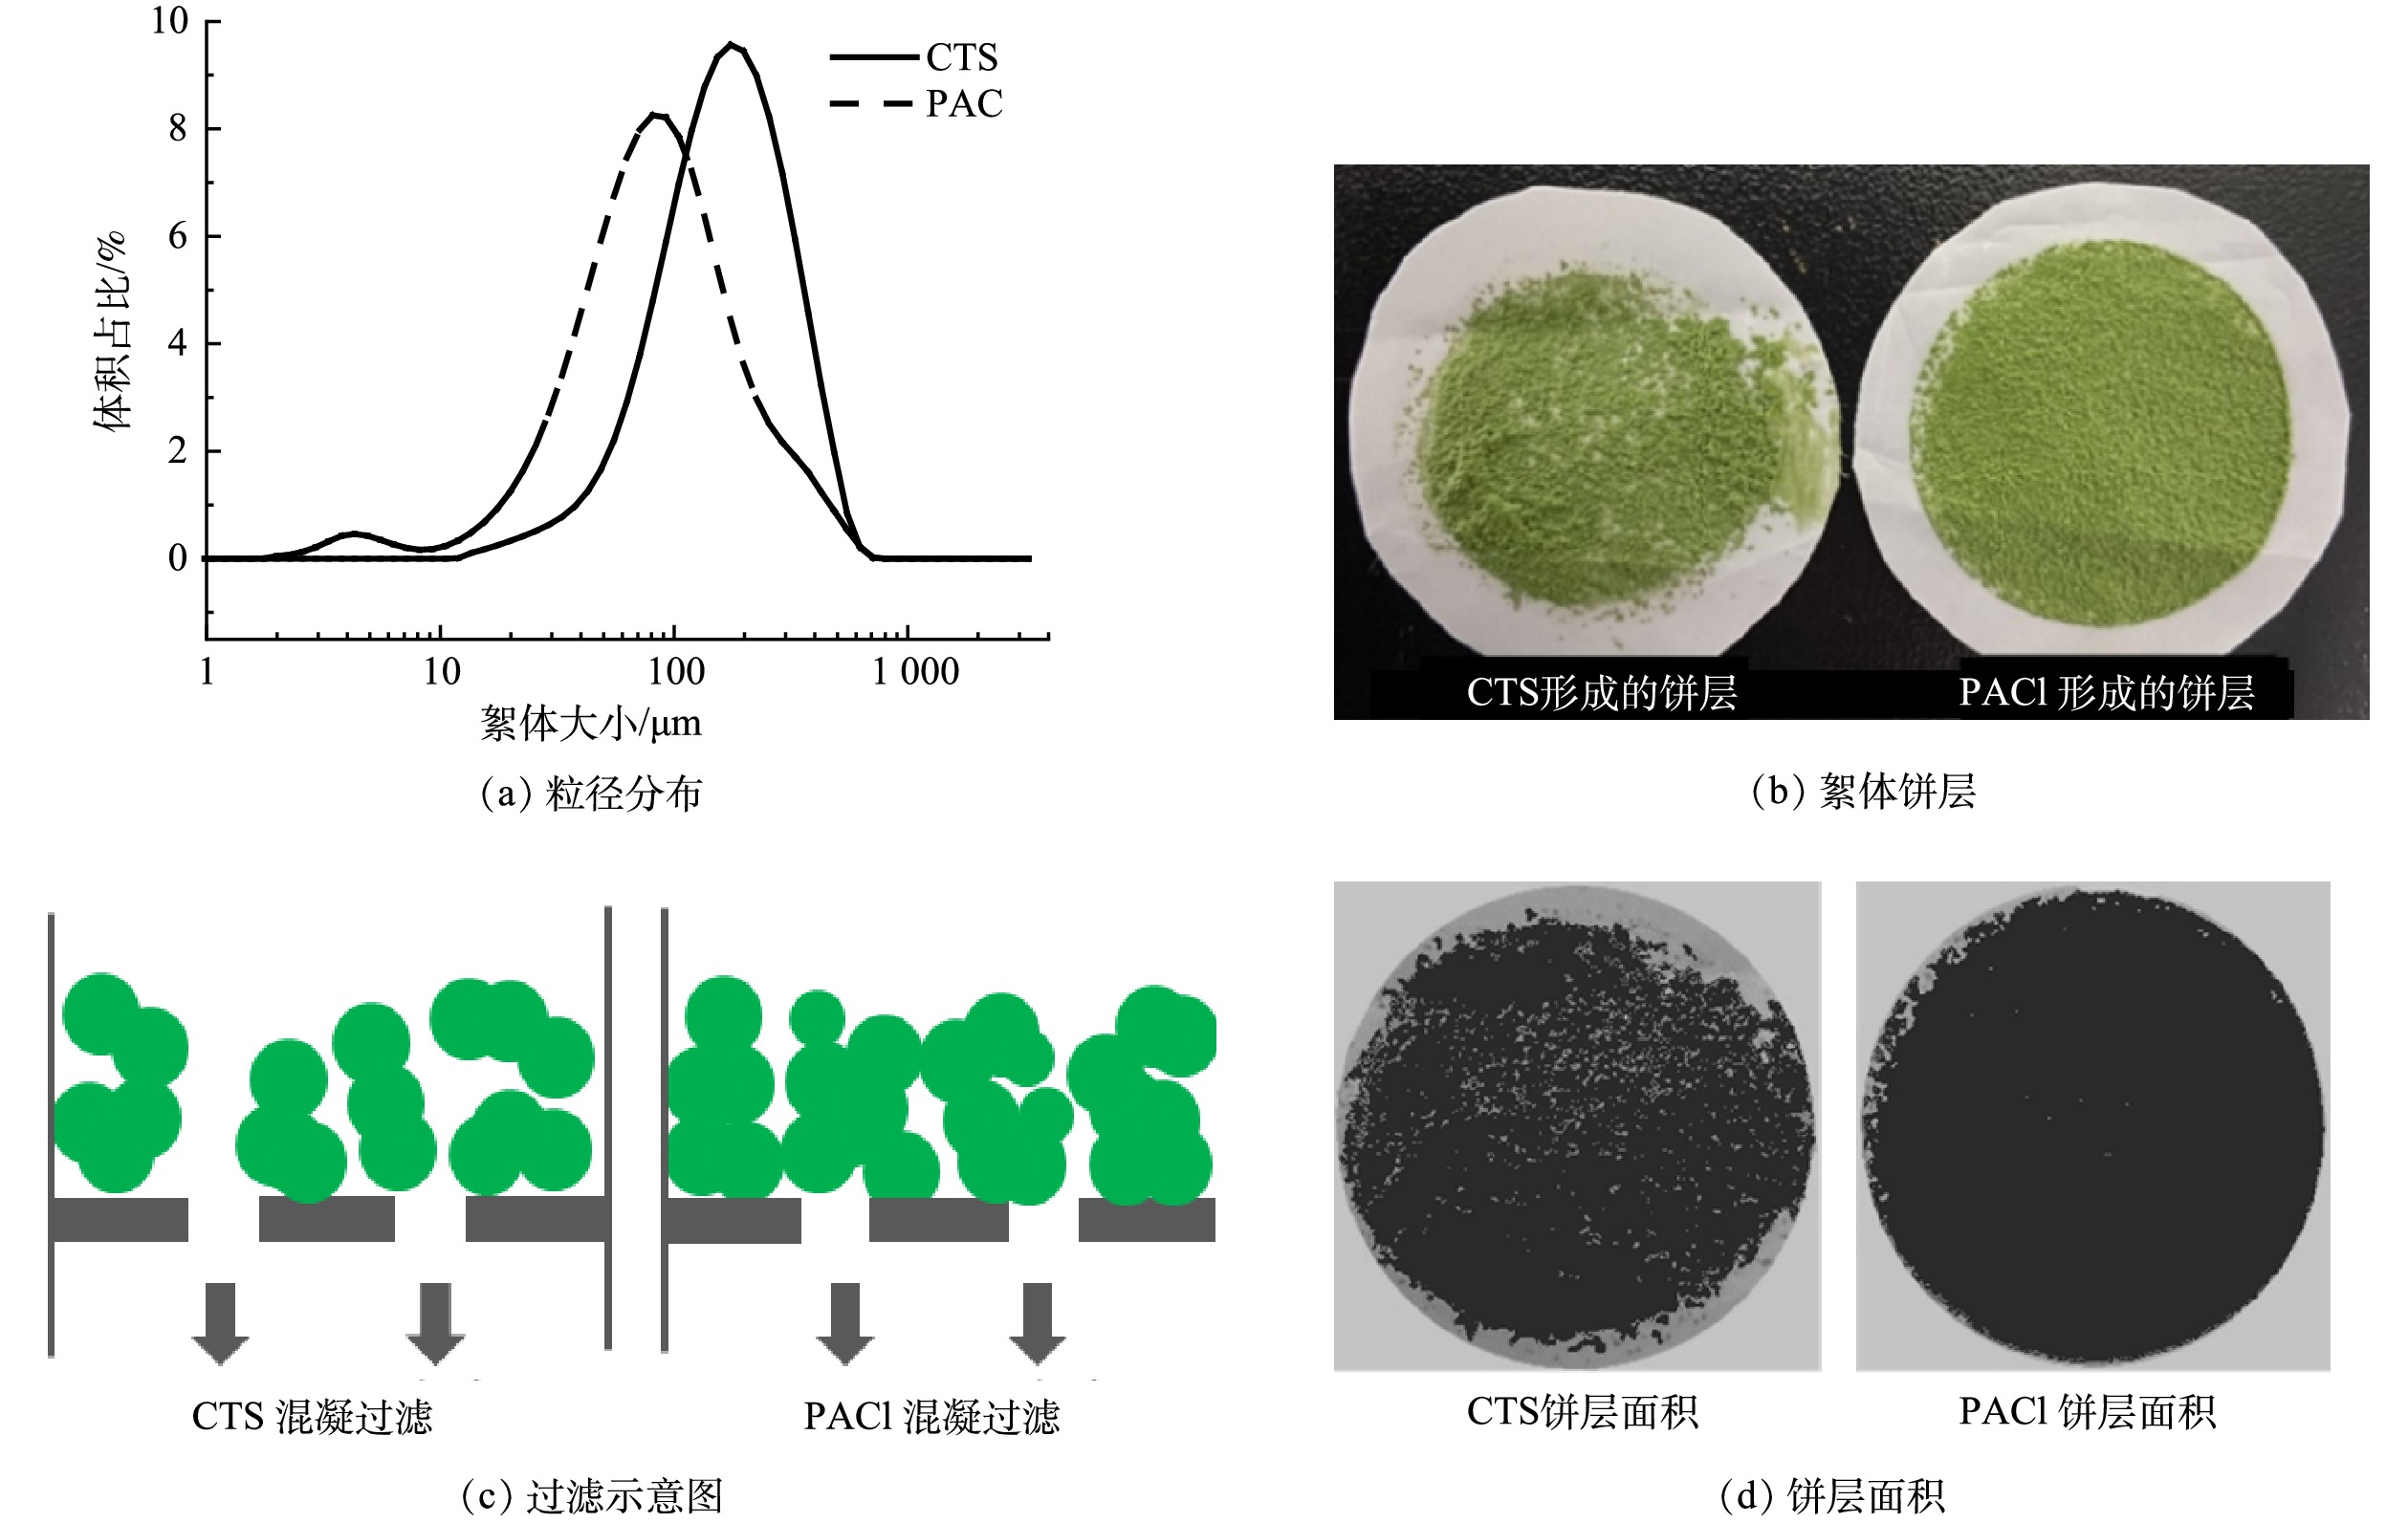
图 4 最优剂量的CTS和 PACl形成絮体的粒径分布、絮体饼层、过滤示意图及饼层面积
Figure 4. The size distribution, floc cake, filtration diagram and cake area of floc formed at optimal dosage of CTS and PACl
Figure
4 ,Table
1 个