-

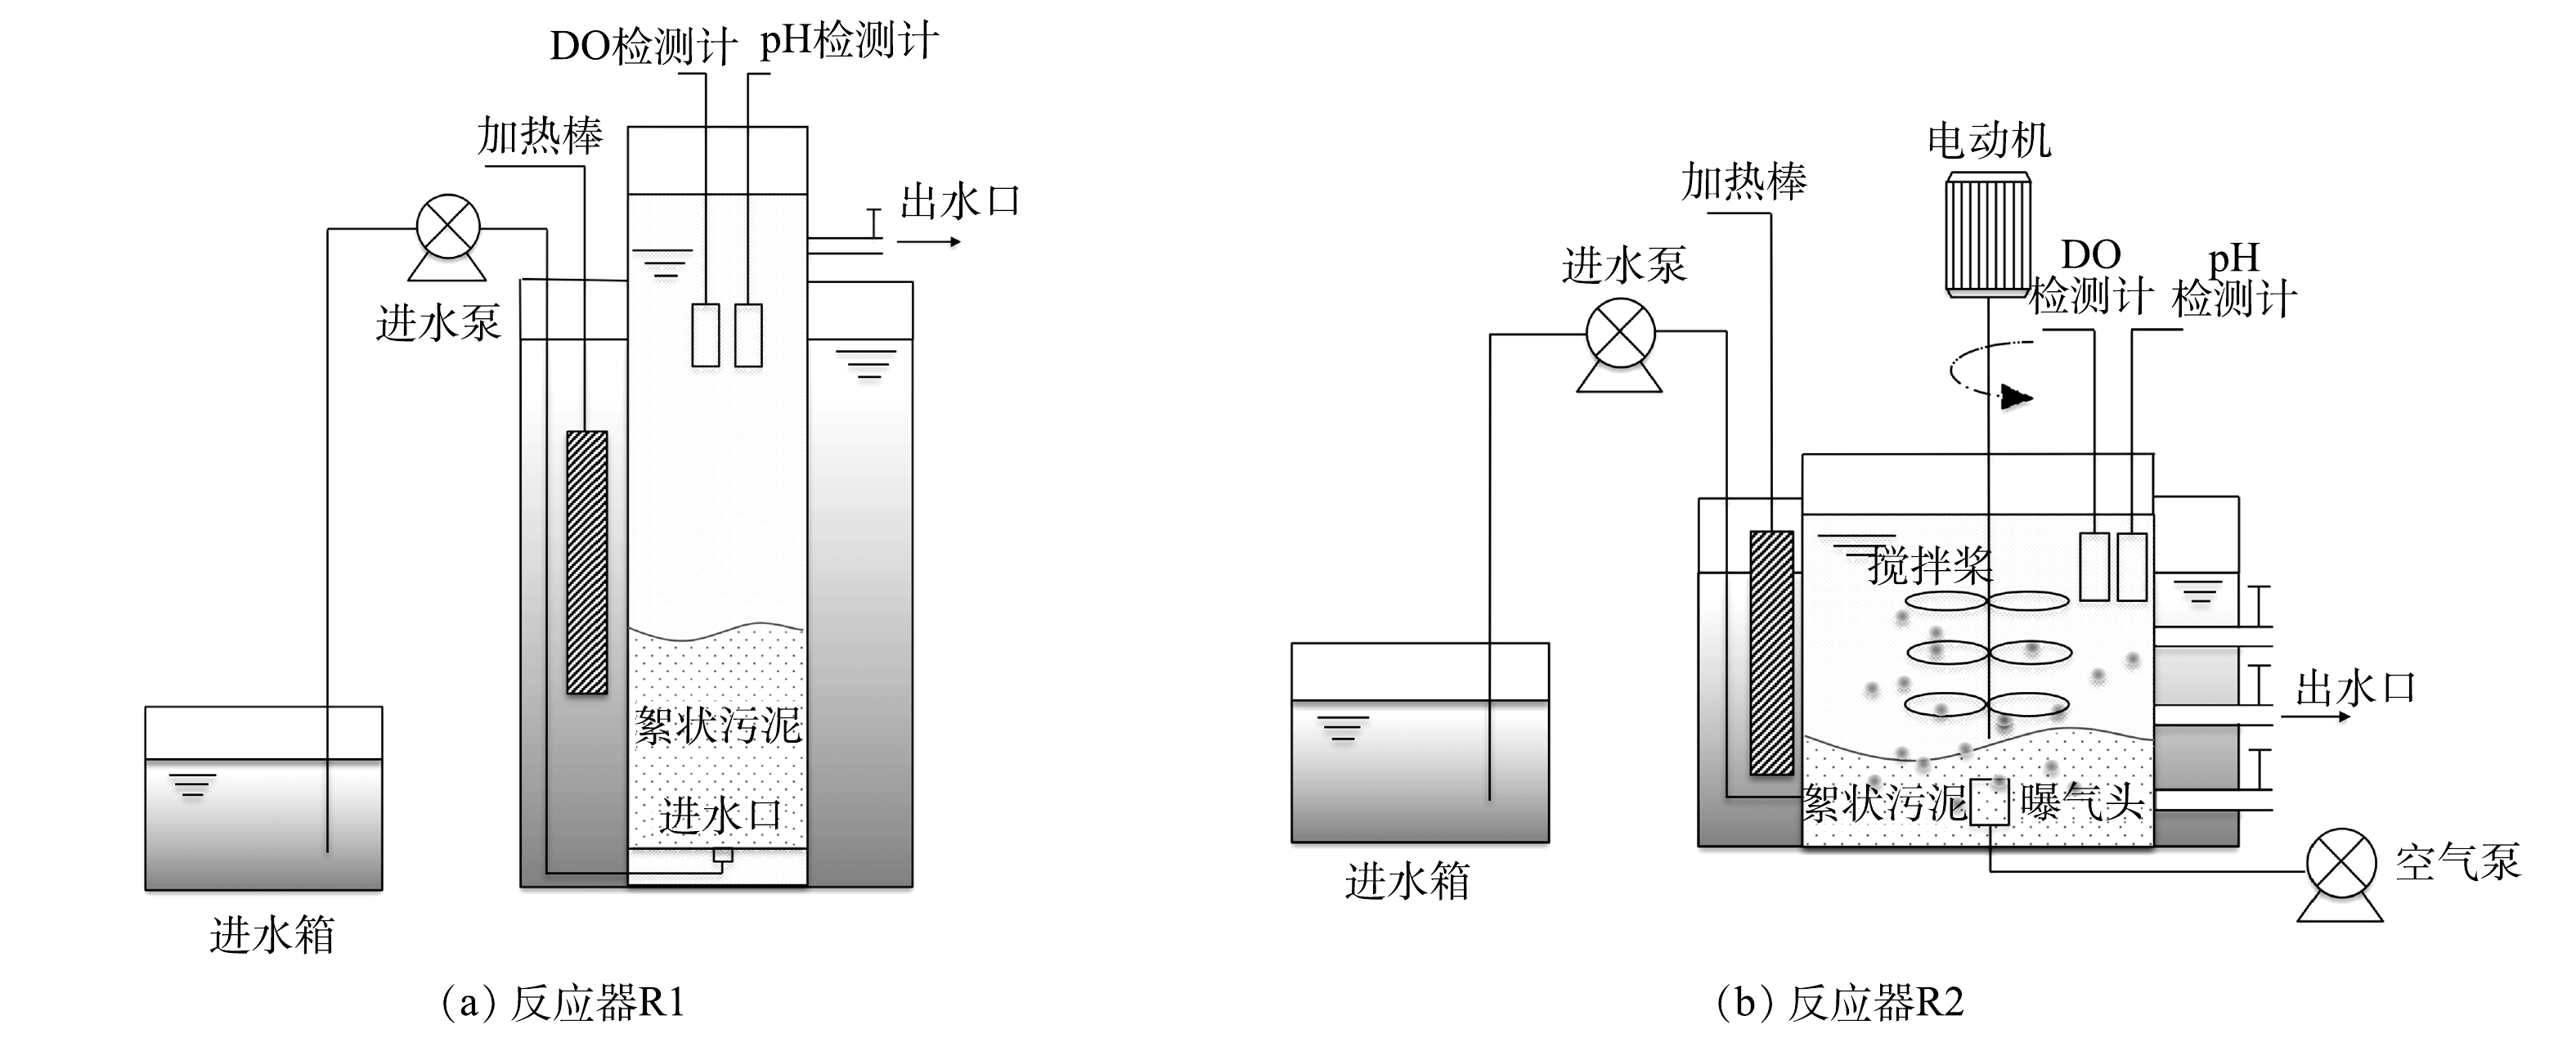
图 1 实验装置图
Figure 1. Diagram of experimental apparatus
-

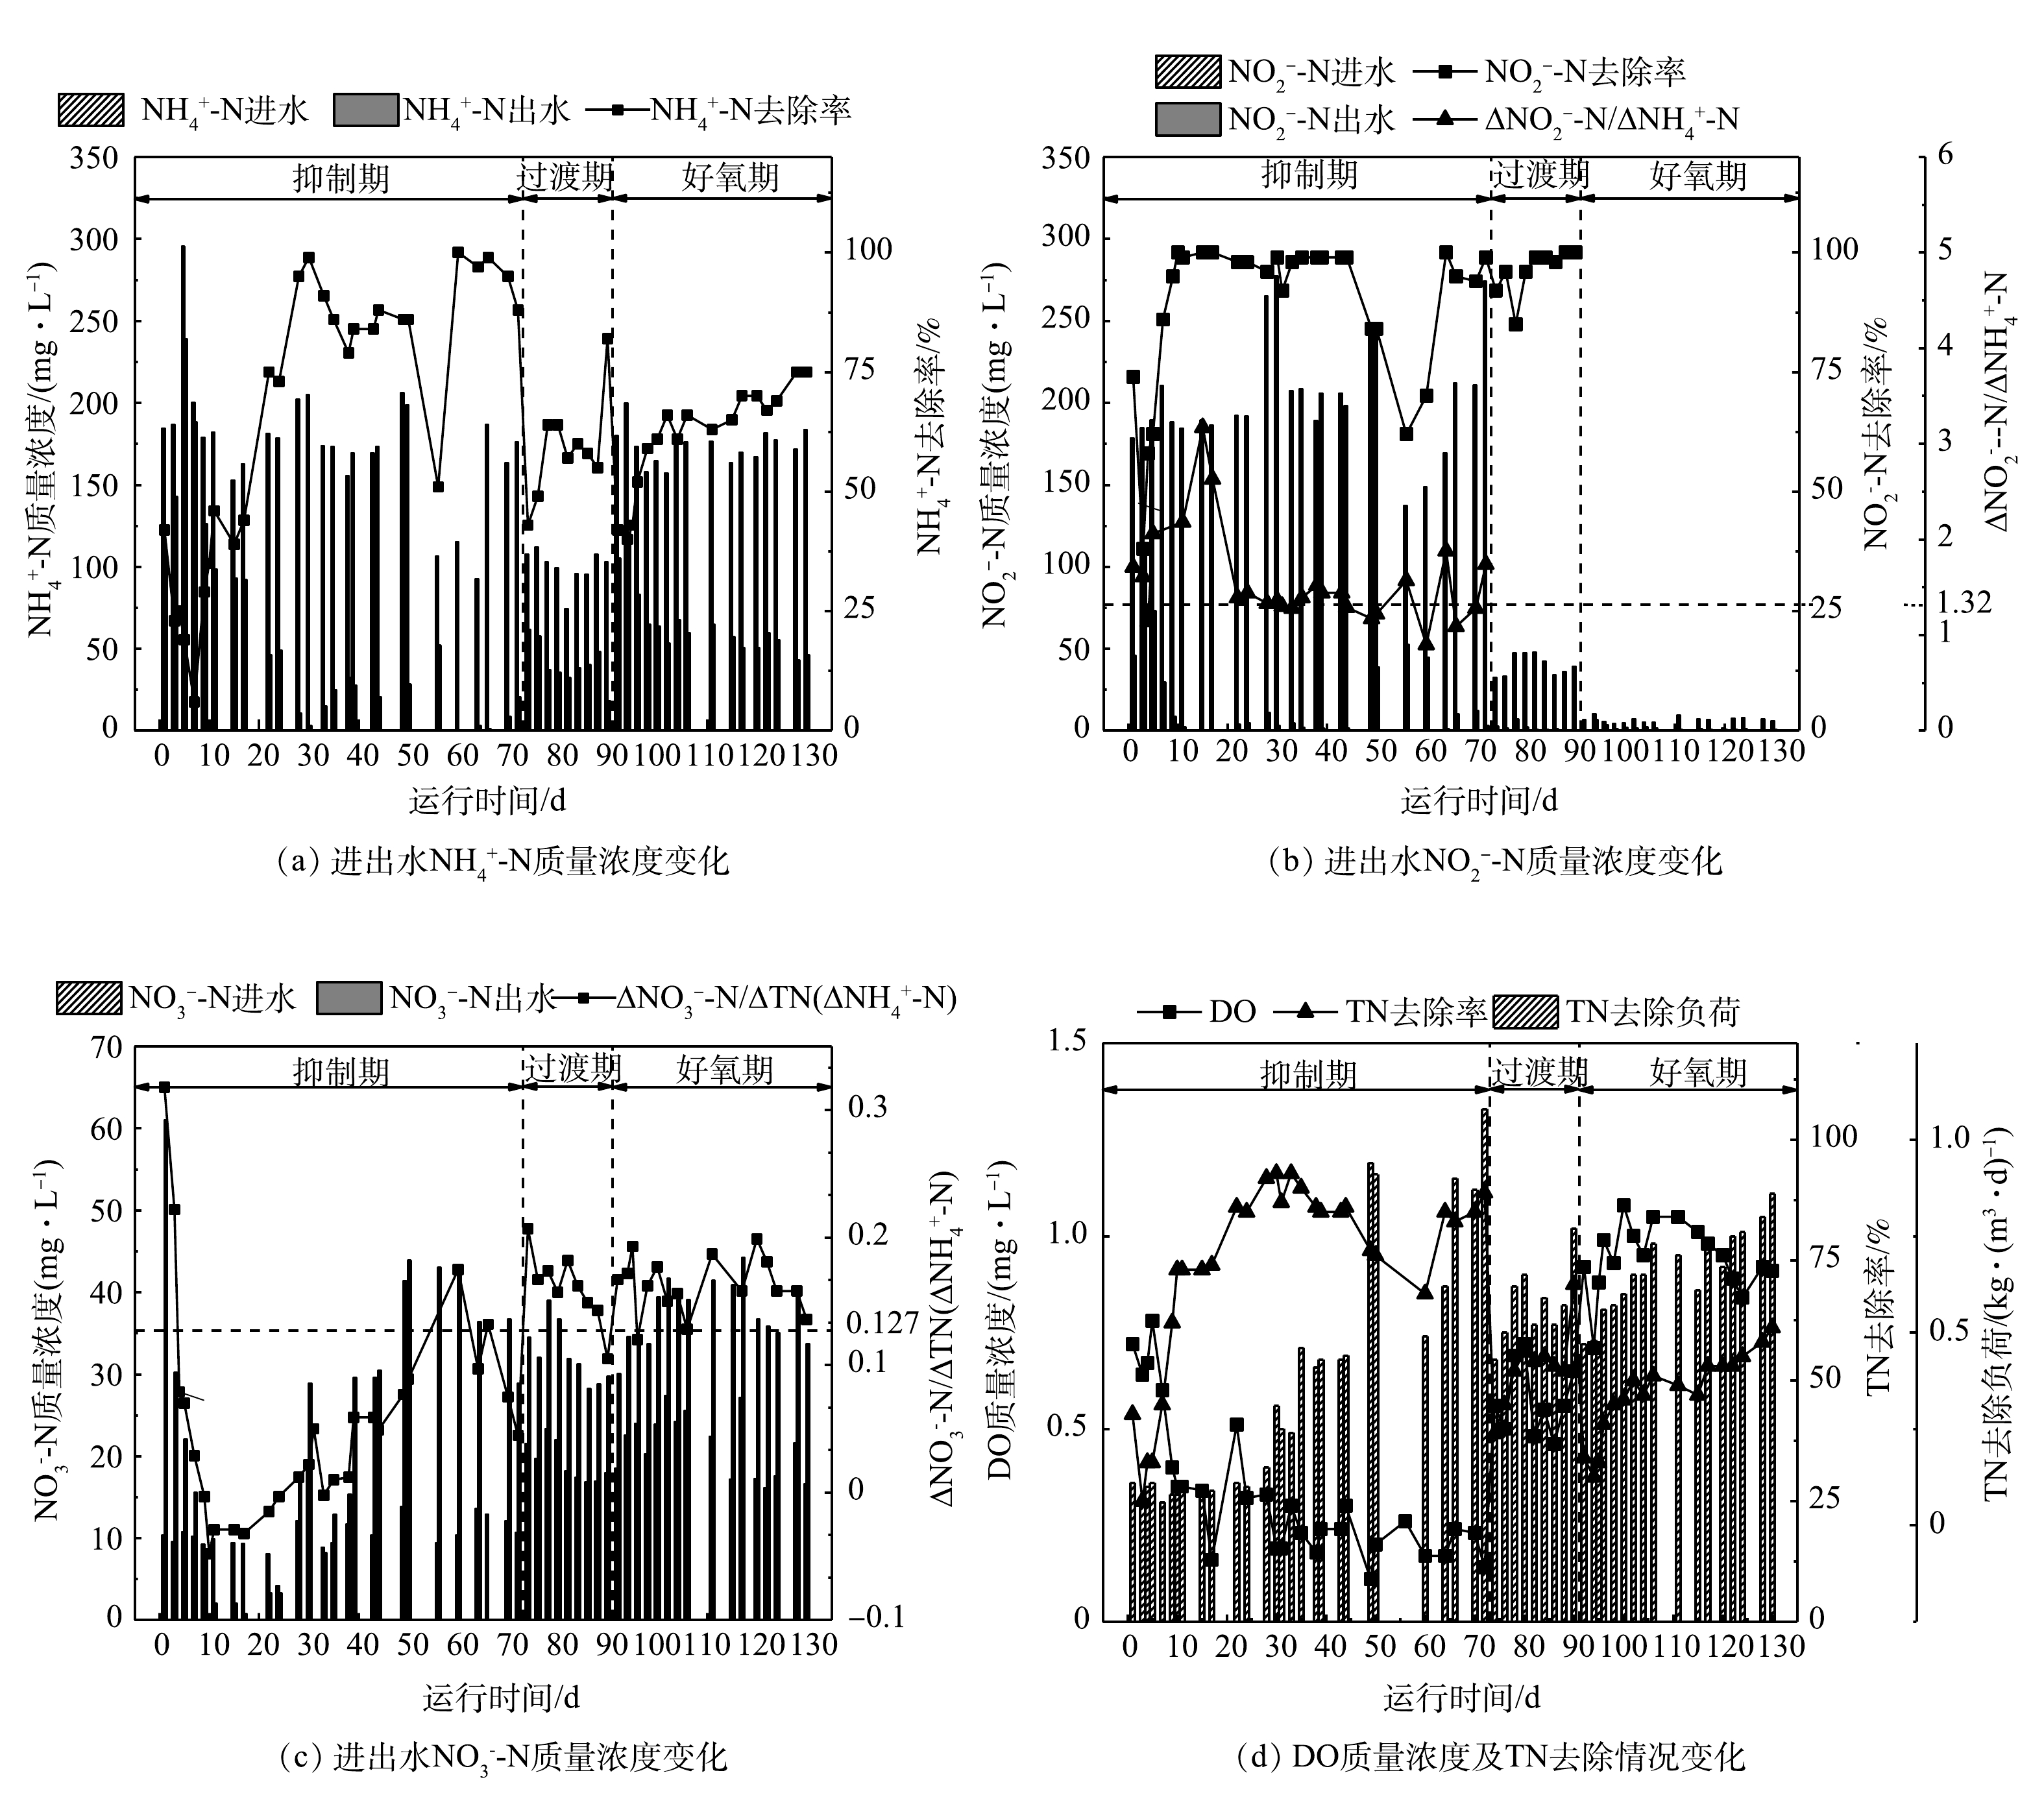
图 2 反应器连续运行期间各氮素质量浓度变化
Figure 2. Variation of nitrogen concentration during continuous operation of the reactor
-

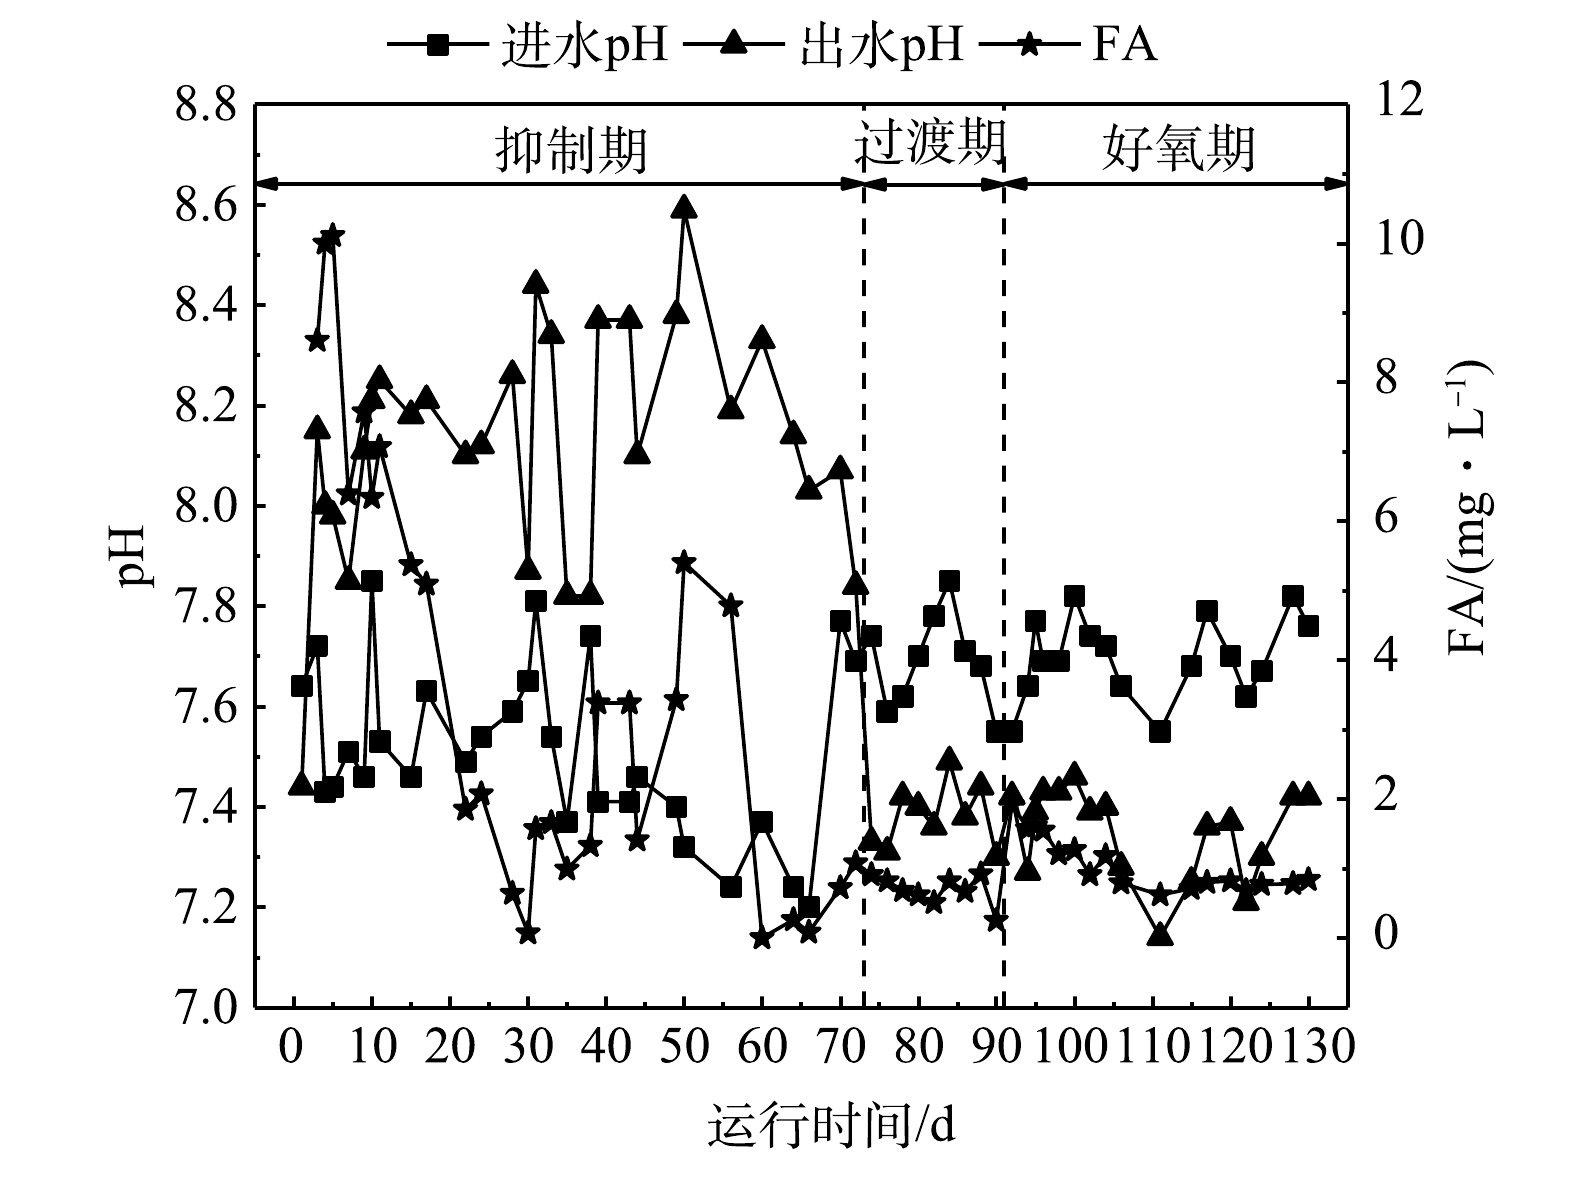
图 3 反应器连续运行期间pH和FA质量浓度变化
Figure 3. Variation of pH and FA concentrations during continuous operation of the reactor
-

图 4 反应器连续运行过程中ANAMMOX菌及NOB活性变化
Figure 4. Variation of ANAMMOX bacteria and NOB activity during continuous operation of the reactor
-

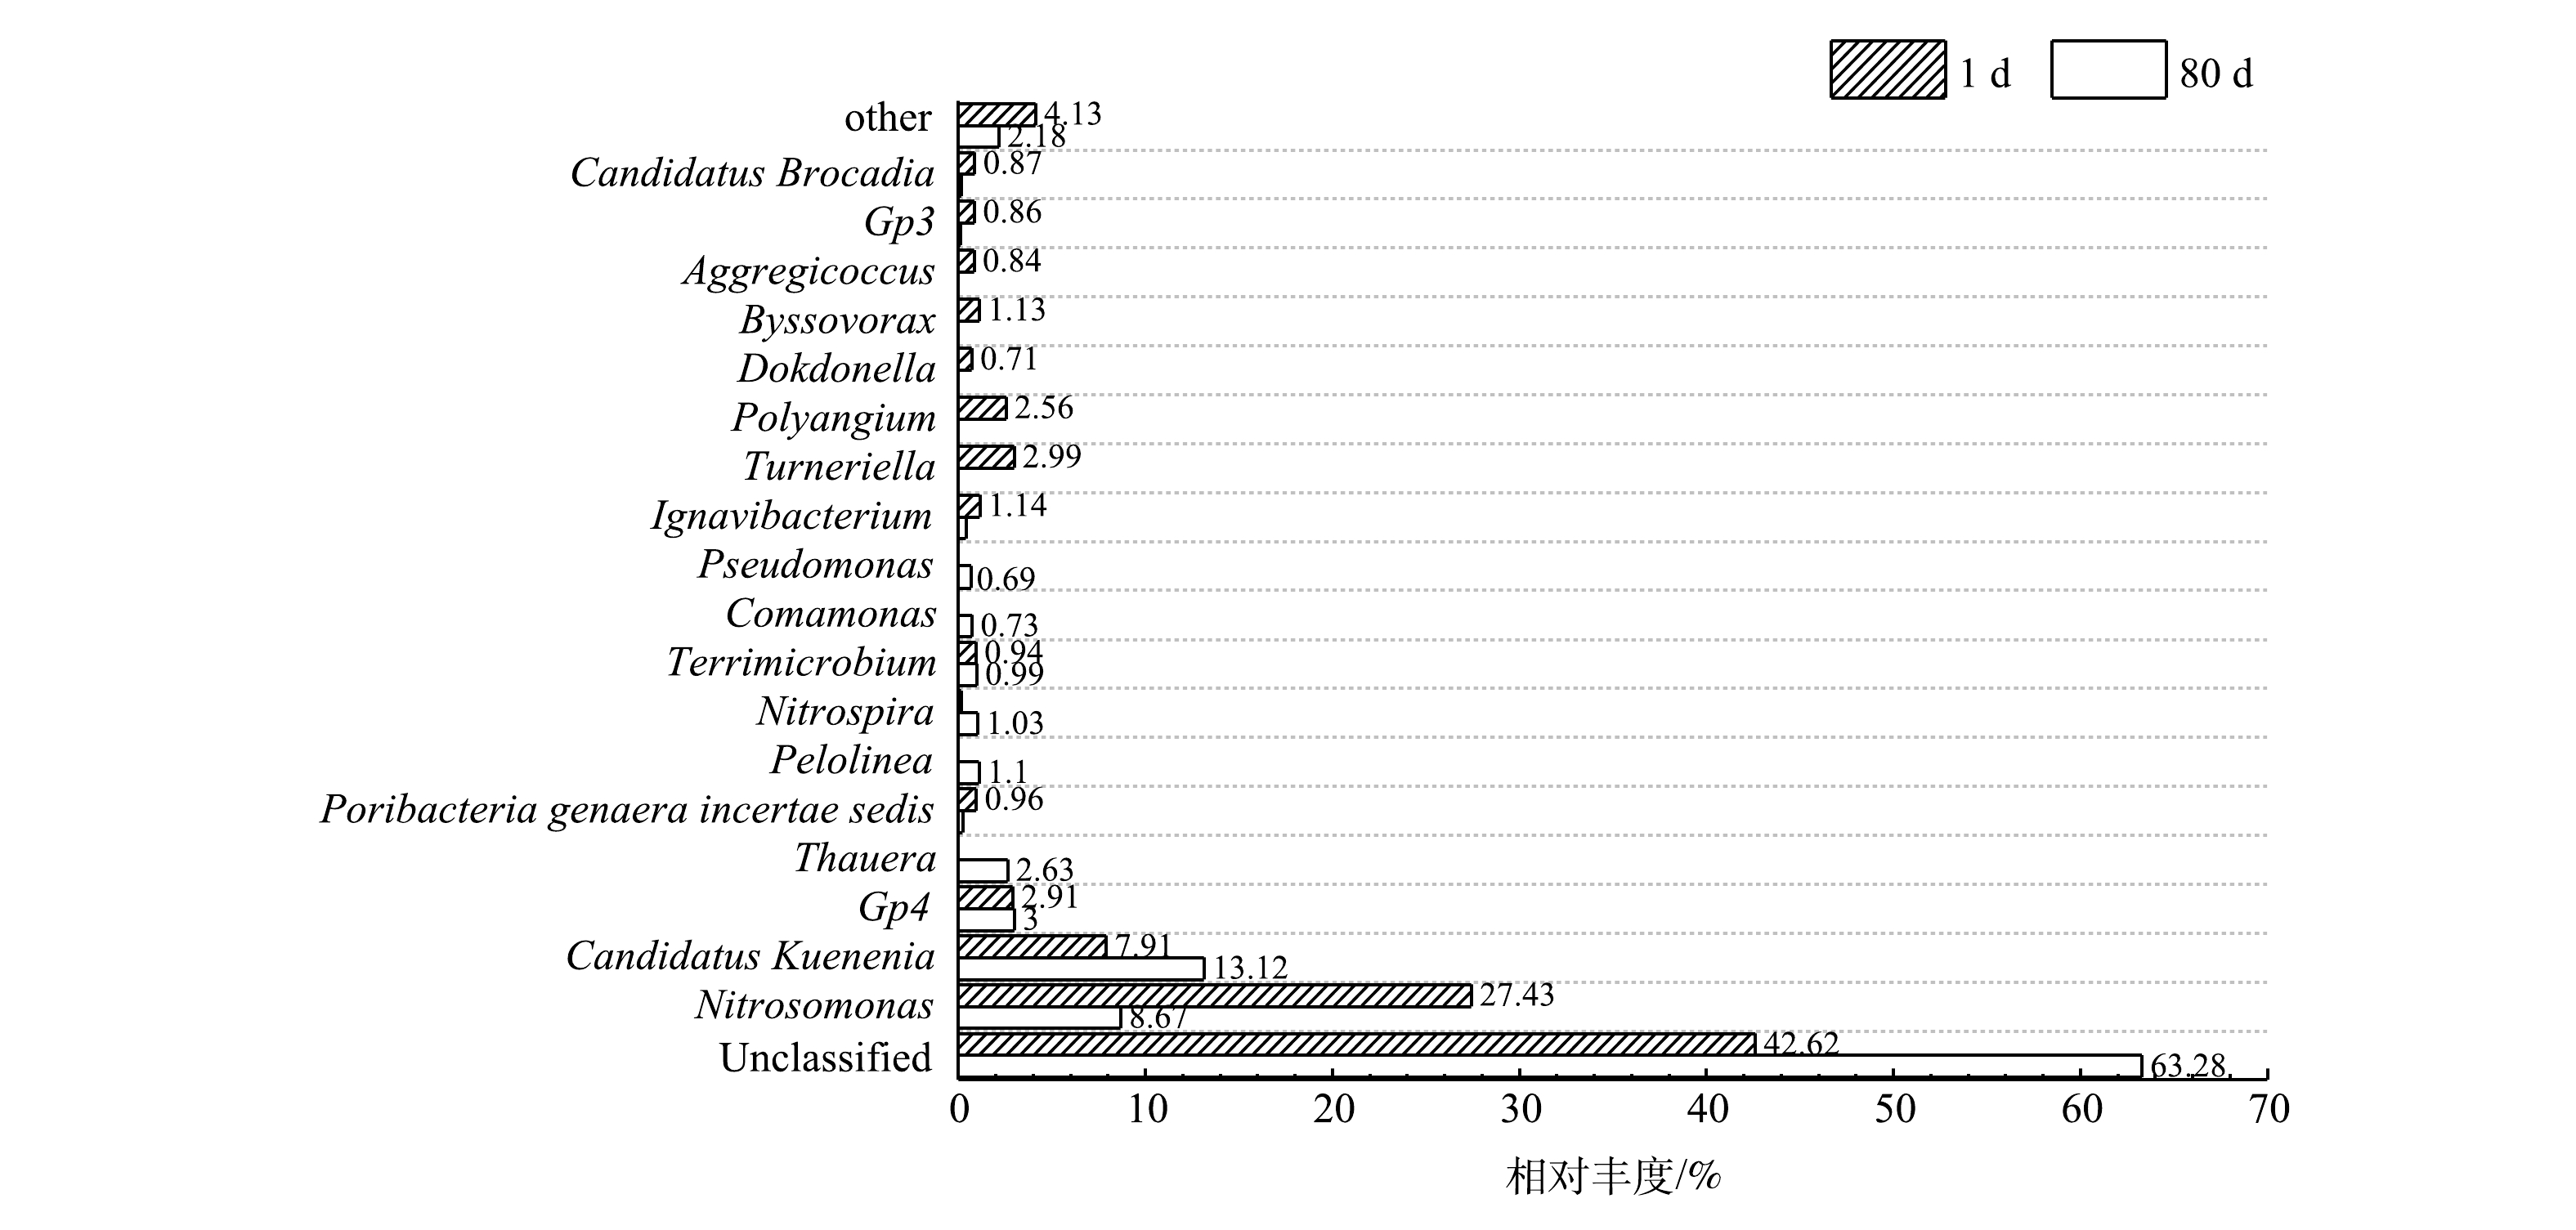
图 5 反应器中主要菌属相对丰度变化
Figure 5. Microbial community structure of sludge on the 80th day of operation
Figure
5 ,Table
1 个