-
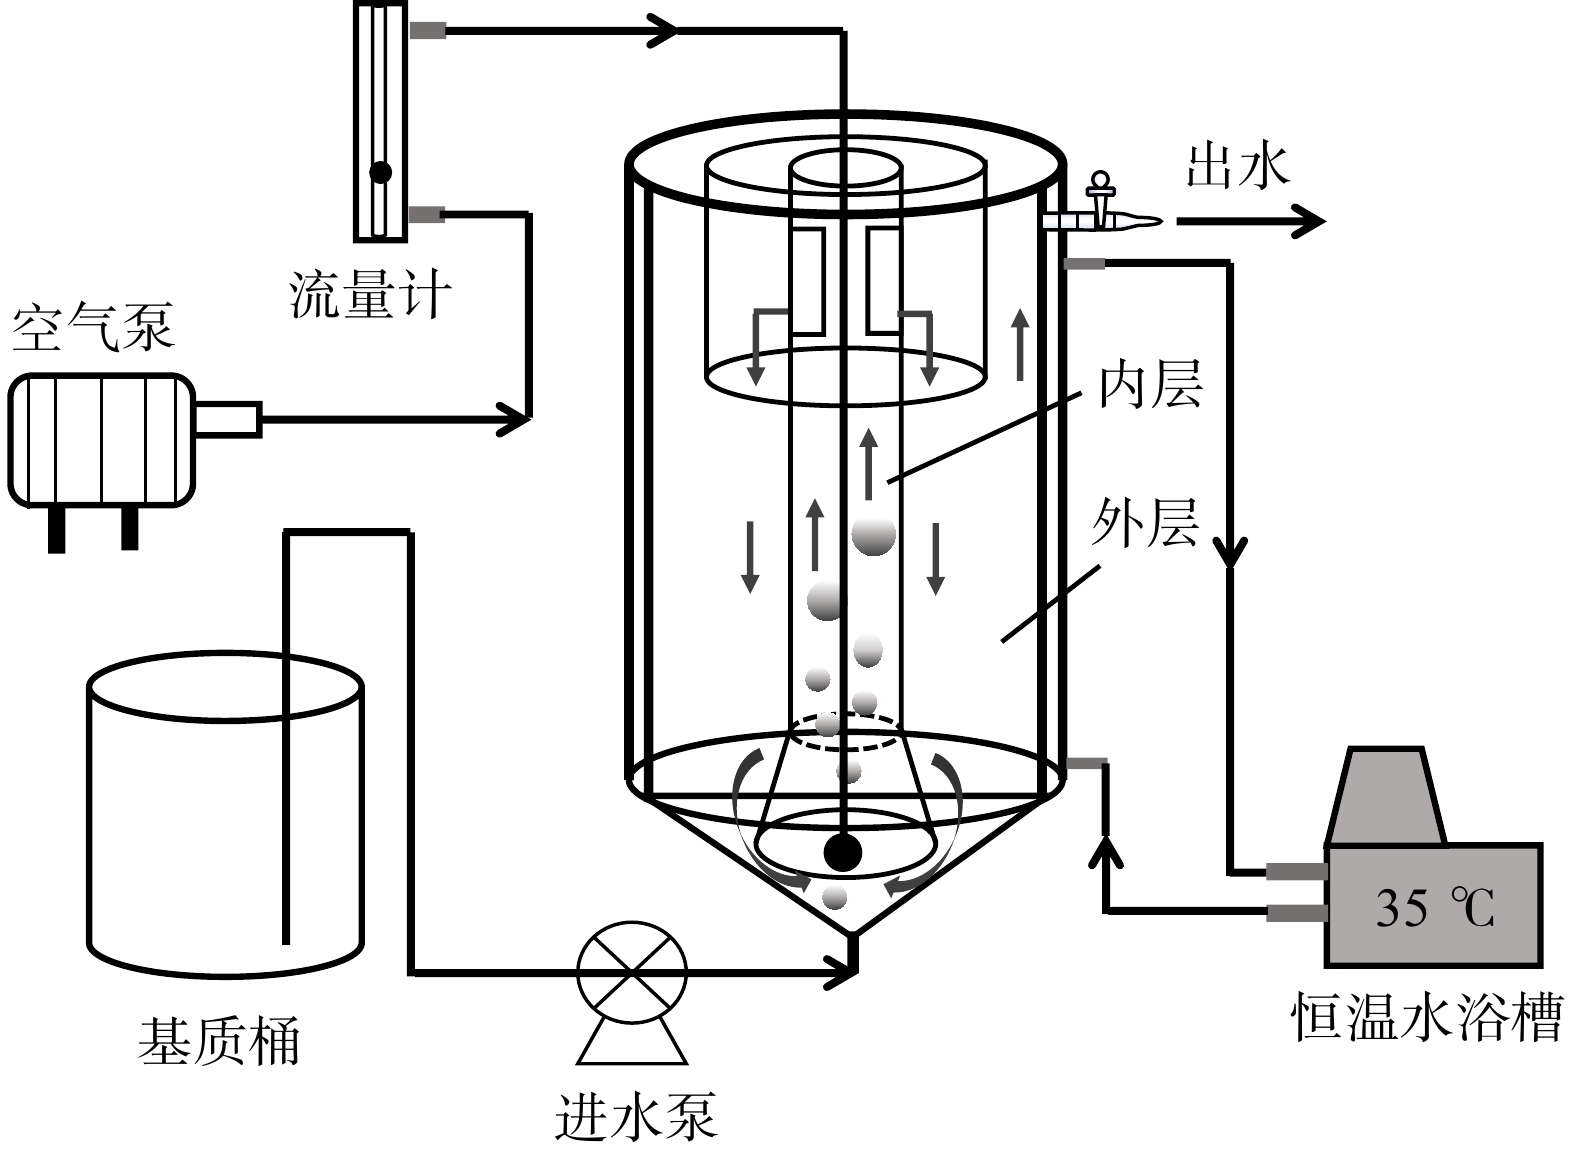
图 1 反应器示意图
Figure 1. Diagram of reactor
-
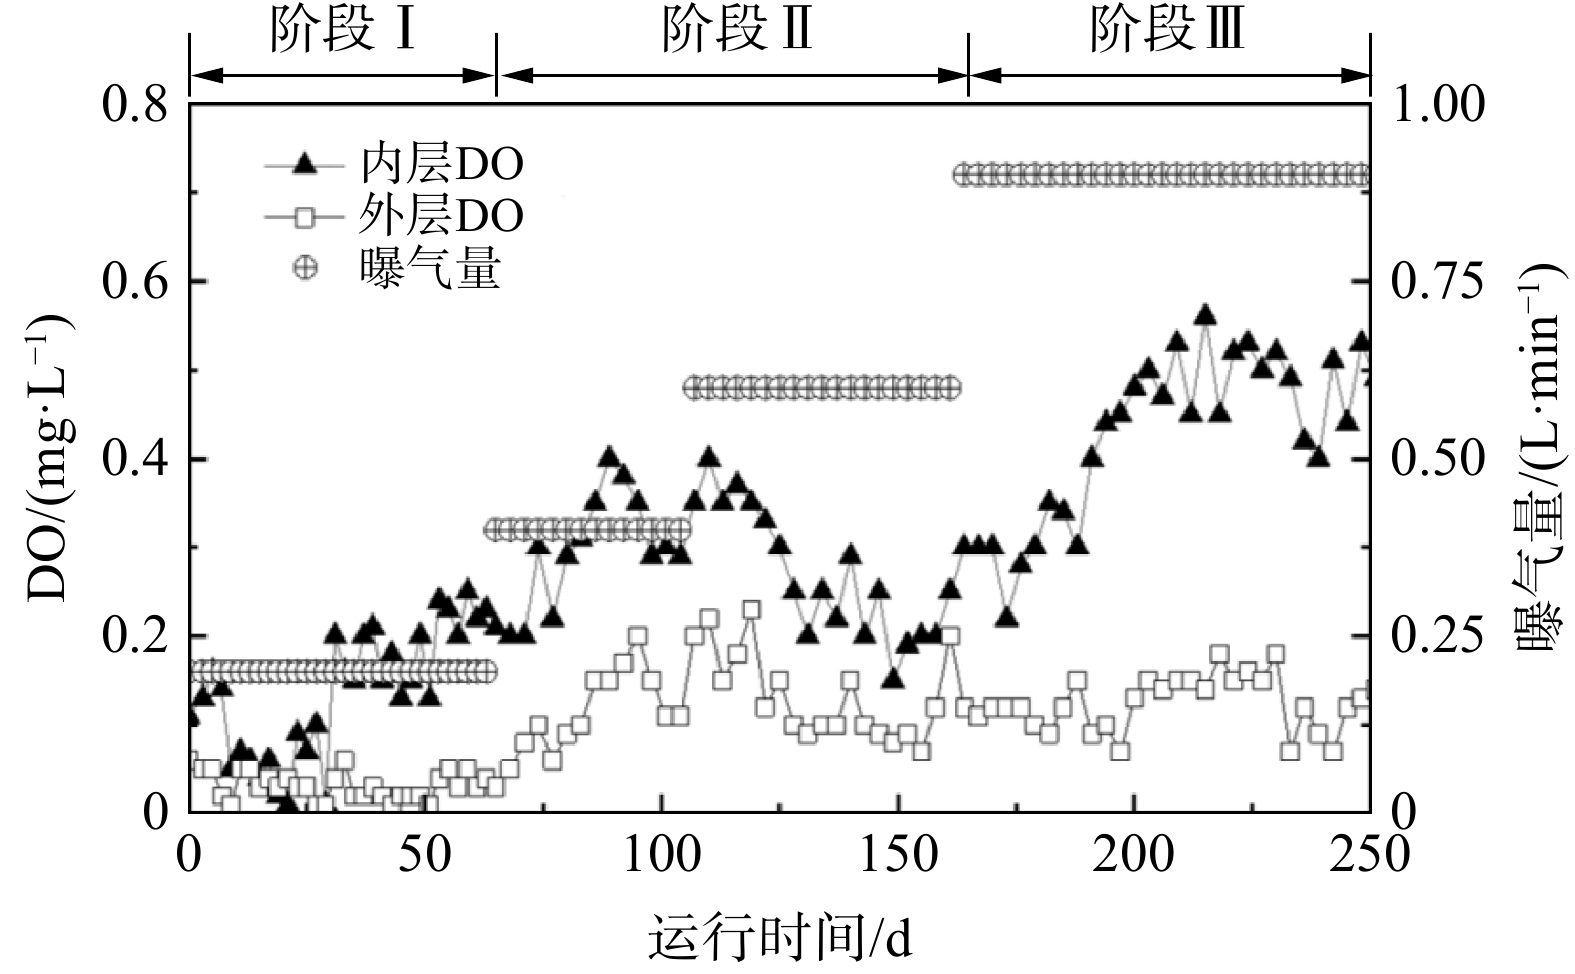
图 2 反应器内溶解氧的变化
Figure 2. Changes of dissolved oxygen concentration in reactor
-
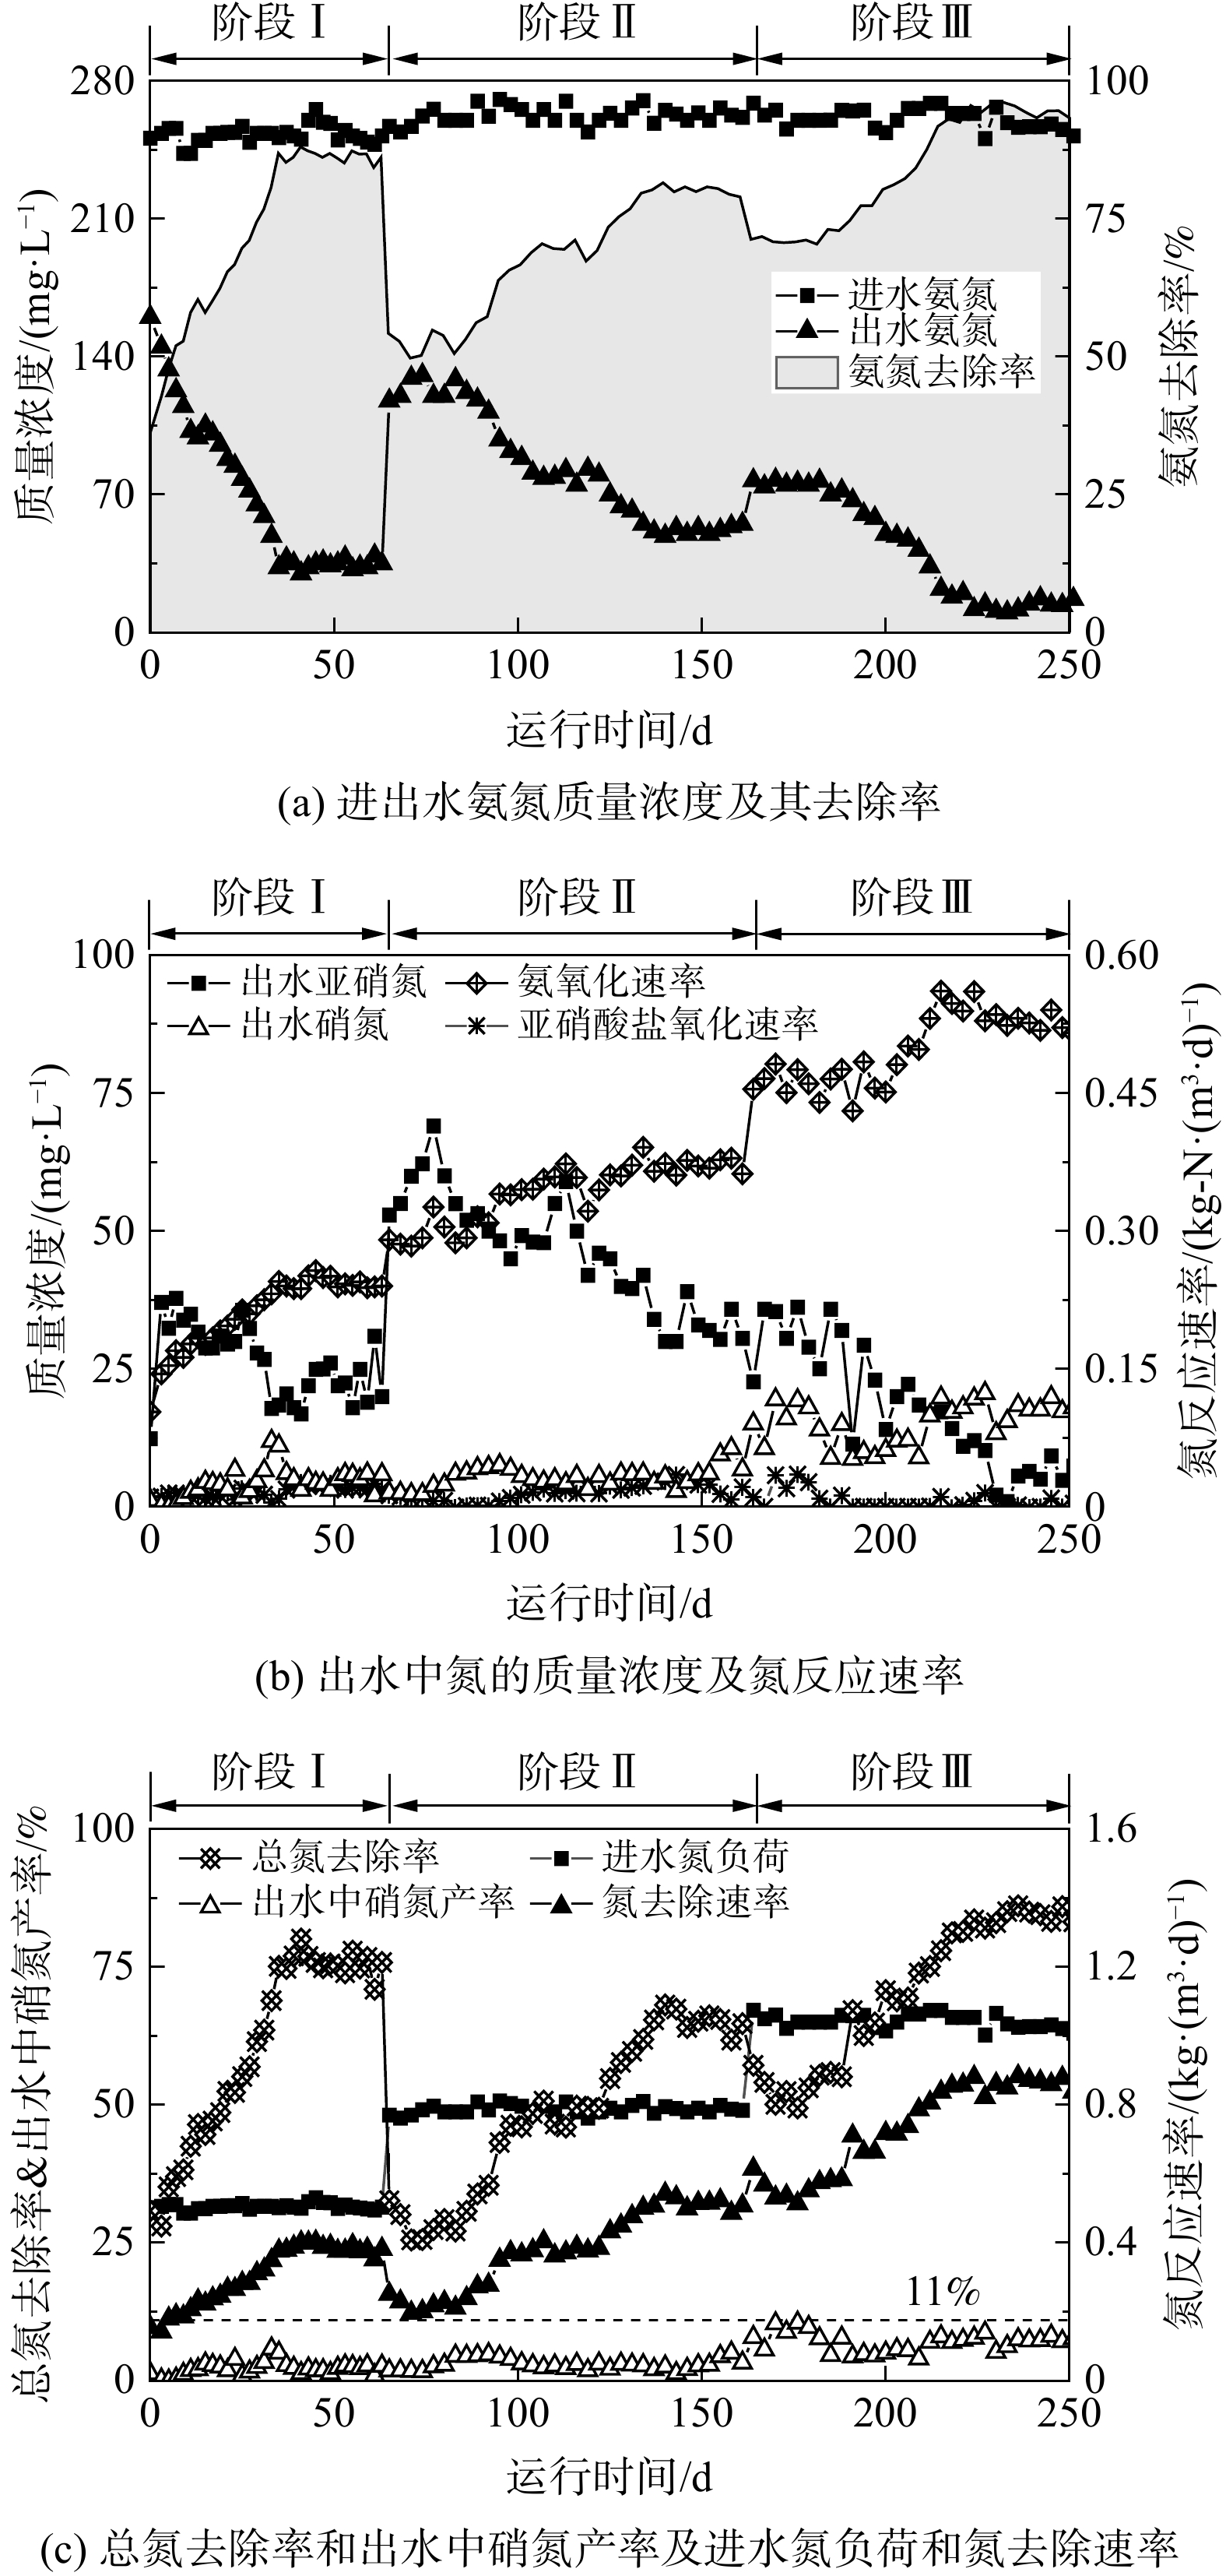
图 3 反应器各阶段脱氮性能变化
Figure 3. Changes of denitrification performance at different stages of reator
-
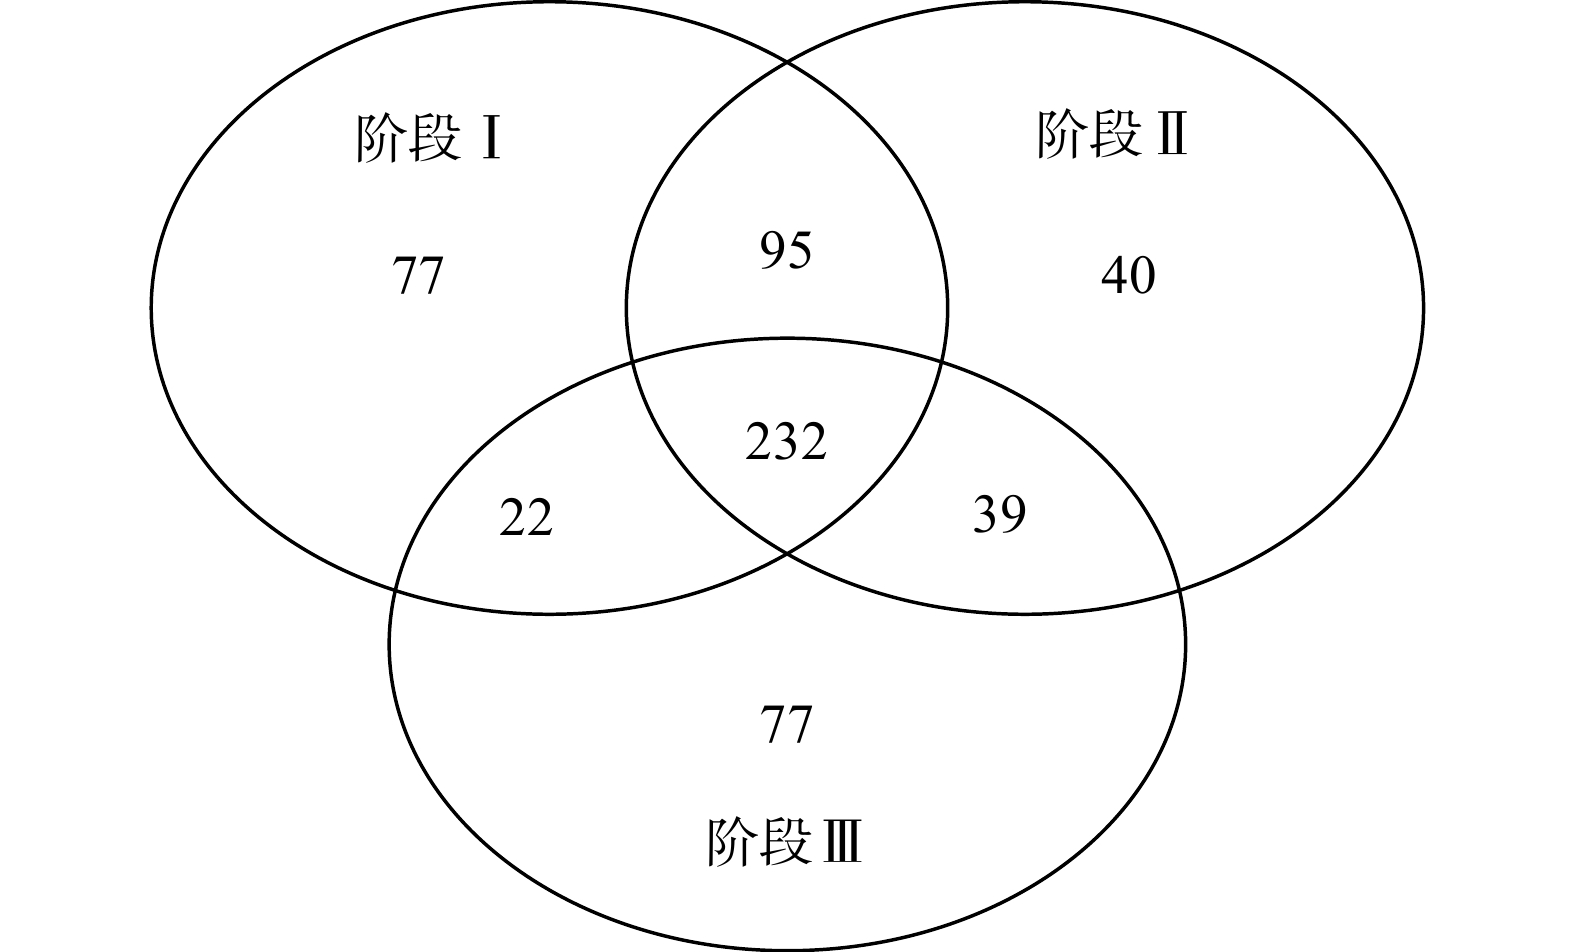
图 4 基于OTUs的不同阶段污泥样本Venn图
Figure 4. Venn diagram of sludge samples at different stages on OTUs
-
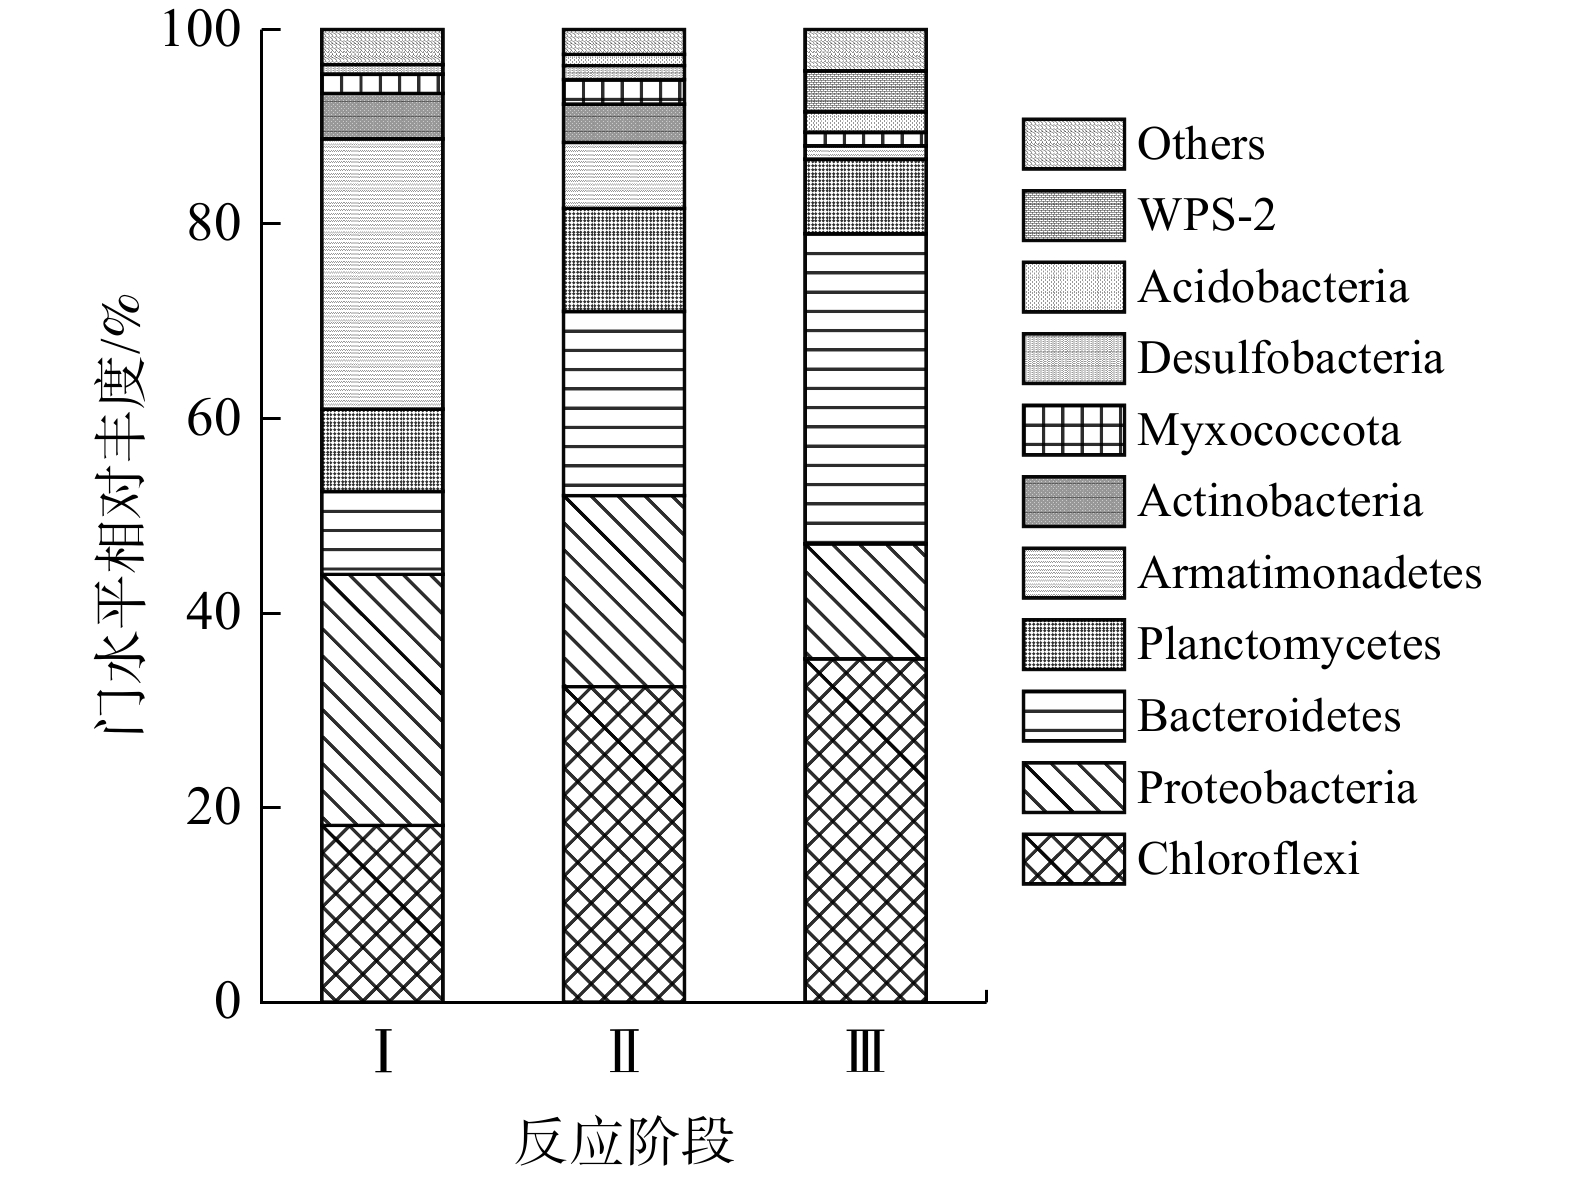
图 5 不同阶段污泥样本中门水平的群落组成及相对丰度
Figure 5. Community composition and relative abundance at phylum level in sludge samples at different stages
-
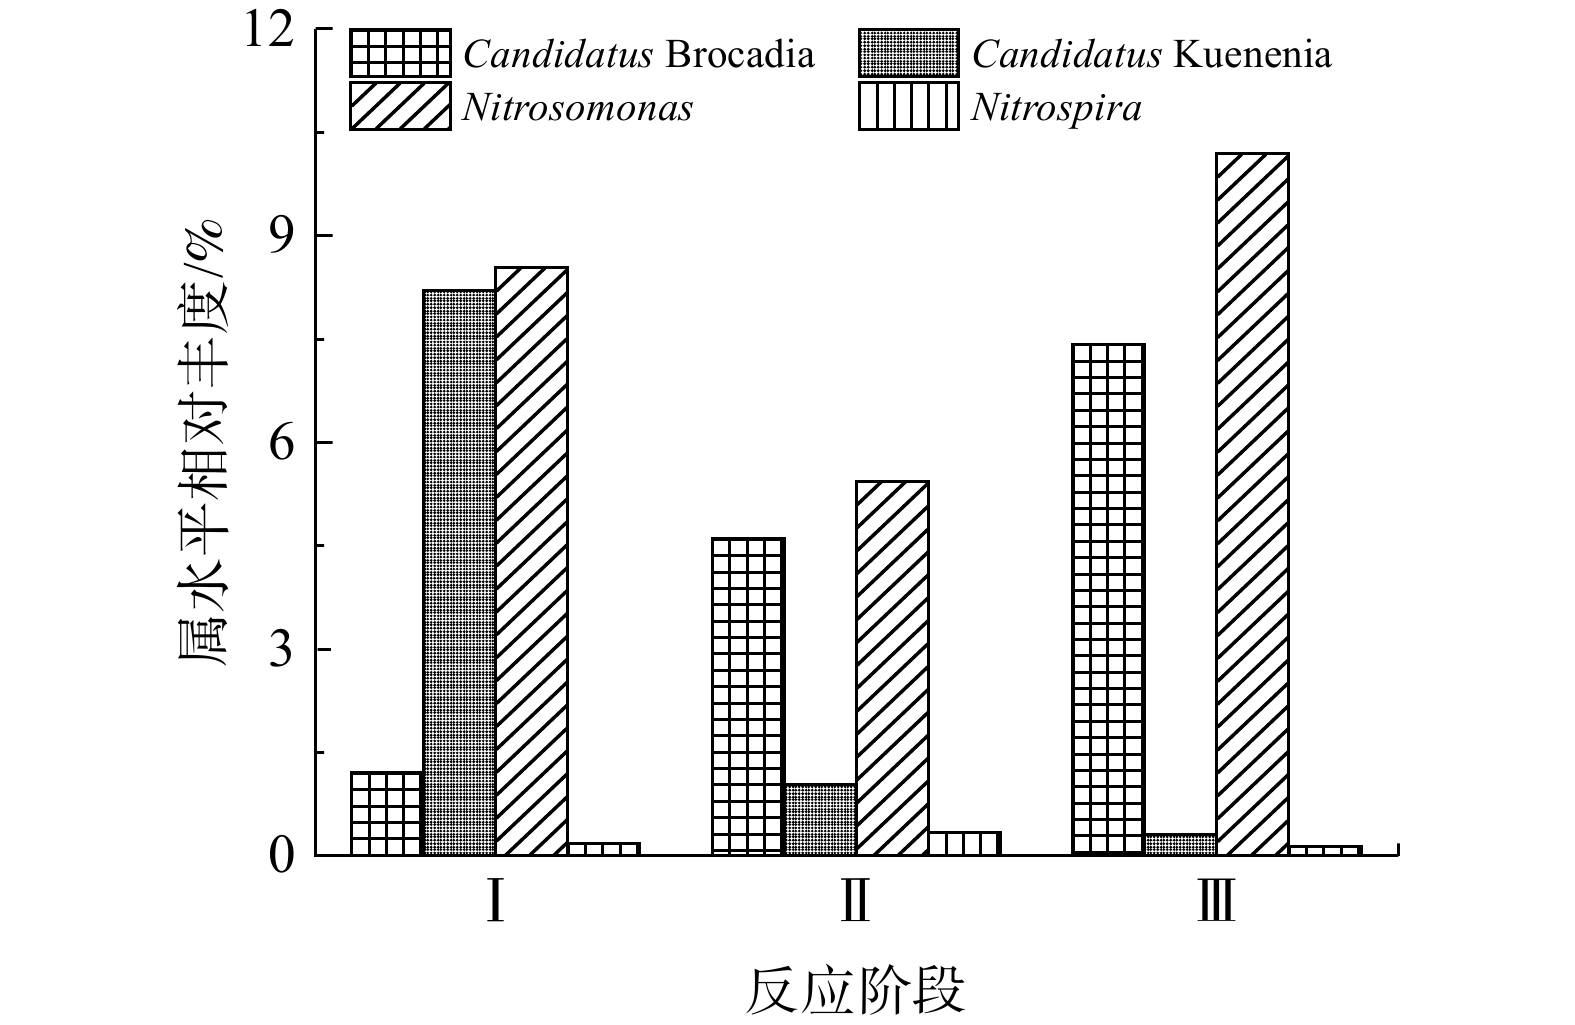
图 6 不同阶段污泥样本中属水平的功能菌群相对丰度对比
Figure 6. Comparison of relative abundance of functional bacteria at genus level in sludge samples at different stages
Figure
6 ,Table
2 个