-
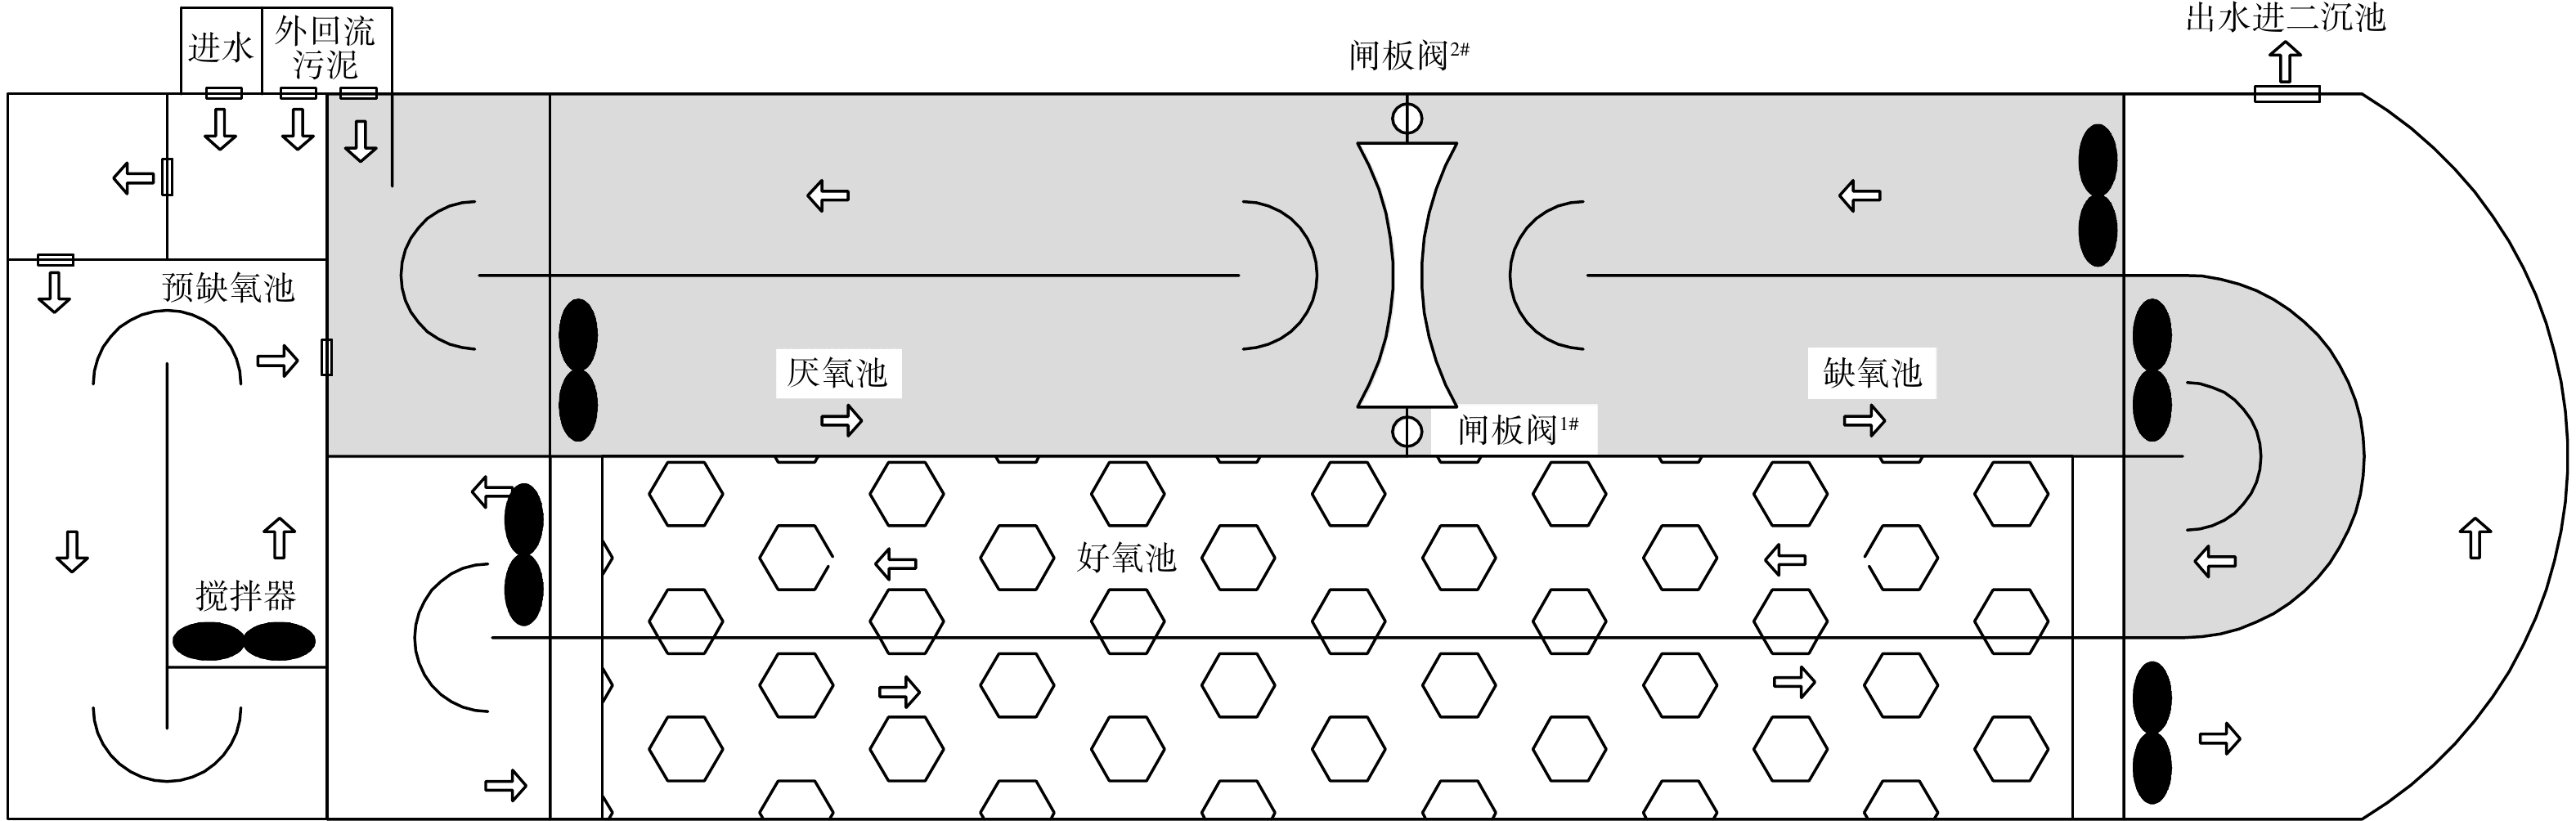
图 1 生化池平面布置图
Figure 1. Schematic diagram of the biochemical tanks
-
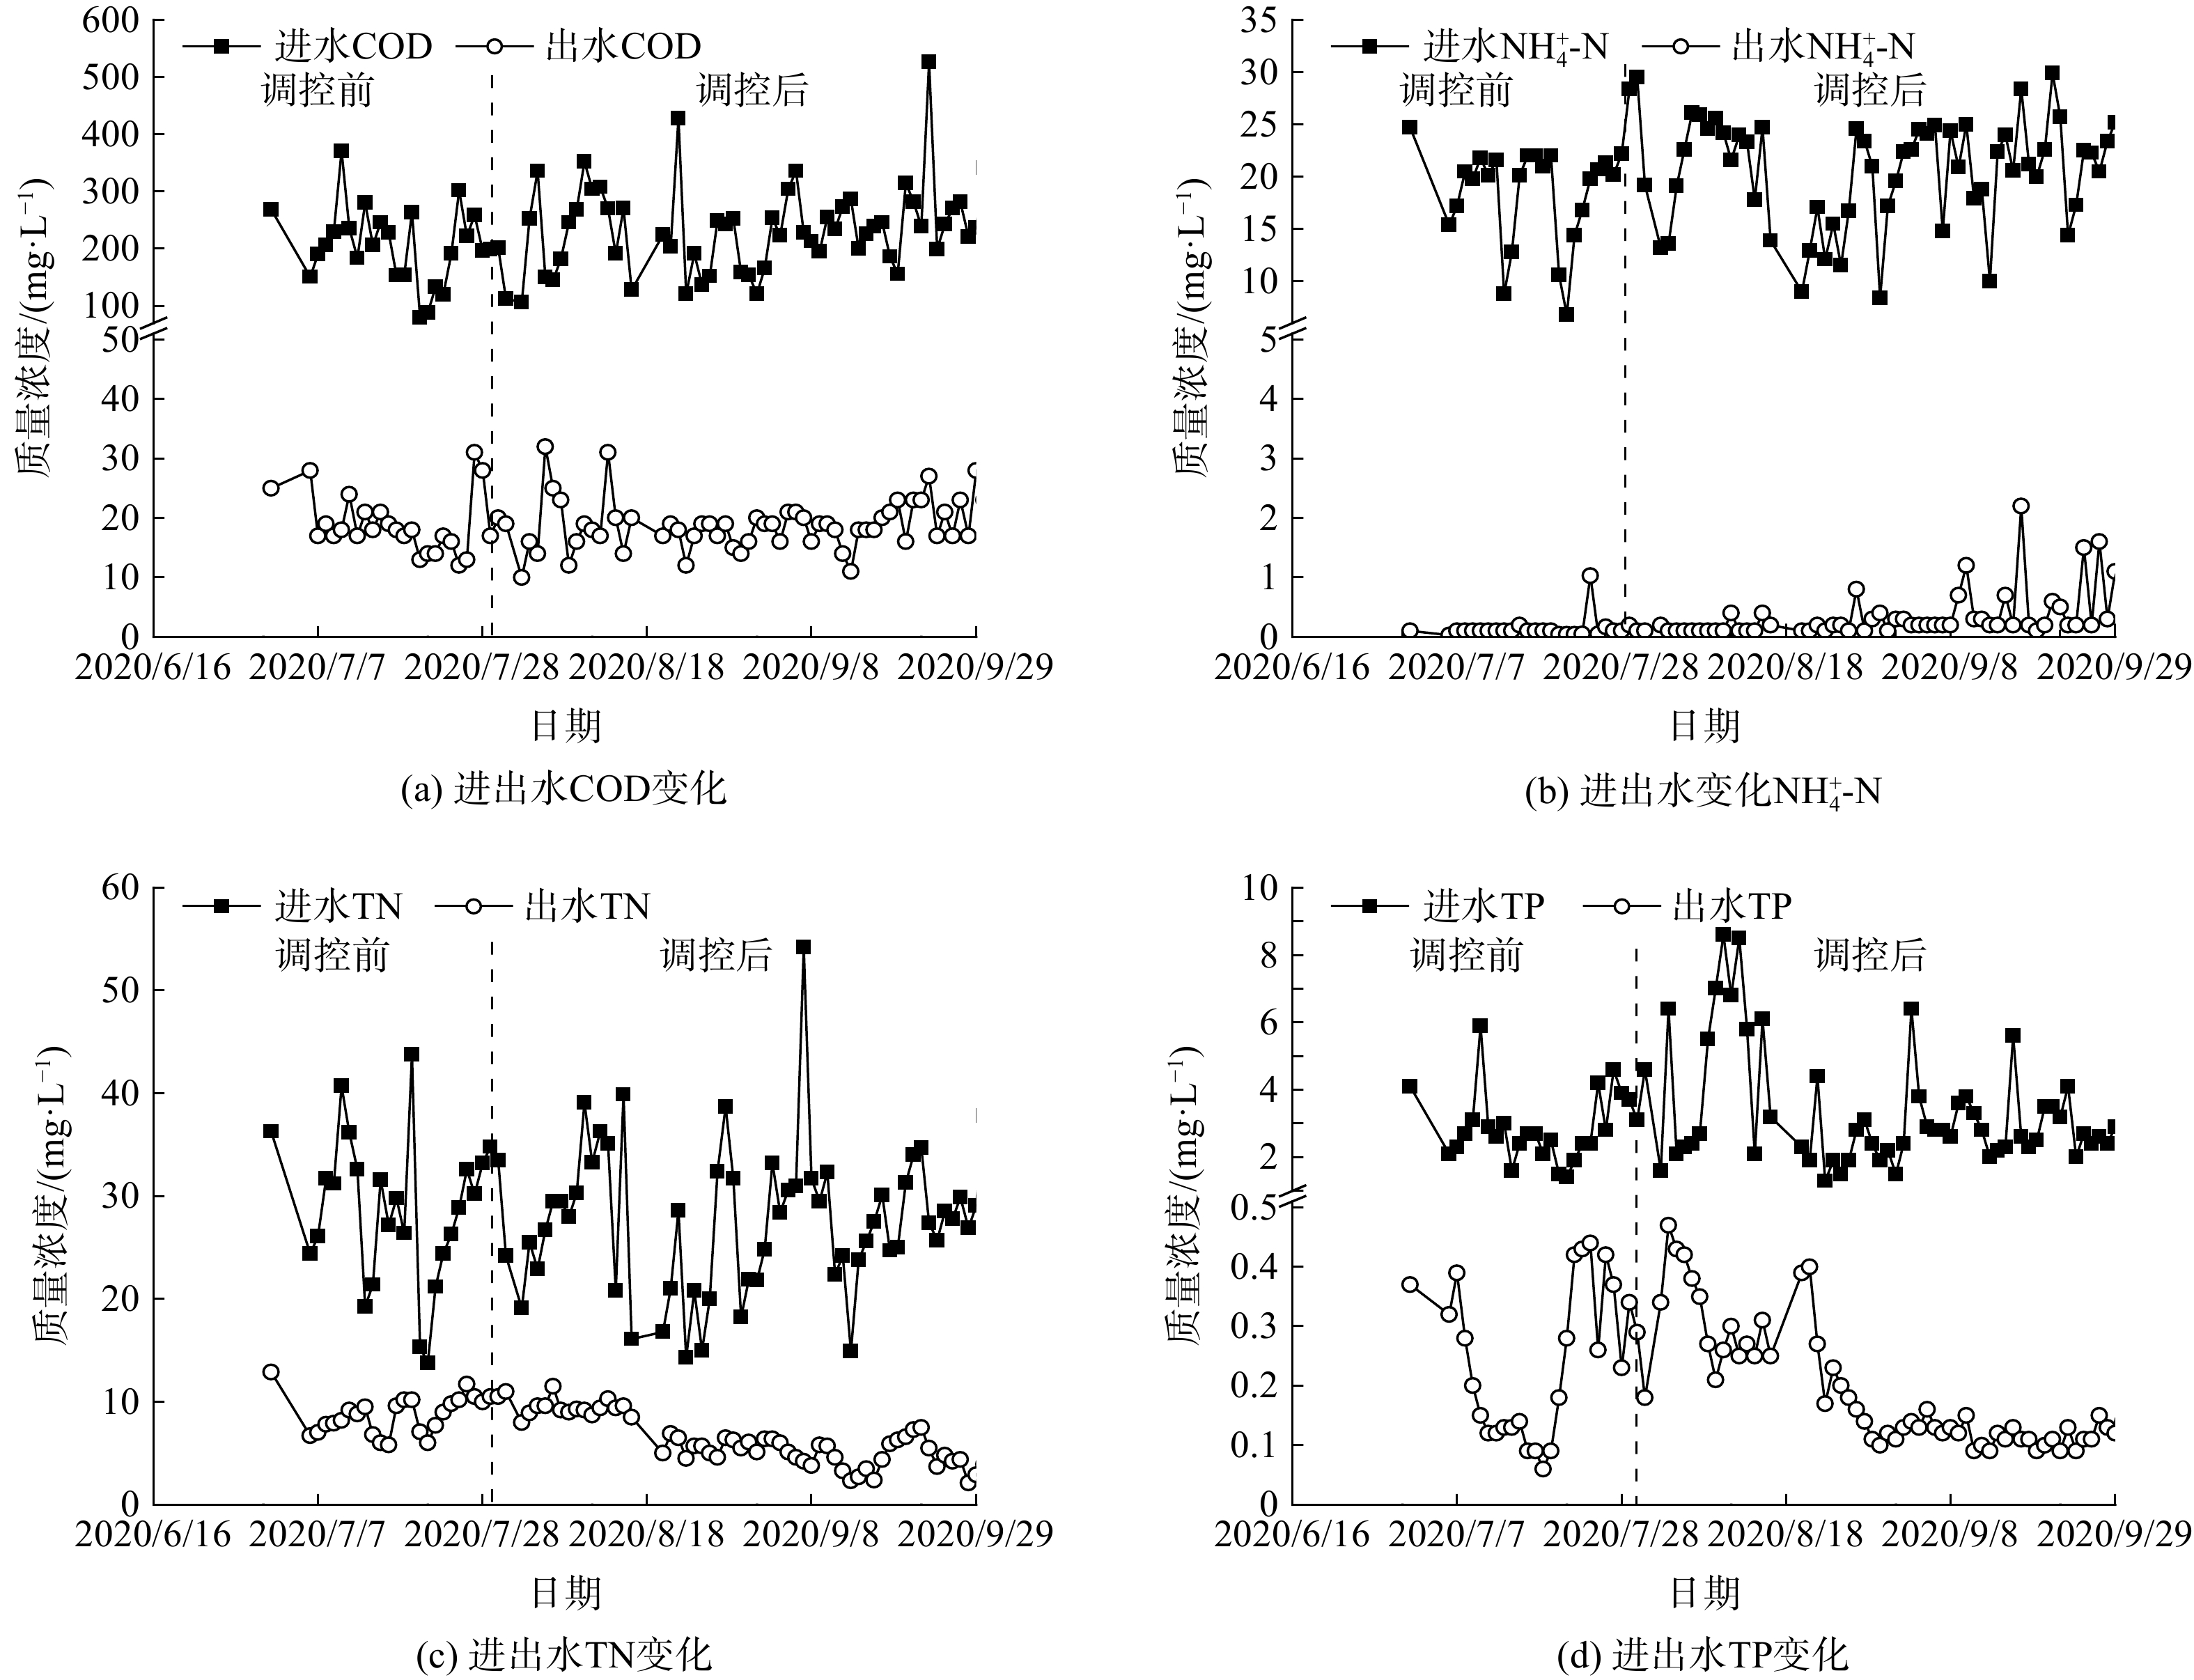
图 2 污水处理厂优化曝气方式前后对污染物去除情况
Figure 2. Removal of pollutants before and after optimization of aeration in the WWTP
-
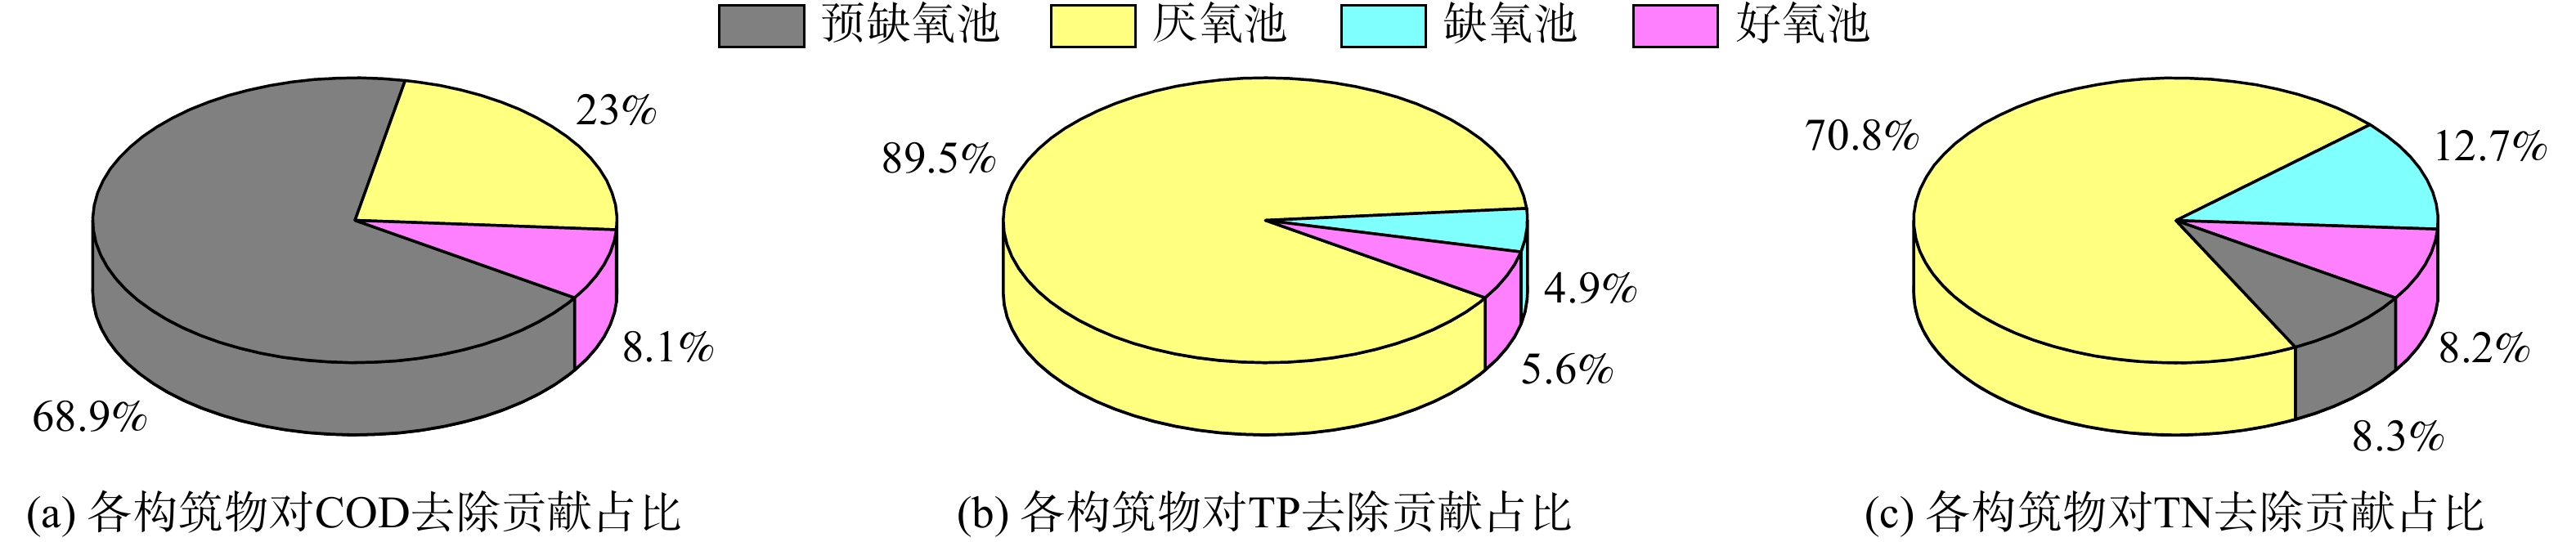
图 3 生化池不同构筑物对各类污染物的去除贡献
Figure 3. Contribution of different structures in biochemical pond to removal of various pollutants
-
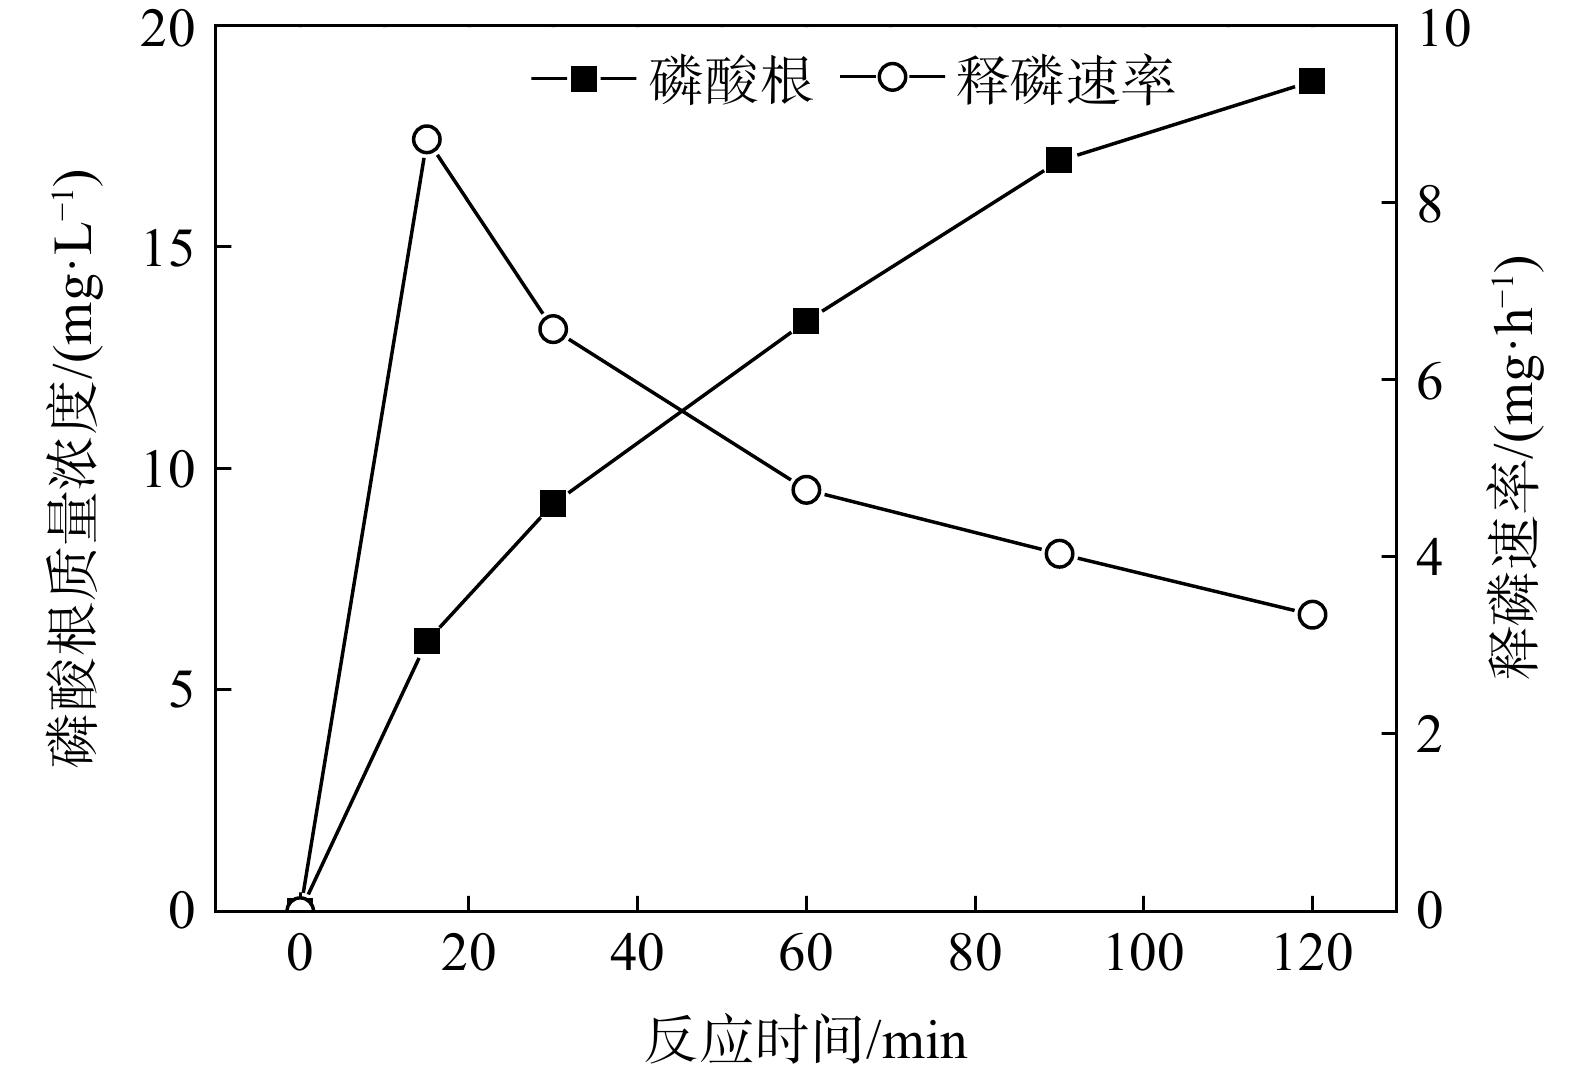
图 4 厌氧状态下活性污泥释磷情况及释磷速率
Figure 4. Phosphorus release and release rate of activated sludge under anaerobic condition
-
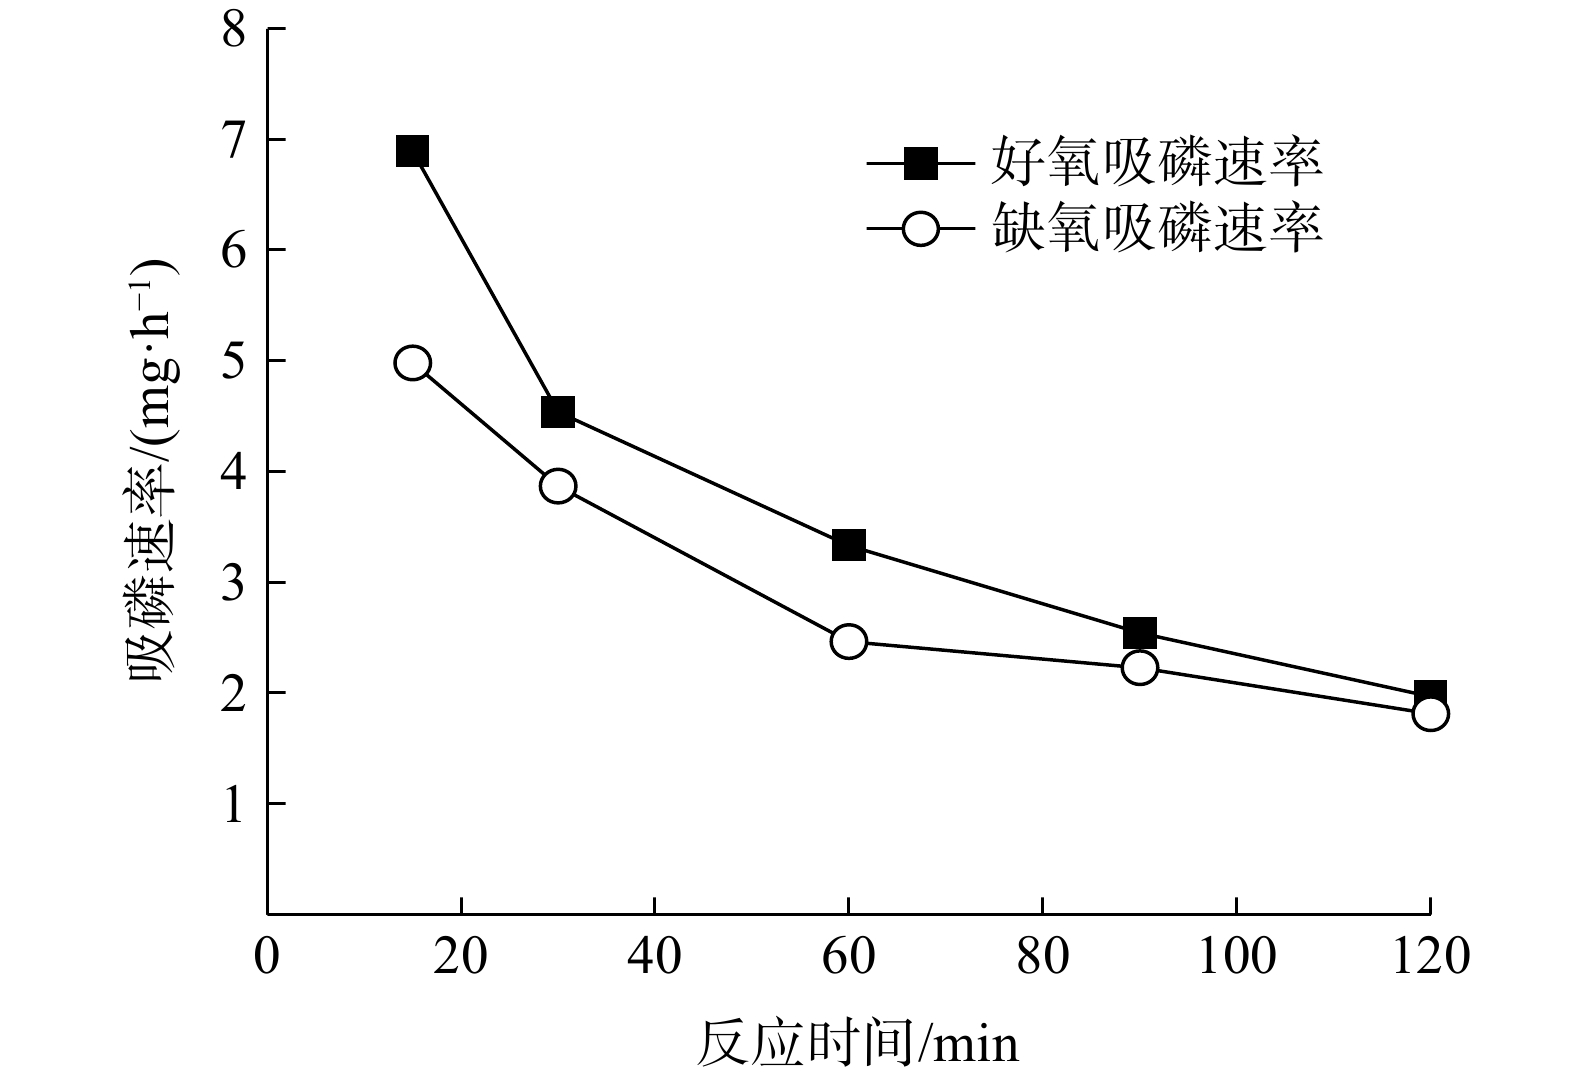
图 5 活性污泥在好氧及缺氧状态下的吸磷速率
Figure 5. Phosphorus uptake rate of activated sludge under aerobic and anoxic conditions
Figure
5 ,Table
2 个