-
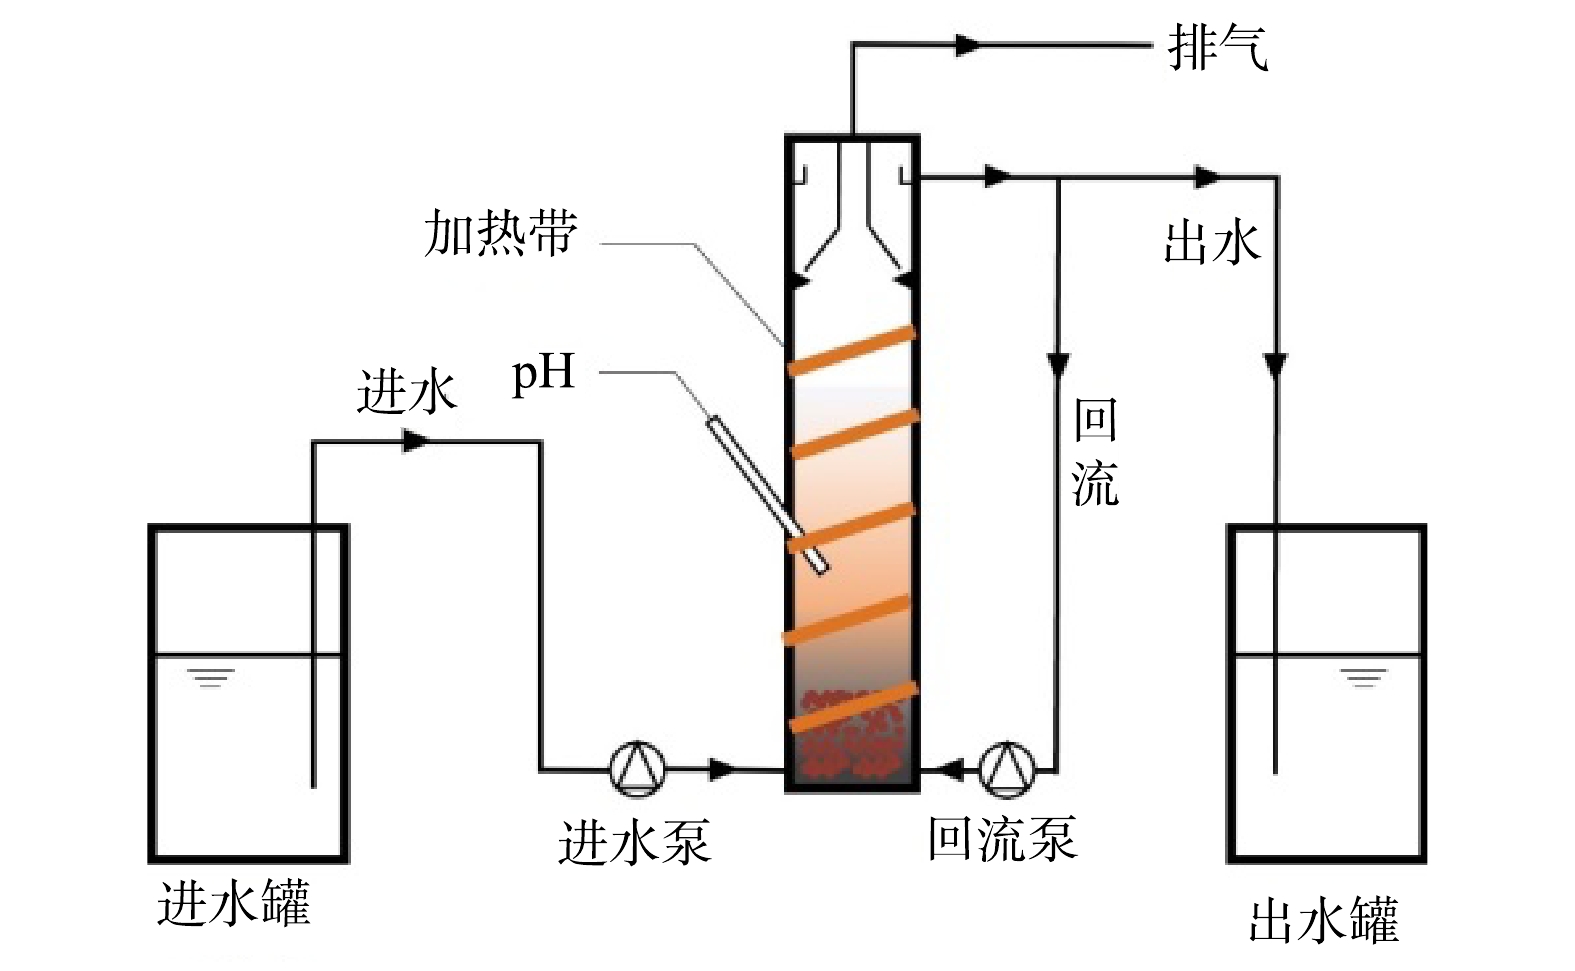
图 1 厌氧氨氧化实验流程图
Figure 1. Schematic diagram of the anammox experiment
-
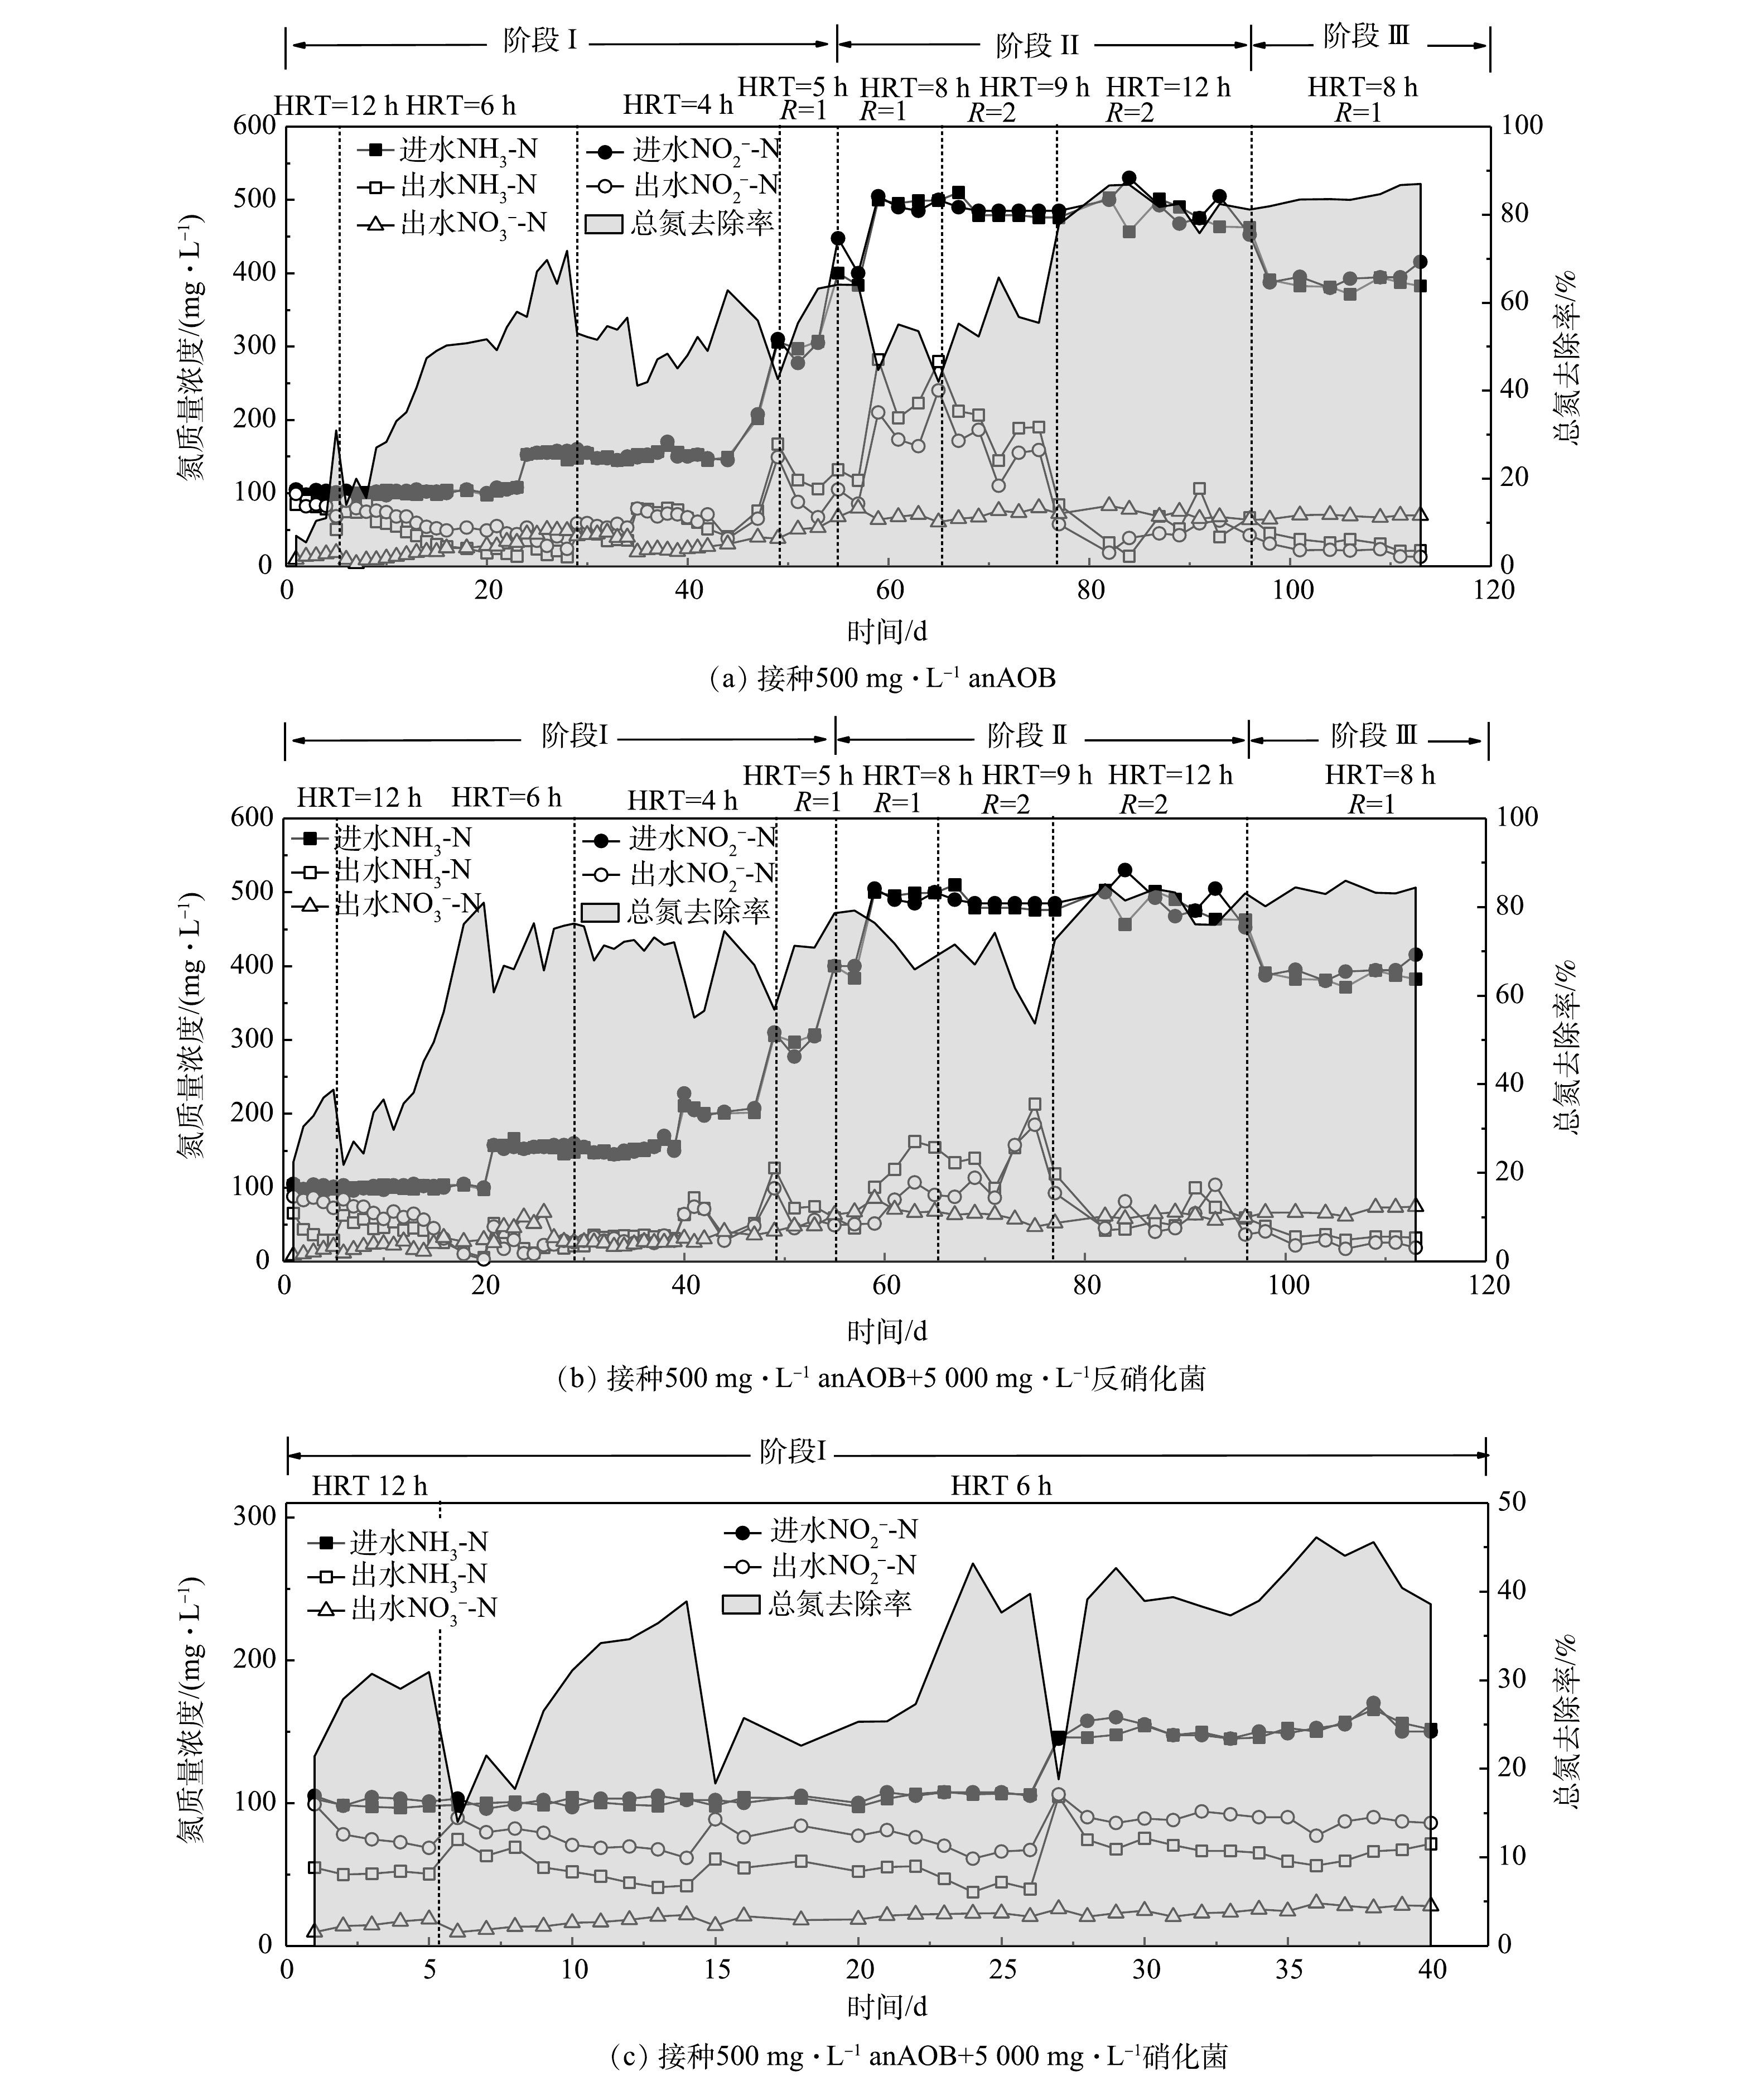
图 2 进出水氮质量浓度的变化和总氮去除率
Figure 2. Variation of influent and effluent nitrogen compounds and total nitrogen removal rate
-
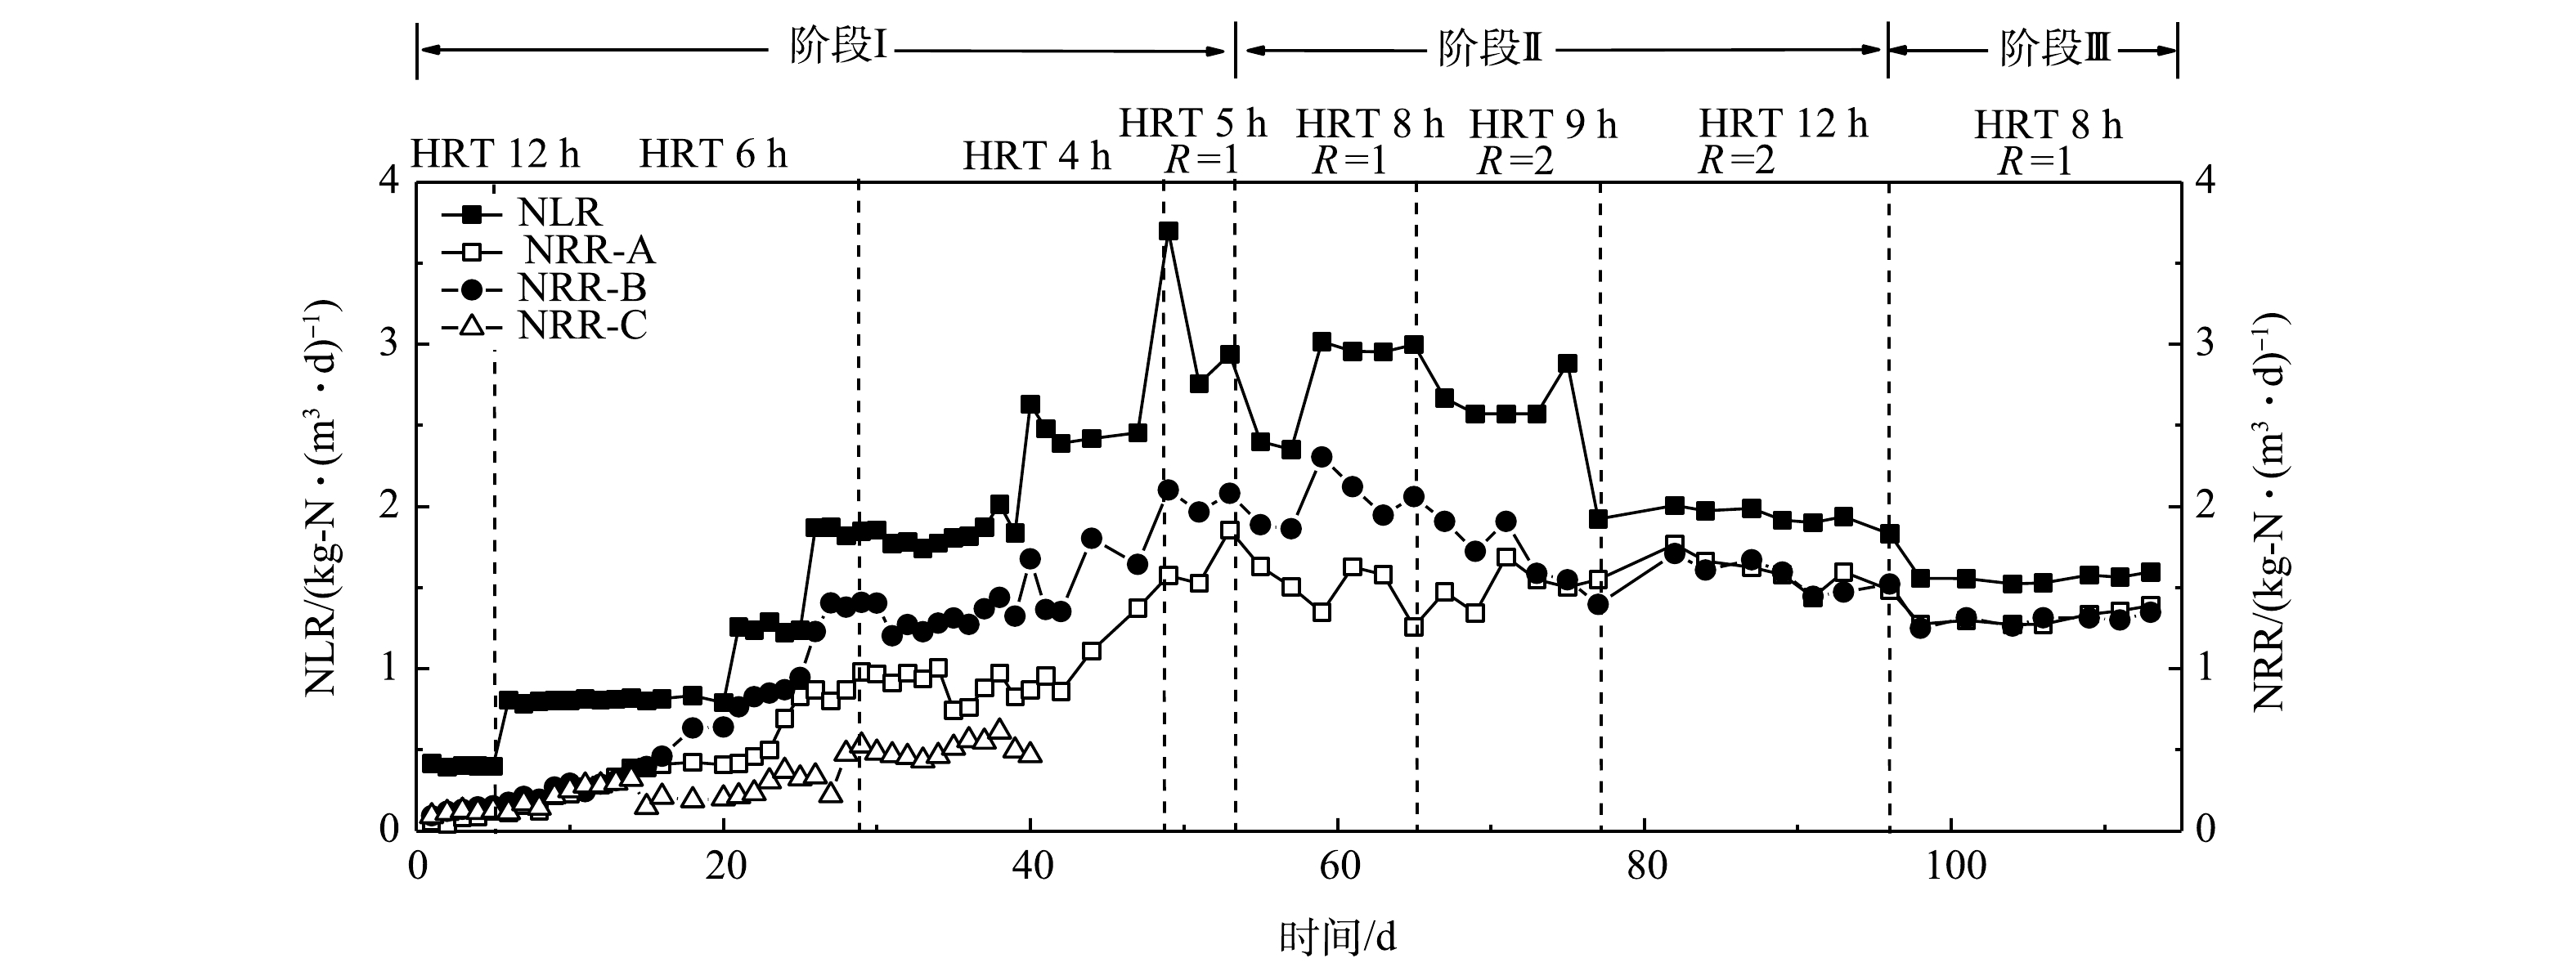
图 3 氮去除负荷和去除效率变化
Figure 3. Variation of nitrogen load rate and nitrogen removal rate
-
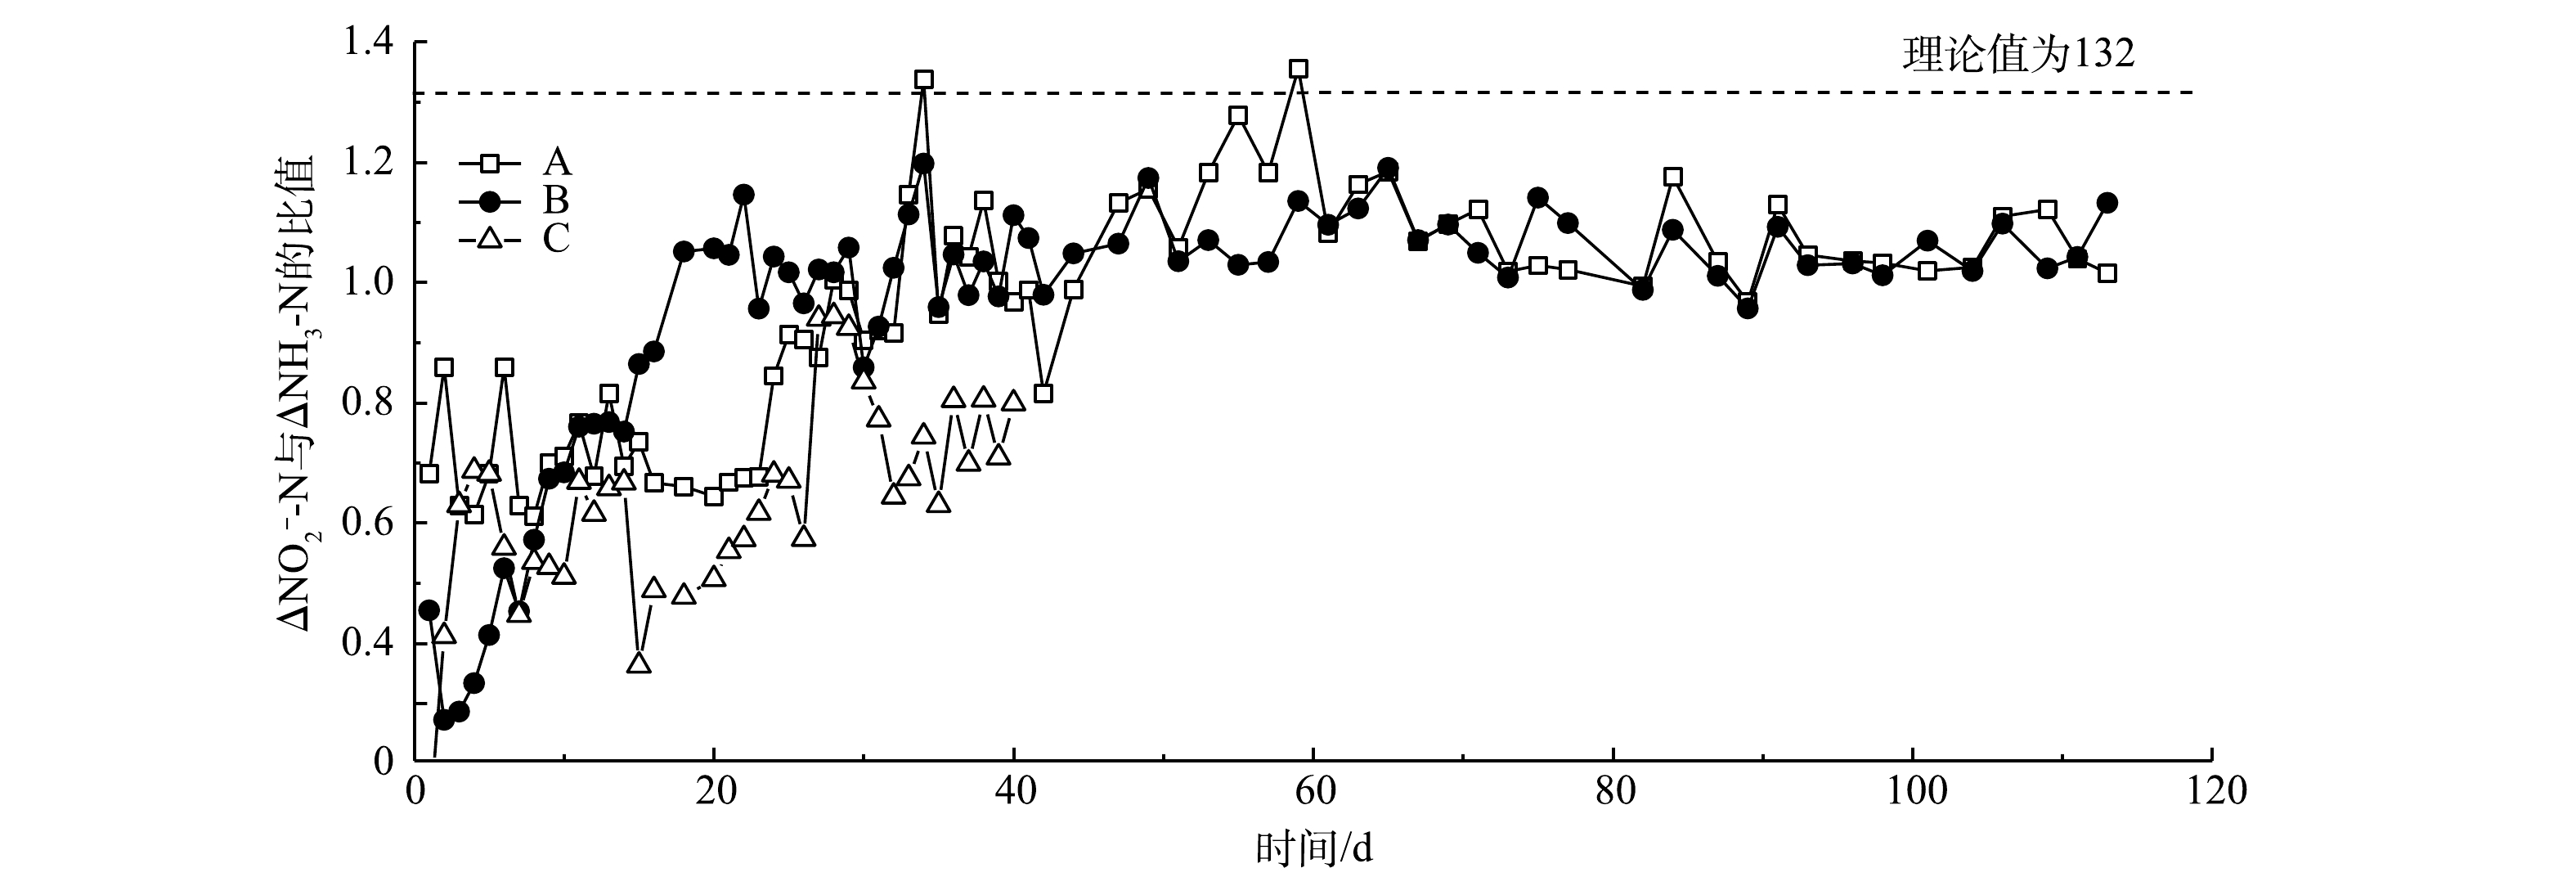
图 4 △
${\rm{NO}}_2^{-} $ Figure 4. Variation of the ratio of
${\rm{NO}}_2^{-} $ -
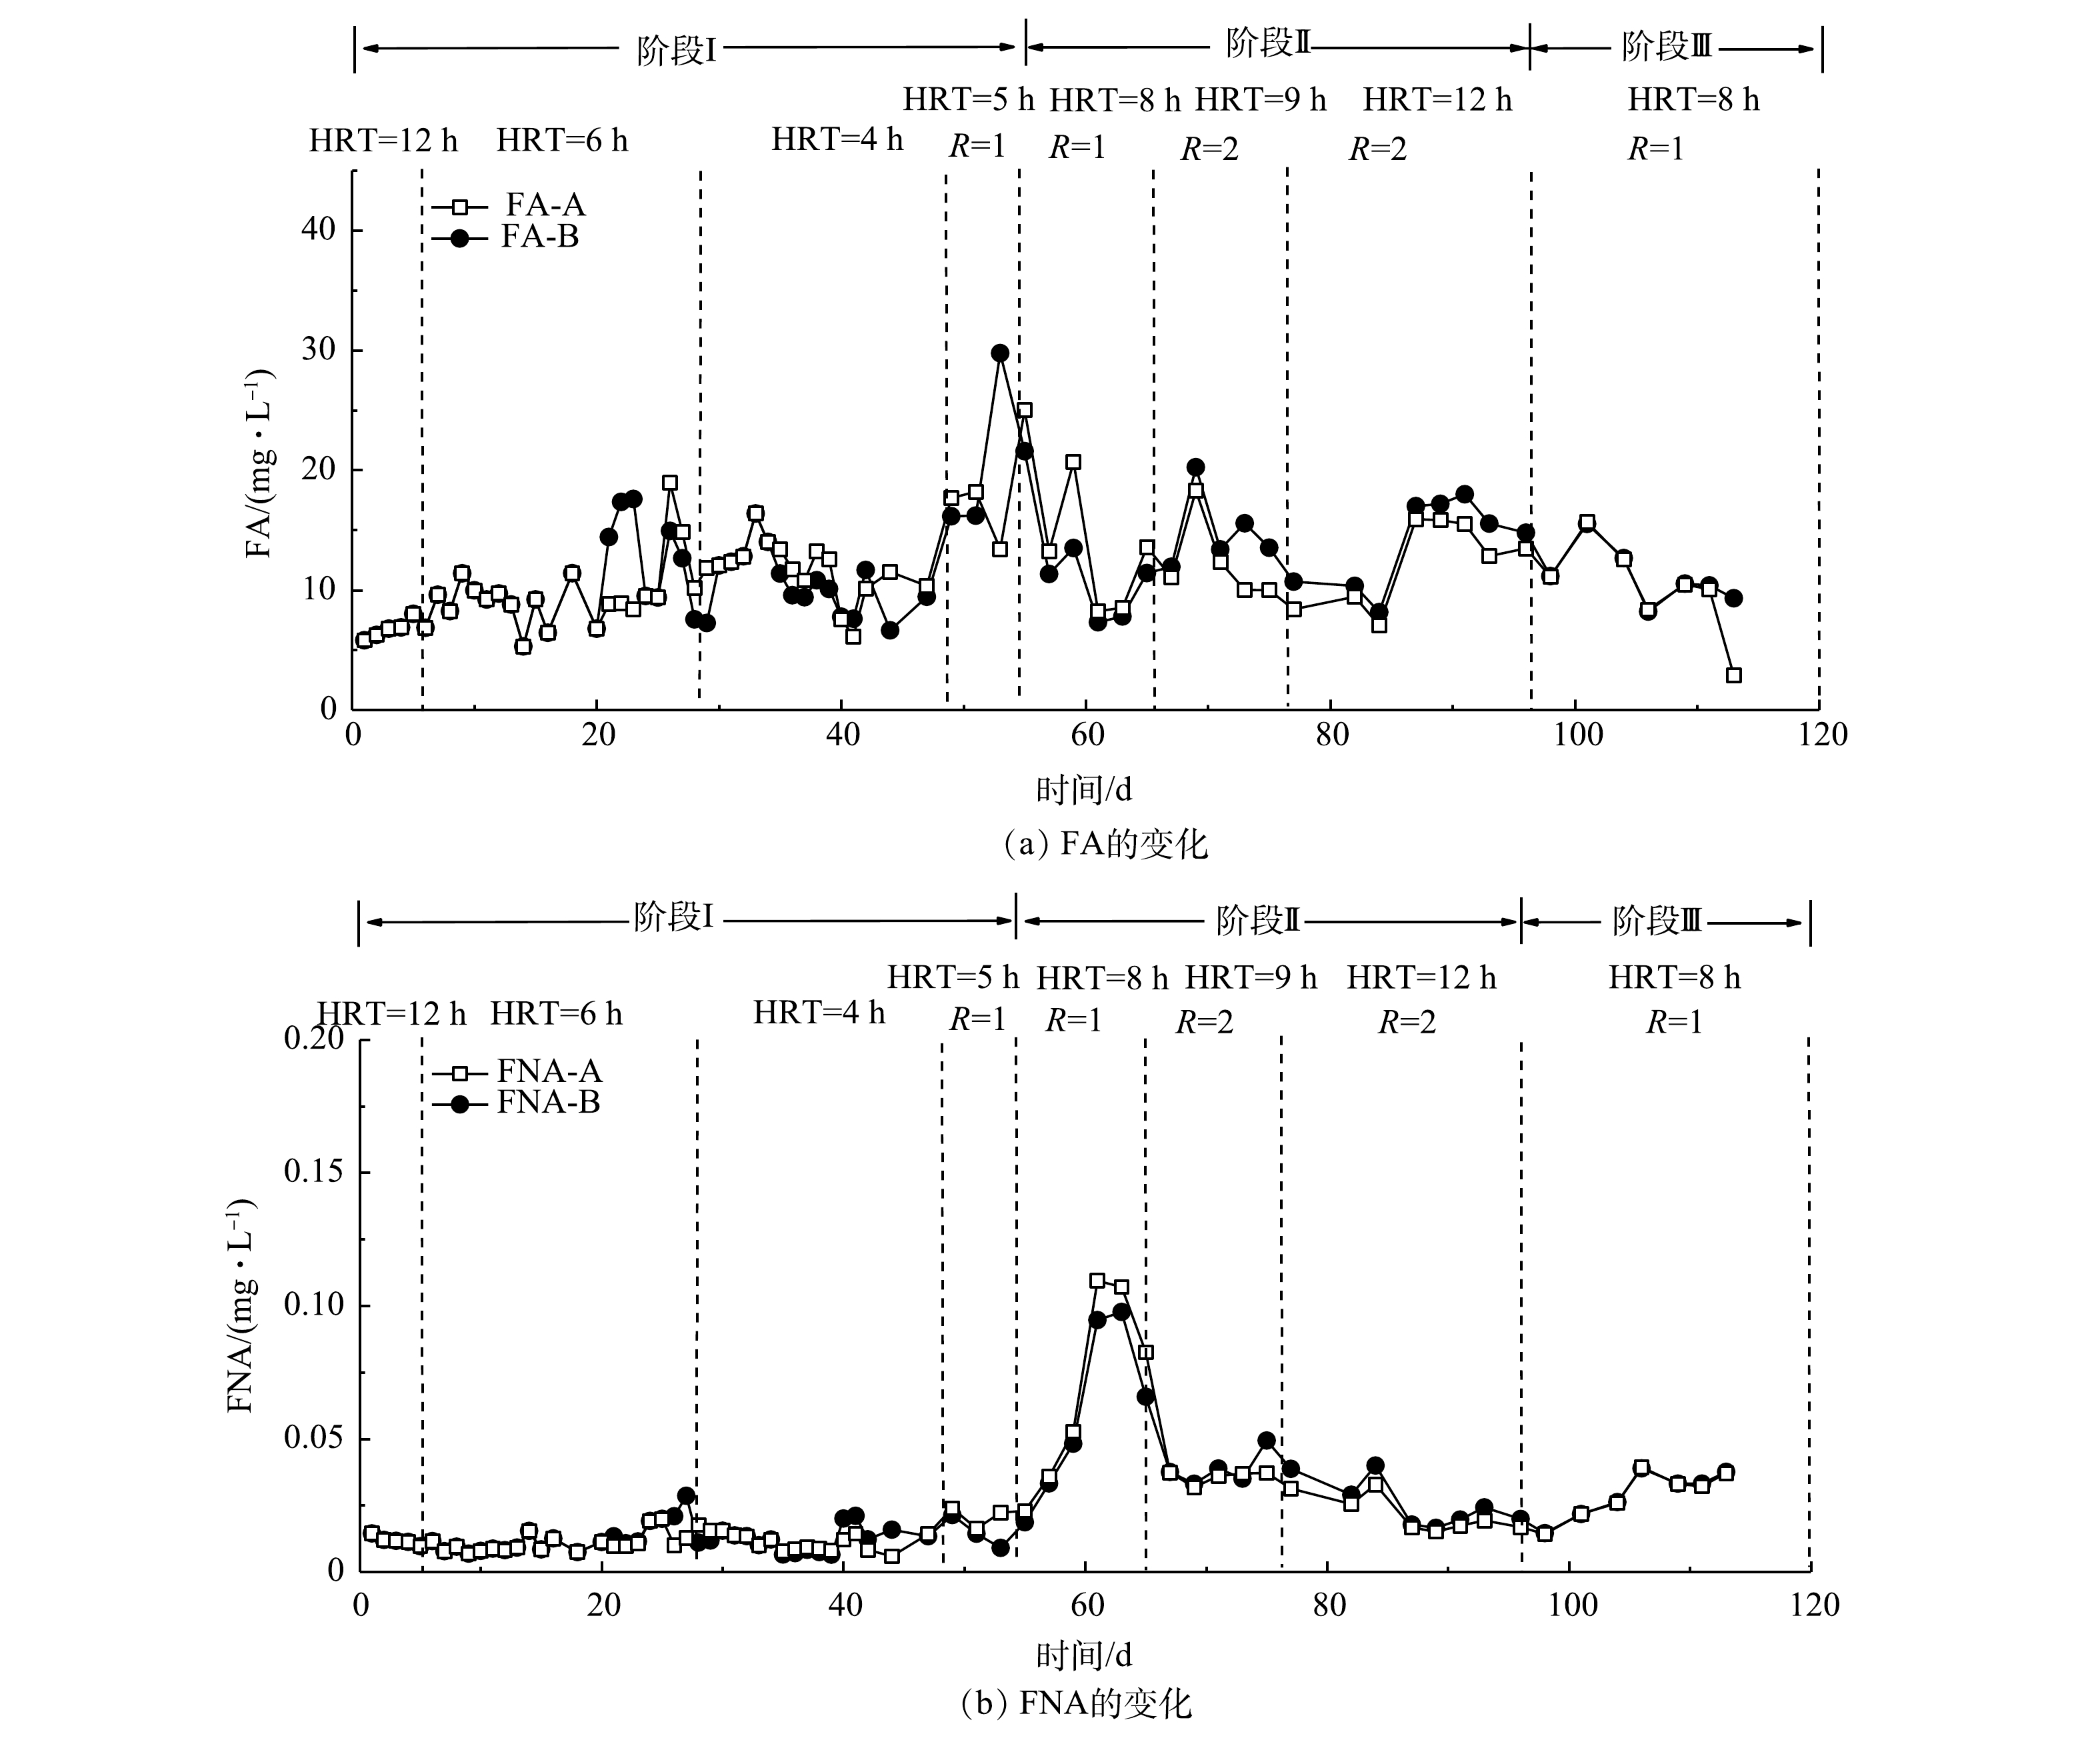
图 5 FA和FNA的变化
Figure 5. Variation of FA and FNA
-
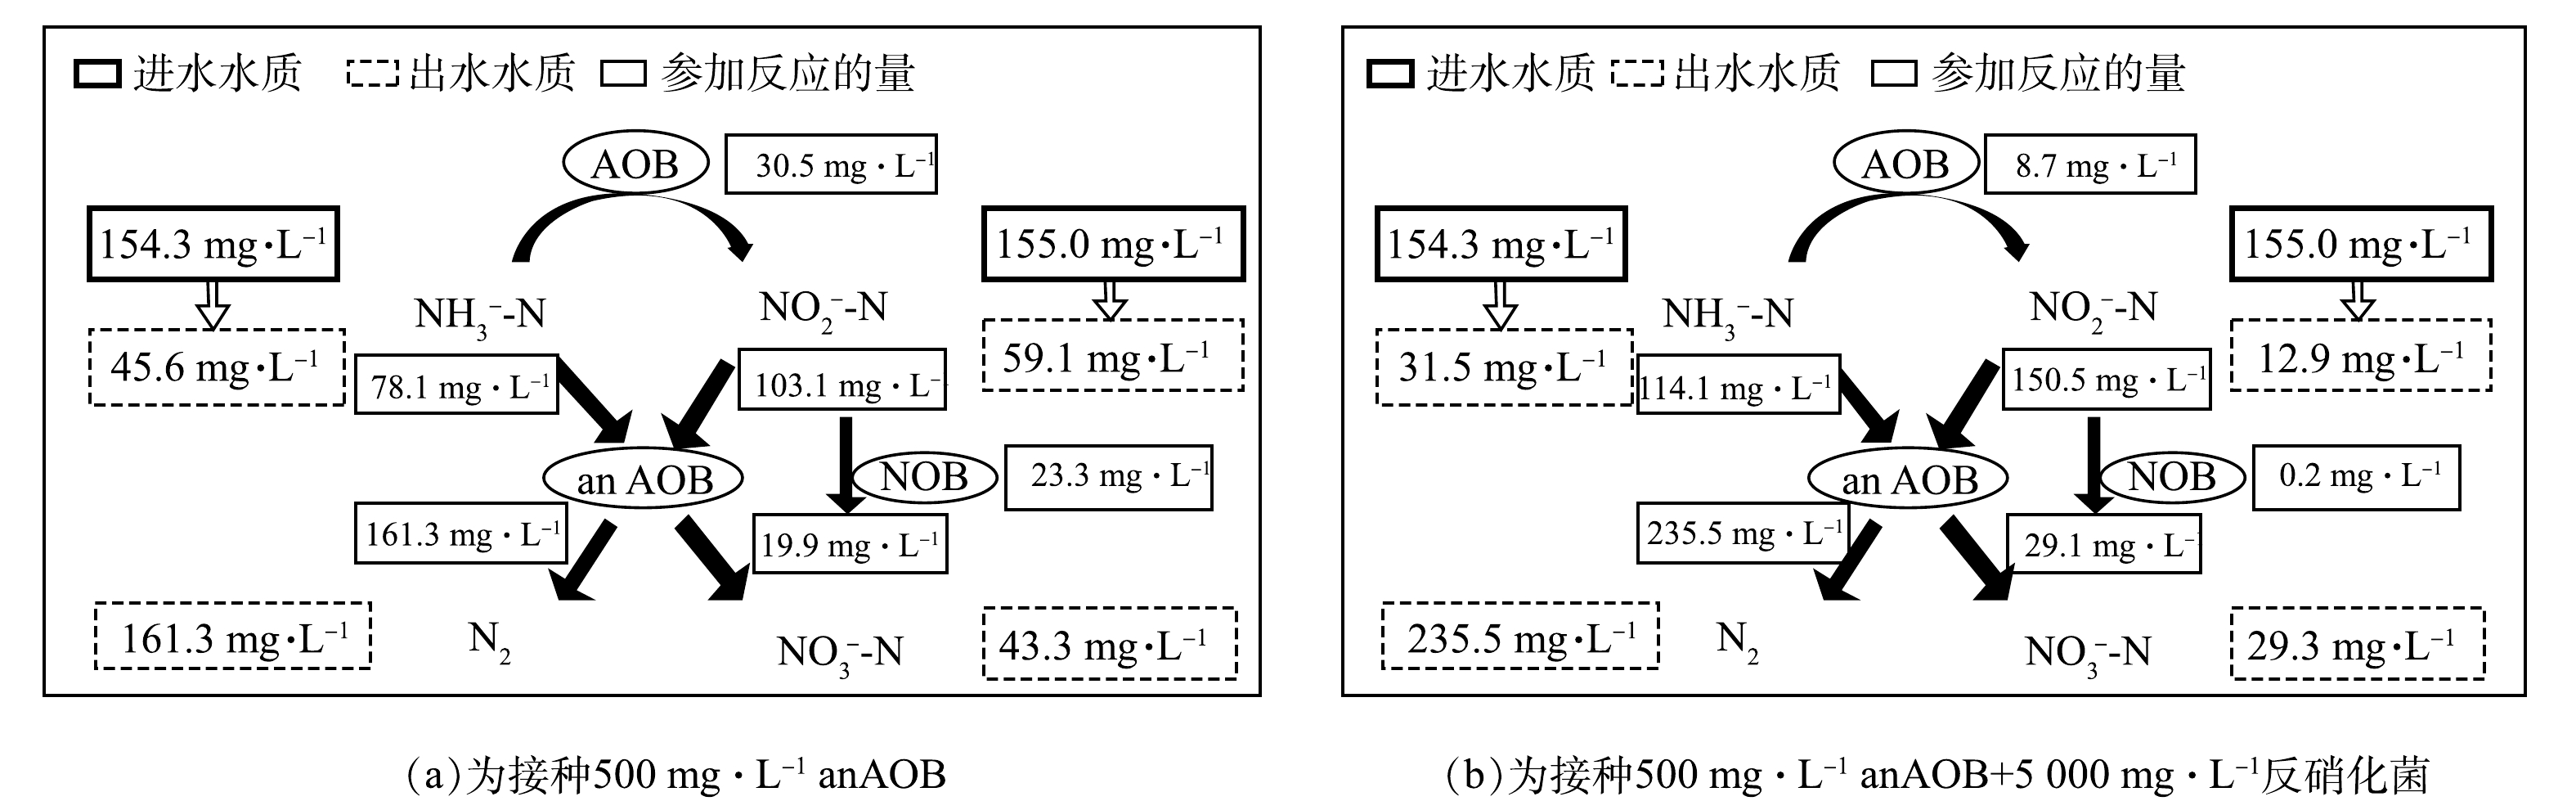
图 6 2组氮素转化衡算
Figure 6. Nitrogen conversion and balance of two groups
-
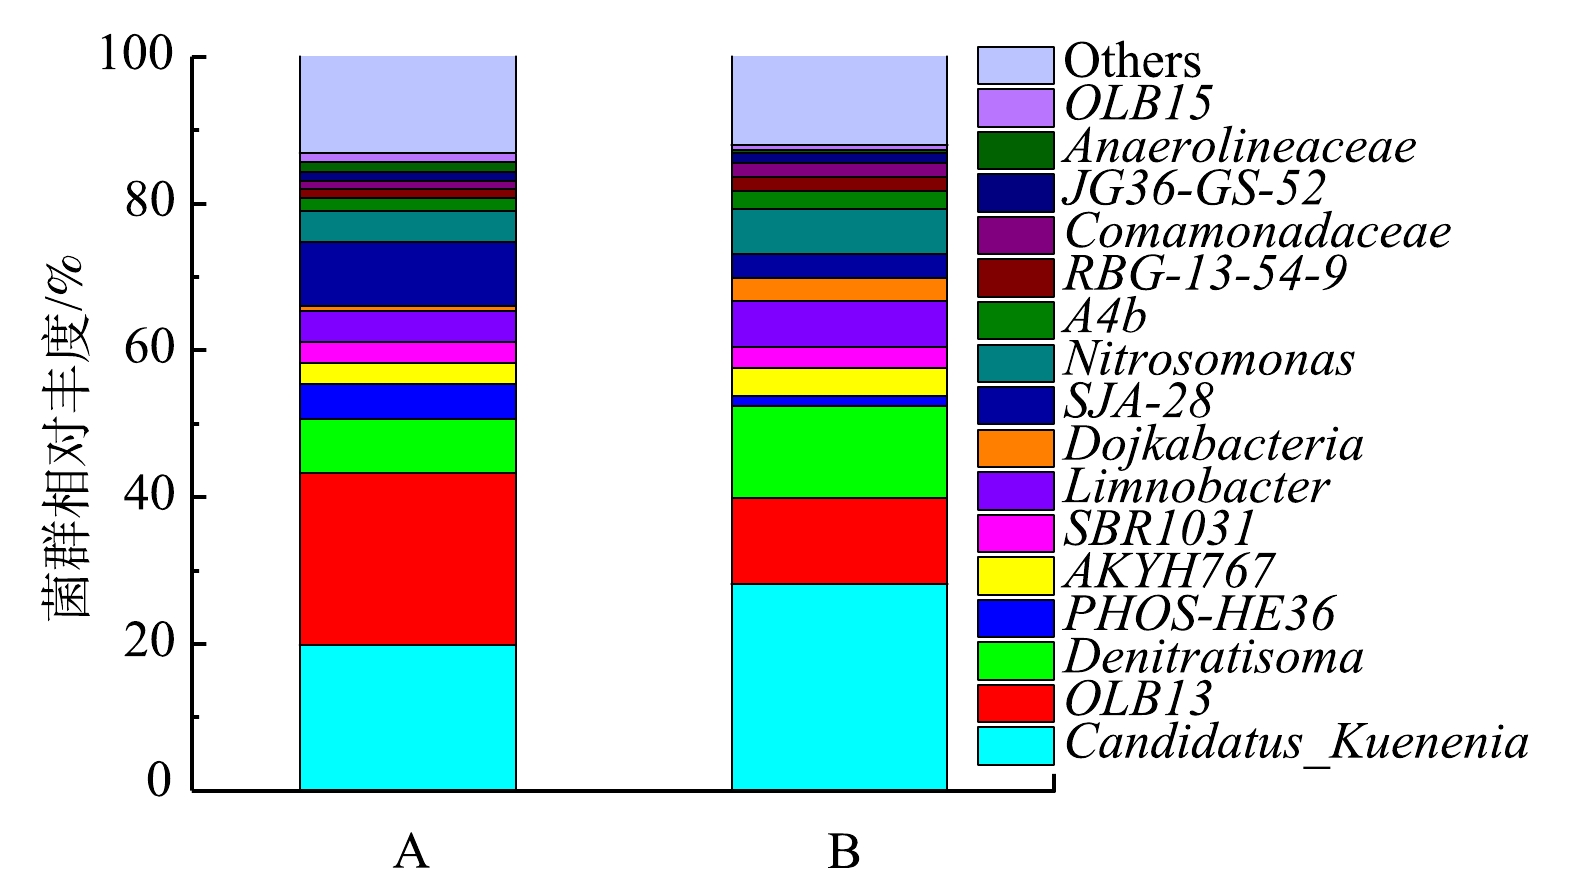
图 7 微生物群落组成对比
Figure 7. Comparison of the composition of microbial communities
Figure
7 ,Table
1 个