-
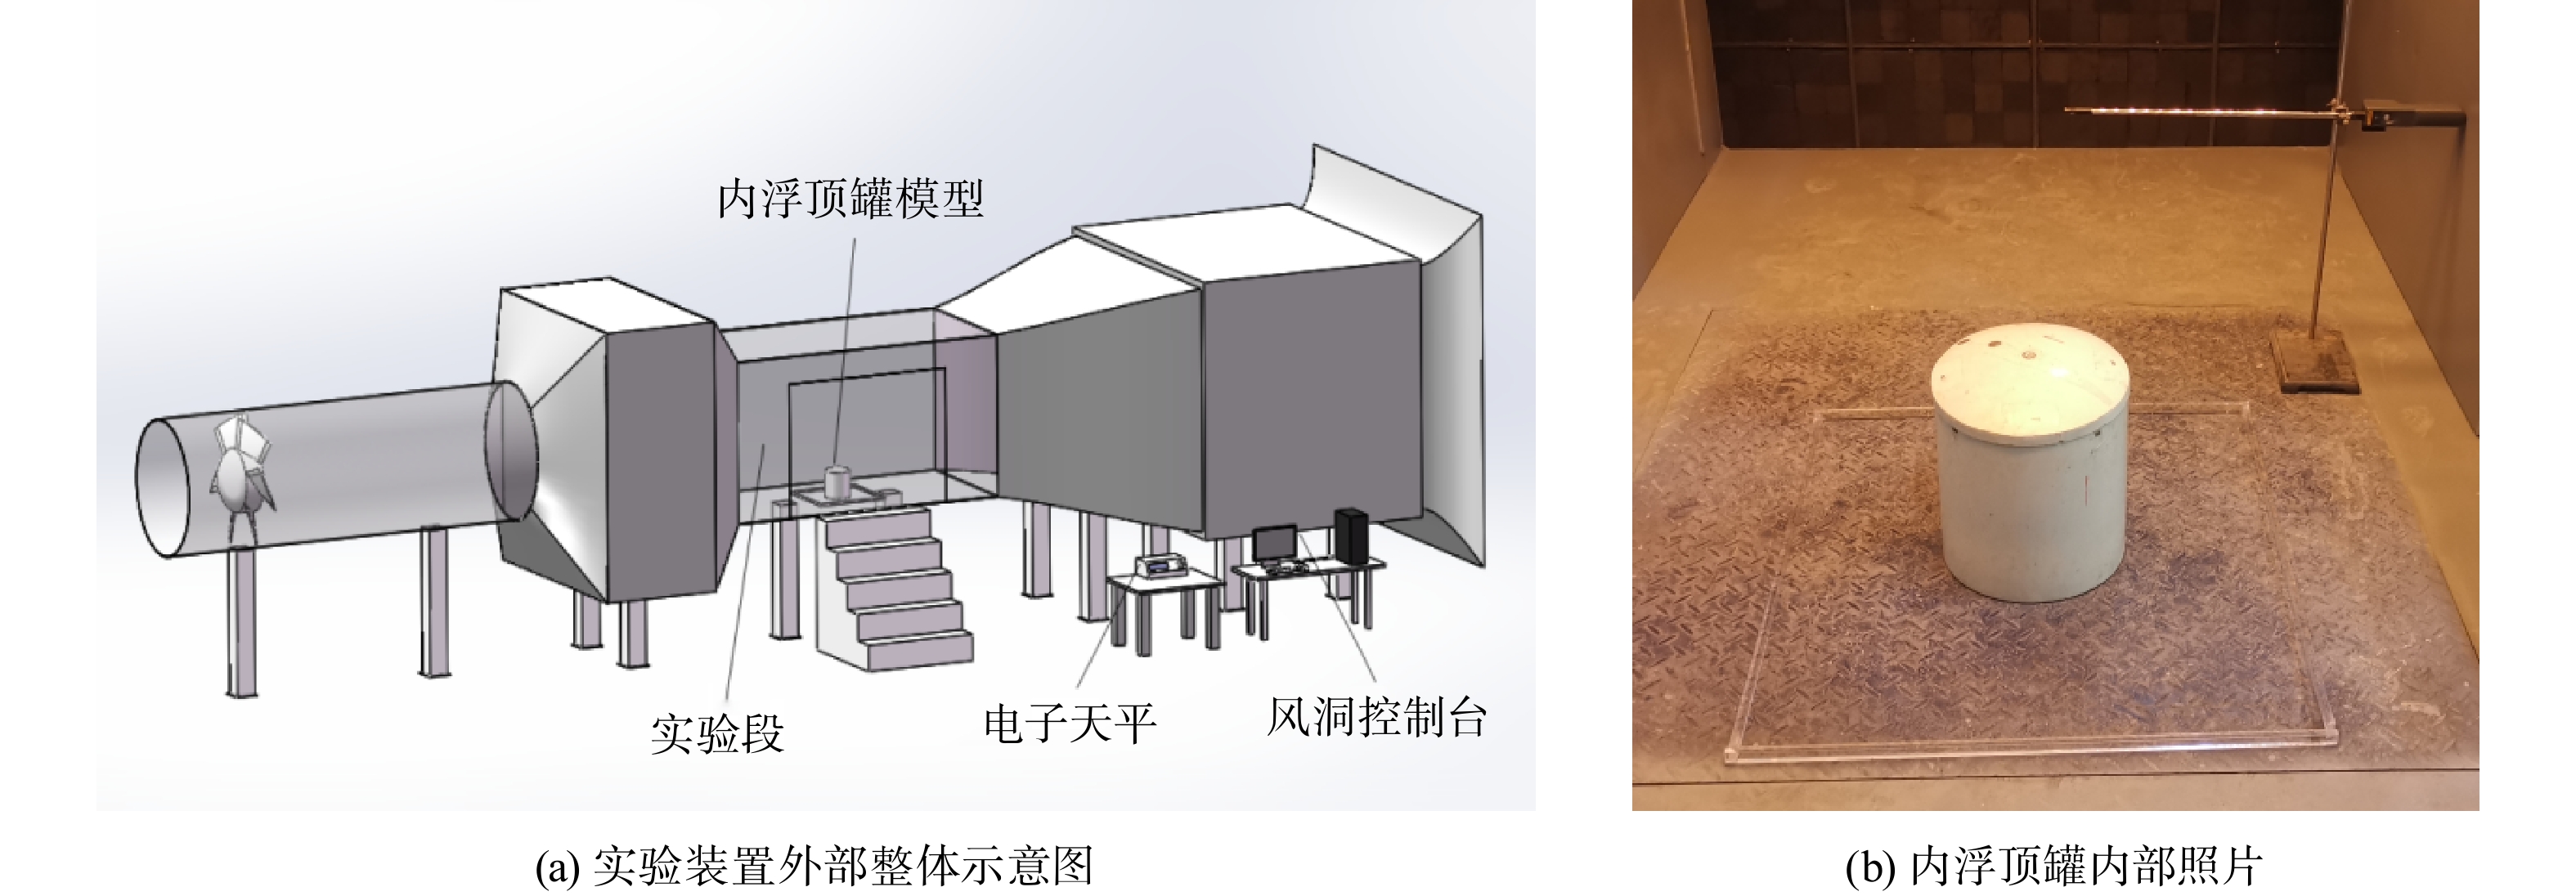
图 1 风洞实验装置图
Figure 1. Schematic diagram of the wind tunnel platform
-
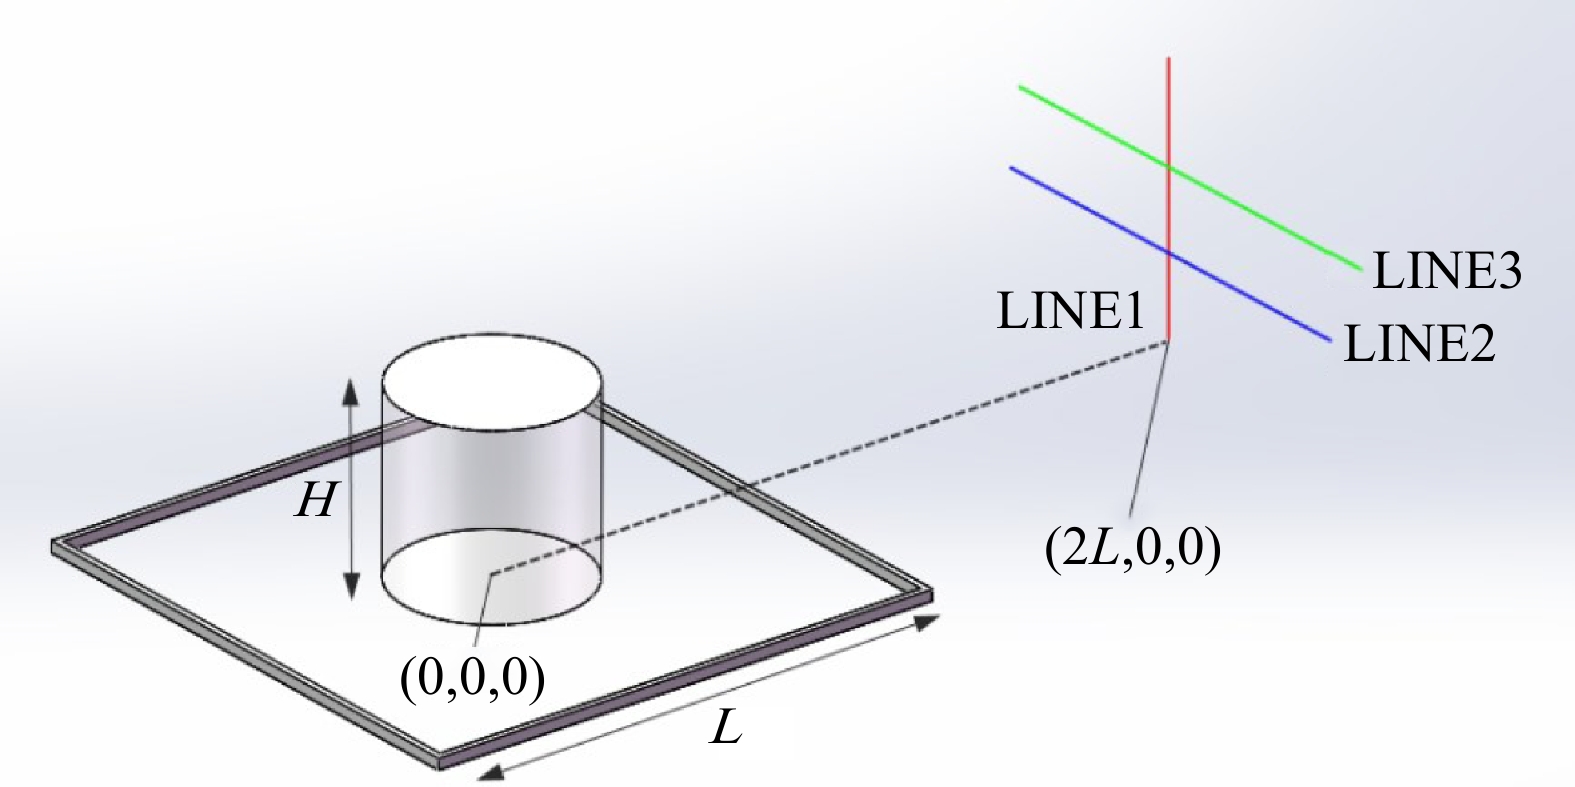
图 2 风洞实验各测点分布图
Figure 2. Distribution of the sampling points in the wind tunnel platform
-
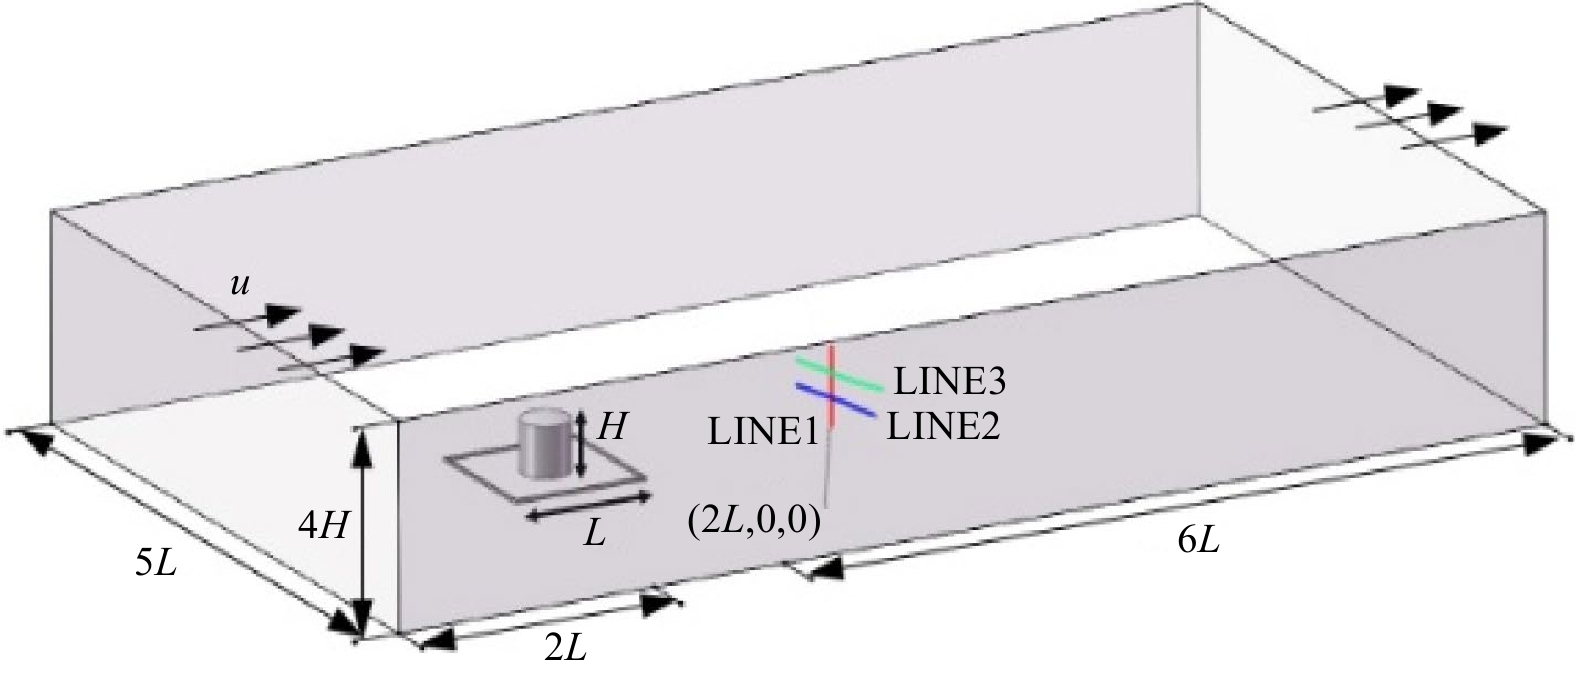
图 3 几何模型与外部计算域示意图
Figure 3. Diagram of geometric model and external computational domain
-
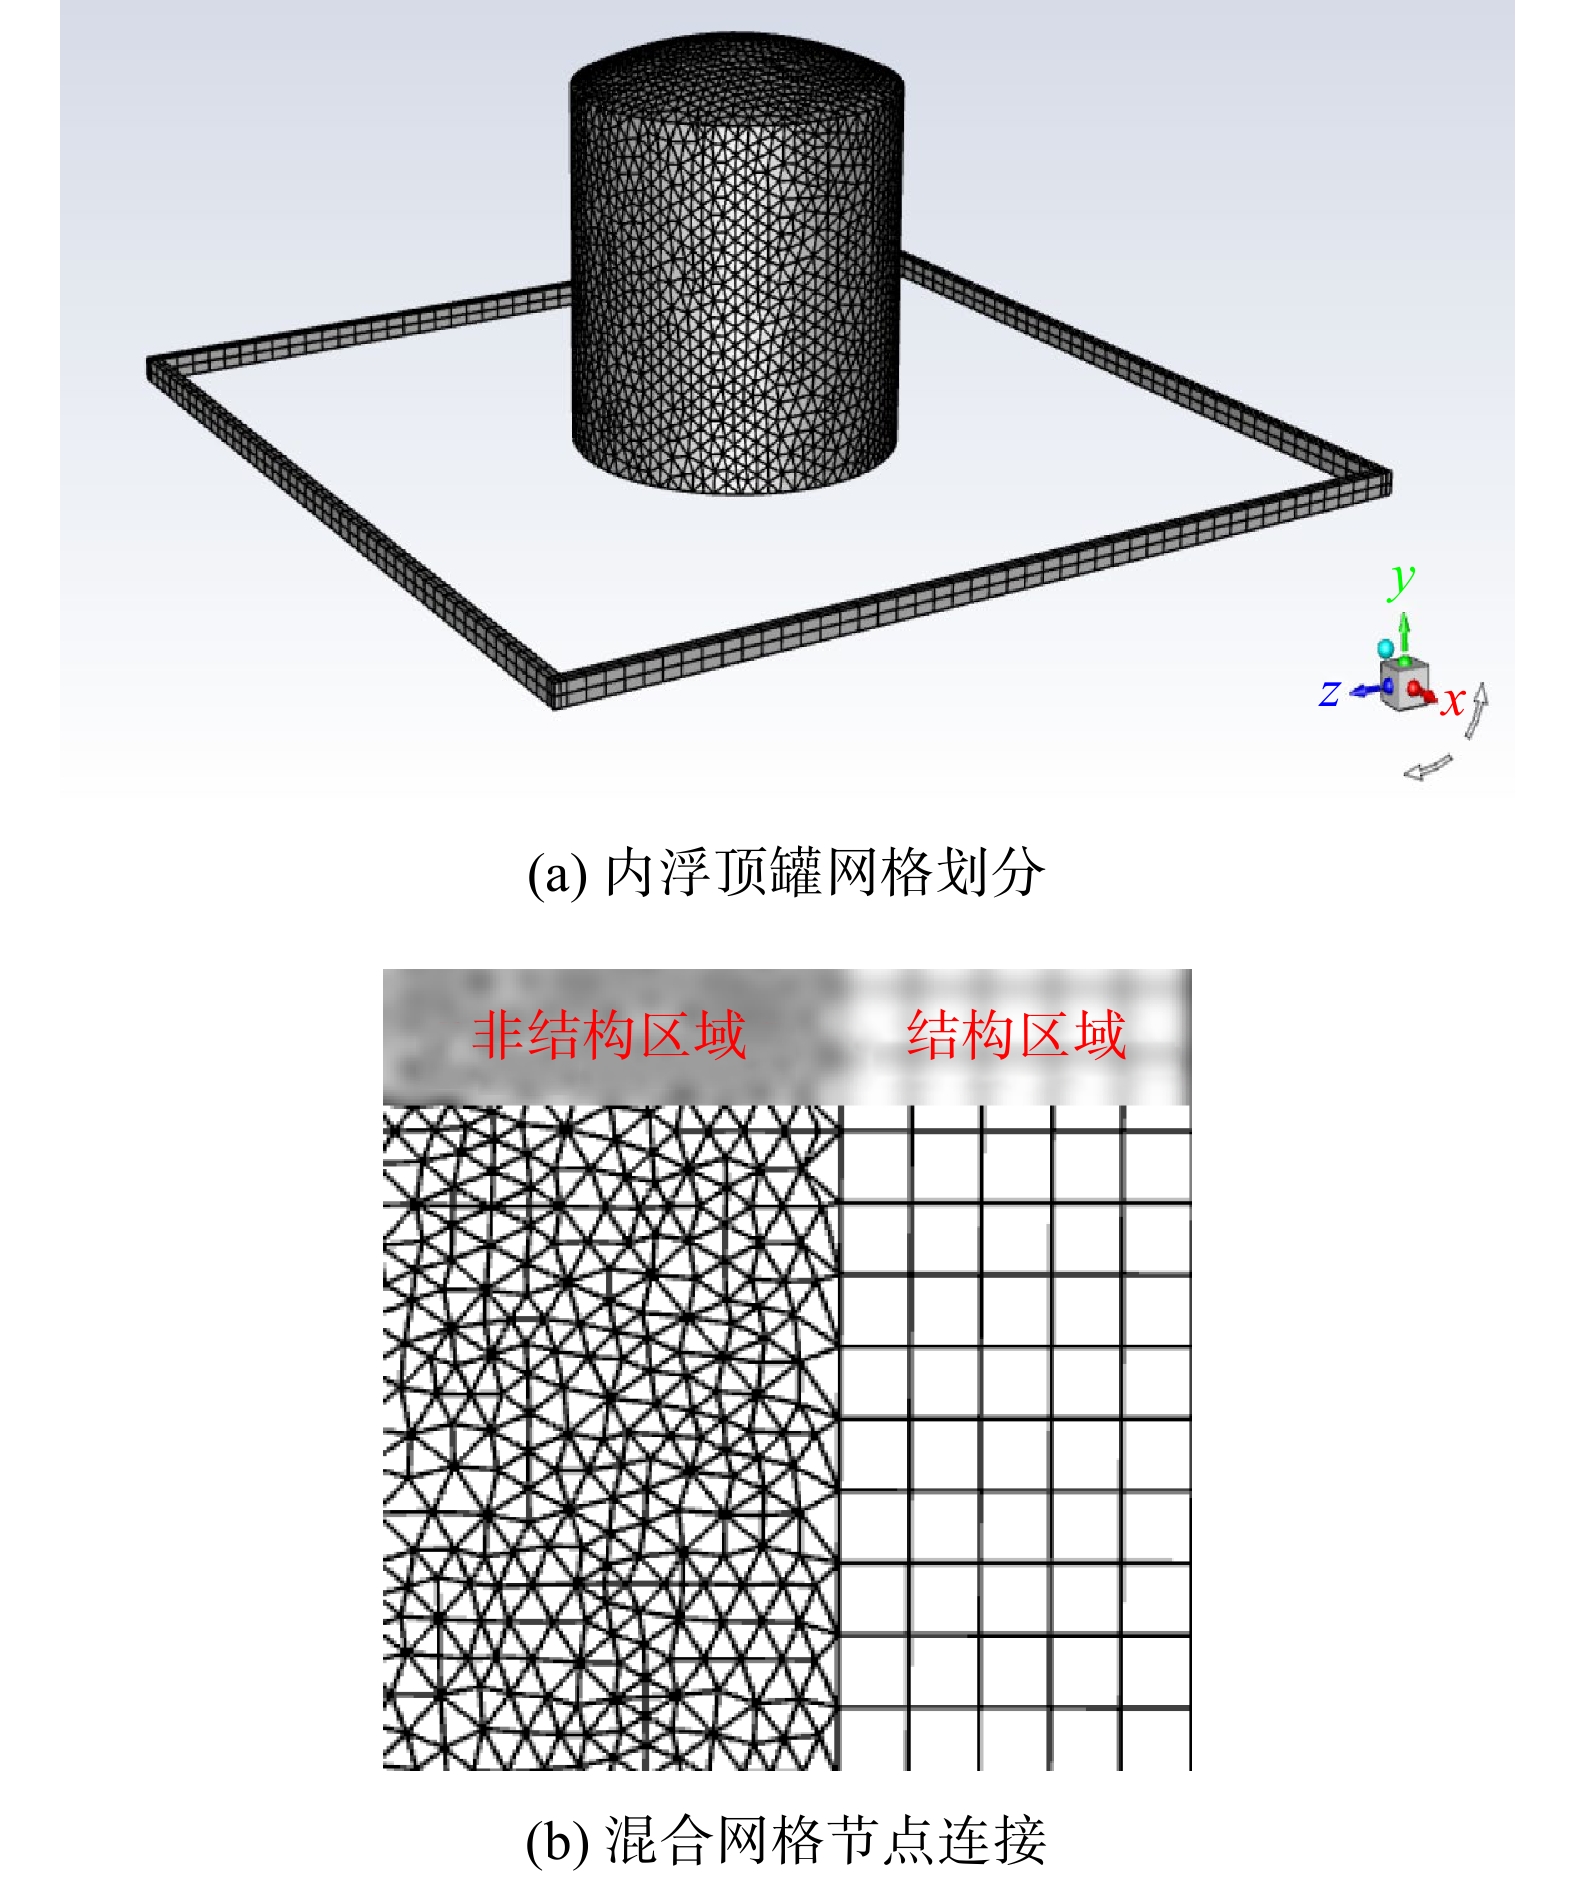
图 4 数值模型网格与混合网格节点连接图
Figure 4. Grid of numerical model and node connection of hybrid grid
-
图 5 风速2 m·s-1各测点风速数值模拟值与实验值
Figure 5. Numerical simulation and experimental value s at each sampling point s with wind speed of 2 m·s -1
-
图 6 风速4 m·s-1各测点风速数值模拟值与实验值
Figure 6. Numerical simulation and experimental value s at each sampling point with wind speed of 4 m·s -1
-
图 7 实地油库周边地形图
Figure 7. Satellite map of the field oil depot and the surrounding areas
-
图 8 罐区几何模型与外部计算域示意图
Figure 8. Geometric model of tank farm and schematic diagram of external computational domain
-
图 9 罐区建筑编号示意图
Figure 9. Building number of the tank farm
-
图 10 罐区压力分布云图(风速2 m·s-1)
Figure 10. Cloud map of the distribution of the wind pressure in the tank farm (wind speed: 2 m · s -1)
-
图 11 不同风速下大型罐区内气流流动轨迹
Figure 11. Air flow trajectory in large-scale tank farm at different wind speeds
-

图 12 不同风速下大型罐区xz截面风速云图
Figure 12. Speed distribution of xz plane of large-scale tank farm at different wind speeds
-
图 13 罐区xy截面油气质量分数分布云图
Figure 13. Cloud map of oil vapor concentration distribution in tank farm on the xy plane
-
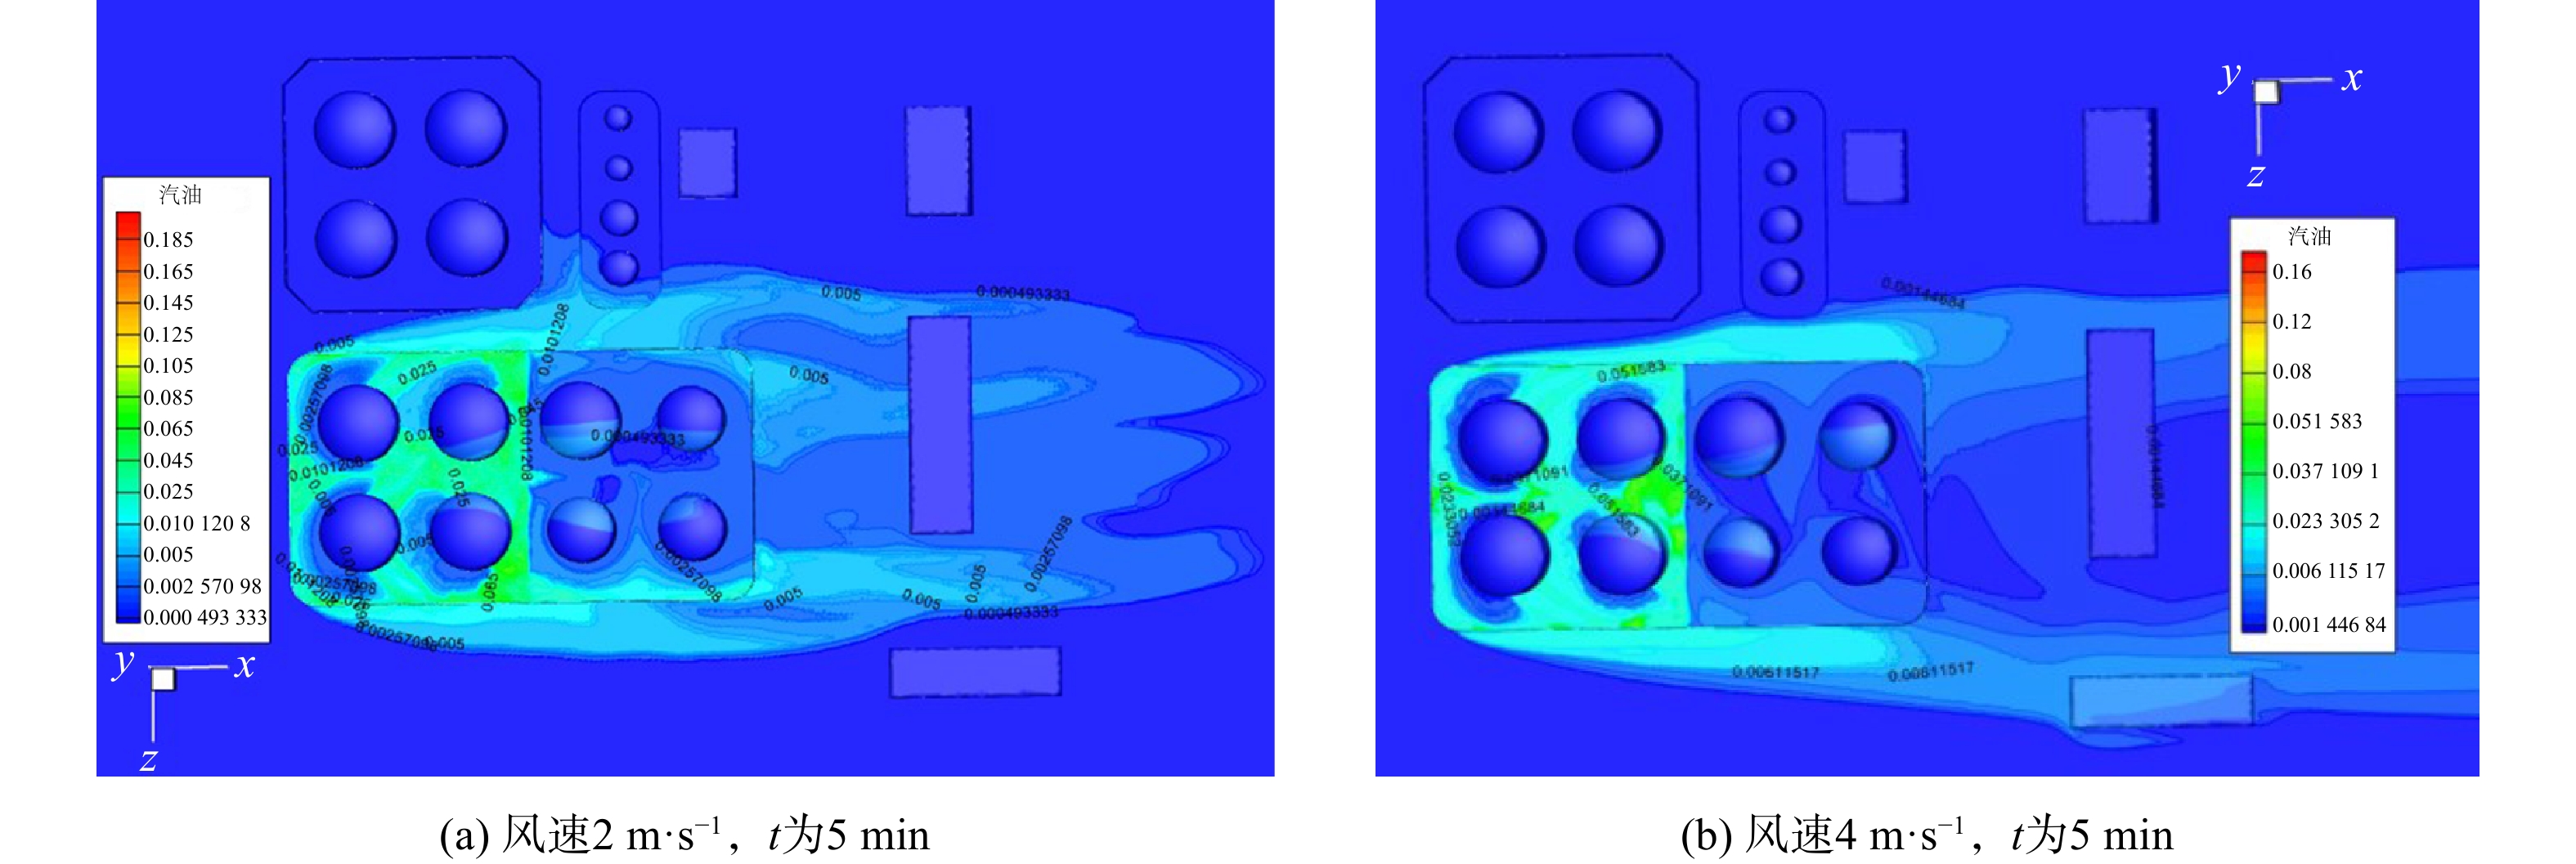
图 14 大型罐区xz截面油气质量分数分布云图
Figure 14. Cloud map of oil vapor concentration distribution in large-scale tank farm on the xz plane
-
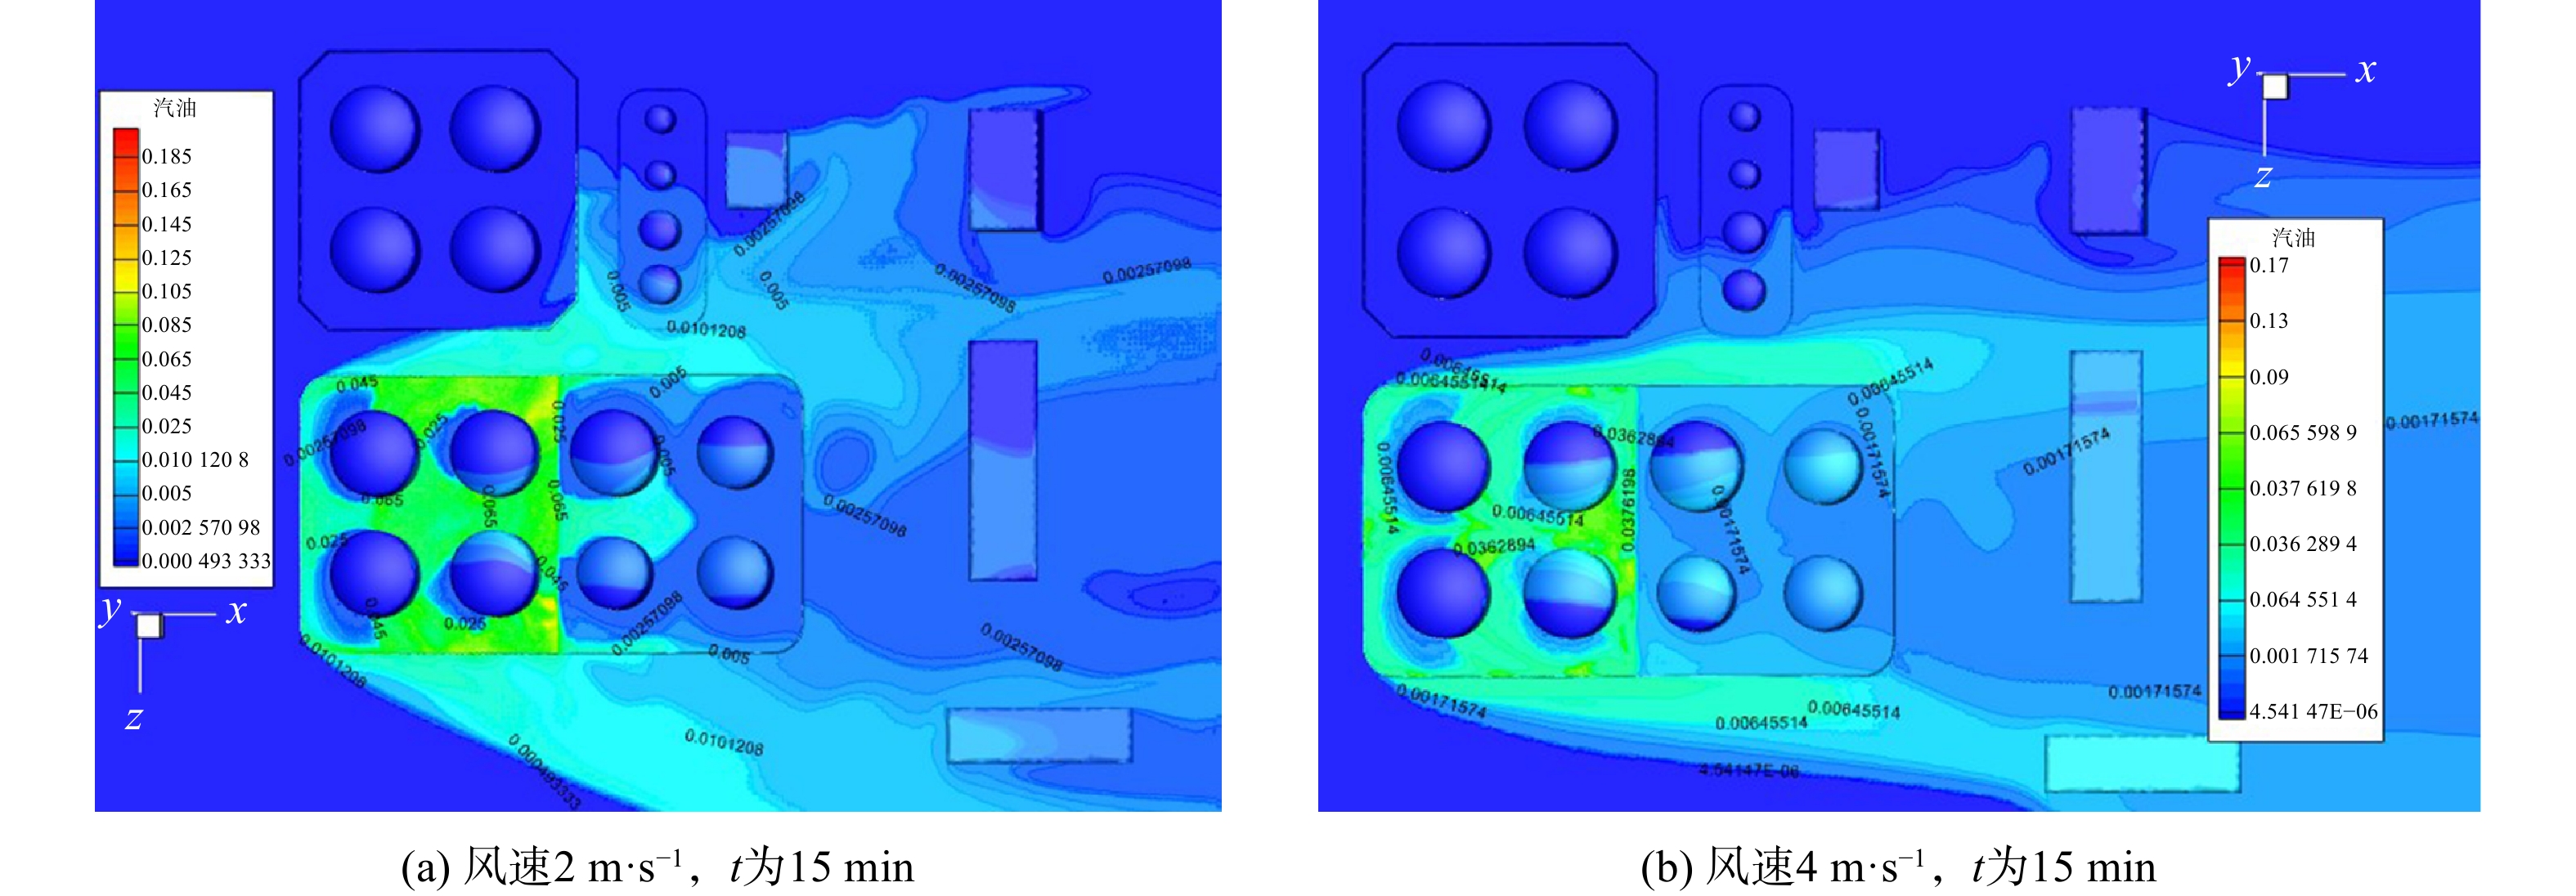
图 15 不同风速下大型罐区xz截面油气质量分数分布云图
Figure 15. Cloud map of oil vapor concentration distribution in large-scale tank farm on the xz plane
Figure
15 ,Table
0 个