-
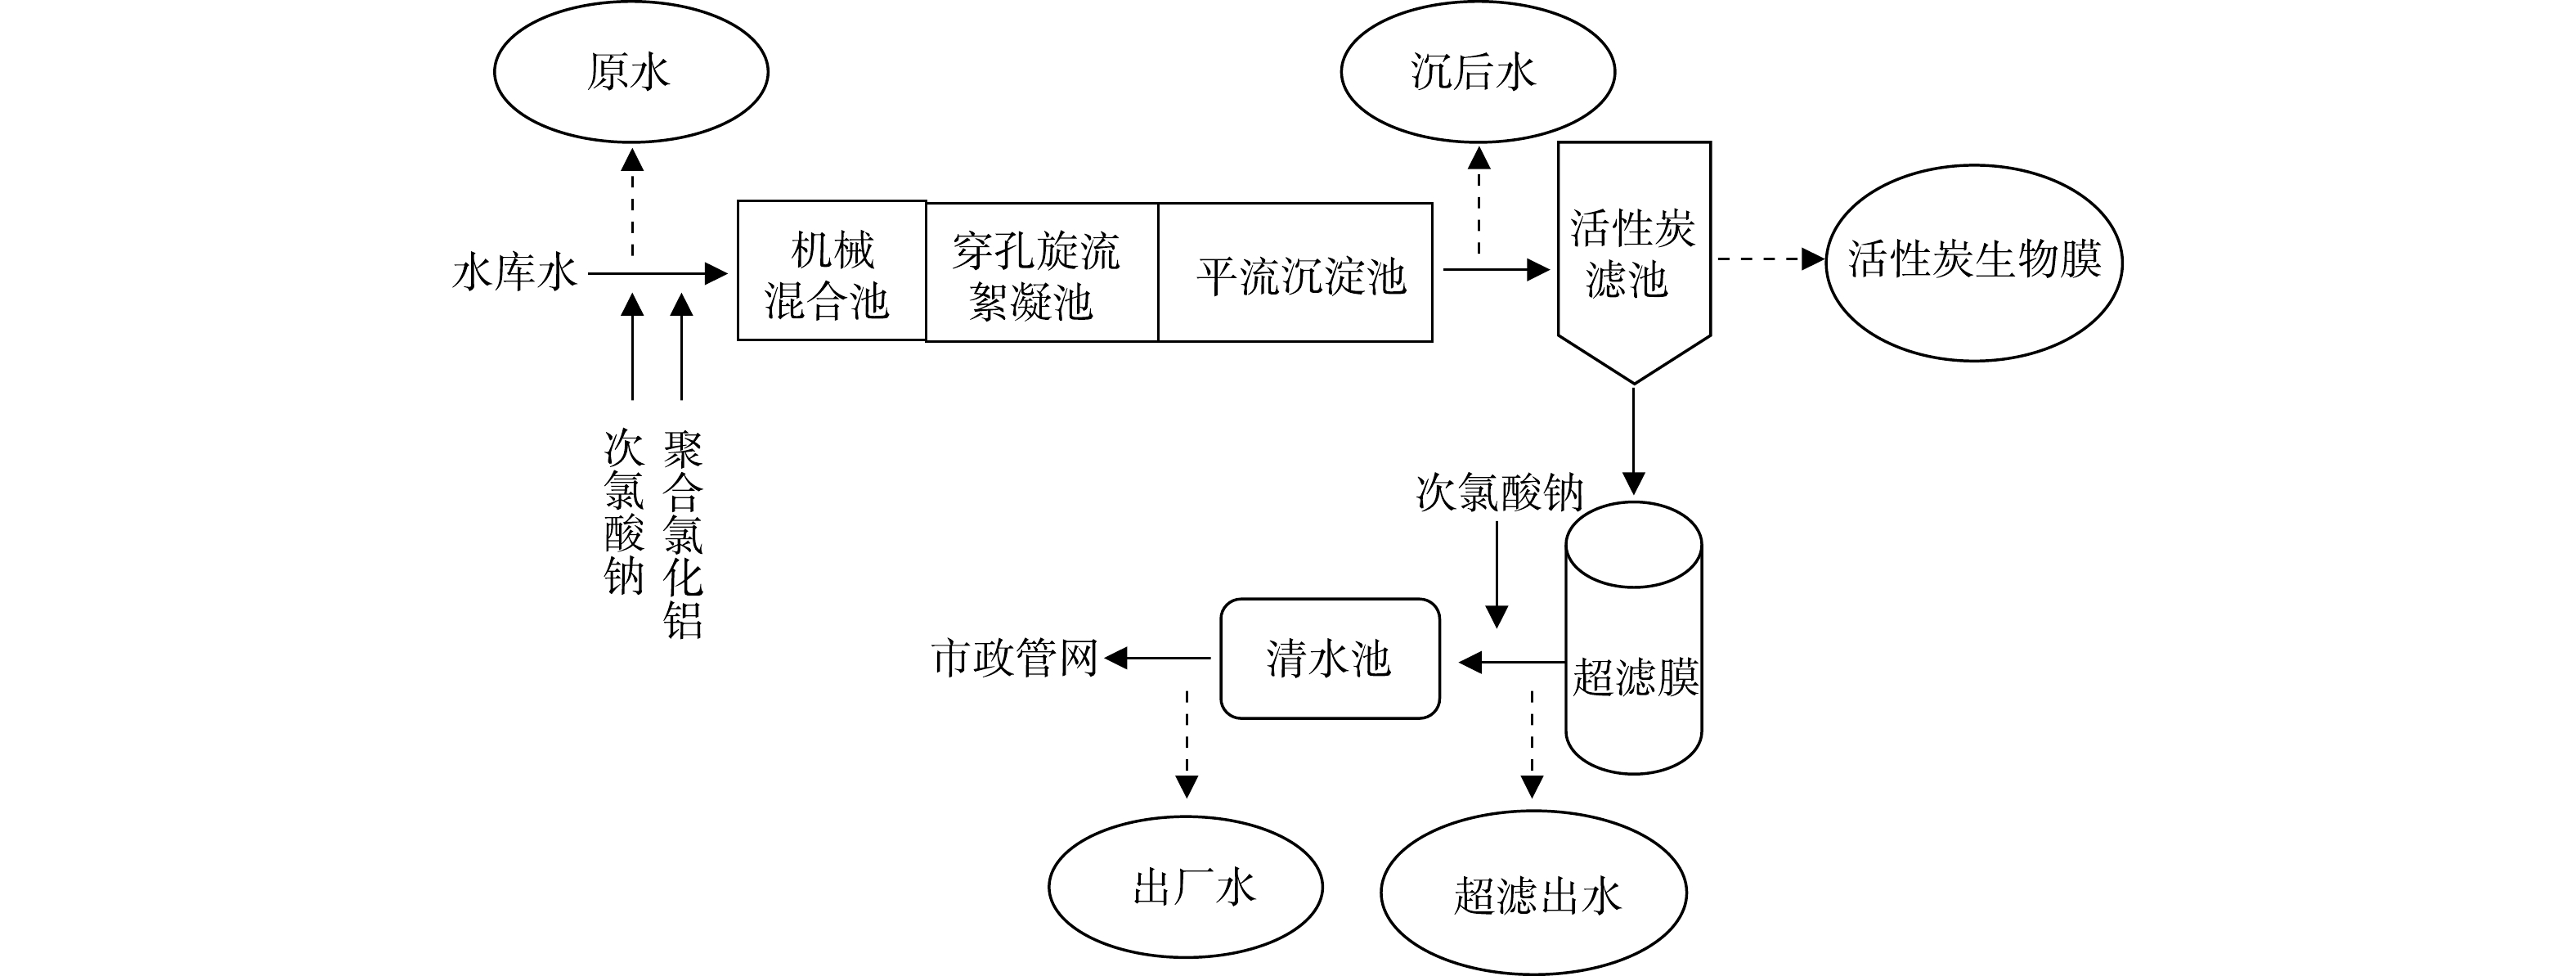
图 1 GAC-UF深度处理工艺流程图
Figure 1. Schematic diagram of GAC-UF advanced treatment process
-

图 2 各样品在门水平上细菌群落组成
Figure 2. Bacterial community composition of each sample at phylum level
-
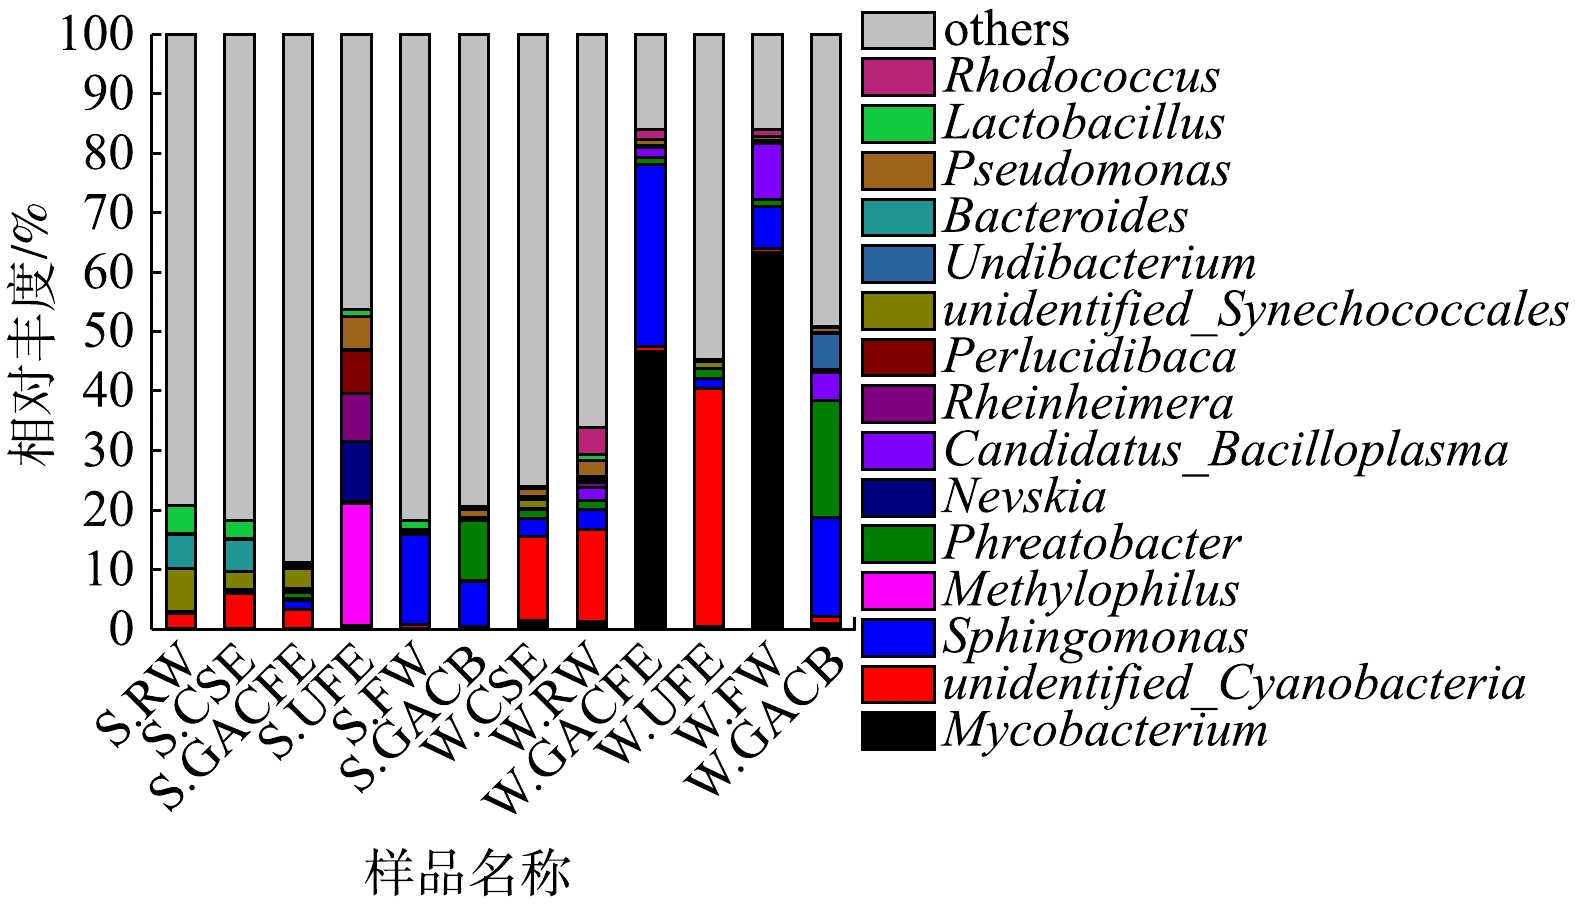
图 3 各样品在属水平细菌群落组成
Figure 3. Bacterial community composition of each sample at genus level
-
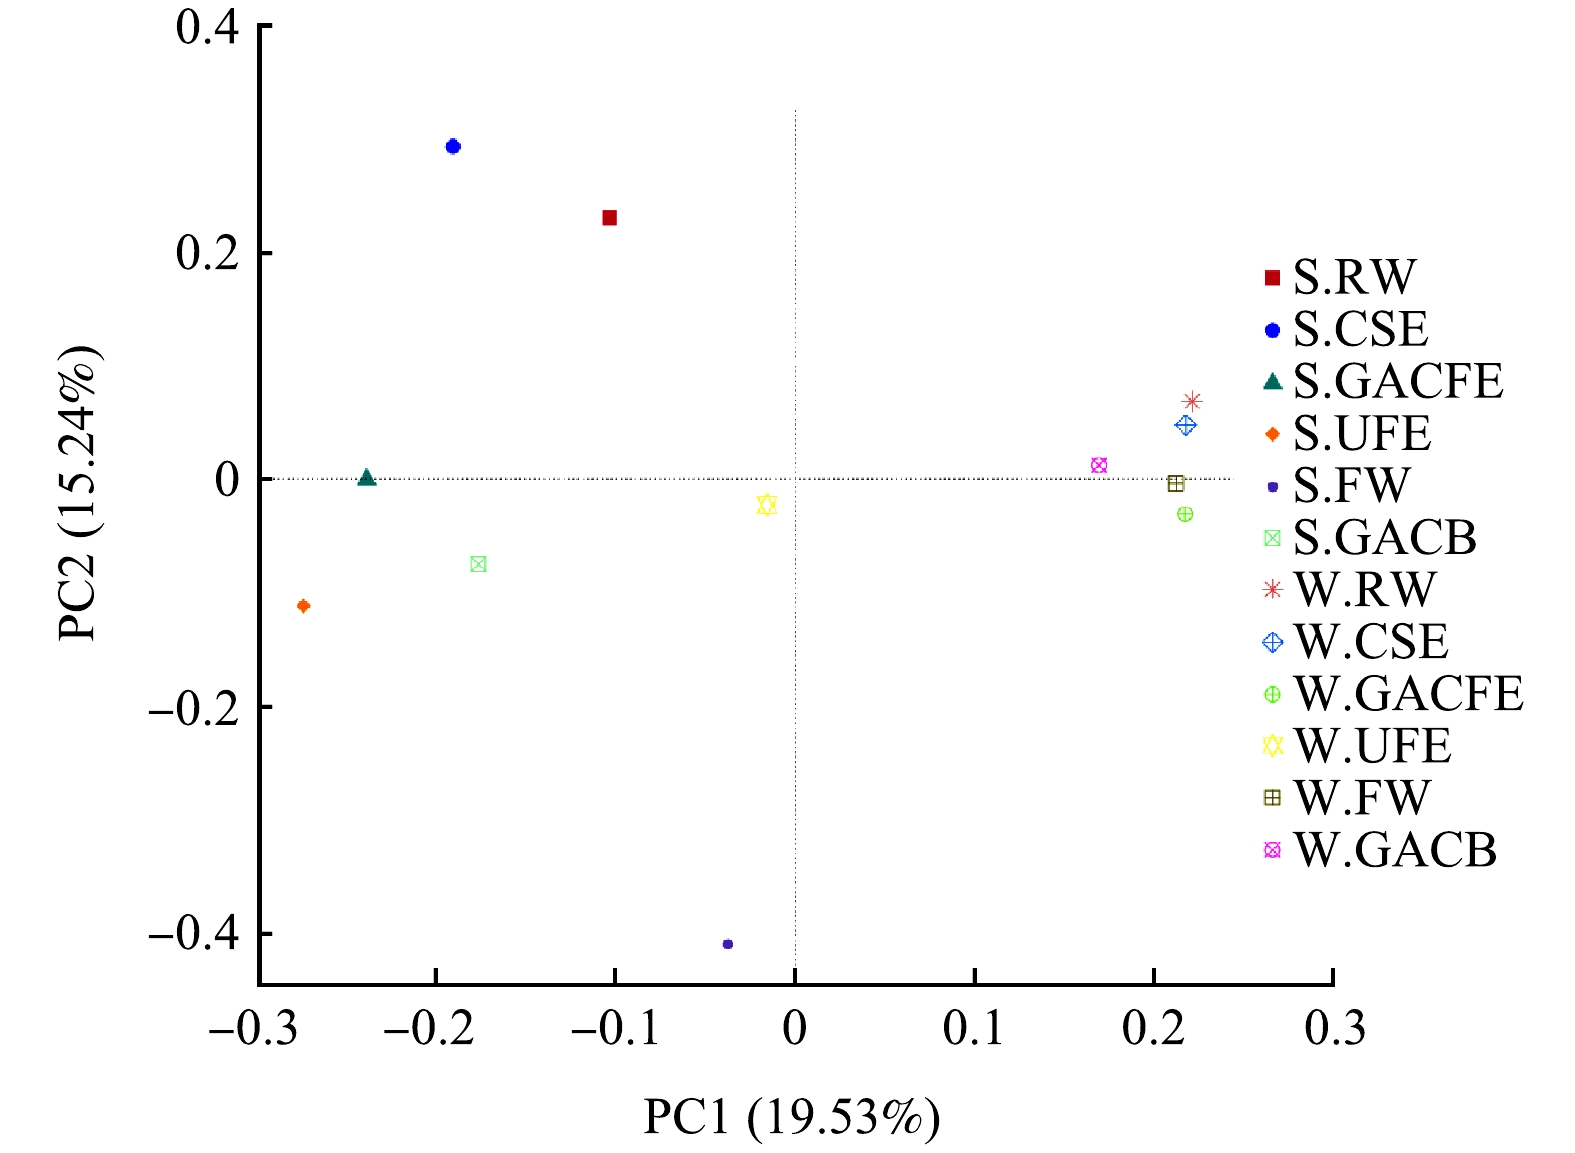
图 4 细菌群落变化主成分分析
Figure 4. Principal component analysis of bacterial community change
-
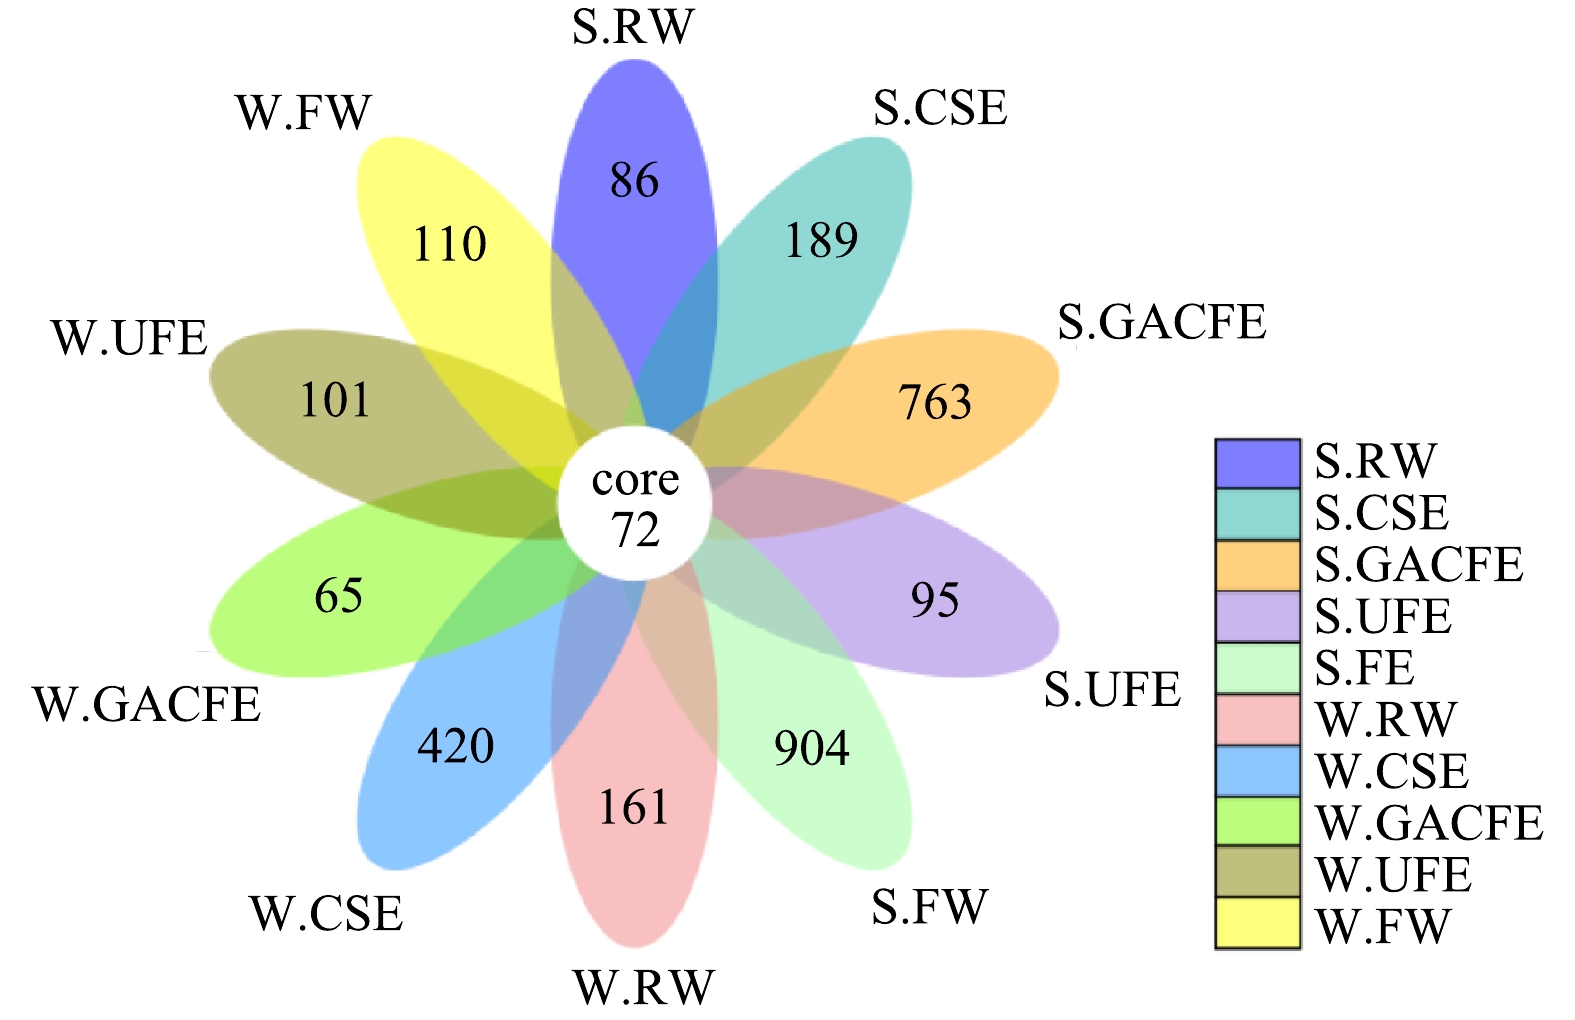
图 5 水样间基于OTUs的花瓣图
Figure 5. Flower diagram based on OTUs among water samples
Figure
5 ,Table
2 个