-
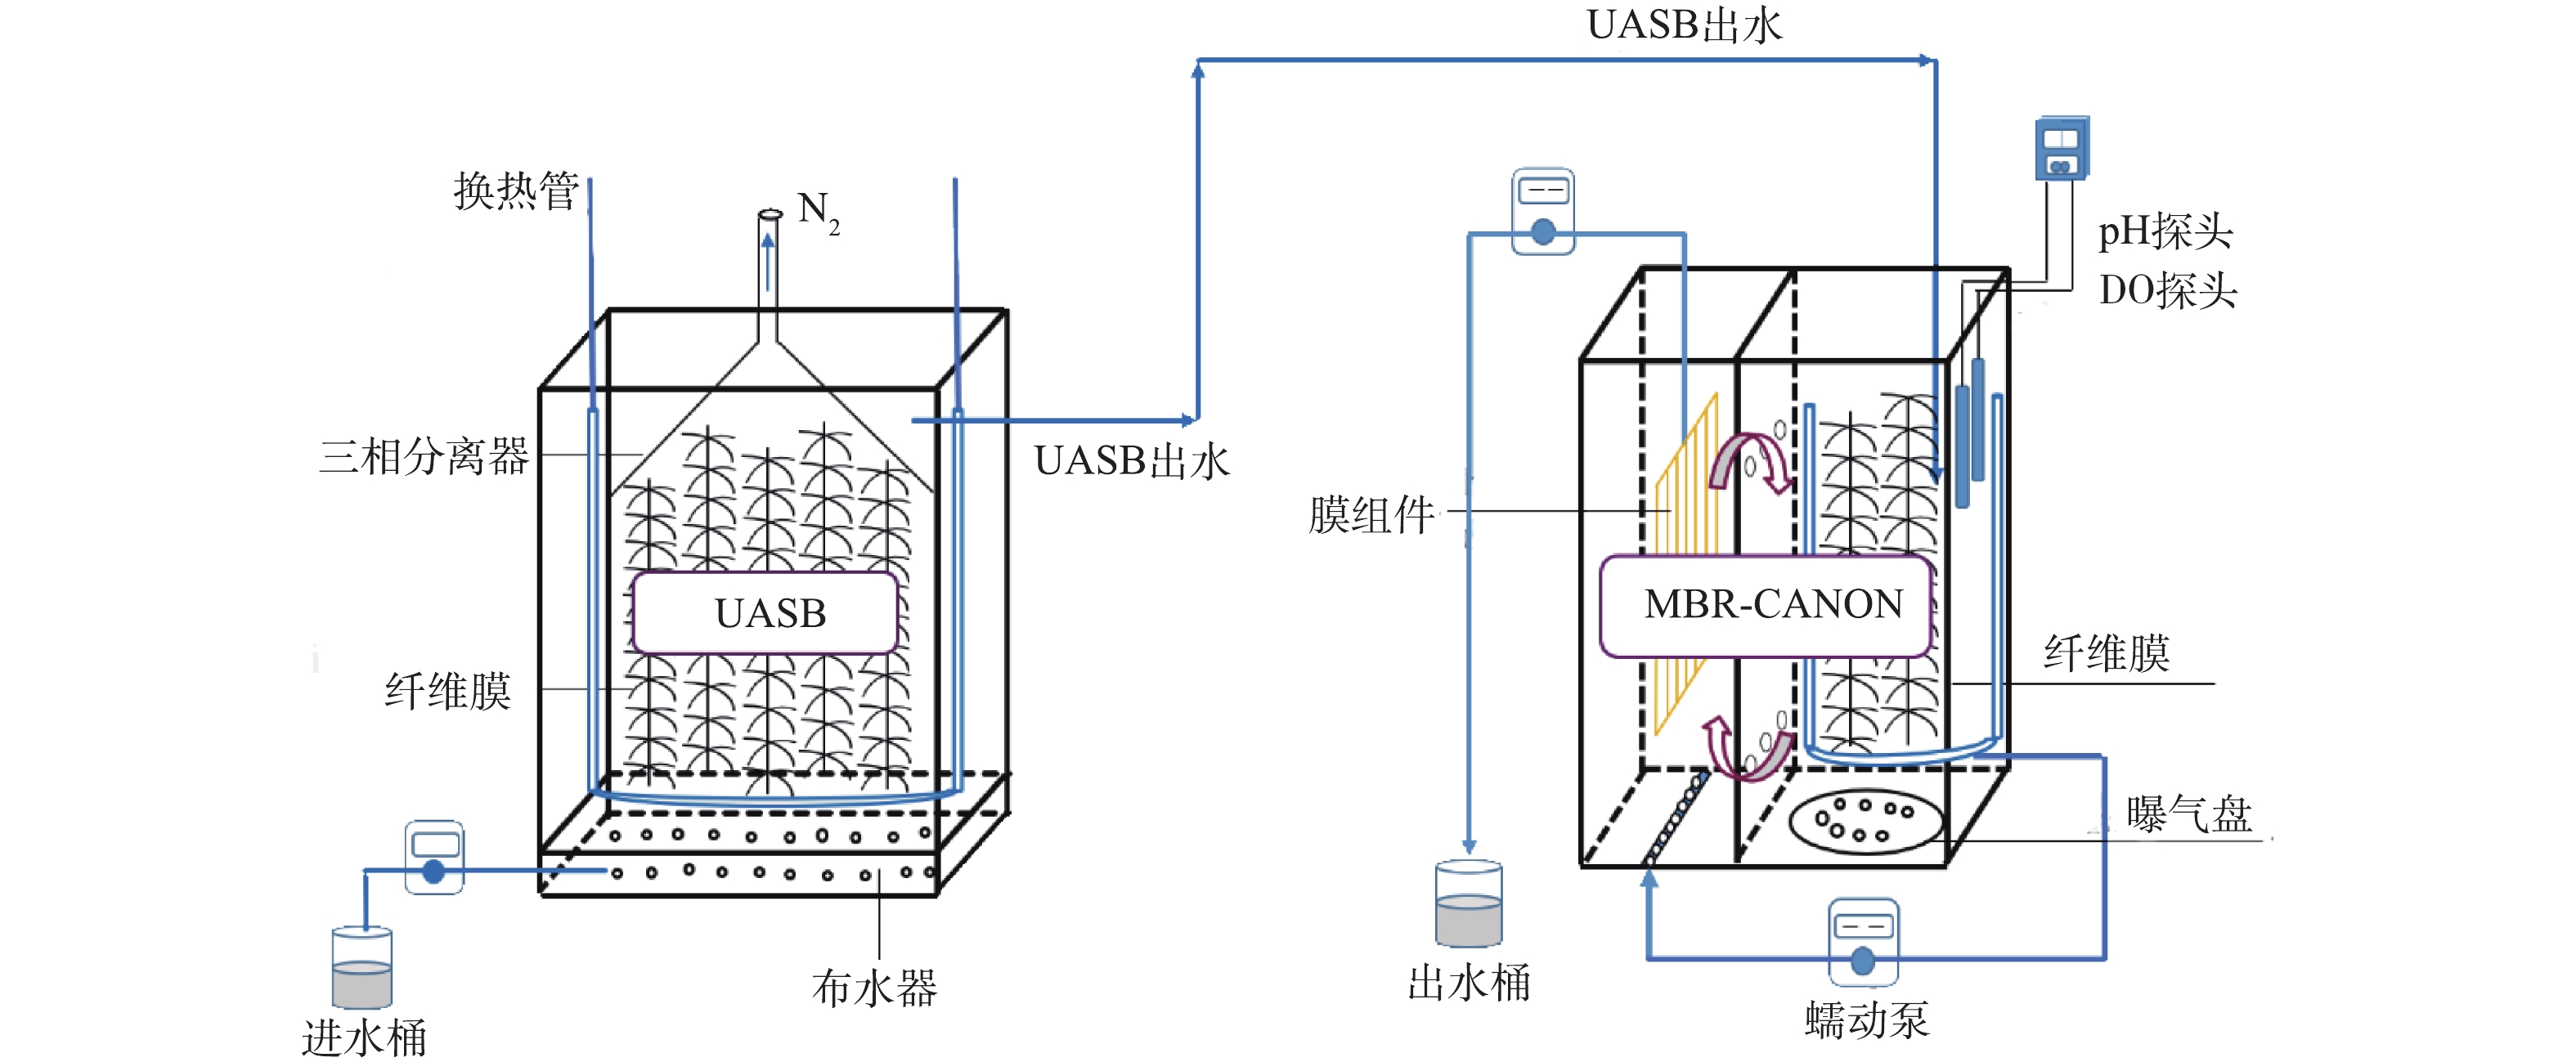
图 1 UASB/MBR-CANON反应器示意图
Figure 1. Schematic diagram of UASB/MBR-CANON reactor
-
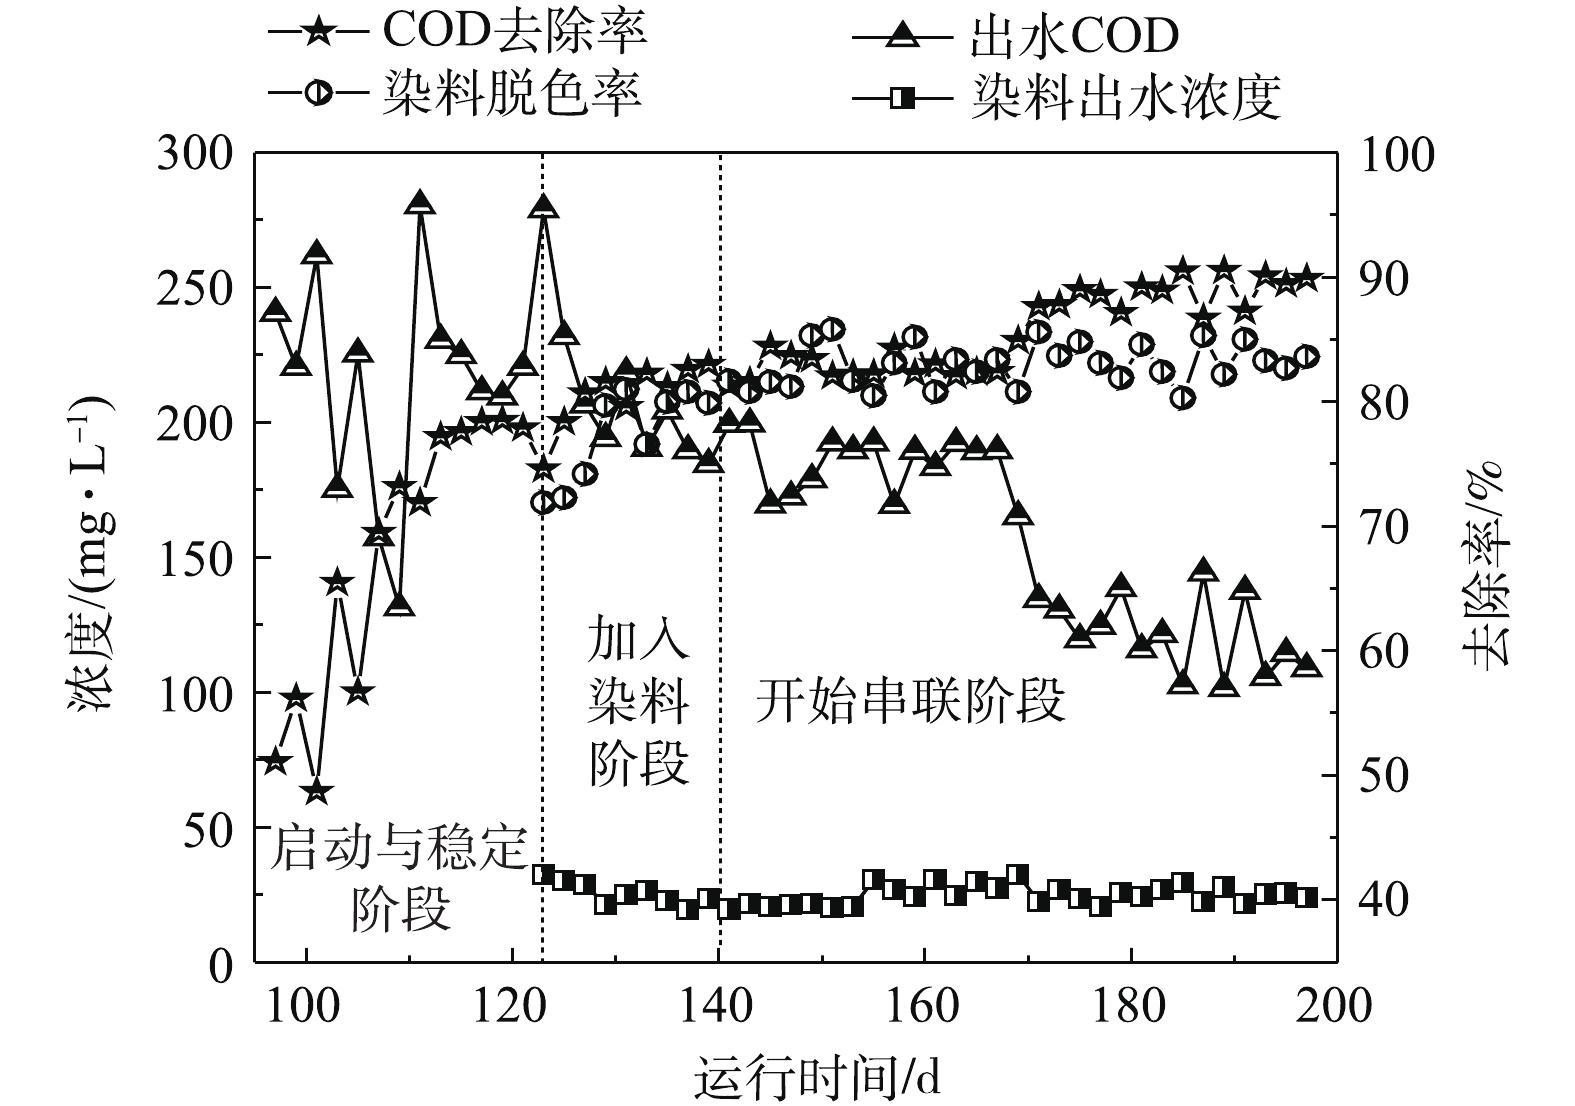
图 2 UASB反应器处理活性印花废水运行中出水COD浓度、去除率及染料浓度、脱色率变化
Figure 2. Variations of COD concentration and its removal efficiency, dye concentration, decolorization efficiency in the effluent of UASB during treating reactive printing wastewater
-
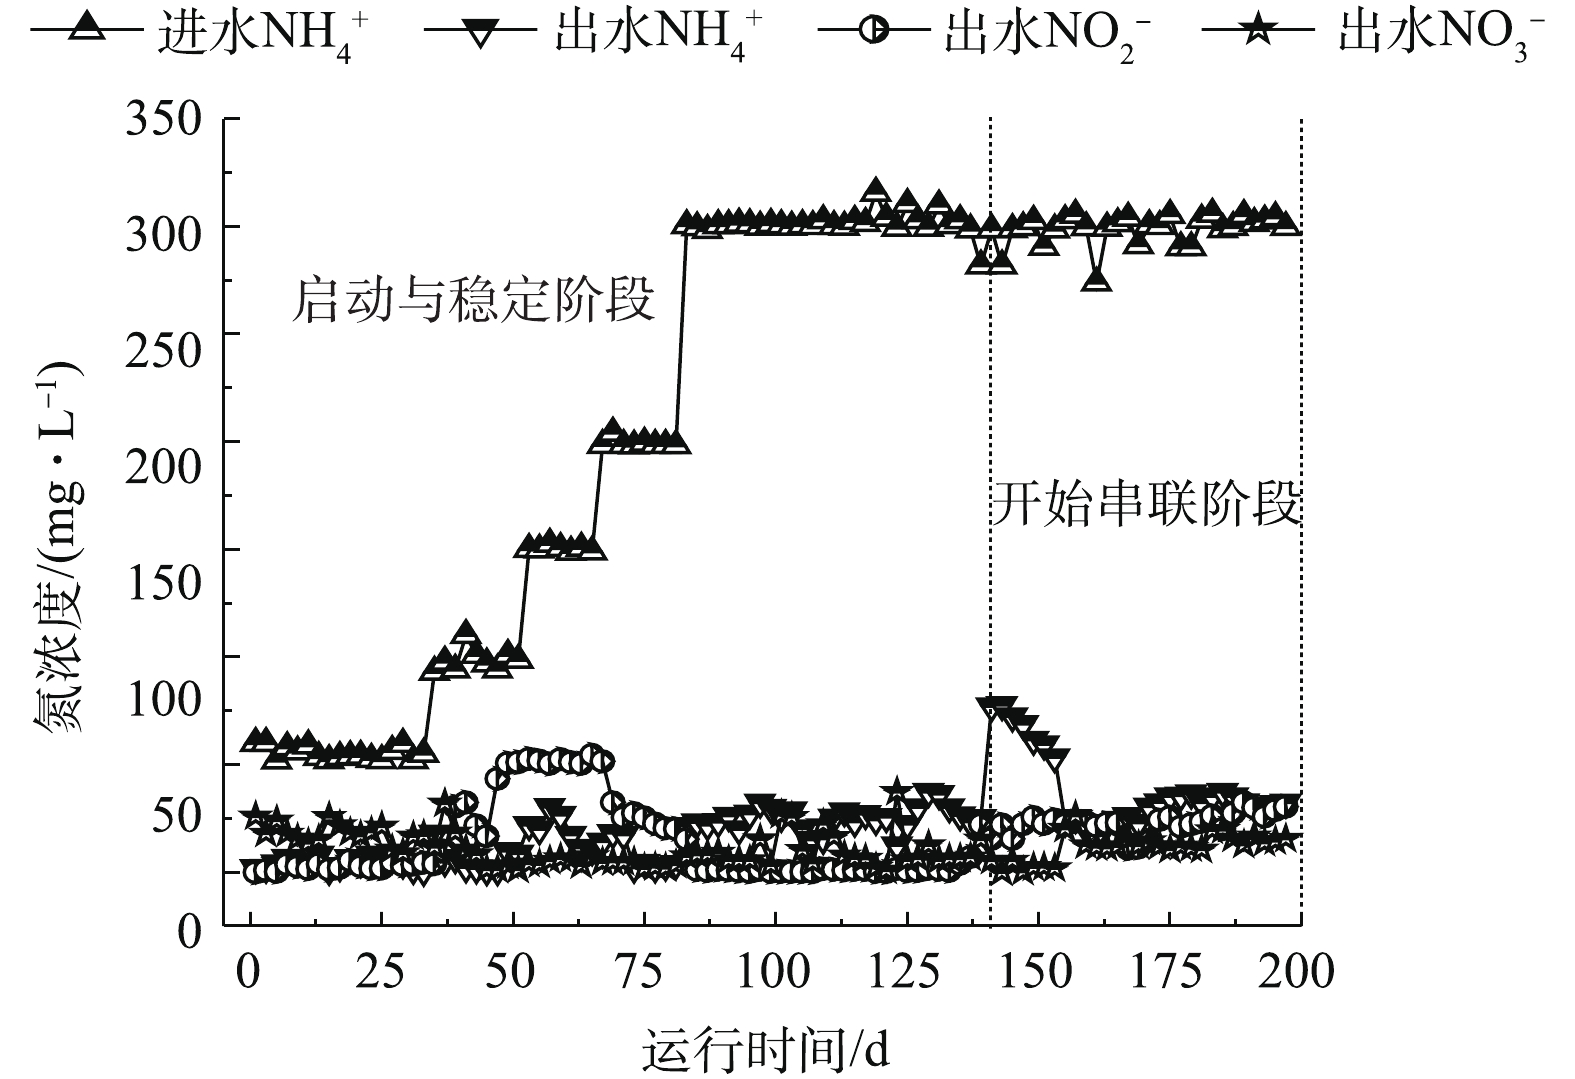
图 3 MBR-CANON反应器中进出水
NH+4 、NO−2 和NO−3 浓度的变化Figure 3. Variations of
NH+4 ,NO−2 andNO−3 concentrations in the influent and effluent of the MBR-CANON reactor -
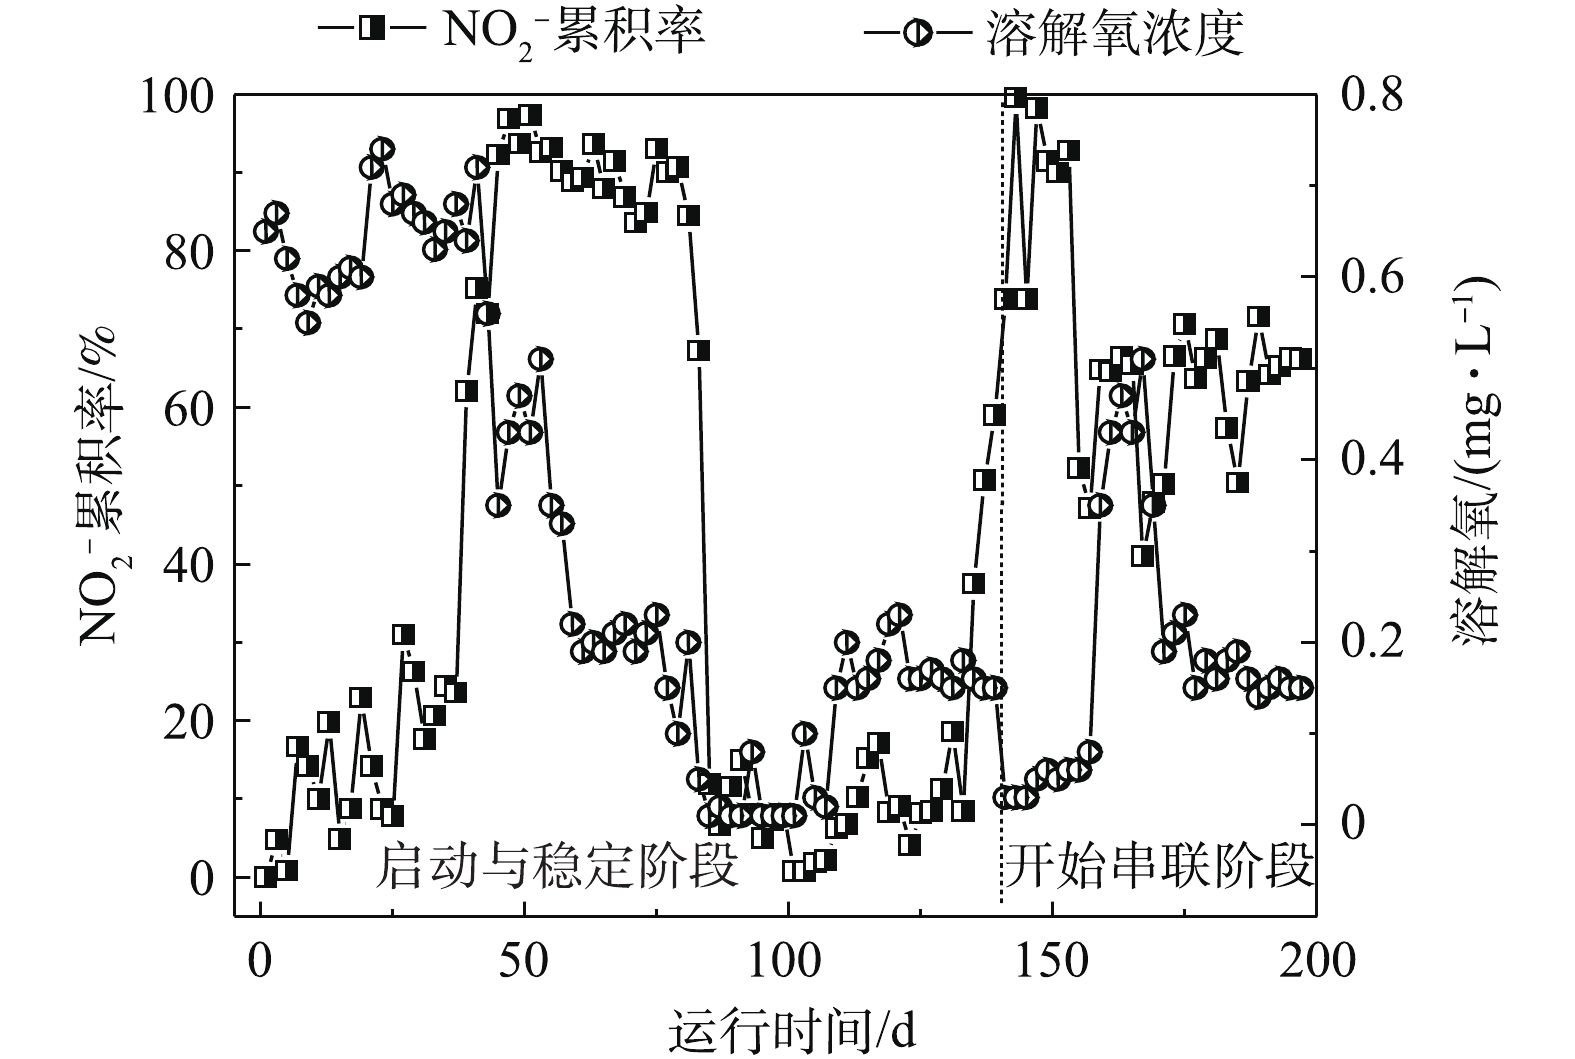
图 4 MBR-CANON反应器中
NO−2 的积累率(NAR)和溶解氧(DO)的变化Figure 4. Variations of
NO−2 accumulation efficiency and dissolved oxygen in the MBR-CANON reactor -
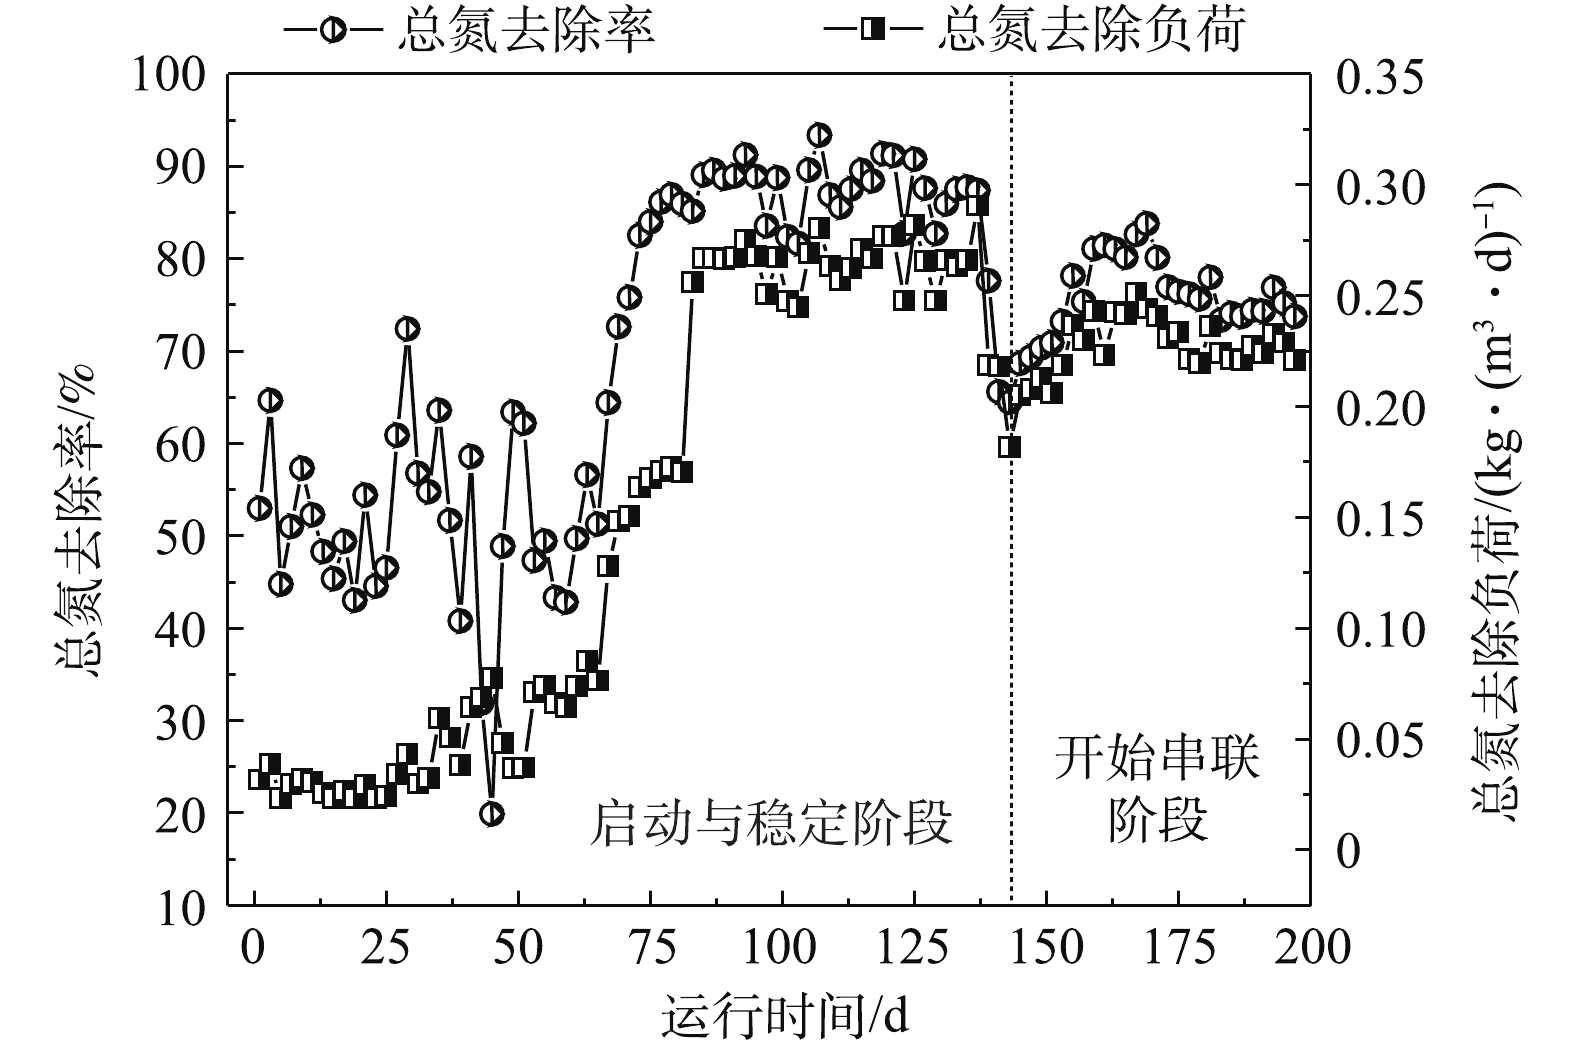
图 5 MBR-CANON反应器中总氮去除率(TNR)及总氮去除负荷(NRL)的变化
Figure 5. Variations of total nitrogen removal efficiency(TNR) and removal load(NRL) by the MBR-CANON reactor
-
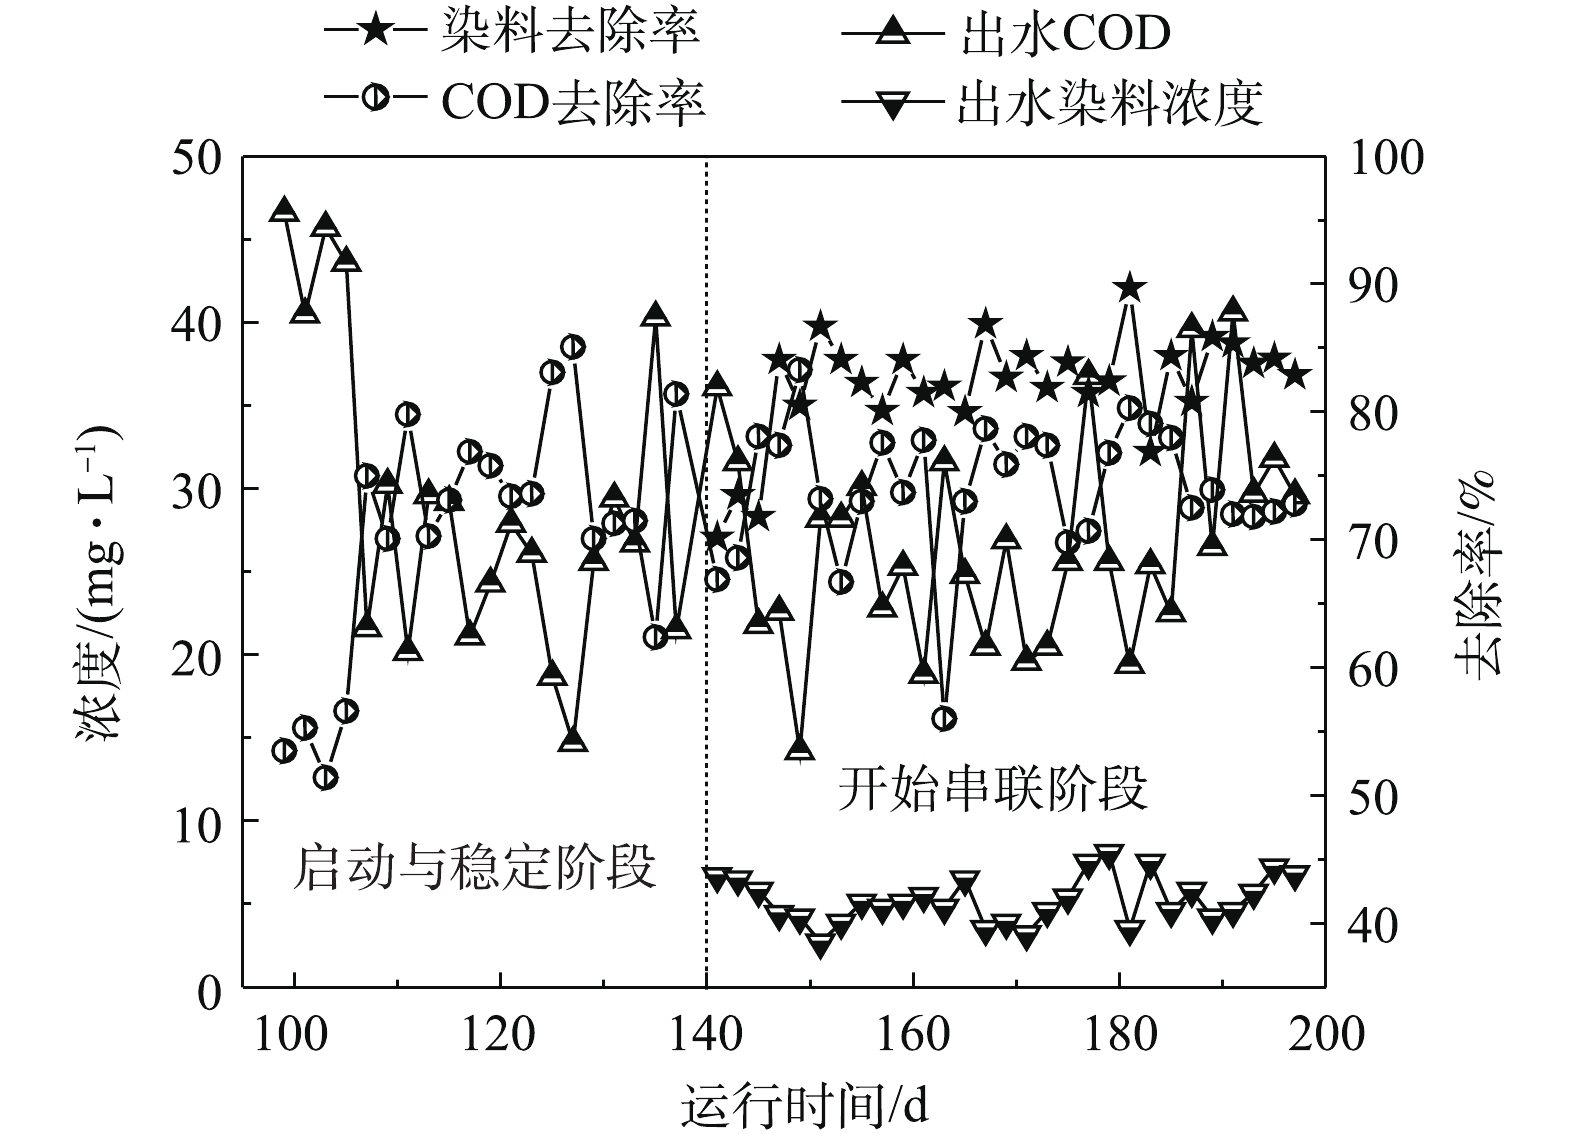
图 6 MBR-CANON反应器出水COD、去除率及染料浓度、去除率的变化
Figure 6. Variations of COD concentration and its removal efficiency, dye concentration and decolorization efficiency in the effluent of the MBR-CANON reactor
-
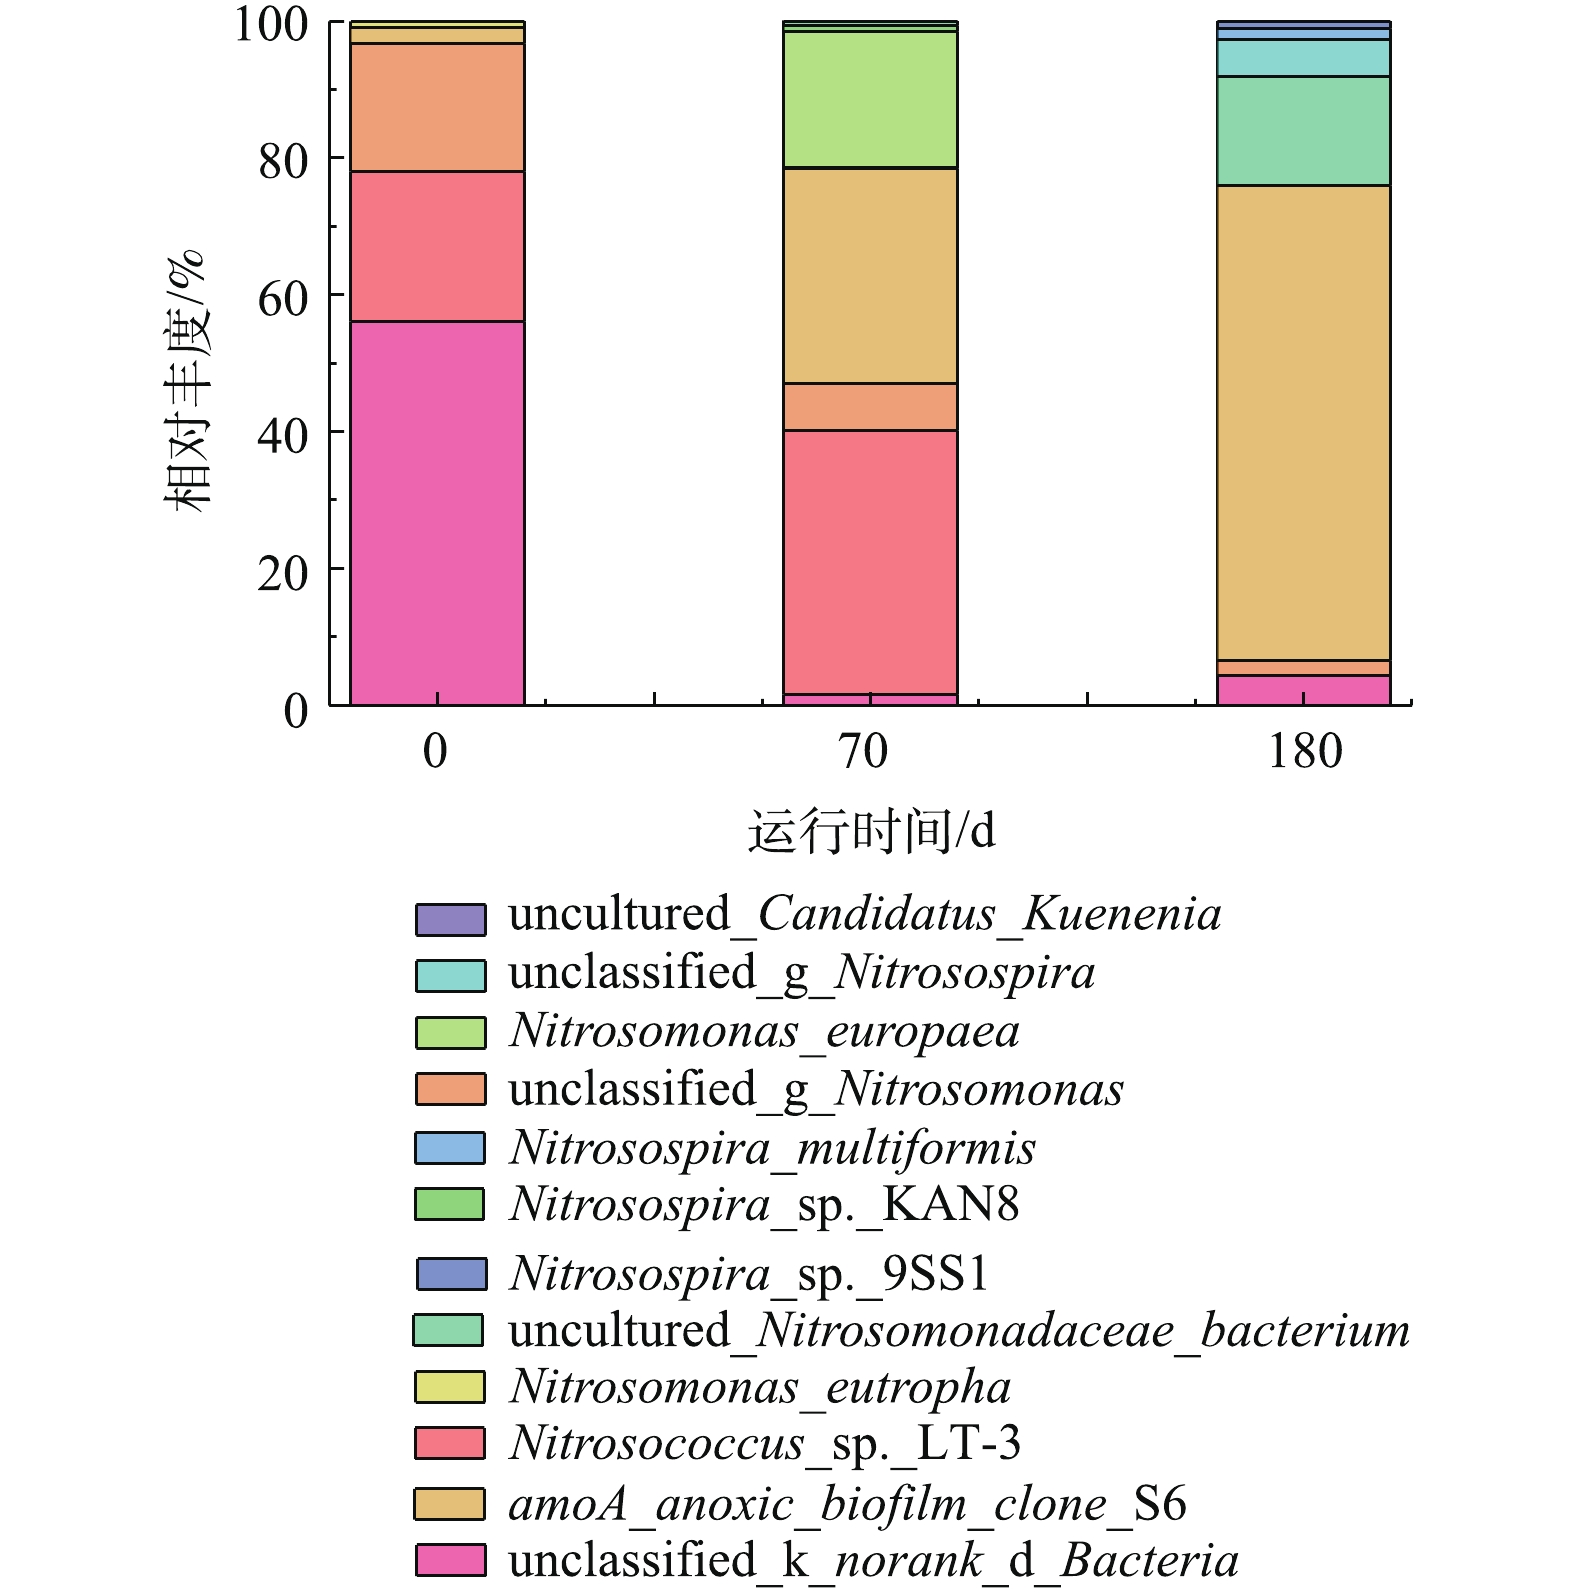
图 7 MBR-CANON反应器中功能菌丰度分布(种水平)
Figure 7. Distribution of functional bacteria abundance in the MBR-CANON reactor(species level)
-

图 8 UASB/MBR-CANON工艺处理印花废水时紫外-可见谱图
Figure 8. UV-vis spectra of wastewater samples during UASB/MBR-CANON process treating printing wastewater
-

图 9 膜通量衰减及膜表面滤饼层EPS中多糖和蛋白质含量变化
Figure 9. Membrane fluxes attenuation and variation of polysaccharide and protein content in EPS of cake layer sludge on membrane surface
Figure
9 ,Table
2 个