-
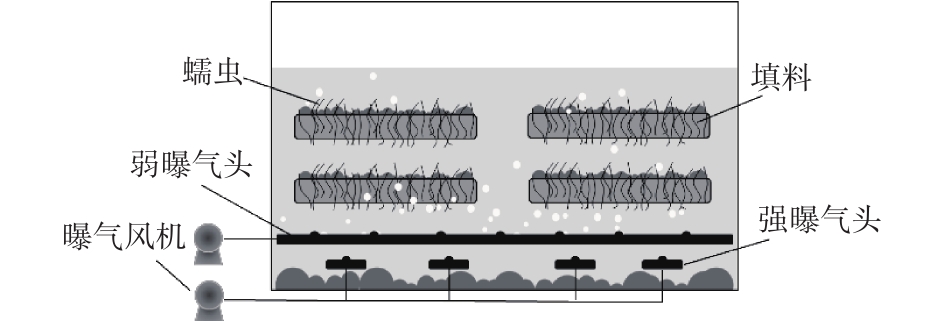
图 1 蠕虫床结构示意图
Figure 1. Schematic diagram of the worm reactor
-
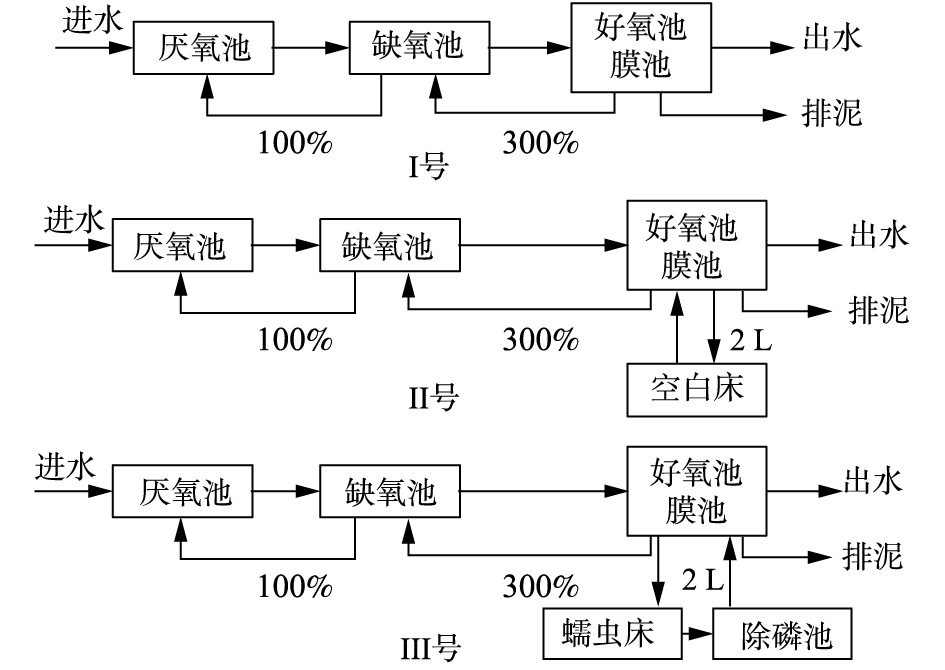
图 2 系统流程图
Figure 2. Diagram of system connection
-
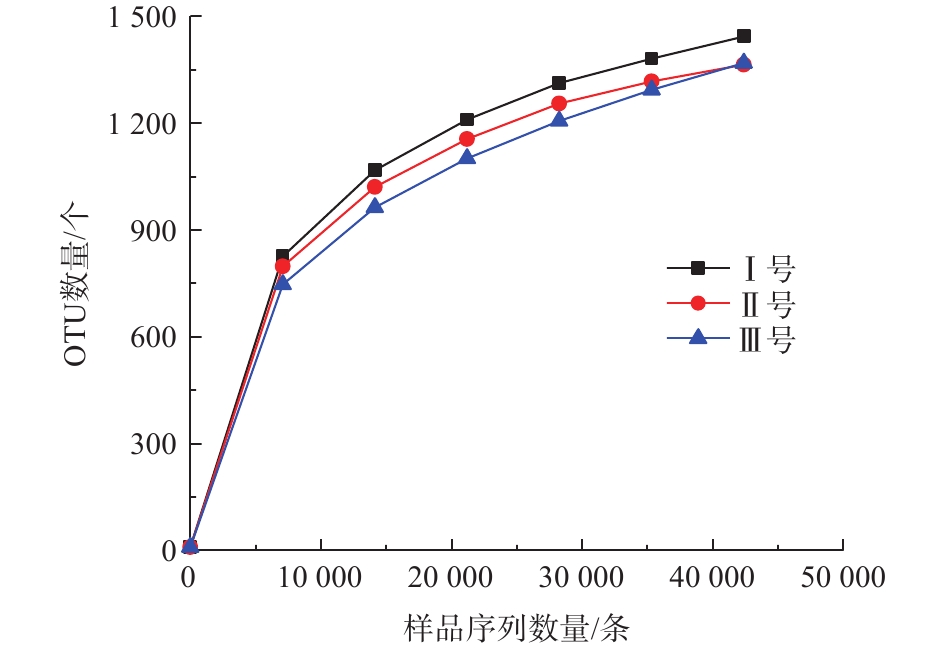
图 3 样品稀释曲线
Figure 3. Rarefaction curves of the samples
-
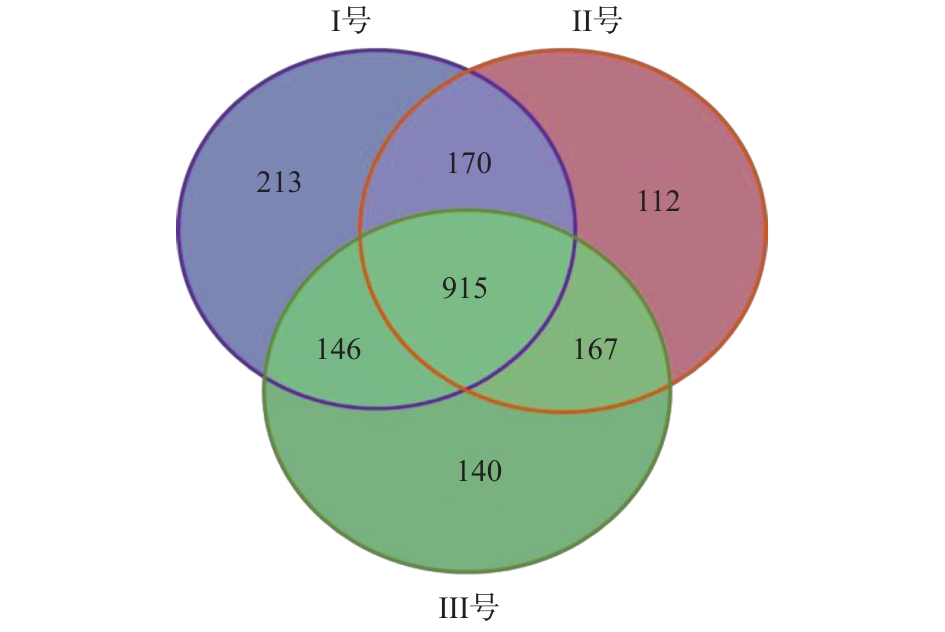
图 4 样品OTU分布维恩图
Figure 4. Venn diagram of OTU distribution
-
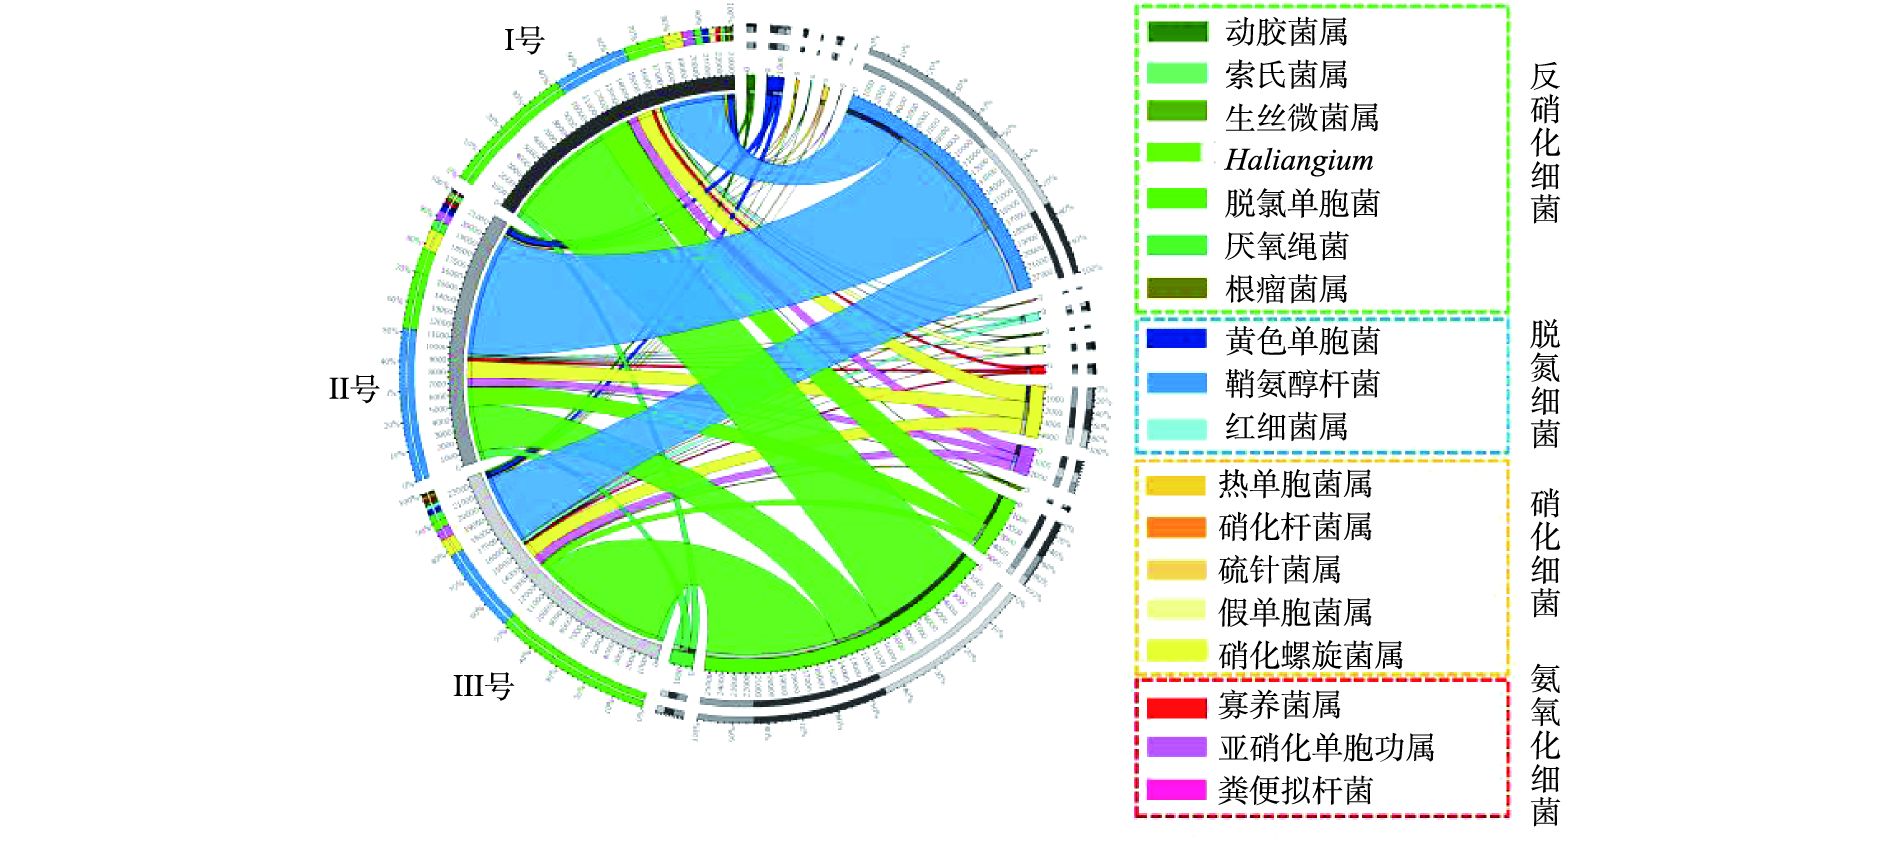
图 5 3组系统脱氮功能菌的分布
Figure 5. Distribution of denitrifying functional bacteria in the three systems
-
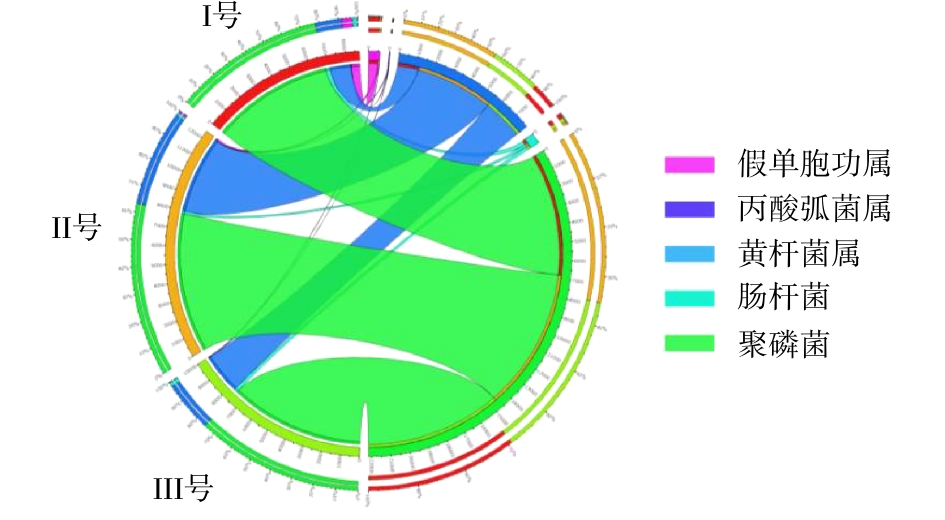
图 6 3组系统好氧除磷菌的分布
Figure 6. Distribution of PAOs in the three systems
-
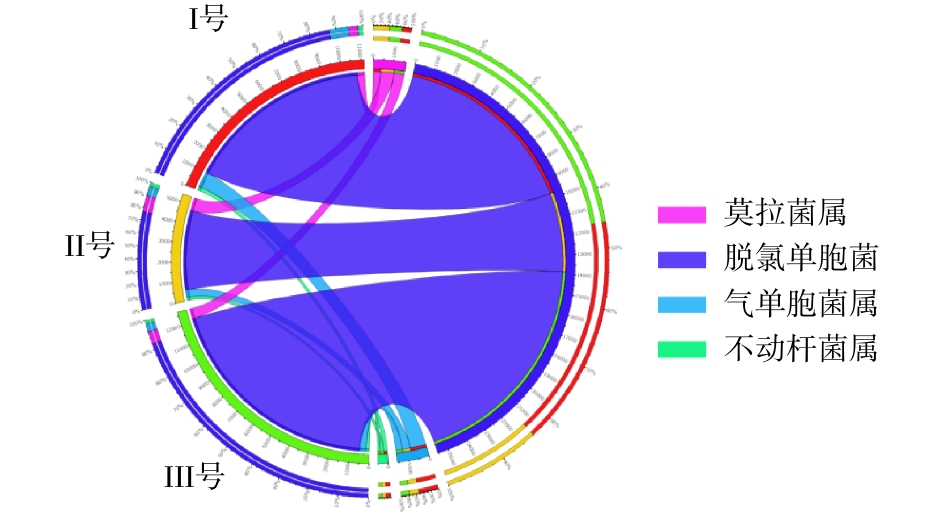
图 7 3组系统反硝化除磷菌的分布
Figure 7. Distribution of DNPAOs in the three systems
Figure
7 ,Table
2 个