基于新型被动采样校正技术的塑化剂大气垂直浓度梯度研究

李志远, 王琰, 李俊杰. 基于新型被动采样校正技术的塑化剂大气垂直浓度梯度研究[J]. 环境化学, 2023, 42(5): 1439-1448. doi: 10.7524/j.issn.0254-6108.2021121403
引用本文: 李志远, 王琰, 李俊杰. 基于新型被动采样校正技术的塑化剂大气垂直浓度梯度研究[J]. 环境化学, 2023, 42(5): 1439-1448. doi: 10.7524/j.issn.0254-6108.2021121403
LI Zhiyuan, WANG Yan, LI Junjie. Atmospheric vertical distribution of plasticizers based on a new passive air sampling calibration method[J]. Environmental Chemistry, 2023, 42(5): 1439-1448. doi: 10.7524/j.issn.0254-6108.2021121403
Citation: LI Zhiyuan, WANG Yan, LI Junjie. Atmospheric vertical distribution of plasticizers based on a new passive air sampling calibration method[J]. Environmental Chemistry, 2023, 42(5): 1439-1448. doi: 10.7524/j.issn.0254-6108.2021121403

基于新型被动采样校正技术的塑化剂大气垂直浓度梯度研究

    通讯作者: E-mail: wangyandut@dlut.edu.cn
  • 基金项目:
    国家自然科学基金 (21976023)资助

Atmospheric vertical distribution of plasticizers based on a new passive air sampling calibration method

    Corresponding author: WANG Yan, wangyandut@dlut.edu.cn
  • Fund Project: the National Natural Science Foundation of China (21976023)
  • 摘要: 改进了垂直浓度梯度被动采样器和采样速率校正方法,并利用其考察有机磷酸酯(OPEs)和邻苯二甲酸酯(PAEs)两种塑化剂在土壤垂直方向上的采样速率、浓度分布及土-气交换趋势. 为了更准确地获得采样速率,利用主动采样和添加效能参考物质(DCs)联合校正被动采样速率;得到OPEs和PAEs经主动-DCs联合校正的采样速率分别为0.27—3.16 m3·d−1和0.23—3.25 m3·d−1. 基于主动-DCs联合校正得到的污染物浓度相比单独主动校正的结果差异显著,进而导致化合物土-气扩散趋势发生显著变化. 部分物质如TIBP、TCEP、TCIPP、TPHP、TPPO、DMP、DEP等甚至出现从沉降到挥发的趋势反转. 由于引入DCs校正了环境因素的影响,因此主动-DCs联合校正的被动采样速率能够获得更准确的污染物环境浓度和交换趋势.
  • 加载中
  • 图 1  新型垂直浓度梯度被动采样器结构示意图

    Figure 1.  Structure of the novel vertical passive air sampler

    图 2  OPEs、PAEs的吸附量随时间变化图

    Figure 2.  Variation of adsorption quality of OPEs and PAEs with sampling time

    图 3  主动或主动-DCs联合校正的不同高度OPEs和PAEs总浓度

    Figure 3.  Total concentrations of OPEs and PAEs at different heights calibrated by active sampling or active sampling-DCs joint calibration

    图 4  不同校正方法下OPEs和PAEs浓度的垂直分布

    Figure 4.  Vertical distributions of OPE and PAE concentrations under different calibration methods

    表 1  利用13C12-PCBs的DCs计算采样速率R的参数及结果

    Table 1.  Parameters and results of sampling rate RDC calculated by the DCs of 13C12-PCBs

    DCsKOAKPUF-A天数/d
    Days
    高度/cm
    Height
    $C^{\rm{corr} }_{\rm{DC} }$/CDC,0 aRDC /(m3·d−1
    采样速率实验13C12-PCB287.9981.4404071%±1%1.94±0.08
    13C12-PCB528.26120404073%±1%2.52±0.13
    浓度梯度实验13C12-PCB287.9981.440583%±3%1.00±0.20
    13C12-PCB287.9981.4401074%±4%1.57±0.26
    13C12-PCB287.9981.4402067%±1%2.15±0.03
    13C12-PCB287.9981.4404066%±4%2.20±0.31
    13C12-PCB287.9981.44013062%±1%2.52±0.04
      a 经稳定DC(13C12-PCB209)校正后的回收率. a Recovery calibrated by the stable DC (13C12-PCB209).
    下载: 导出CSV

    表 2  基于主动采样校正的被动采样速率RA

    Table 2.  Passive air sampling rate RA based on the active sampling calibration

    化合物缩写
    Compound abbreviation
    化合物名称
    Compound name
    CASKOA采样速率RA /(m3·d−1
    Sampling rate RA
    TIBP磷酸三异丁酯126-71-67.55[41]2.63
    TNBP磷酸三正丁酯126-73-87.44[42]1.99
    TCEP磷酸三氯乙酯115-96-87.88[43]2.76
    TCIPP磷酸三氯异丙酯13674-84-58.52[43]0.60
    TDCIPP磷酸三二氯异丙酯13674-87-810.0[43]2.63
    TBOEP磷酸三(2-丁氧基)乙酯78-51-311.34[43]2.01
    TPHP磷酸三苯酯115-86-610.14[43]1.19
    EHDPP2-乙基己基二苯基磷酸酯1241-94-710.68[43]2.44
    TEHP磷酸三辛基酯78-42-211.06[43]2.44 a
    TPPO三苯基氧化膦791-28-611.0[41]1.90
    TMPP磷酸三甲苯酯512-56-112.0[44]1.90 b
    DMP邻苯二甲酸二甲酯131-11-36.88[43]2.67
    DEP邻苯二甲酸二乙酯84-66-27.40[43]1.79
    DIBP邻苯二甲酸二异丁酯84-69-58.31[43]0.77 c
    DNBP邻苯二甲酸二正丁酯84-74-28.70[43]0.77
    BBzP邻苯二甲酸丁基苄酯85-68-79.64[43]1.34 d
    DEHA己二酸二辛酯103-23-110.8[45]1.34
    DCHP邻苯二甲酸二环己酯84-61-711.59[46]0.50
    DEHP邻苯二甲酸二(2-乙基己)酯117-81-711.40[43]0.73
    DNOP邻苯二甲酸二正辛酯117-84-011.86[43]0.73 e
    DEHT对苯二甲酸二(2-乙基己)酯6422-86-210.53[47]0.73e
      a 基于EHDPP的速率; b 基于TPPO的速率; c基于DNBP的速率; d基于DEHA的速率; e基于DEHP的速率.
      a based on rate of EHDPP; b based on rate of TPPO; c based on rate of DNBP; d based on rate of DEHA; e based on rate of DEHP.
    下载: 导出CSV

    表 3  不同高度PUF中化合物基于主动-DCs联合校正的被动采样速率Rs

    Table 3.  Passive sampling rate Rs of chemicals in PUF samples from different heights based on the joint calibration of active sampling-DCs

    Rs/ (m3·d−1
    5 cm10 cm20 cm40 cm130 cm
    TIBP1.201.882.572.633.01
    TNBP0.911.421.941.992.28
    TCEP1.261.972.702.763.16
    TCIPP0.270.430.590.600.69
    TDCIPP1.201.872.562.633.01
    TBOEP0.911.431.962.012.30
    TPHP0.540.851.161.191.36
    EHDPP a1.111.742.392.442.80
    TEHP1.111.742.392.442.80
    TPPO0.871.361.861.902.18
    TMPP b0.871.361.861.902.18
    DMP1.221.912.612.673.06
    DEP0.821.281.751.792.05
    DIBP c0.350.550.760.770.89
    DNBP0.350.550.760.770.89
    BBzP d0.610.961.311.341.53
    DEHA0.610.961.311.341.53
    DCHP0.230.360.490.500.58
    DEHP0.330.520.720.730.84
    DNOP e0.330.520.720.730.84
    DEHT e0.330.520.720.730.84
      a 基于EHDPP的速率; b 基于TPPO的速率; c基于DNBP的速率; d基于DEHA的速率; e基于DEHP的速率.
      a based on rate of EHDPP; b based on rate of TPPO; c based on rate of DNBP; d based on rate of DEHA; e based on rate of DEHP.
    下载: 导出CSV
  • [1] van der VEEN I, de BOER J. Phosphorus flame retardants: Properties, production, environmental occurrence, toxicity and analysis [J]. Chemosphere, 2012, 88(10): 1119-1153. doi: 10.1016/j.chemosphere.2012.03.067
    [2] YANG F X, DING J J, HUANG W, et al. Particle size-specific distributions and preliminary exposure assessments of organophosphate flame retardants in office air particulate matter [J]. Environmental Science & Technology, 2014, 48(1): 63-70.
    [3] HOFFMAN K, BUTT C M, WEBSTER T F, et al. Temporal trends in exposure to organophosphate flame retardants in the United States [J]. Environmental Science & Technology Letters, 2017, 4(3): 112-118.
    [4] PANG L, YANG H Q, YANG P J, et al. Trace determination of organophosphate esters in white wine, red wine, and beer samples using dispersive liquid-liquid microextraction combined with ultra-high-performance liquid chromatography-tandem mass spectrometry [J]. Food Chemistry, 2017, 229: 445-451. doi: 10.1016/j.foodchem.2017.02.103
    [5] MÖLLER A, STURM R, XIE Z Y, et al. Organophosphorus flame retardants and plasticizers in airborne particles over the Northern Pacific and Indian Ocean toward the Polar Regions: Evidence for global occurrence [J]. Environmental Science & Technology, 2012, 46(6): 3127-3134.
    [6] PANTELAKI I, VOUTSA D. Organophosphate flame retardants (OPFRs): A review on analytical methods and occurrence in wastewater and aquatic environment [J]. Science of the Total Environment, 2019, 649: 247-263. doi: 10.1016/j.scitotenv.2018.08.286
    [7] WANG Y, SUN H W, ZHU H K, et al. Occurrence and distribution of organophosphate flame retardants (OPFRs) in soil and outdoor settled dust from a multi-waste recycling area in China [J]. Science of the Total Environment, 2018, 625: 1056-1064. doi: 10.1016/j.scitotenv.2018.01.013
    [8] KIM J W, ISOBE T, CHANG K H, et al. Levels and distribution of organophosphorus flame retardants and plasticizers in fishes from Manila Bay, the Philippines [J]. Environmental Pollution, 2011, 159(12): 3653-3659. doi: 10.1016/j.envpol.2011.07.020
    [9] HE C, WANG X Y, TANG S Y, et al. Concentrations of organophosphate esters and their specific metabolites in food in southeast Queensland, Australia: Is dietary exposure an important pathway of organophosphate esters and their metabolites? [J]. Environmental Science & Technology, 2018, 52(21): 12765-12773.
    [10] SUNDKVIST A M, OLOFSSON U, HAGLUND P. Organophosphorus flame retardants and plasticizers in marine and fresh water biota and in human milk [J]. Journal of Environmental Monitoring, 2010, 12(4): 943-951. doi: 10.1039/b921910b
    [11] ZHANG X L, ZOU W, MU L, et al. Rice ingestion is a major pathway for human exposure to organophosphate flame retardants (OPFRs) in China [J]. Journal of Hazardous Materials, 2016, 318: 686-693. doi: 10.1016/j.jhazmat.2016.07.055
    [12] MEEKER J D, STAPLETON H M. House dust concentrations of organophosphate flame retardants in relation to hormone levels and semen quality parameters [J]. Environmental Health Perspectives, 2010, 118(3): 318-323. doi: 10.1289/ehp.0901332
    [13] YUAN S L, LI H, DANG Y, et al. Effects of triphenyl phosphate on growth, reproduction and transcription of genes of Daphnia magna [J]. Aquatic Toxicology, 2018, 195: 58-66. doi: 10.1016/j.aquatox.2017.12.009
    [14] SAILLENFAIT A M, NDAW S, ROBERT A, et al. Recent biomonitoring reports on phosphate ester flame retardants: A short review [J]. Archives of Toxicology, 2018, 92(9): 2749-2778. doi: 10.1007/s00204-018-2275-z
    [15] KIMBER I, DEARMAN R J. An assessment of the ability of phthalates to influence immune and allergic responses [J]. Toxicology, 2010, 271(3): 73-82. doi: 10.1016/j.tox.2010.03.020
    [16] STAPLES C A, PETERSON D R, PARKERTON T F, et al. The environmental fate of phthalate esters: A literature review [J]. Chemosphere, 1997, 35(4): 667-749. doi: 10.1016/S0045-6535(97)00195-1
    [17] XIE Z Y, EBINGHAUS R, TEMME C, et al. Occurrence and air-sea exchange of phthalates in the Arctic [J]. Environmental Science & Technology, 2007, 41(13): 4555-4560.
    [18] NET S, DUMOULIN D, EL-OSMANI R, et al. Case study of PAHs, Me-PAHs, PCBs, phthalates and pesticides contamination in the Somme river water, France [J]. International Journal of Environmental Research, 2014, 8(4): 1159-1170.
    [19] GAO D W, LI Z, WEN Z D, et al. Occurrence and fate of phthalate esters in full-scale domestic wastewater treatment plants and their impact on receiving waters along the Songhua River in China [J]. Chemosphere, 2014, 95: 24-32. doi: 10.1016/j.chemosphere.2013.08.009
    [20] LÜ H, MO C H, ZHAO H M, et al. Soil contamination and sources of phthalates and its health risk in China: A review [J]. Environmental Research, 2018, 164: 417-429. doi: 10.1016/j.envres.2018.03.013
    [21] MEEKER J D, SATHYANARAYANA S, SWAN S H. Phthalates and other additives in plastics: Human exposure and associated health outcomes [J]. Philosophical Transactions of the Royal Society of London. Series B, Biological Sciences, 2009, 364(1526): 2097-2113. doi: 10.1098/rstb.2008.0268
    [22] MCLACHLAN J A, SIMPSON E, MARTIN M. Endocrine disrupters and female reproductive health [J]. Best Practice & Research Clinical Endocrinology & Metabolism, 2006, 20(1): 63-75.
    [23] MELYMUK L, BOHLIN P, SÁŇKA O, et al. Current challenges in air sampling of semivolatile organic contaminants: Sampling artifacts and their influence on data comparability [J]. Environmental Science & Technology, 2014, 48(24): 14077-14091.
    [24] 朱青青, 刘国瑞, 张宪, 等. 大气中持久性有机污染物的采样技术进展 [J]. 生态毒理学报, 2016, 11(2): 50-60.

    ZHU Q Q, LIU G R, ZHANG X, et al. Progress on the sampling techniques of persistent organic pollutants in atmosphere [J]. Asian Journal of Ecotoxicology, 2016, 11(2): 50-60(in Chinese).

    [25] GÓRECKI T, NAMIEŚNIK J. Passive sampling [J]. TrAC Trends in Analytical Chemistry, 2002, 21(4): 276-291. doi: 10.1016/S0165-9936(02)00407-7
    [26] KLÁNOVÁ J, KOHOUTEK J, HAMPLOVÁ L, et al. Passive air sampler as a tool for long-term air pollution monitoring: Part 1. Performance assessment for seasonal and spatial variations [J]. Environmental Pollution, 2006, 144(2): 393-405. doi: 10.1016/j.envpol.2005.12.048
    [27] WENNRICH L, POPP P, HAFNER C. Novel integrative passive samplers for the long-term monitoring of semivolatile organic air pollutants [J]. Journal of Environmental Monitoring, 2002, 4(3): 371-376. doi: 10.1039/b200762m
    [28] CHAEMFA C, BARBER J L, GOCHT T, et al. Field calibration of polyurethane foam (PUF) disk passive air samplers for PCBs and OC pesticides [J]. Environmental Pollution, 2008, 156(3): 1290-1297. doi: 10.1016/j.envpol.2008.03.016
    [29] BIRGÜL A, KURT-KARAKUS P B, ALEGRIA H, et al. Polyurethane foam (PUF) disk passive samplers derived polychlorinated biphenyls (PCBs) concentrations in the ambient air of Bursa-Turkey: Spatial and temporal variations and health risk assessment [J]. Chemosphere, 2017, 168: 1345-1355. doi: 10.1016/j.chemosphere.2016.11.124
    [30] MOECKEL C, HARNER T, NIZZETTO L, et al. Use of depuration compounds in passive air samplers: Results from active sampling-supported field deployment, potential uses, and recommendations [J]. Environmental Science & Technology, 2009, 43(9): 3227-3232.
    [31] SÖDERSTRÖM H S, BERGQVIST P A. Passive air sampling using semipermeable membrane devices at different wind-speeds in situ calibrated by performance reference compounds [J]. Environmental Science & Technology, 2004, 38(18): 4828-4834.
    [32] GOUIN T, HARNER T, BLANCHARD P, et al. Passive and active air samplers as complementary methods for investigating persistent organic pollutants in the great lakes basin [J]. Environmental Science & Technology, 2005, 39(23): 9115-9122.
    [33] HARNER T, BIDLEMAN T F, JANTUNEN L M, et al. Soil-air exchange model of persistent pesticides in the United States cotton belt [J]. Environmental Toxicology and Chemistry, 2001, 20(7): 1612-1621.
    [34] PARNIS J M, MACKAY D. Multimedia Environmental Models[M]. Third edition. | Boca Raton, FL: CRC Press, 2020.
    [35] MEIJER S N, SHOEIB M, JANTUNEN L M M, et al. Air−Soil exchange of organochlorine pesticides in agricultural soils. 1. field measurements using a novel in situ sampling device [J]. Environmental Science & Technology, 2003, 37(7): 1292-1299.
    [36] ZHANG Y Z, DENG S X, LIU Y N, et al. A passive air sampler for characterizing the vertical concentration profile of gaseous phase polycyclic aromatic hydrocarbons in near soil surface air [J]. Environmental Pollution, 2011, 159(3): 694-699. doi: 10.1016/j.envpol.2010.12.002
    [37] BARTKOW M E, BOOIJ K, KENNEDY K E, et al. Passive air sampling theory for semivolatile organic compounds [J]. Chemosphere, 2005, 60(2): 170-176. doi: 10.1016/j.chemosphere.2004.12.033
    [38] SHOEIB M, HARNER T. Characterization and comparison of three passive air samplers for persistent organic pollutants [J]. Environmental Science & Technology, 2002, 36(19): 4142-4151.
    [39] BOHLIN P, AUDY O, ŠKRDLÍKOVÁ L, et al. Outdoor passive air monitoring of semi volatile organic compounds (SVOCs): A critical evaluation of performance and limitations of polyurethane foam (PUF) disks [J]. Environmental Science. Processes & Impacts, 2014, 16(3): 433-444.
    [40] STRANDBERG B, SUNESSON A L, SUNDGREN M, et al. Field evaluation of two diffusive samplers and two adsorbent media to determine 1, 3-butadiene and benzene levels in air [J]. Atmospheric Environment, 2006, 40(40): 7686-7695. doi: 10.1016/j.atmosenv.2006.08.005
    [41] WANG Q Z, ZHAO H X, WANG Y, et al. Determination and prediction of octanol-air partition coefficients for organophosphate flame retardants [J]. Ecotoxicology and Environmental Safety, 2017, 145: 283-288. doi: 10.1016/j.ecoenv.2017.07.040
    [42] YAMAN B, DUMANOGLU Y, ODABASI M. Measurement and modeling the phase partitioning of organophosphate esters using their temperature-dependent octanol-air partition coefficients and vapor pressures [J]. Environmental Science & Technology, 2020, 54(13): 8133-8143.
    [43] RODGERS T F M, OKEME J O, PARNIS J M, et al. Novel Bayesian method to derive final adjusted values of physicochemical properties: Application to 74 compounds [J]. Environmental Science & Technology, 2021, 55(18): 12302-12316.
    [44] SÜHRING R, WOLSCHKE H, DIAMOND M L, et al. Distribution of organophosphate esters between the gas and particle phase-model predictions vs measured data [J]. Environmental Science & Technology, 2016, 50(13): 6644-6651.
    [45] SALTHAMMER T, GRIMME S, STAHN M, et al. Quantum chemical calculation and evaluation of partition coefficients for classical and emerging environmentally relevant organic compounds [J]. Environmental Science & Technology, 2022, 56(1): 379-391.
    [46] DODSON R E, CAMANN D E, MORELLO-FROSCH R, et al. Semivolatile organic compounds in homes: Strategies for efficient and systematic exposure measurement based on empirical and theoretical factors [J]. Environmental Science & Technology, 2015, 49(1): 113-122.
    [47] SALTHAMMER T, SCHRIPP T. Application of the Junge- and Pankow-equation for estimating indoor gas/particle distribution and exposure to SVOCs [J]. Atmospheric Environment, 2015, 106: 467-476. doi: 10.1016/j.atmosenv.2014.09.050
    [48] TSAPAKIS M, STEPHANOU E G. Diurnal cycle of PAHs, nitro-PAHs, and oxy-PAHs in a high oxidation capacity marine background atmosphere [J]. Environmental Science & Technology, 2007, 41(23): 8011-8017.
    [49] ZHANG Z G, LIN G L, LIN T, et al. Occurrence, behavior, and fate of organophosphate esters (OPEs) in subtropical paddy field environment: A case study in Nanning City of South China [J]. Environmental Pollution, 2020, 267: 115675. doi: 10.1016/j.envpol.2020.115675
    [50] CAO D D, LV K, GAO W, et al. Presence and human exposure assessment of organophosphate flame retardants (OPEs) in indoor dust and air in Beijing, China [J]. Ecotoxicology and Environmental Safety, 2019, 169: 383-391. doi: 10.1016/j.ecoenv.2018.11.038
    [51] HE M J, LU J F, WEI S Q. Organophosphate esters in biota, water, and air from an agricultural area of Chongqing, Western China: Concentrations, composition profiles, partition and human exposure [J]. Environmental Pollution, 2019, 244: 388-397. doi: 10.1016/j.envpol.2018.10.085
    [52] HE M J, LU J F, WANG J, et al. Phthalate esters in biota, air and water in an agricultural area of western China, with emphasis on bioaccumulation and human exposure [J]. Science of the Total Environment, 2020, 698: 134264. doi: 10.1016/j.scitotenv.2019.134264
    [53] CHEN Y, LV D, LI X H, et al. PM2.5-bound phthalates in indoor and outdoor air in Beijing: Seasonal distributions and human exposure via inhalation [J]. Environmental Pollution, 2018, 241: 369-377. doi: 10.1016/j.envpol.2018.05.081
    [54] LIU D, LIN T, SHEN K J, et al. Occurrence and concentrations of halogenated flame retardants in the atmospheric fine particles in Chinese cities [J]. Environmental Science & Technology, 2016, 50(18): 9846-9854.
    [55] OUYANG X Z, XIA M, SHEN X Y, et al. Pollution characteristics of 15 gas- and particle-phase phthalates in indoor and outdoor air in Hangzhou [J]. Journal of Environmental Sciences, 2019, 86: 107-119. doi: 10.1016/j.jes.2019.05.008
    [56] HUCKINS J N, PETTY J D, LEBO J A, et al. Development of the permeability/performance reference compound approach for in situ calibration of semipermeable membrane devices [J]. Environmental Science & Technology, 2002, 36(1): 85-91.
  • 加载中
图( 4) 表( 3)
计量
  • 文章访问数:  2068
  • HTML全文浏览数:  2068
  • PDF下载数:  50
  • 施引文献:  0
出版历程
  • 收稿日期:  2021-12-14
  • 录用日期:  2022-02-11
  • 刊出日期:  2023-05-27

基于新型被动采样校正技术的塑化剂大气垂直浓度梯度研究

基金项目:
国家自然科学基金 (21976023)资助

摘要: 改进了垂直浓度梯度被动采样器和采样速率校正方法,并利用其考察有机磷酸酯(OPEs)和邻苯二甲酸酯(PAEs)两种塑化剂在土壤垂直方向上的采样速率、浓度分布及土-气交换趋势. 为了更准确地获得采样速率,利用主动采样和添加效能参考物质(DCs)联合校正被动采样速率;得到OPEs和PAEs经主动-DCs联合校正的采样速率分别为0.27—3.16 m3·d−1和0.23—3.25 m3·d−1. 基于主动-DCs联合校正得到的污染物浓度相比单独主动校正的结果差异显著,进而导致化合物土-气扩散趋势发生显著变化. 部分物质如TIBP、TCEP、TCIPP、TPHP、TPPO、DMP、DEP等甚至出现从沉降到挥发的趋势反转. 由于引入DCs校正了环境因素的影响,因此主动-DCs联合校正的被动采样速率能够获得更准确的污染物环境浓度和交换趋势.

English Abstract

  • 有机磷酸酯(organophosphate esters, OPEs)作为阻燃剂和增塑剂被广泛应用于塑料、泡沫、电子产品和建筑材料中[1-3]. OPEs一般通过物理混合添加到材料中,易通过挥发、浸出、磨损释放到环境中[4],因此广泛存在于各种环境介质中,包括大气[5]、水[6]、土壤[7]、鱼[8],甚至人的头发[9]、尿液[10]和母乳[11]. OPEs可通过皮肤接触、灰尘摄入、呼吸、摄食进入人体,表现出多种毒害效应,包括神经毒性、肾毒性、生殖毒性、致癌性、内分泌干扰性等[12-14]. 邻苯二甲酸酯(phthalates, PAEs)作为增塑剂广泛应用于建材、塑料制品中,改善材料的柔韧性和可塑性[15-16]. PAEs在大气[17]、沉积物[18]、水体[19]、土壤[20]及人体[21]中也被广泛检出. 研究表明,PAEs具有内分泌干扰性,可以干扰内源性激素的合成[22]. 由于两种化合物对生态系统和公众健康的潜在风险,其环境行为已引起普遍关注.

    半挥发性有机物(SVOCs)的大气采样可分为主动和被动采样[23],主动采样利用抽气泵采集污染物[24],具有时间短、速度快、准确等优点,但造价贵、体积大、需要电源,不利于多点同时采样. 被动采样器(PAS)利用聚氨酯泡沫(PUF)等对有机物具有较高分配系数的吸附材料,通过空气与材料间的浓度梯度将有机物吸附到材料上[25],具有造价低、无需电源、对空气扰动小、多点同时监测、能反映时间加权平均浓度等优点[26-27],但采样过程中易受到风速等环境因素的干扰,不同采样点间采样速率存在差异. 因此,如何准确获得被动采样器的采样速率是确保其准确定量的关键.

    目前PUF-PAS采样速率的评估方法有两种. 一种是基于主动采样校正的采样速率. 通过采样时间内PUF中污染物的日累积量和主动采样测定的大气污染物浓度得到该污染物的采样速率Ra [28],但不能校正不同环境条件下采样速率的差异. 另一种方法是在PUF部署前加入效能参考物(DCs或称PRCs),用以校正风速的环境因素对采样速率造成的影响. 基于PUF中DCs的损失率,计算采样速率RDC,也是目前应用较多的一种方法[29]. 该方法假设PUF对污染物吸收和其替代物释放过程传质方向相反但速率常数相同[30-31]. DCs逸失率在20%—80%之间才能获得相对准确的采样速率[32], 且作DCs的物质通常为同位素标记物,价格昂贵.

    当前SVOCs的土-气交换研究主要有两种方法:一种是逸度模型计算法,即通过计算污染物土壤逸度(fs)和大气逸度(fa)的比值关系来判断污染物在两相间的迁移趋势[33-34],但该方法不适用于理化参数缺乏的新型污染物;同时土壤中真实参与土-气交换过程的污染物含量难以准确获取,当污染物浓度较低时,由于环境参数变化带来的不确定性会对最终的结果产生较大影响. 另一种是根据监测的近地面空气中污染物浓度梯度,对土壤-大气交换趋势进行量化,例如近地面空气被动采样器[35-36];相比逸度计算法,该方法能够更直观地反映污染物的垂直浓度分布,表征污染物的土-气交换方向,但也存在被动采样速率不准、受环境因素影响大等问题,需要对采样速率进行校正,以获得较为准确的浓度和趋势.

    本研究利用主动采样和添加DCs联合校正采样速率的方法,研究一种可监测土壤垂直方向污染物浓度梯度的新型PUF被动采样器对OPEs和PAEs的采样速率,可以在一定程度上节约了DCs的添加成本,同时解决了主动采样器对空气的扰动和难以同时多点部署以及风速变化影响被动采样速率的不足,弥补了单一校正方法的缺陷,使得浓度结果更加准确,并用于表征近地面大气中OPEs和PAEs的垂直浓度分布,以期获得准确的污染物土-气交换趋势.

  • 实验所用正己烷、二氯甲烷、乙酸乙酯、异辛烷均为色谱纯,购自J&K公司;所用无水硫酸钠(分析纯)购自国药公司;所用硅胶(60目)购自Merck公司;标准品购自ACCU公司.

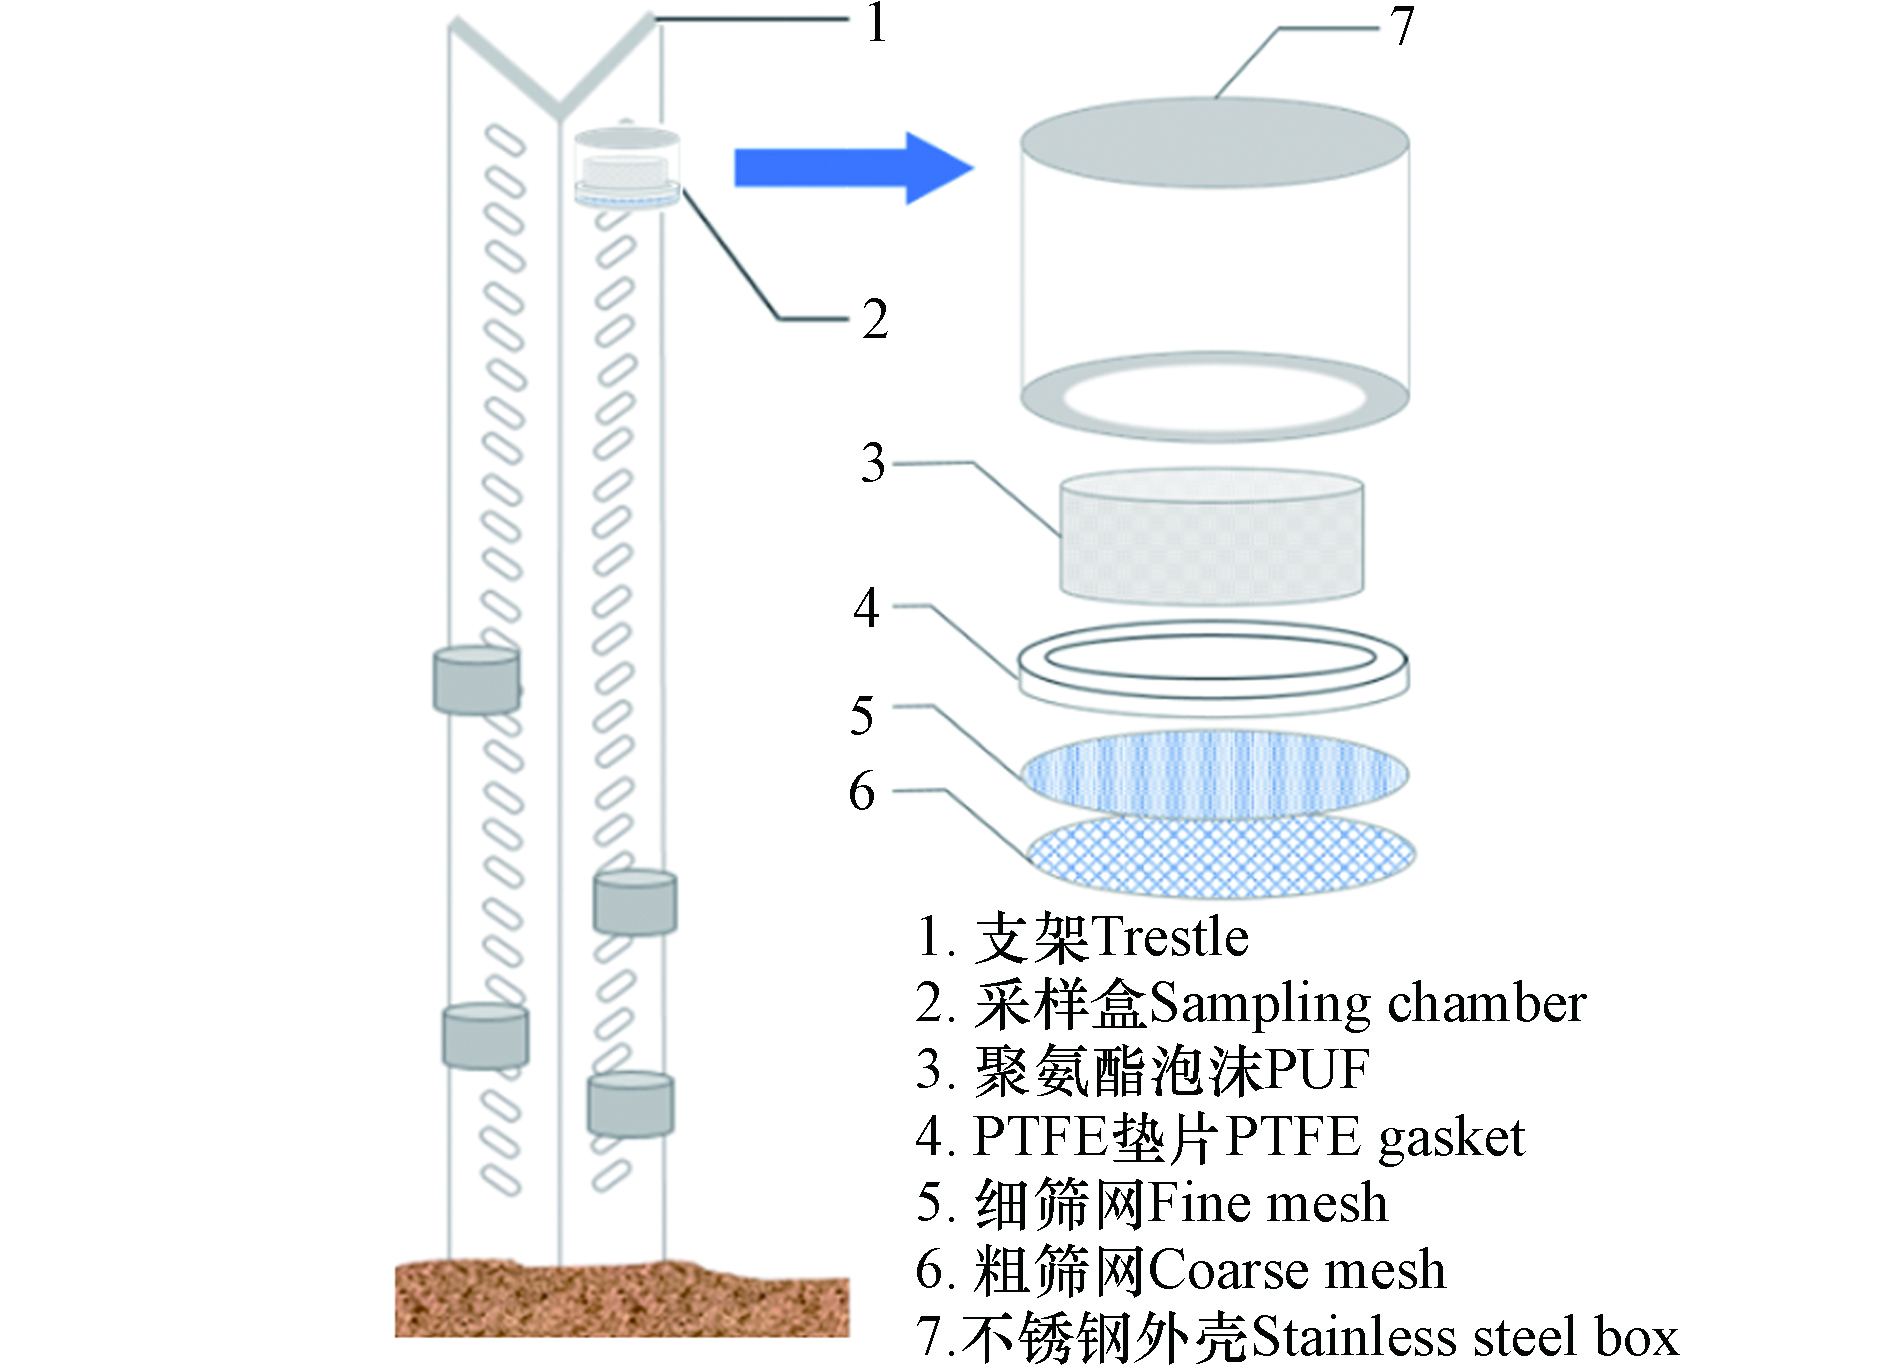
  • 对现有的近地面浓度垂直剖面采样器[36]进行改进,研制出新型垂直浓度梯度被动采样器,如图1所示. 采样盒内径8 cm,高8 cm,为不锈钢材质,顶部封闭,底部中心有直径7 cm的开口,内部由上到下放置PUF、聚四氟乙烯环形垫片、细筛网(200目)、粗筛网(10目). 粗、细筛网可以阻止颗粒物等固体杂质等进入采样盒内,确保尽可能少的采集到颗粒态样品. PUF直径6.5 cm,高2.5 cm,侧面和顶部分别与采样盒内壁间隔0.5 cm和1 cm. 间隔可促进采样盒内部空气流通,提高扩散速率和采样速率.

  • 采样时间为2020年9月—11月. 采样前,PUF分别经乙酸乙酯、二氯甲烷索氏提取48 h,并添加DCs (13C12-PCB28, 52, 209). (1)采样速率实验:将新型PAS部署在具地面1.5 m高,分别在采样5、10、20、30、40 d收集3个平行样;同期在距离2 m远处利用主动采样器同步采样,流量为120 L·min−1. (2)垂直浓度梯度实验:新型采样器底部距地面高度为5、10、20、40、130 cm,每个高度3个平行,采样时长40 d.

  • PUF用正己烷/二氯甲烷(1:1,体积比)100 ℃下加速溶剂萃取静态萃取5 min,循环2次. 萃取液浓缩后经硅胶柱净化,加入内标物待测.

    11种OPEs和10种PAEs利用岛津GCMS-QP2020配备DB-5MS毛细管柱(30 m×0.25 mm×0.25 μm)测定. 升温程序为:70 ℃,保持2 min,15 ℃·min−1升至300 ℃,保持10 min. 氦气为载气,流速为1.5 mL·min−1.

  • 实验中所用的玻璃仪器洗净烘干后,经马弗炉450 ℃烧4 h,使用前使用有机溶剂润洗以去除背景值. 采用内标法定量,分析过程设置了溶剂空白、程序空白、平行样品. 空白样品中目标物含量均<样品含量的10%,OPEs和PAEs的加标回收率分别为73%—95%和71%—102%,最终结果均经过回收率和空白校正.

  • 假设被动采样速率R受气体边界层控制;DCs对于气体边界层的传质系数k不依赖于它的PUF-空气分配系数KPUF-A;吸附和逸散的方向是相反的;R等于传质系数k和PUF的表面积A的乘积. 根据公式(1)[37]

    由于空气中DCs浓度为0,即Ci,A=0,因此公式简化为:

    两边积分得公式(3)或(4)(稳定DCs校正):

    其中,Ci, PUF为PUF中待测物浓度,ng/sample;Ci, A为空气中待测物浓度,ng·m−3,DCs空气中为0;KPUF-A为PUF-空气分配系数,无量纲;$ K'_{\mathrm{P}\mathrm{U}\mathrm{F}{\text{-}}\mathrm{A}} $为PUF-空气分配系数;m3·g−1k 为传质系数,m·s−1R为基于DC的采样速率,m3·d−1APUF为PUF表面积,117.4 cm2t 为采样时间,d;ρPUF为PUF密度,0.025 g·cm−3VPUF为PUF体积,82.9 cm3CDC,0CDC为DCs初始和结束浓度,ng/sample;当CDC/CDC,0为20%—80%,采样速率相对准确.CDC-stable,0CDC-stable为稳定DCs初始和结束浓度,ng/sample.稳定DC是指一种难挥发的DC,可以校正采样中PUF的破损、分析损失以及基质效应等造成的误差. 本研究中选取13C12-PCB209作为稳定DC. 其中KPUF-A可基于辛醇-空气分配系数KOA根据公式(7)[38]计算:

    由于只有13C12-PCB28和13C12-PCB52回收率在20%—80%范围内,因此获得基于两种DCs的被动采样速率如表1所示. 理论上,基于13C12-PCBs所计算的被动采样速率只适用于PCBs类化合物. 根据双膜理论,SVOCs进入PUF的传质阻力主要由空气边界层厚度控制,同时还与传质系数与PUF-空气分配系数KPUF-A有关[37]. KPUF-A通常与化合物的KOA有关[38]. 同理,DCs的逸散过程也主要受控于空气边界层及化合物性质. 空气边界层的厚度随风速的增加而降低[30],因此采样速率很大程度取决于风速. 本实验选择的DCs的性质(即KOA)与多数目标化合物接近,因此可认为他们具有相近的KPUF-A和相似的逸散特性. 此外,DCs结合主动联合校正可进一步得到更为准确的采样速率. 因此化合物种类不同对采样速率产生的影响可忽略.

  • 速率实验中利用主动采样测得大气Σ11OPEs和Σ10PAEs总浓度的平均值分别为(1.54±0.49) ng·m−3和(74.3±10.5) ng·m−3. 基于某线性吸附时间内被动PUF中化合物的日增量(ng·d−1)与该时间段主动采样测得的化合物平均浓度(ng·m−3),可计算出该时间段化合物基于主动的日采样速率RA(m³·d−1),即

    式中,t为采样天数(d),ΔMPt时间PUF中化合物增加量(ng),ΔMAt时间主动采样测得的化合物含量(ng),VA为该时间段主动采样体积(m³).

  • 本实验中,以主动采样校正的采样速率RA作为被动采样40 cm高度上的采样速率,以此为基准,根据不同高度的DCs采样速率RDCxx为采样高度)与40 cm高度的DCs采样速率RDC40的比值作为校正因子kx,从而得到化合物在不同高度被动样品的主动-DCs联合校正采样速率RS,即

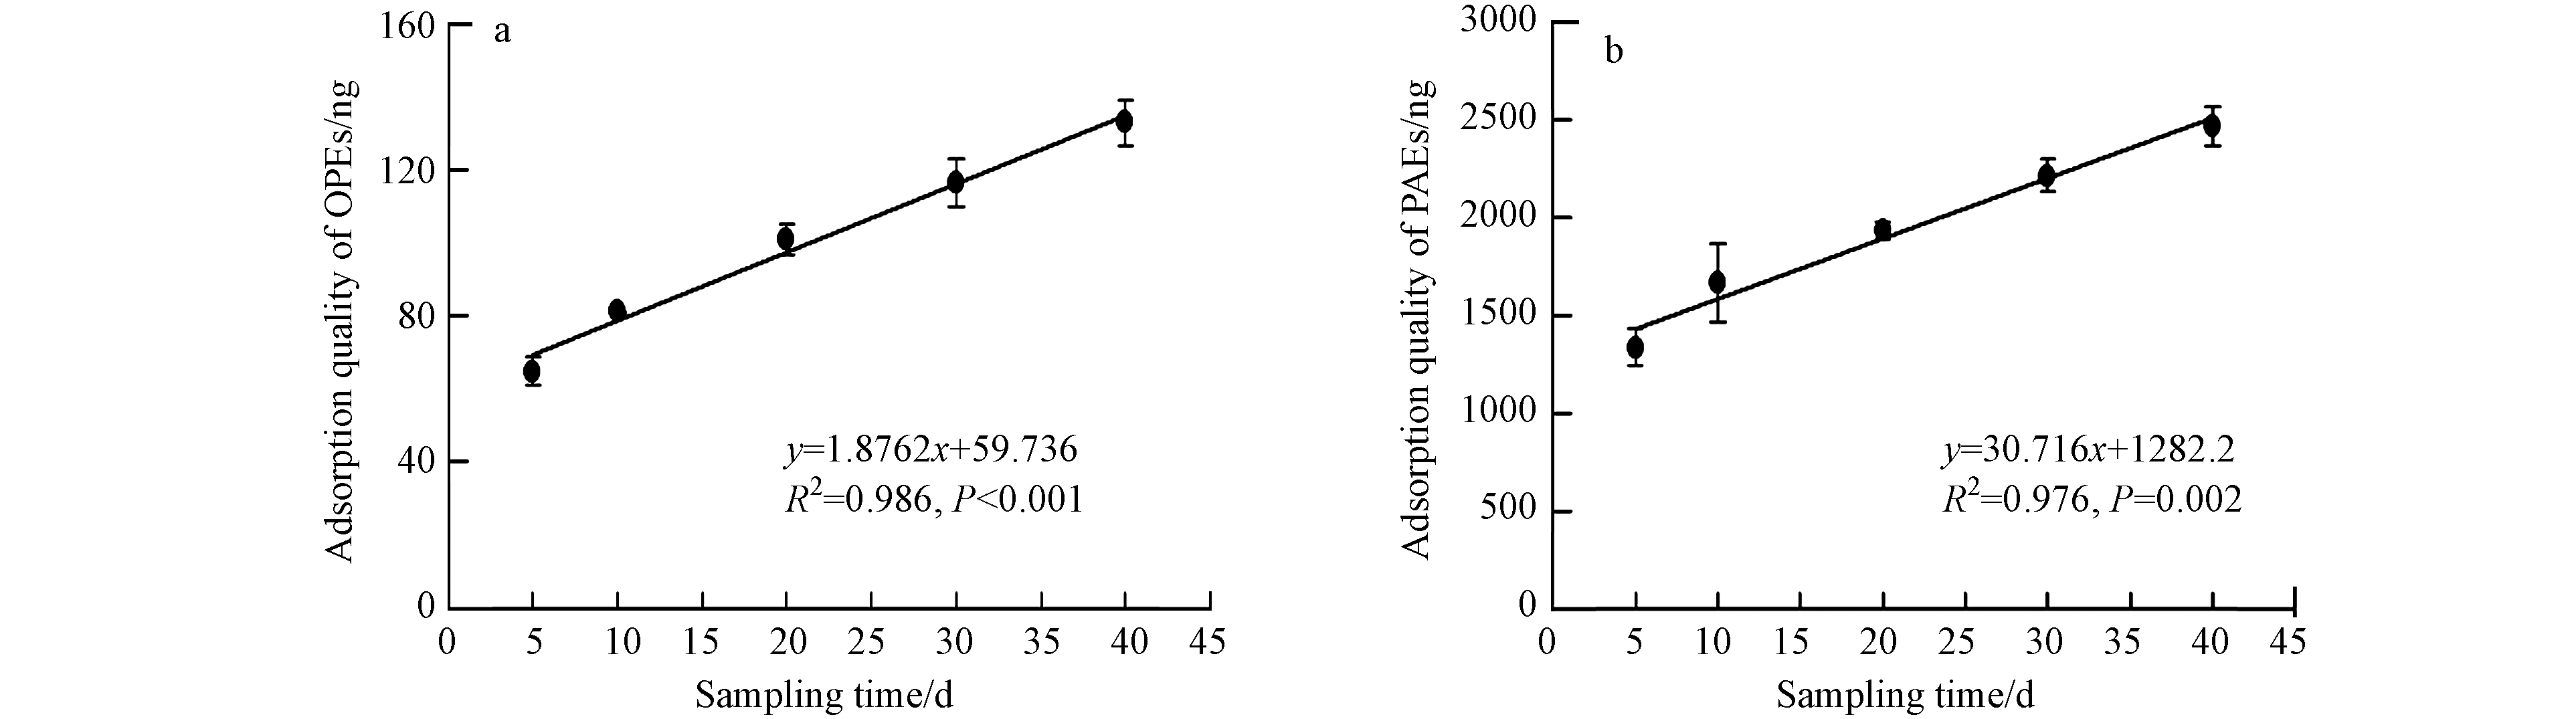
    • 新型被动PUF中Σ11OPEs和Σ10PAEs在同一高度的吸附量随时间变化如图2. 被动吸附一般分为:线性吸附、曲线吸附和吸附平衡3个阶段. 由图2可见,40 d内目标物处于线性吸附阶段.

      新型被动采样器OPEs和PAEs单体经主动校正的采样速率RA表2所示. OPEs和PAEs的采样速率分别为(0.60±0.09)—(2.76±0.29)m3·d−1、(0.50±0.29)—(2.67±0.32)m3·d−1, 与捷克马萨里克大学测得的PAHs((0.3±0.1)—(5.5±0.7)m³·d−1)和PBDEs((0.7±0.3)—(2.4±0.3)m3·d−1)的采样速率接近[39]. 被动采样速率取决于化合物性质、环境浓度、周边风速等气象条件、采样材料及采样器结构等[40]. 经主动校正的采样速率无法表征风速或者环境条件变化引起的被动采样速率的差异.

    • 基于主动-DCs联合校正的不同高度PUF中OPEs和PAEs的采样速率范围分别为0.27—3.16 m3·d−1和0.23—3.25 m3·d−1表3). 研究表明风速是影响大气气态污染物被动采样的重要因素[48],风速变化改变了空气边界层的厚度,进而影响采样速率. 采样速率随高度逐渐增大,可能是由于距地面越高,空气流速相对越快,因此采样速率越高.

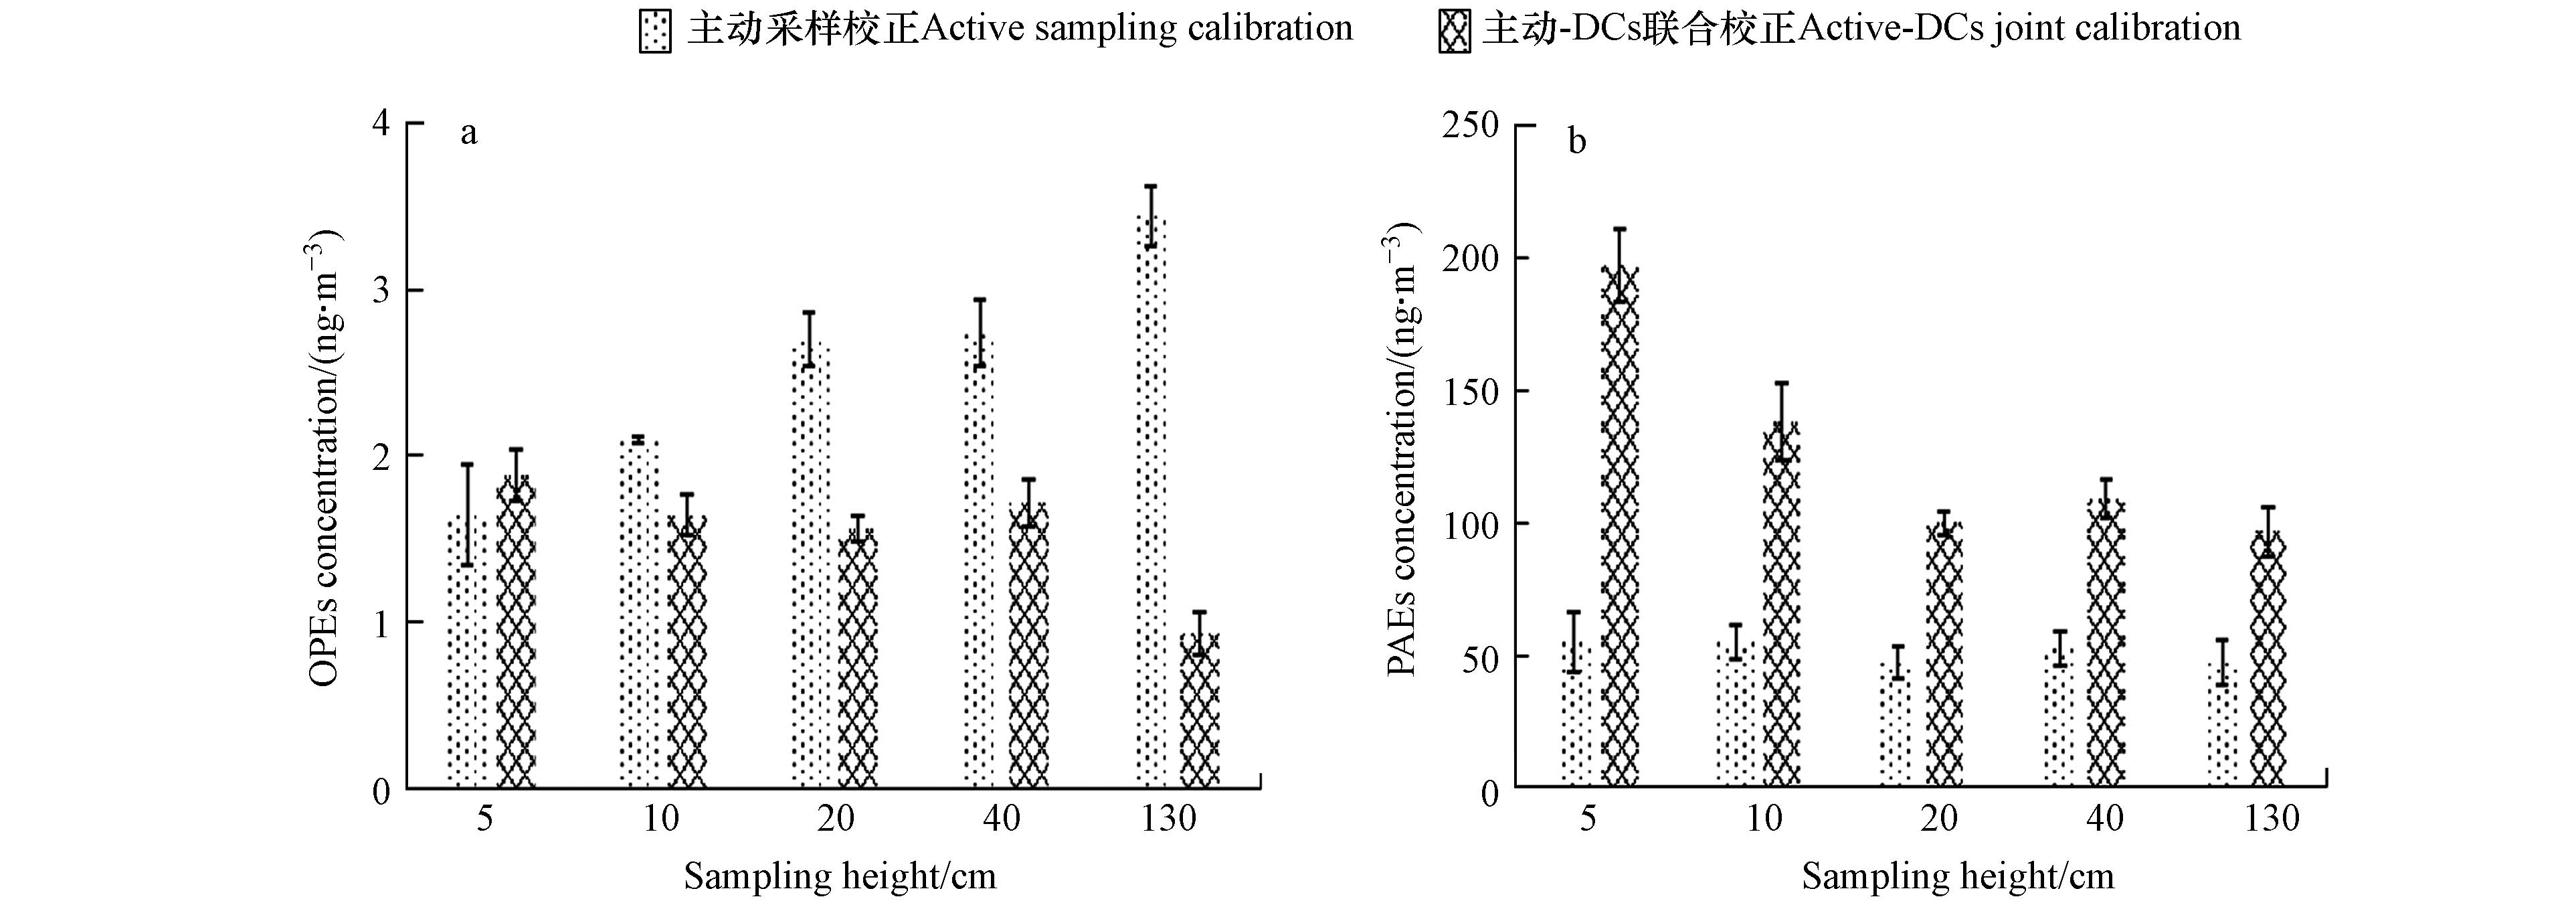
    • 主动校正的不同高度OPEs和PAEs总浓度见图3. 经主动校正的采样速率得到的OPEs和PAEs总浓度分别为(2.52±0.68)ng·m−3和(51.3±3.82)ng·m−3. 组成上,OPEs以TCIPP、TEHP为主,平均占比为45%和41%;PAEs主要单体为DEHP、DIBP和DNBP,平均占比51.16%、20.79%和17.62%. 垂直分布显示, 污染物在地表0—130 cm的高度存在显著浓度梯度变化,表明近地面大气中污染物浓度显著受到土-气交换过程影响. OPEs中大部分单体如TNBP、TCIPP、TIBP、TCEP、TPHP、TPPO等在垂直方向上随高度增加而浓度升高,表现为由大气向土壤沉降; TDCIPP、TMPP为随高度升高浓度降低,表现为由土壤挥发. PAEs中DMP、DEP、DIBP、DNBP、DEHA、DCHP、DEHT、DNOP表现为沉降,而DEHP、BBzP表现为挥发.

    • 不同高度PUF中的目标物吸附量受采样速率及污染物浓度共同影响. 基于单一主动校正只能反映不同高度污染物浓度变化导致的差异,不能反应采样速率导致的差异. 基于单一DCs校正能够一定程度反映不同高度采样速率变化导致的吸附量差异,但不能准确反映同一高度不同化合物采样速率差异. 主动-DCs联合校正很好的解决了上述问题,更全面的反映了二者对目标物含量的贡献.

      经主动-DCs联合校正采样速率得到的OPEs和PAEs总浓度分别为(1.56±0.36)ng·m−3和(128±41.9)ng·m−3,其中PAEs结果显著高于经主动单独校正的结果(图3). 该区域大气Σ11OPEs浓度略高于南宁市农田大气浓度((0.42±0.33)ng·m−3[49],略低于北京市室内空气浓度(5.2 ng·m−3[50],与重庆市农业区附近的室内空气浓度相当(1.79 ng·m−3[51]. 该区域PAEs大气浓度比重庆农业区大气浓度((3.03±0.32)ng·m−3[52]高1个数量级,低于北京市住宅空气浓度(498 ng·m−3),与北京市室外大气PM2.5中浓度相当(125 ng·m−3[53].

      组成上,OPEs中TCIPP占比提高至70%. 与重庆农业区大气OPEs组成类似[51],可能由于TCIPP被广泛用作TCEP的替代品[54]. PAEs占比最大的单体由DEHP变为DIBP(58.5%),其次为DEHP(27.2%)和DNBP(9.35%),DEHP、DNBP和DIBP是我国主要生产和使用的增塑剂[52]. 该组成与杭州市大气PAEs的组成略有不同(DEP>DEHP>DIBP)[55].

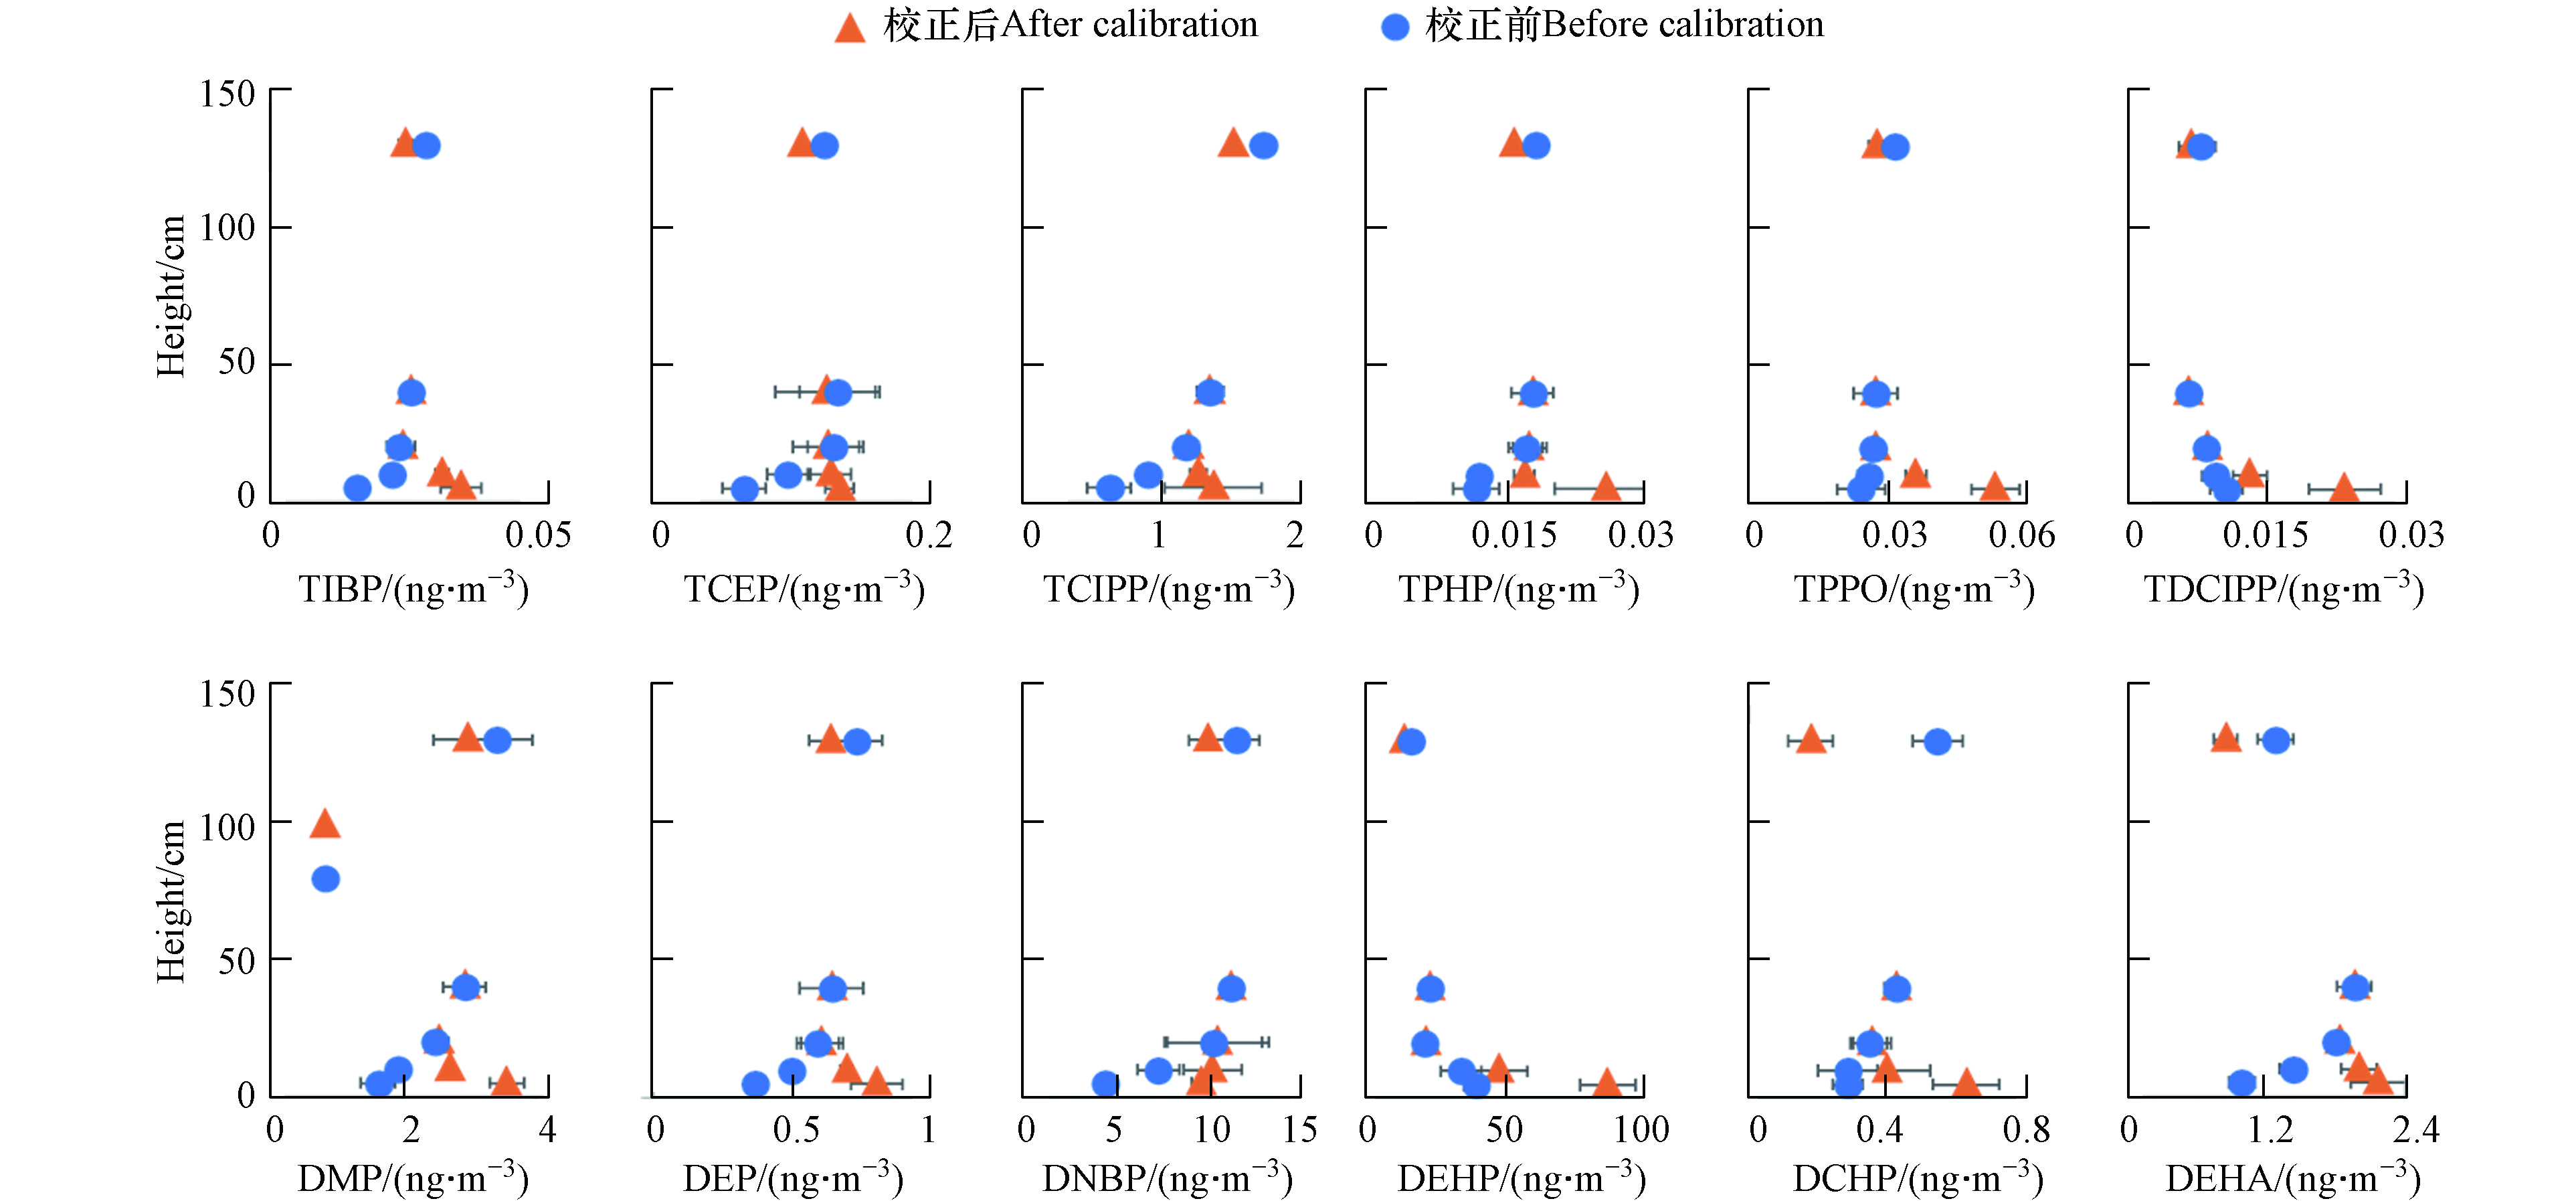
      经主动-DCs联合校正的垂直浓度分布规律显示:TCEP、TCIPP、TIBP、TPHP、TPPO及DMP、DEP、DEHA、DCHP的土-气交换方向趋势发生反转,由之前的沉降变为挥发,其余单体如TNBP、TDCIPP、DNBP、DEHP虽然未发生交换趋势的变化,但环境浓度显著改变,必将导致交换通量发生变化(图4). 单一主动校正的弊端在于假定各高度采样速率相同,而实际上由于垂直方向的风速差异,不同高度的采样速率显著不同. 近地面,由于地表阻力,空气流通速度变慢,因此采样速率降低. 通过添加DCs,根据逸散率的不同,得到不同高度的采样速率,能够更好地校正风速对采样速率造成的影响. DCs校正被动采样速率的方法前期已经被广泛应用[303256],因此将其与主动采样联合校正,能够更准确反映不同高度PUF采样速率的差异,进而获得更准确的污染物土-气交换趋势.

    • (1) 新型垂直浓度梯度被动采样器对OPEs和PAEs的吸附在40 d内均处于线性吸附阶段.

      (2) 经主动-DCs联合校正的PUF对OPEs和PAEs采样速率分别为(0.27—3.16)m3·d−1、(0.23—3.25)m3·d−1,采样速率随高度的升高逐渐增大.

      (3) 经过主动-DCs联合校正前后, TCEP、TCIPP、TIBP、TPHP、TPPO及的DMP、DEP、DCHP、DEHA的土-气交换趋势发生反转,其余单体如TNBP、TDCIPP、DNBP、DEHP趋势虽然未变,但浓度发生了不同程度的改变,表明基于主动-DCs联合校正被动采样速率能够获得更准确的环境浓度和交换趋势.

    参考文献 (56)

目录

/

返回文章
返回