-
2020年我国主要大气污染物为SO2、PM2.5、NOx和挥发性有机物(volatile organic compounds,VOCs)[1]。其中,NOx和VOCs均为O3前体物[2-3],因此VOCs的治理成为“十四五”期间我国大气污染防治工作重点之一为[1]。目前,我国的工业污染源VOCs排放量约占其总排放量的50%[4],而无组织排放量为工业污染源排放量的60%[5]。因此,VOCs的防控关键在于对无组织VOCs进行控制,而无组织VOCs的溯源则是此类VOCs污染控制的重要内容。
工业VOCs污染源的溯源方法有3种:基于污染源清单和扩散模式的源解析技术、基于化学平衡受体模型的源解析技术和逆向模拟计算技术[6]。由于逆向模拟的运算非常简便,只需要搜集数据,再利用扩散模式进行反演即可,因此大多数研究都是在有风条件下运用AERMOD[7-9]、ADMS[10-11]等大气扩散模式进行模拟分析。然而,静小风是造成空气严重污染的天气条件,特别是在小风条件下,污染物会因为湍流扩散及在水平方向上输送能力的减弱,导致污染物累积,造成重度污染情况的出现,因此,亟需开展在小风气象条件下进行的污染物溯源研究。
目前,国内缺乏对典型工业无组织VOCs排放源排放特性的分析[12],在小风环境下无组织VOCs的溯源分析研究亦不多。在一般的污染物溯源分析中,都是根据监测点的浓度监测值及位置反演出排放源的源点信息(即排放源强与位置),但当排放源不唯一时,会得到非劣解[13]。本研究在小风天气条件下,依据工业园区内VOCs排放源的实际排放特点,对工业园区的无组织VOCs进行溯源解析。即根据监测点浓度值及排放源的位置坐标构建无组织VOCs溯源模型,计算出各个无组织VOCs排放源到监测点的浓度值及对监测点的浓度贡献比例,从而得到下风向监测点无组织VOCs的具体来源。本研究结果旨在为为小风条件下工业园区无组织VOCs排放溯源解析提供参考。
-
对于小风与静风的区分,至今尚无统一规定的方法。有2种应用普遍的划分方法:一种是将风速为0.5 m·s−1≤ u≤1.5 m·s−1规定为小风,将风速u<0.5 m·s−1时[14],规定为静风天气;第二种划分方法是将风速u小于1 m·s−1时规定为静风天气,而当风速u≤0.5 m·s−1时定义为准静风[14]。本研究采用第一种方法。由于小风属于极端天气,在该天气状况下,VOCs的扩散呈现一定特殊性。
常用于处理污染物扩散规律的高斯烟羽模型适用于风速u大于1.0 m·s−1的条件,最好是在流场均匀定常且风速大于1.5 m·s−1的气象条件下。而在小风气象条件下,虽然其污染方向与有风模式都为下风向,并且二者地面浓度分布在图形上相似,但是在x方向即平均风向的湍流扩散速率远小于平均风速的平流输送速率的这一假设不能成立,这使得高斯扩散模型无法处理小风条件下的VOCs扩散情况[14]。在小风条件下,污染物VOCs扩散需考虑不稳定风场使得烟流活动不规则的情形,而烟团积分模式可很好地分析不稳定风场对VOCs扩散的影响[15]。因此,基于烟团扩散模式构建了小风条件下的工业园区VOCs扩散的浓度预测模型。烟团积分模式的数学描述如后文所示。
在无界无风条件下,假设某污染点源释放了一个VOCs烟团,在 x、y、z 3个方向上的扩散都呈正态分布,则该烟团中心会一直保持与释放点源重合。以烟团释放点为坐标原点建立坐标系,经过时间t后,该VOCs烟团对空间中某点(x,y,z)的VOCs贡献可依据式(1)计算。
式中:Qi为VOCs烟团质量浓度,μg·s−1;σx、σy、σz分别为x、y、z方向上的扩散参数,m;t为烟团运行时间,s。
而在无界有风条件下,VOCs烟团会沿风向移动。假定风向为x方向、风速为u,则烟团中心会沿x方向相对于VOCs烟团释放点移动ut距离。若以烟团中心为相对坐标系,则空间中某点坐标可表示为(x-ut,y,z)。此烟团对下风向监测点的VOCs质量浓度贡献可依据式(2)计算。
在有界有风条件下,做出如下假设:1)不考虑地面对VOCs吸附和吸收作用;2)不考虑VOCs的沉降作用;3)认为地面对VOCs的散布具有全反射的作用;4)不考虑VOCs烟团的抬升高度。因此,在有界有风条件下,VOCs烟团到下风向监测点的浓度贡献可依据式(3)计算。
式中:H为有效点源高度,m。
进一步地,将烟团积分扩散模式拓展到小风气象条件下连续点源的扩散中。假定点源排放源强为Q,则可把在△t时间段内排放的VOCs视为一个烟团,依据式(4)可计算经过时间△t后烟团在下风向监测点处的瞬时浓度。
连续点源到下风向监测点处的质量浓度,可看作是在一定时间段t内连续释放的VOCs烟团对此下风向监测点的质量浓度总贡献。因此,根据式(4)对t进行积分,得到连续点源在小风场景下的扩散模型,如式(5)所示。
当Z=0时,即可推导出污染物VOCs地面浓度表达式(6)。
在烟团扩散污染物浓度的计算中,需确定在x、y、z 3个方向上的扩散系数,即σx(t)、σy(t)和σz(t)。其中,t表示该烟团的存在时间或者该烟团从释放到当前的运行时间。当大气稳定度用P-S方法分为6类时,扩散参数表示为σx=σy=γ1t,σz=γ2t。t的单位为s。γ1、γ2在表1中选取[15]。
由表1可得到小风气象条件下,x、y、z 3个方向上扩散系数计算方法的参数值。结合式(6),能计算出在小风条件下污染物VOCs对下风向监测点的质量浓度贡献。
-
能较准确地模拟面源污染物分布的计算方法主要有2种。一种是由Hanna和Gifford提出的大气湍流与扩散实验室模式(Atmospheric Turbulence and Diffusion Laboratory),即ATDL模式或者窄烟云模式。由于其形式简单计算方便,过去常被用于计算城市面源[16]。该模式基于高斯正态烟羽模型推导出简化模式,并没有对小静风这一气象条件进行考虑,故不能做小风条件下的污染物浓度计算。另一种计算方法是虚拟点源后置法,目前被广泛用于各种面源计算中[17]。该方法不仅适用于有风条件下的面源计算,而且也可用于小静风气象条件下的面源计算。在有风气象条件下对面源进行计算时,重点是为了求排放面源中心点位向上风向推移的虚点源距离[15]。而在小风条件下对面源进行计算时,点源后置法重点是为了求瞬时烟团从面源中心点排放后增加的一个虚拟排放时间[16]。
对小风条件下的无组织VOCs排放面源进行研究,假设条件为:1)面源内部VOCs是均匀排放的;2)面源可看作是由许多面积很小的面源单元组成;3)高斯面源扩散虚拟点源后置法即增加了一个初始的扩散系数(σy0和σz0)。
在小风条件下,面源计算采用烟团扩散模式。相比于针对高架点源的扩散模型,烟团积分面源扩散虚拟点源法相当于瞬时烟团从面源中心点排放后,增加了一个初始虚拟排放时间。如当第一个瞬时烟团释放后,以瞬时烟团中心浓度的1/10作为烟团的可见边缘,而烟团的边缘恰好与面源相等。采用反时间扩散参数,可求出增加的初始虚拟排放时间[18]。
若扩散参数为σ=γt的形式,则虚拟排放时间可以式(7)~(8)表示。
因此,可,根据式(6)得到小风条件下面源的扩散模型(式(9)),参数见式(10)。
式中:σxm为顺风向的扩散参数(=σym),m;σym为横风向的扩散参数,m;σzm为垂直方向的扩散参数。
-
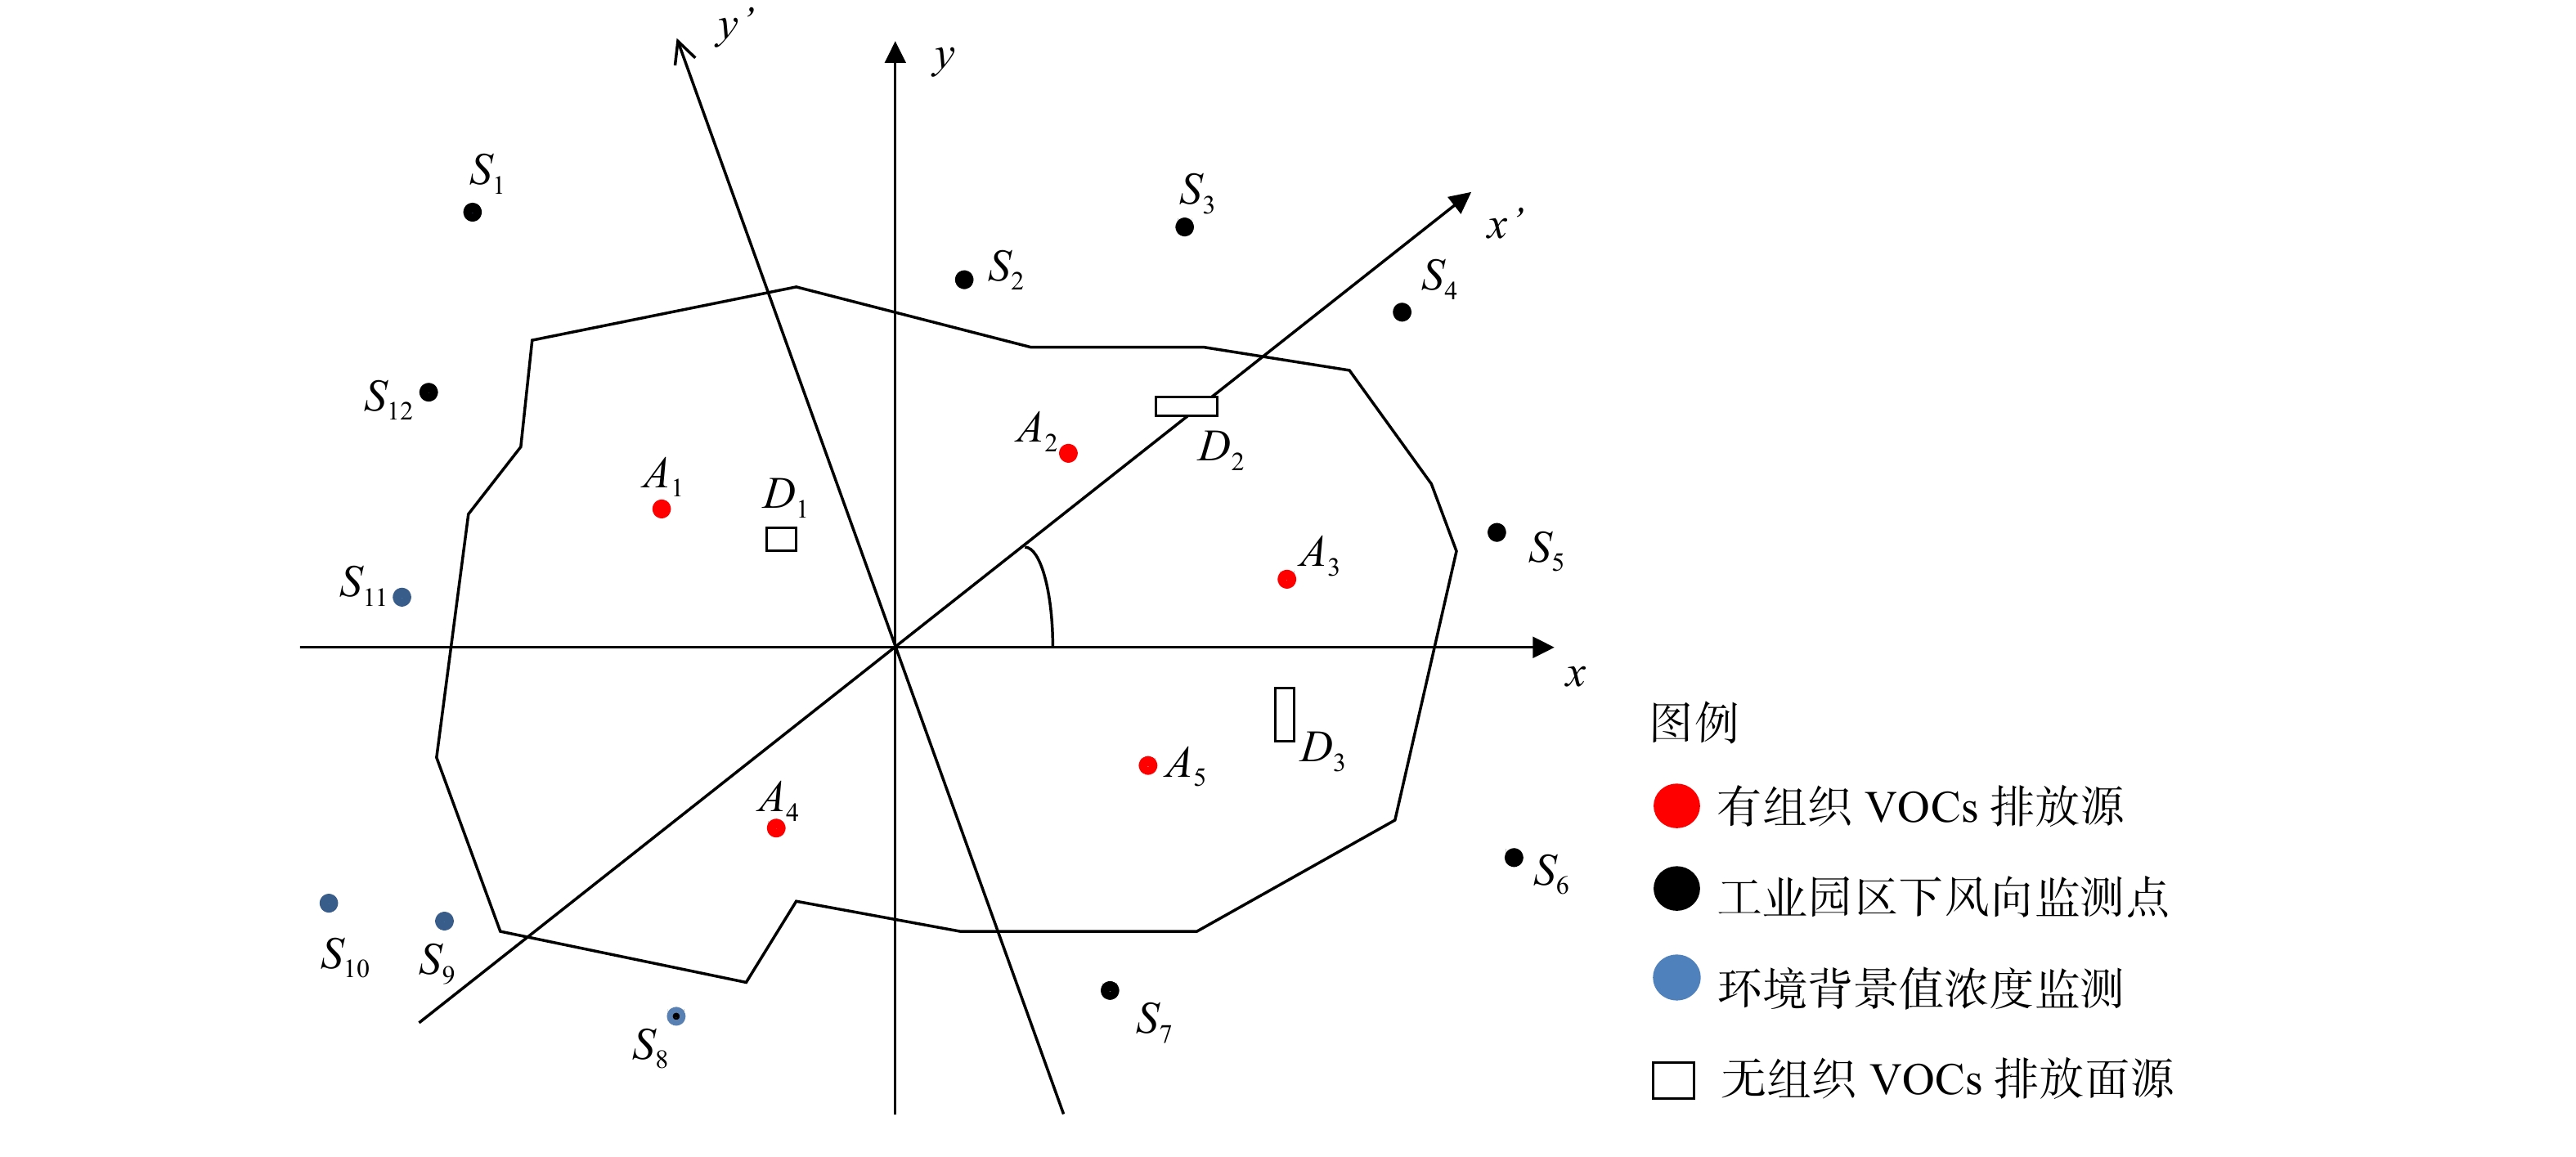
首先,对所选定的工业园区进行剖析。将该园区的中心位置设定为坐标原点O(0,0,0)。z轴为垂直于x、y轴所在平面,加上x、y轴来建立笛卡尔坐标系。原点O的正东方即x轴的正向轴、正北方即y轴正向轴。由此定义工业园区内的有组织排放源分别为Ar(r=1,2,…,R),工业园区的周围监测点分别为Sm分别为(m=1,2,…,M),无组织面源排放点分别为St(t=1,2,…,T)。图1表明了园区内各排放源在x、y轴所在平面的位置。其中,r为有组织排放源的编号,R为整个工业园区内有组织排放源的总个数;m为监测点的编号,M为整个工业园区周边监测点的总个数;t表示无组织面源的编号,T为整个工业园区内无组织面源的总个数[19]。
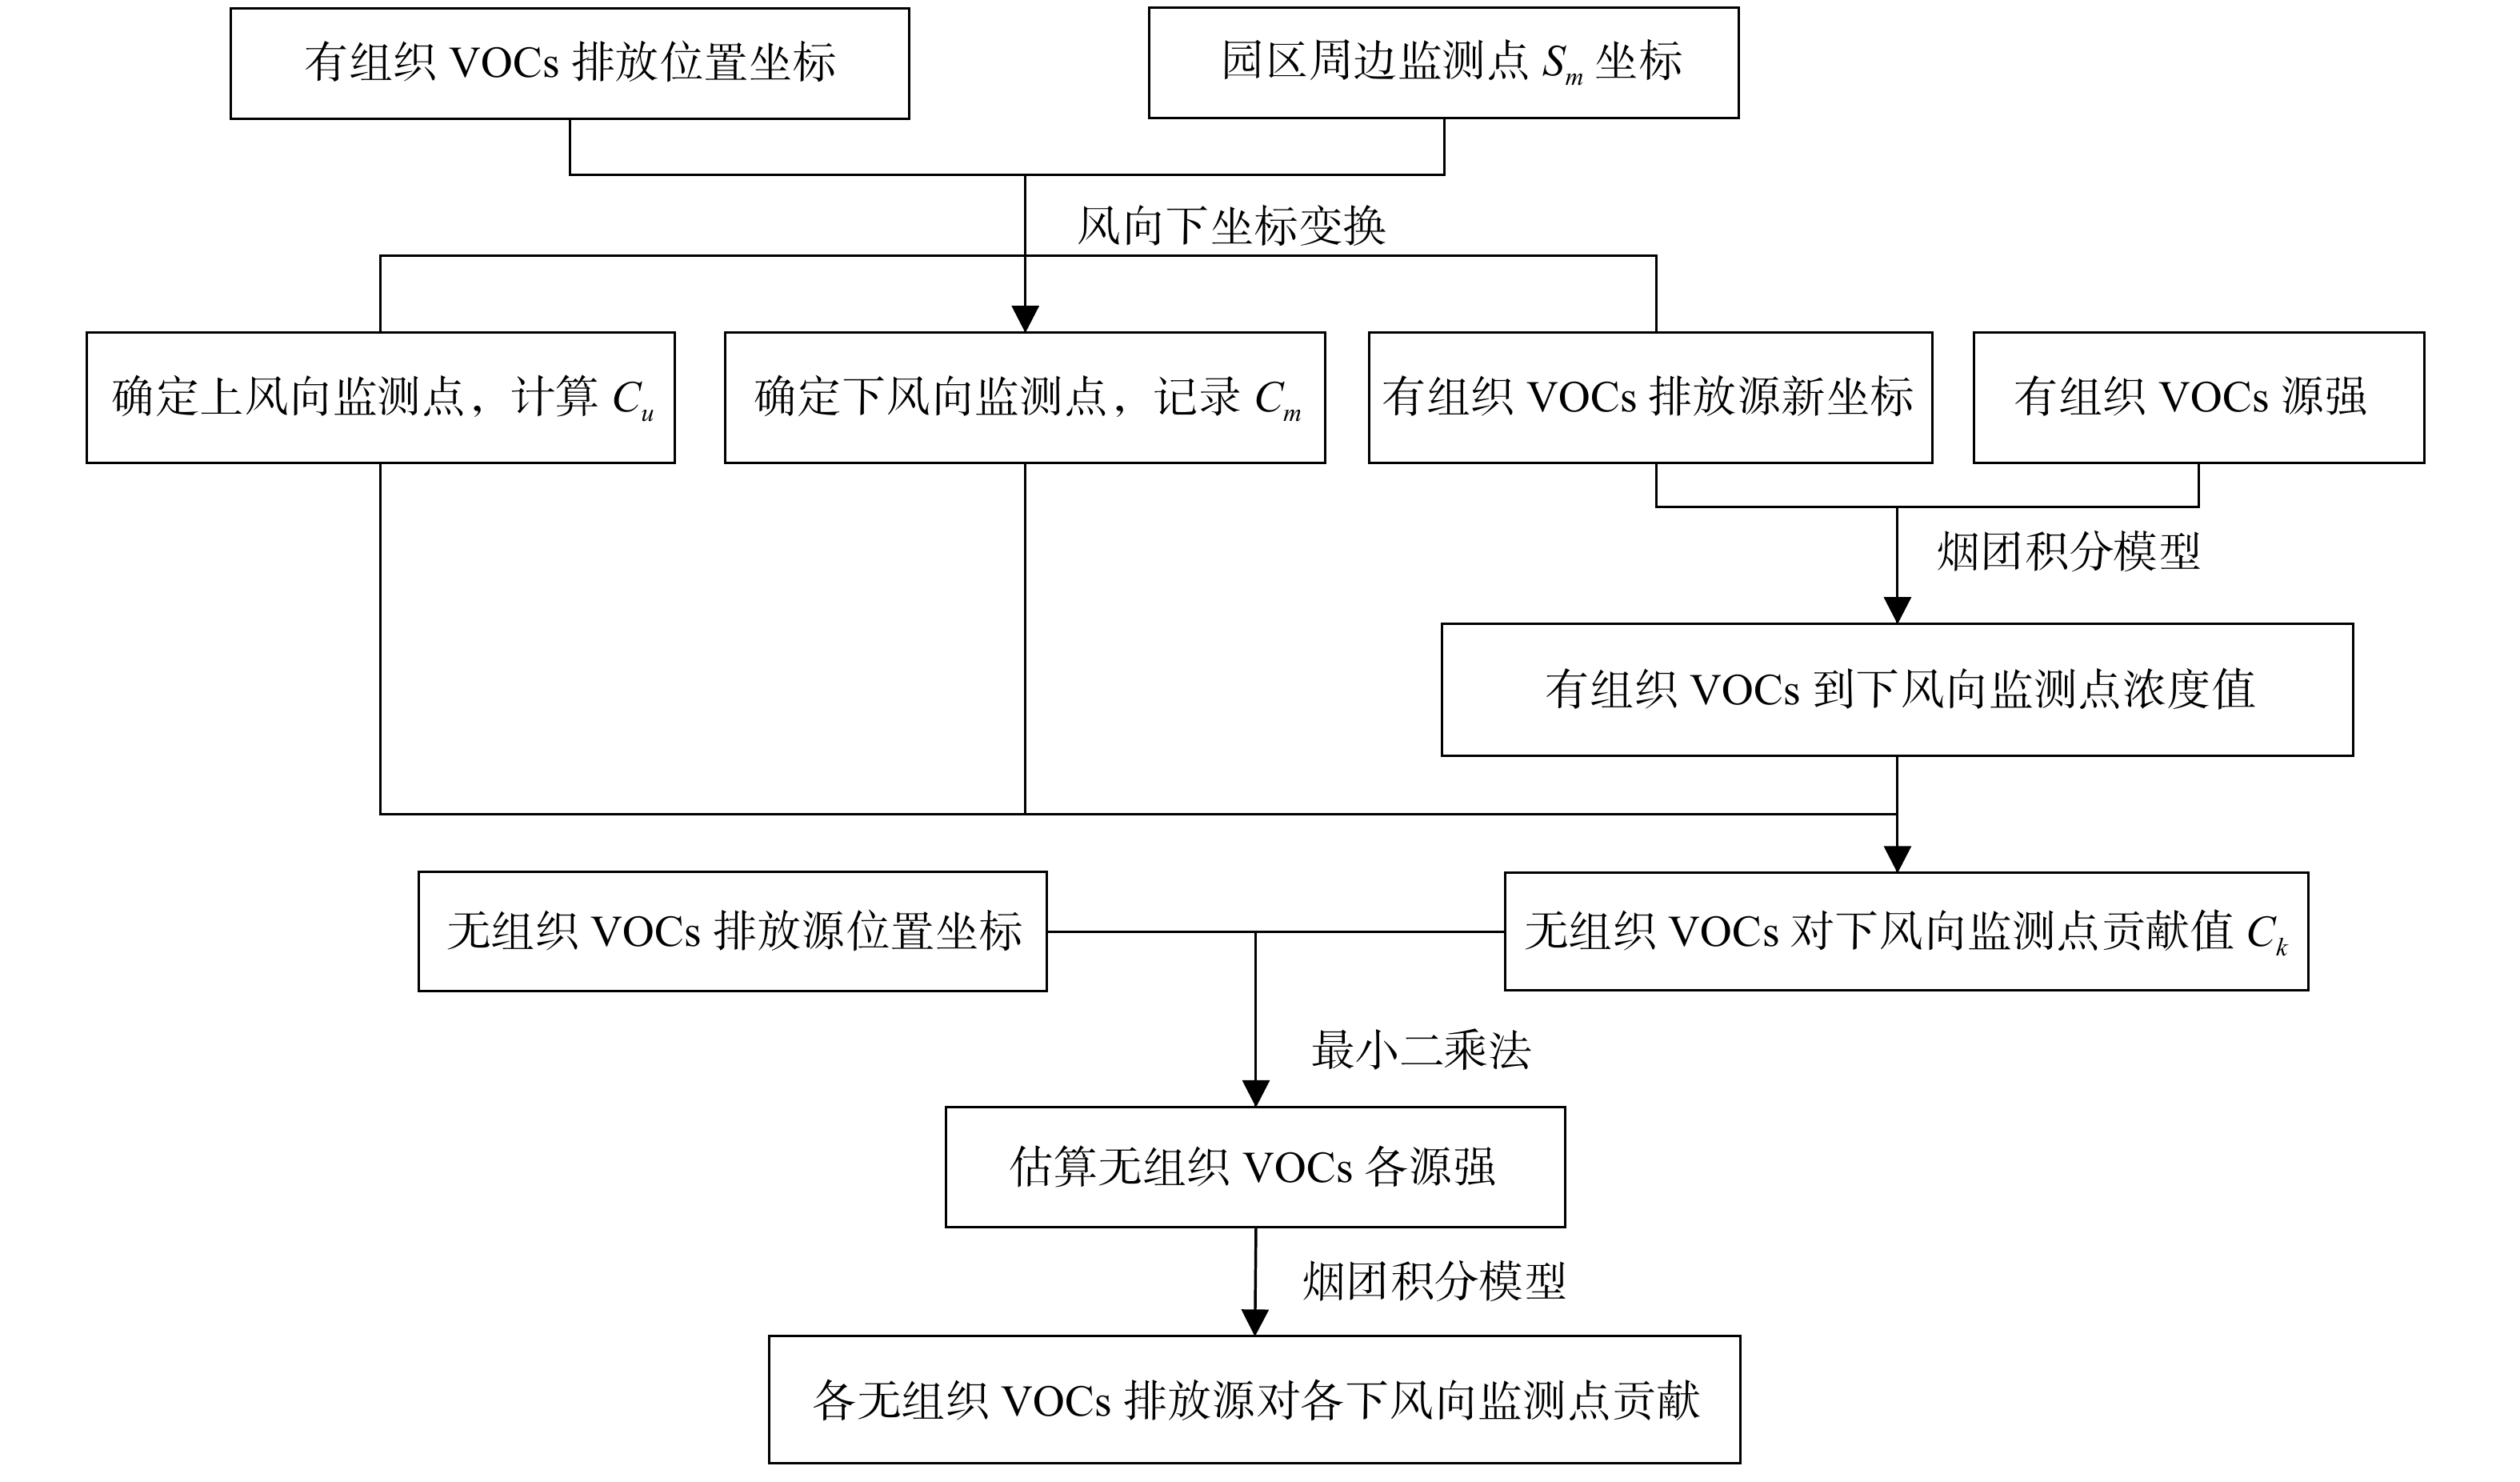
小风条件下工业园区VOCs排放场景如图1所示。为明确小风条件下,下风向监测点的无组织排放源在哪个点(Dt)。首先,应确定无组织面源Dt的排放源强,而无组织VOCs排放在空气中量化是非常困难的,因此考虑通过已知资料来反推无组织排放的VOCs源强。由于下风向监测点监测到的总挥发性有机物(total volatile organic compounds,TVOCs)主要由3部分组成:VOCs环境背景值,有组织排放源和无组织排放源分别对园区下风向监测点的贡献值。TVOCs和园区背景值,以及计算得到的有组织排放源对下风向监测点贡献值,则得到无组织排放源对监测点的贡献,然后基于无组织排放源对监测点贡献,反推无组织排放源强[19]。本研究基于工业园区VOCs环境背景值Cu、园区下风向监测点TVOCs(Cm)、有组织VOCs排放源的源强及位置,以及扩散模式反推法来构建小风条件下无组织VOCs排放溯源模型(图2)。
-
随着风向的变化,园区的下风向监测点亦会改变。因此,为了能快速确定风向角θ,以便准确计算下风向监测点的VOCs质量,从而区分出上下风向的监测点。图1表明,该黑圆点Sv(1≤v≤M)属于园区下风向监测点,而蓝色圆点Su(1≤u≤M)为园区的上风向监测点,用来计算园区的环境背景值浓度。本课题组提出了一种方法以快速确定工业园区上下风向监测点,即规定沿逆时针方向(以正东向为起点)转动的角度称为风向角,记为θ(0。≤θ≤360。)。此时x正向轴与风向相同,也就是将原坐标系整体绕z轴旋转了θ度。将按照上述方法,得到有组织排放源Ar新的位置坐标(
x′Ar,y′Ar,z′Ar )表达式(式(11))。相应的监测点位Sm新位置坐标(x′Sm,y′Sm,z′Sm )的表达式为式(12)。对于工业园区中的一个污染源Ai,当园区周边监测点的横坐标
x′Sm 小于污染源Ai的横坐标x′Ai 时,对应的监测点为该污染源Ai的上风向监测点Su;而当监测点的横坐标x′Sm 小于园区内所有污染源的横坐标时,则将其定为这一园区的上风向监测点位,也就是工业园区背景值浓度的监测点。 -
园区内有组织排放源Ar的位置坐标和排放源强
QAr ,可通过对各企业进行监测分析得到。将超过15 m、且集中有规则排放的污染源称为有组织排放源。故选用针对于高架点源的烟团积分模式扩散模型来对计算有组织排放源Ar扩散到下风向监测点Sv的浓度值Cl,其计算公式见式(13)。在笛卡尔坐标体系下,当风向角为θ时,有组织VOCs排放源Ar和监测点Sm的位置坐标会转化为新的坐标,此时以工业园区的中心为坐标原点建立坐标系,计算小风条件下有组织VOCs排放源Ar到下风向监测点的浓度值Cl,计算式如式(14)所示。
式中:H为有组织排放源的有效源高,排放源到原点O点的垂直距离
zAr等于H ,m;(x′Sv−x′Ar−ut )为下风方向监测点S v到有组织VOCs排放源的距离,m;(y′Sv−y′Ar )为横向距离,m;z′Sv 为垂直地面的距离,m;σ′xSv 为x轴方向的扩散系数,m;σy′Sv 为y轴方向的扩散系数,m;σz′Sv 为z轴方向的扩散系数,m。实际上,小风气象条件不可能是无限时长,只需取当前时刻之前1 h时长即可获得较为准确的监测点污染物小时质量浓度均值,故式(10)中的积分上下限可换成有限区间。为提高计算速度,采用Matlab基于烟团的积分模式即可对有组织VOCs排放源到下风向监测点的浓度值进行计算。此处的数值积分可采用Simpson(辛普森法)。
-
在风向角为θ的情况下,根据式(12)转换监测点位Sm的坐标(
xSm,ySm,zSm ),以获得新的位置坐标(x′Sm,y′Sm,z′Sm )。x′Sm 的定义为园区内所有污染源的横坐标的最小值,故其为背景值浓度的监测点。为了减小误差,对各背景值监测点的数据进行求和,计算平均值得到环境背景浓度值,记为Cu(见式(15))。式中:W为背景值浓度监测点的有效个数。Cm表示下风向监测点的TVOCs,根据式(14)得到有组织排放源Ar扩散到下风向监测点位的Cl,从而推出小风条件下无组织排放源扩散到下风向监测点浓度值,即Ck,计算式见式(16)。
-
由于虚拟点源后置法是以正方形的单位面源为研究对象,并且必须确定其中心位置。在园区内,一般将无组织排放面源形状确定为长方形。为提高计算精度,将单位面源的边长L定义为无组织排放面源长方形的长宽最大公约数
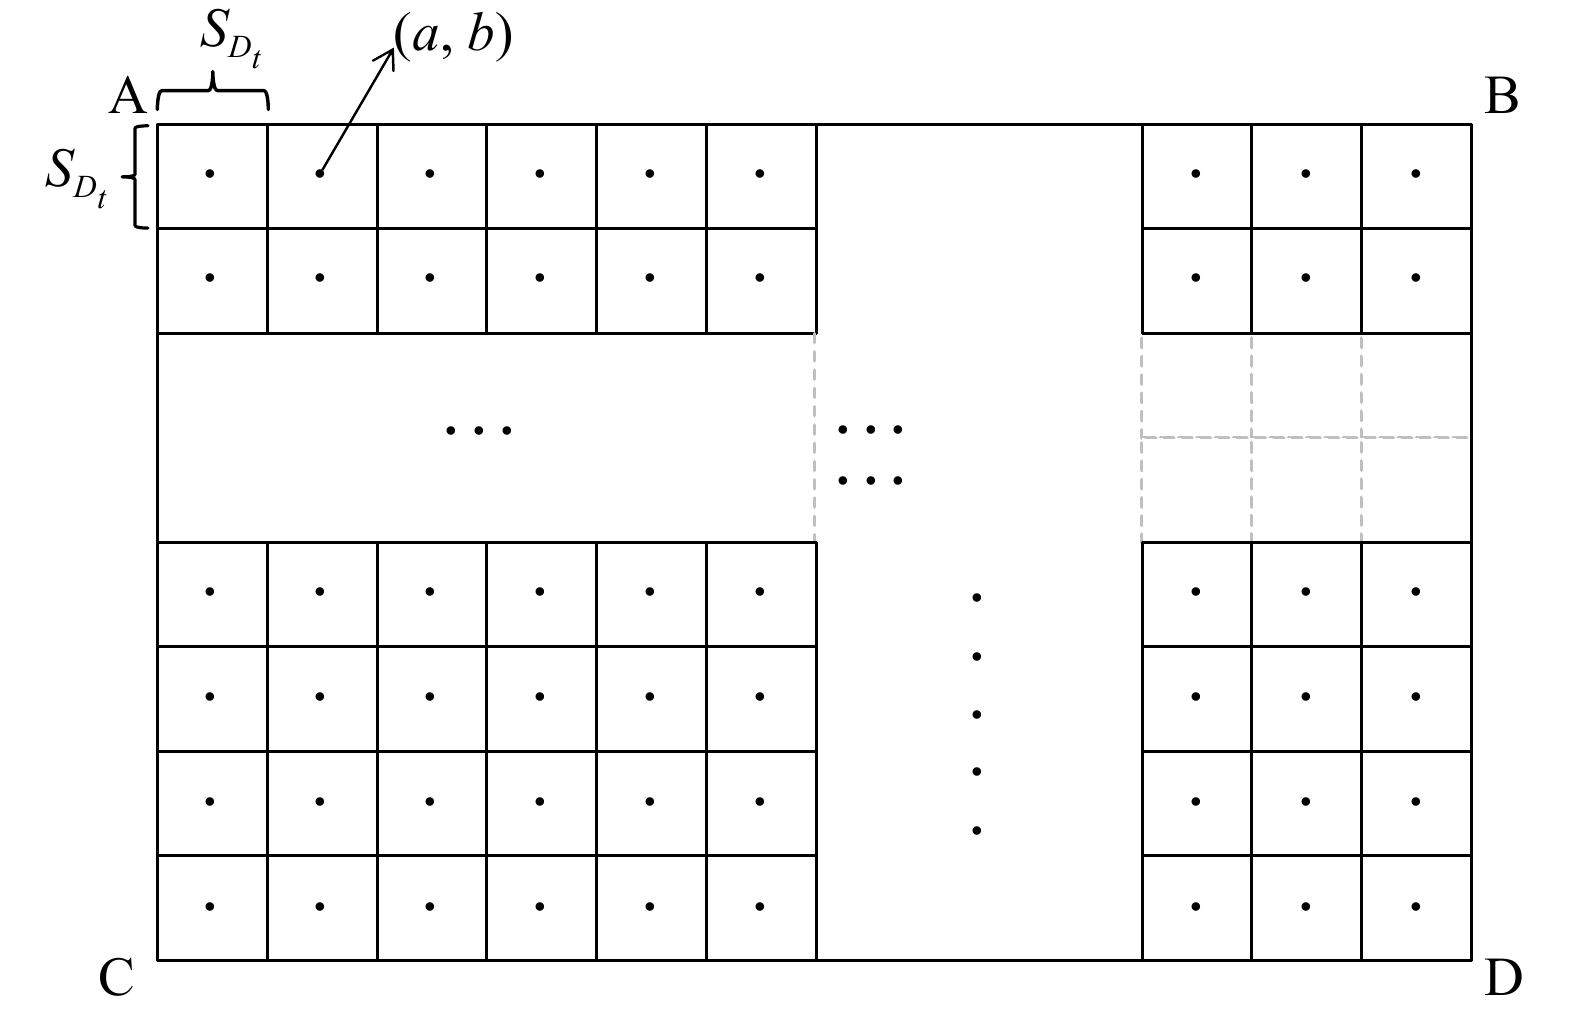
sDt ,并以L等分无组织排放面源,每个单位面源即为单位研究对象。为方便计算,首先需计算出各单位面源的中心位置坐标,计算步骤如下。1)在原始坐标系下确定出各无组织VOCs排放面源(Dt)顶点的位置坐标,并将其按逆时针顺序排列为A(
xDAt,yDAt,0 )、B(xDBt,yDBt,0 )、D(xDDt,yDDt,0 )、C(xDCt,yDCt,0 )。2)利用面源的顶点坐标得到各面源Dt的长
aDt 和宽bDt ,计算aDt 、bDt 的最大公约数sDt ,再将Dt分成m个相等面源,以得到各单位面源的中心位置坐标(xDabt,yDabt,0 )(图3)。中心坐标计算公式见式(17)~(18)。式中:i表示宽
bDt 可被分成相等的sDt 分成相等的i份;j表示长aDt 可被分成相等的j份,长度亦为sDt ;单位面源所在行为a;单位面源所在列为b;无组织面源Dt中的第(a,b)个单位面源定义为ab;等分成面积相等的正方形个数即m。步长d = L/2。3)当风向角为θ时,(
xDabt,yDabt,0 )会按式(11)变换成(x′Dabt,y′Dabt,0 )。因每个无组织VOCs排放面源按各自边界长宽的最大公约数,会被等分成m个单位面源,因此,计算得到的在第t个无组织面源中,第(a,b)个单位面源到下风向监测点的浓度值为
CDabt ,计算式见式(19)。通过式(19)计算面源单元到工业园区下风向监测点的VOCs质量浓度。计算无组织面源Dt到工业园区下风向监测点的浓度值时,只需对该无组织面源Dt的m个面源单元到监测点的浓度值进行叠加即可(见式(20))。
-
由于无组织VOCs面源的排放源强很难直接准确监测,故在无组织VOCs溯源过程中,通过反向计算,得到无组织面源排放源强。式(16)可计算无组织VOCs排放源对监测点的浓度贡献Ck,而无组织面源Dt的位置坐标可通过调研工业园区相关资料得到,然后通过反算模型求解排放面源的源强。
假定园区内总污染源有T个,并在园区周边设定V个监测点。K则反映了某污染源与某监测点的浓度值响应关系。监测点数据为各无组织排放源贡献总和,故上述过程可用式(21)来描述,另可将式(21)展开为矩阵形式(式(22))。
式中:Q为源强,μg·s−1;
Cvk 为监测点的测定值,μg·m−3。Qt为第t个无组织污染面源的排放源强,μg·s−1;Cvk 为无组织排放源对第v号监测点质量浓度的贡献,μg·m−3;Kvt为第v号监测点浓度与第t个污染源排放源强的响应关系(计算式见式(19))。以无组织面源Dt的长
aDt 与宽bDt 最大公约数为边长,将无组织排放面源等分成m个源强为QDabt 的单位面源。其中,QDabt=QDt/QDtmm ,每个小正方形(a,b)对监测点的浓度贡献值可通过式(19)得到,并通过式(23)计算Kvt。故式(23)可推导为式(24)。
在T=V的情况下,可直接列式然后对方程组进行求解。但实际情况下,总的监测点数目要比污染源的数目多,也就是T<V,可列式构成一组超定方程组。因此,采用最小二乘法对超定方程组求解。由于难以量化空气中的无组织排放源强,故以园区下风向监测点监测到的TVOCs、环境背景值和计算得到的有组织排放源对下风向监测点的贡献值来推算无组织排放源对各监测点贡献值,并以此作为无组织排放的实际源强,再反演出无组织排放源源强,从而得到无组织排放源到下风向监测点的理论计算值。用式(25)分析理论值与实际值间的偏差。为了便于计算,采用Matlab编制程序对超定方程组进行求解。式(25)中
Ciz 表示所有无组织VOCs到监测点i的计算浓度值之和。 -
利用上述方法,可以得到各无组织VOCs的排放源强,然后通过烟团积分模型,计算出各污染源对各监测点的浓度贡献。假定工业园区中有T个无组织VOCs的排放源,需在小风条件下对各无组织VOCs排放源到每个监测点的浓度贡献比例进行计算和分析,用pi进行表示,其中1≤i≤V。
根据前文提出的计算无组织排放源强的方法,可计算T个无组织排放源强(
QD1 ,QD2 ,…,QDT )。以第i个无组织排放源为例,如果仅考虑第i个排放源对第j个监测点的贡献,则第j个监测点的污染物质量浓度仅受第i个排放源影响。假定在某场景中,第i个无组织排放源强Qi未改变,而其他无组织排放源强设为0,即QD1 =QD2 =…=QDi−1 =QDi+1 …=QDT =0,再根据小风条件烟团积分模型,即得到第i个无组织排放源对第j个监测点的贡献Cij(计算式为式(26))。式中:f为烟团积分模型;Pmete为气象相关参数。
基于以上思路构建T-1个相似情景,分别仅考虑某个无组织排放源对监测点j的影响,而其他未被考虑排放源源强为0[20],即得到其他排放源对监测点j的贡献值(计算式为式(27))。
各无组织VOCs排放源对监测点j的污染物浓度的贡献比例计算如式(28)所示。
-
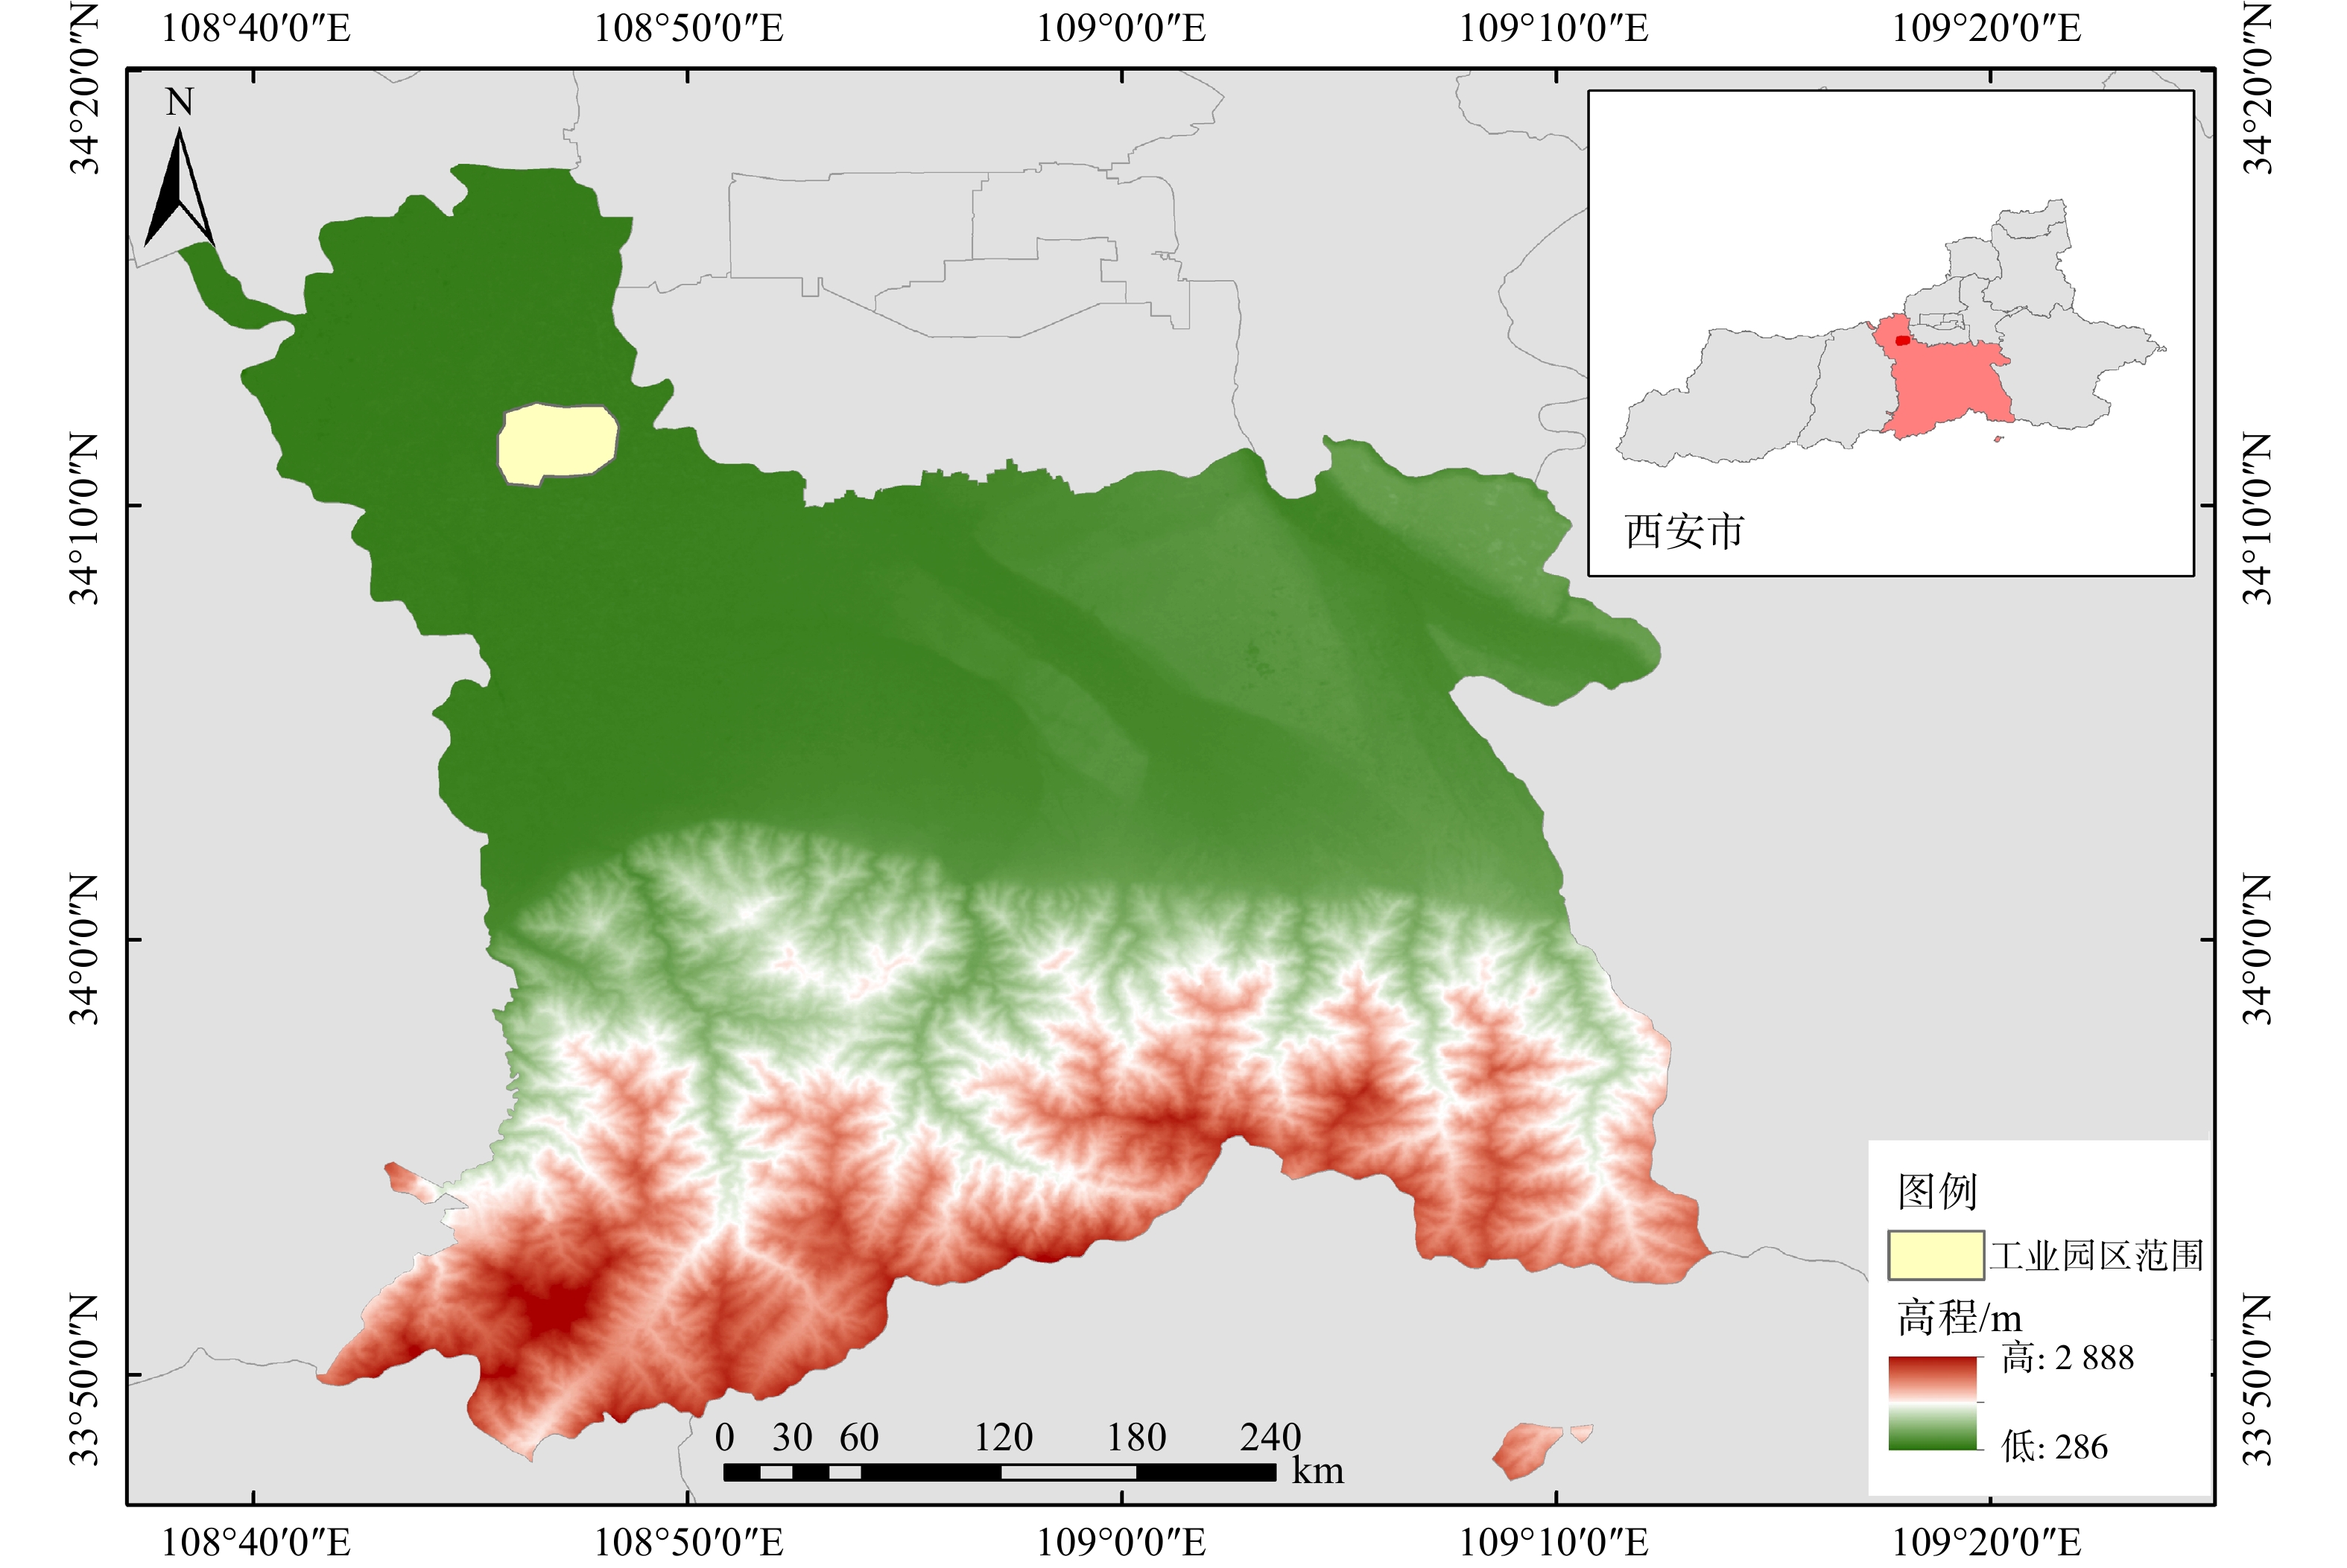
图4为西安市某工业园区所在区位的ArcGIS图,展示了工业园区所在地形地势。案例分析所用数据中,有组织排放源强数据来自企业年报,园区周边监测点坐标来源于国家环境空气质量监测网和地方统计年鉴;监测点TVOCs来源于国家环境空气质量监测网和天气后报网站;气象数据来自于美国国家气候数据中心;污染源位置坐标来自企业披露公开信息。
所选工业园区内各VOCs排放源所在位置坐标参数介绍如下。建立笛卡尔坐标系,坐标原点即工业园区中心,x正轴为地理正东方向,y轴正向为地理正北方。将各排放源及监测点的位置在坐标系中进行标记,如图1所示。园区内部共有5个有组织排放点源(表2),共有12个厂界监测点(表3)。另外,还有3个无组织排放面源。面源D1的长为67 m,宽为67 m;面源D2的长为219 m,宽为54 m;面源D3的长为60 m,宽为40 m;排放面源Dt顶点坐标的见表4。
-
分析园区2020年9月5日10:30—11:30的监测数据。此时为小风条件:大气稳定度为B,平均风速为0.9 m·s−1,扩散参数的系数γ1=0.56、γ2=0.47。这一时段内主导风向为NE,即就是正东方逆时针旋转45。,如图1所示。通过式(11)~(12)可以得到有组织VOCs排放点源Ar及园区周边监测点位置Sm的新坐标(见表5和表6)。
排放点源Ar的逐小时排放源强
QA1 依次为2.4 g·s−1、2.0 g·s−1、3.0 g·s−1、3.5 g·s−1和2.5 g·s−1。通过式(14)可计算出排放源Ar扩散到下风向监测点Sv(v=1,2,3,4,5,6,7,12)的质量浓度值Cl,结果见表7。 -
经过分析比较,可得到园区背景浓度监测点为S8、S9、S10、S11,对应质量浓度分别为0.06 μg·m−3、0.04 μg·m−3、0.14 μg·m−3和0.08 μg·m−3。另外,还要舍去明显高于其他监测点的数据,如10号监测点数据。根据公式(15),可求得背景质量浓度Cu为0.06 μg·m−3。此时,园区的下风向监测点对应的VOCs监测值如表8所示,其中,Ck根据式(16)求得。
此时,工业园区的下风向监测点为S1、S2、S3、S4、S5、S6、S7、S12,其对应VOCs监测值如表8所示。其中,Cl根据3.2.1计算,Ck根据式(12)求得。
-
表4为面源D1、D2、D3的顶点坐标。将D1、D2、D3按照各自面源长宽的最大公约数进行等分。由式(17)、(18)求出xoy坐标系下各单位面源中心坐标,进一步通过坐标变换公式求出x’oy’坐标系下单位面源的新坐标,结果如表9所示。
-
该园区内有D1、D2、D3三个无组织VOCs污染源。D1视为单位面源,其源强为
QD1 ;D2可划分为4个单位面源,每个源强为QD2/QD244 ;D3划分为6单位面源,每个源强为QD3/QD366 。首先计算出第v号下风向监测点污染物质量浓度与各单位面源源强的比例系数(1≤a≤i;1≤b≤j),然后求和得到第v号监测点浓度与面源D1、D2、D3的比例系数Kvt(表10),最后根据式(24)建立方程组式(29)。式(29)采用最小二乘法求解,得出了无组织排放面源D1、D2、D3的源强分别为4 855 700、2 810 960和3 484 740 μg·s−1,并计算得到误差平方和R为0.001 5。
-
面源D1、D2、D3的排放源强估算值、监测点测得污染物质量浓度及面源源强系数Kvt可由式(24)计算。第i个无组织排放源对第j个工业园区下风向监测点的贡献值Cij(表11)根据式(26)计算。各无组织排放源对下风向监测点j的污染物贡献比例根据式(28)计算(表12)。
表12中数据表明,在小风条件下污染物扩散有明确的方向性,其地面浓度分布与有风模式地面浓度分布相似,但也兼具各方向扩散现象[17]。在D1的上风向监测点S7、S12,也监测到来自D1的污染物。在D1下风向监测点S2、S3距离很近,监测到的污染物浓度较高,与上述结论相符。D2的上风向监测点为S1、S2、S6、S7、S12,监测到了很少量来自于D2的污染物,而S3、S4、S5监测到的污染物浓度明显较高,亦验证了以上结论。同样,在D3的上风向监测点S1、S7、S8也监测到了很少量来自于D3的污染物,且距离D3最近的下风向监测点S5污染物浓度最高。
-
1)选取工业园区作为研究对象,根据园区内部各VOCs排放源特点以及园区周边监测点监测值,通过小风条件下烟团积分扩散模式反推法构建工业园区无组织VOCs溯源模型,反算无组织VOCs排放源排放源强,进而求出下风向各监测点无组织VOCs排放源的浓度贡献。该方法即小风条件下,无组织VOCs排放溯源解析法。
2)距离污染源较近的下风向监测点监测到的VOCs浓度较高,而上风向监测点也监测到少量VOCs。在小风条件下,污染物扩散具有明确方向性同时兼具各方向扩散的现象。
小风条件下工业园区无组织VOCs溯源方法
Research on traceability method of unorganized VOCs emission in industrial park under low wind condition
-
摘要: 为在小风条件下对工业园区周边监测点的无组织VOCs来源进行溯源解析,建立了以烟团积分扩散模型为基础的工业园区无组织VOCs排放溯源模型。通过小风条件下烟团积分扩散模型,计算有组织VOCs排放源对园区下风向监测点的VOCs质量浓度贡献;并结合上风向监测点背景值(VOCs)及下风向监测点质量浓度值(TVOCs),计算无组织排放源对下风向监测点的质量浓度贡献。根据无组织VOCs排放面源的位置坐标,利用小风条件下烟团积分扩散模型,建立无组织排放源与下风向监测点之间的响应模型;再利用最小二乘法反演出各无组织面源的VOCs排放强度,最后得到VOCs从各无组织排放源到下风向监测点的质量浓度和各监测点的浓度贡献比。在此基础上,推断出各监测点的无组织VOCs来源。溯源结果说明:在监测点S1,无组织排放源D1的污染物贡献率为25.71%,D2的污染物贡献率为5.24%,D3的污染物贡献率为3.81%;在监测点S4,无组织排放源D1的污染物贡献率为14.59%,D2的污染物贡献率为36.31%,D3的污染物贡献率为4.83%;在监测点S12,无组织排放源D1的污染物贡献率为20.17%, D2的污染物贡献率为0.33%,D3的污染物贡献率为0.39%。统计结果表明,工业园区无组织VOCs的理论计算值与实际值的误差平方和 R为0.001 5。本研究结果可为小风条件下工业园区无组织VOCs排放溯源解析提供参考。Abstract: In order to trace and analyze the source of unorganized VOCs from monitoring points around the industrial park under the condition of low wind and quickly locate the pollution source, a traceability model of unorganized VOCs emissions from the industrial park was established based on the smoke integral diffusion model backward method. Firstly, the concentration contribution value of organized VOCs emission source to downwind monitoring point in industrial park was calculated by smoke cluster integral diffusion model under low wind condition. The contribution value of unorganized VOCs emission source to downwind monitoring point was calculated according to the TVOCs value of downwind monitoring point and VOCs environmental background value of upwind monitoring point. Then combined with the location coordinates of the disorganized VOCs emission point source, the relationship between disorganized VOCs emission source and downwind monitoring point was established by using the smoke cluster integral diffusion model under low wind condition, and the emission source strength of each disorganized VOCs emission point source was calculated by using the least square method. Finally, the concentration of each unorganized VOCs emission source to the downwind monitoring point and the concentration contribution ratio to the monitoring point are calculated. The results can clearly infer the source of unorganized VOCs at each monitoring point. In this case, at the monitoring site S1, 25.71% of the pollutants come from the disorganized VOCs emission source D1, 5.24% from D2, and 3.81% from D3. In S4, 14.59% were derived from D1, 36.31% from D2, and 4.83% from D3. In monitoring site S12, 20.17% came from D1, 0.33% from D2 and 0.39% from D3. The sum of squares of error R between the theoretical calculated value and the actual value of unorganized VOCs in industrial park is 0.0015. This study provides a new idea for the traceability analysis of unorganized VOCs emissions from industrial parks.
-
Key words:
- industrial park /
- unorganized VOCs /
- Gaussian Diffusion Model /
- least squares method
-
表 1 小风和静风扩散参数的系数
Table 1. Coefficient of diffusion parameters of low wind and still wind
稳定度/(P·S) γ1 γ2 u<0.5 m·s−1 0.5 m·s−1≤ u≤1.5 m·s−1 u<0.5 m·s−1 0.5 m·s−1≤ u≤1.5 m·s−1 A 0.93 0.76 0.15 1.57 B 0.76 0.56 0.47 0.47 C 0.55 0.35 0.21 0.21 D 0.47 0.27 0.12 0.12 E 0.44 0.24 0.07 0.07 F 0.44 0.24 0.05 0.05 表 2 园区内有组织排放点源Ar的位置坐标
Table 2. Ar coordinates of organized VOCs emission point sources
序号 用户坐标x/m 用户坐标y/m 有效源高H/m 1 −1 115 655 20 2 656 783 30 3 1 373 326 18 4 −581 −840 20 5 1 013 −726 25 表 3 工业园区周边监测点Sm的位置坐标
Table 3. Location coordinates of Sm at monitoring points
序号 用户坐标x/m 用户坐标y/m 1 −2 058 2 070 2 304 1538 3 1 048 1 903 4 1 990 1 504 5 2 174 564 6 2 213 −962 7 966 −1 548 8 −906 −1 649 9 −2 084 −1 445 10 −2 307 −1 322 11 −2 226 256 12 −2 142 996 表 4 园区内无组织排放面源Dt的顶点坐标
Table 4. Vertex coordinates of Dt from unorganized VOCs emission point source
序号 顶点A坐标/m 顶点B坐标/m 顶点C坐标/m 顶点D坐标/m 1 (−637,612) (−570,612) (−637,545) (−570,545) 2 (1 033,970) (1 252,970) (1 033,916) (1 252,916) 3 (1 360,−426) (1 420,−426) (1 360,−466) (1 420,−466) 表 5 园区内有组织VOCs排放点源Ar位置的新坐标
Table 5. New coordinates of Ar location of organized VOCs emission point sources
序号 用户坐标x/m 用户坐标y/m 有效源高H/m 1 −325 1 252 20 2 1 018 90 30 3 1 201 −740 18 4 −1 005 −183 20 5 203 −1 230 25 表 6 工业园区周边监测点Sm的新位置坐标
Table 6. New location coordinates of monitoring point Sm
序号 用户坐标x/m 用户坐标y/m 1 8 2 919 2 1 303 873 3 1 514 32 4 2 471 344 5 1 936 −1138 6 885 −2 245 7 −412 −1 778 8 −1 807 −525 9 −2 495 452 10 −2 566 697 11 −1 393 1 755 12 −810 2 219 表 7 有组织排放源到下风向监测点的质量浓度
Table 7. VOCs pollution sources are organized to downwind monitoring point quality concentrations
μg·m−3 污染源 监测点 S1 S2 S3 S4 S5 S6 S7 S12 A1 0.071 6 0.820 6 0.266 7 0.200 3 0.051 4 0.008 2 0.005 7 0.052 4 A2 0.001 9 0.435 3 8.502 0 0.926 3 0.238 5 0.011 8 0.002 6 0.001 0 A3 7.68E-04 0.0723 0.713 3 0.493 6 3.099 9 0.043 4 0.005 2 5.06E-04 A4 0.019 3 0.364 4 0.511 9 0.203 2 0.254 2 0.119 4 0.158 0 0.027 7 A5 0.001 1 0.066 6 0.297 0 0.150 7 0.862 3 0.433 4 0.063 1 0.001 1 浓度总和 0.094 6 1.759 3 10.290 9 1.974 1 4.506 4 0.616 3 0.234 6 0.082 7 表 8 工业园区下风向监测点TVOCs、有组织和无组织排放VOCs的质量浓度
Table 8. Industrial park downwind monitoring point TVOCs, organized VOCs, unorganized VOCs quality concentrations μg·m−3
监测点 TVOCs Cl Ck S1 0.21 0.094 6 0.055 4 S2 4.96 1.759 3 3.140 7 S3 24.96 10.290 9 14.609 1 S4 4.59 1.974 1 2.555 9 S5 7.42 4.506 4 2.853 6 S6 1.14 0.616 3 0.463 7 S7 0.34 0.234 6 0.045 4 S12 0.18 0.082 7 0.037 3 注:Cl为有组织VOCs排放源Ar扩散到下风向监测点位的浓度质量值;Ck为无组织VOCs排放源扩散到下风向监测点的质量浓度监测值。 表 9 无组织单位面源的中心坐标
Table 9. Center coordinates of unorganized VOCs unit surface source
无组织VOCs面源 原始面源中心点坐标 旋转后中心点坐标 D1 (−604, 579) (−18, 837) D2 (1 061, 943) (1 417, −83) D2 (1 116, 943) (1 456, −122) D2 (1 171, 943) (1 495, −161) D2 (1 254, 943) (1 554, −220) D3 (1 370, −436) (660, −1 277) D3 (1 390, −436) (675, −1 291) D3 (1 410, −436) (689, −1 305) D3 (1 370,−456) (646, −1 291) D3 (1 390,−456) (660, −1 305) D3 (1 410, −456) (675, −1 320) 表 10 单位面源源强的系数计算
Table 10. Coefficient calculation of the source strength of unit surface
监测点 面源 旋转后中心点坐标 k 系数k之和 S1 D1 (−18,837) 1.080 0×10−8 1.080 0×10−8 S1 D2 (1 417,−83) 4.453 6×10⁻¹⁰ 1.516 4×10⁻⁹ S1 D2 ··· ··· S1 D2 (1 554,−220) 3.083 8×10⁻¹⁰ S1 D3 (660,−1 277) 2.449 1×10⁻¹⁰ 1.413 0×10−9 S1 D3 ··· ··· S1 D3 (675,−1 320) 2.260 2×10⁻¹⁰ ··· ··· ··· ··· ··· S12 D1 (−18,837) 7.273 9×10⁻⁹ 7.273 9×10⁻⁹ S12 D2 (1 417,−83) 2.320 2×10⁻¹⁰ 7.906 9×10⁻¹⁰ S12 D2 ··· ··· S12 D2 (1 554,−220) 1.610 0×10−10 S12 D3 (660,−1 277) 2.155 5×10⁻¹⁰ 1.246 3×10⁻⁹ S12 D3 ··· ··· S12 D3 (675,−1 320) 1.997 9×10⁻¹⁰ 表 11 无组织排放源到下风向监测点的质量浓度Cij
Table 11. Unorganized VOCs emission source to downwind monitoring point of mass concentrations μg·m−3
污染源 监测点 S1 S2 S3 S4 S5 S6 S7 S12 D1 0.054 0 2.947 8 1.138 6 0.669 8 0.192 9 0.027 3 0.015 1 0.036 3 D2 0.001 1 0.126 6 13.135 2 1.666 4 0.428 8 0.012 2 0.002 0 0.000 6 D3 0.000 8 0.062 6 0.332 1 0.221 9 2.229 6 0.421 0 0.027 1 0.000 7 表 12 无组织排放源对监测点质量浓度的贡献比例
Table 12. Unorganized VOCs emission source to monitor the proportion of mass concentration contribution
污染源 监测点 S1 S2 S3 S4 S5 S6 S7 S12 D1 25.71% 59.43% 4.51% 14.59% 2.60% 2.39 4.44% 20.17% D2 5.24% 2.55 52.63% 36.31 5.78% 1.07% 5.88% 0.33% D3 3.81% 1.26% 1.33% 4.83% 30.05% 36.93% 7.97% 0.39% -
[1] 陆秋琴, 白静飞, 黄光球. 基于多源数据融合的区域VOCs浓度预测方法研究[J]. 安全与环境学报, 2021, 21(4): 1-12. [2] WANG T, XUE L, BRIMBLECOMBE P, et al. Ozone pollution in China: A review of concentrations, meteorological influences, chemical precursors, and effects[J]. Science of The Total Environment, 2017, 575(4): 1582-1596. [3] KUO Y, CHIU C, YU H. Influences of ambient air pollutants and meteorological conditions on ozone variations in Kaohsiung, Taiwan[J]. Stochastic Environmental Research and Risk Assessment, 2015, 29(3): 1037-1050. doi: 10.1007/s00477-014-0968-2 [4] 付加鹏, 金春江, 程星星, 等. 重点行业VOCs排放特征统计分析[J]. 环境工程, 2020, 38(06): 188-194. doi: 10.13205/j.hjgc.202006031 [5] 生态环境部. GB37822-2019挥发性有机物无组织排放控制标准[S]. 北京: 中国标准出版社, 2019. [6] 郑倩文. 基于伴随概率法的工业园区空气污染溯源[D]. 大连: 大连理工大学, 2020. [7] LI H W, AFSHAR-MOHAJER N, WU C Y, et al. Impacts of hazardous air pollutants emitted from phosphate fertilizer production plants on their ambient concentration levels in the Tampa Bay area[J]. Air Quality, Atmosphere & Health. 2015;8(5): 453-67. [8] MARTINEZ A, SPAK SN, PETRICH NT, et al. Carmichael GR, Hornbuckle KC. Atmospheric dispersion of PCB from a contaminated Lake Michigan harbor[J]. Atmospheric Environment. 2015;122: 791-798. [9] 王小燕. AERMOD在区域大气环评中的应用研究[D]. 兰州: 兰州大学, 2013. [10] 方力. 利用ADMS-城市模型模拟分析鞍山市大气环境质量[J]. 环境保护科学, 2004, 30(6): 8-10. doi: 10.3969/j.issn.1004-6216.2004.06.003 [11] 李卓, 陈荣昌, 毛显强. 基于ADMS-Urban的大气污染浓度贡献率分析[J]. 环境工程, 2010, 28(1): 183-186. doi: 10.13205/j.hjgc.2010.s1.052 [12] 王刚, 魏巍, 米同清, 等. 典型工业无组织源VOCs排放特征[J]. 中国环境科学, 2015, 35(7): 1957-1964. doi: 10.3969/j.issn.1000-6923.2015.07.007 [13] 史阳. 有毒气体罐车运输泄漏的源强及位置反算研究[D]. 兰州: 兰州交通大学, 2013. [14] 孙家振. 小风和静风条件下大气环境容量研究[D]. 成都: 西南交通大学, 2006. [15] 吴忠标, 金一中. 大气污染控制工程[J]. 北京:科学出版社, 2002: 7. [16] 谷清, 赵燕华, 王耀庭, 等. 面源模式计算方法研究[C]. //大气环境科学技术研究进展第九届全国大气环境学术会议论文集. 2002: 246-254. [17] 谷清, 汤大钢. 面源模式反扩散参数研究[J]. 环境科学研究, 2001, 14(5): 54-56. doi: 10.3321/j.issn:1001-6929.2001.05.016 [18] 谷清. 大气环境模式计算方法[J]. 北京:气象出版社, 2002: 41. [19] 陆秋琴, 杨帅, 黄光球. 工业园区无组织VOCs溯源方法研究[J]. 安全与环境学报, 2022, 22(1): 1-13. [20] 杨航. 典型化工区园区VOCs排放扩散的预测溯源方法研究[D]. 杭州: 浙江大学, 2020. -


 下载:
下载:


