


全文HTML
近年来,在房屋装修设计中,为了节省卫生间空间和方便晾晒,一般将洗衣机置于阳台使用,由此造成的环境问题不容忽略。洗衣废水直接由阳台的雨水管排入附近水体,富含表面活性剂、三聚磷酸钠等污染物的洗涤废水直接排放造成水体富营养化,危害水生动、植物的生长和繁殖,破坏水生生态环境[1]。
太湖是我国重点治理的湖泊之一,太湖流域地处平原,河网密布,入湖河流带来的污染物是其主要的污染源。根据相关统计,位于江苏省境内的15条主要入湖河流的污染负荷占江苏太湖入湖污染总负荷的80%以上[2],因此,治理太湖水环境应着重整治入湖河流的污染问题,由此提出“治湖先治河”的理念。位于太湖流域的某典型复合污染型支浜途径农业区、镇集生活区、工业区,污染源复杂,水质较差,其中城镇生活污染源对各类污染物的贡献均比较突出。目前该地区已实现雨污分流,河道的雨水管排放口收集的住宅阳台洗涤废水则成为了主要的生活污染源。现有的针对洗涤废水的污水处理工艺主要有混凝法、沉淀法、吸附法、超滤膜法、MBR法或其组合工艺等[3],这些技术通常处理的是商业洗涤废水,其COD浓度较高,而雨水管汇集的洗涤废水C/N较低,针对此类废水的处理技术较少且尚不成熟。
交替曝气生物滤池技术(授权发明专利名称为“一种交替内循环生物滤池污水处理装置及其使用方法”,专利号:201510403832.2,授权时间2017年10月10日)结合了前置缺氧-好氧串联生物滤池和序批式生物膜反应器(SBBR)的技术特点,具有污泥产量少,对低C/N污水脱氮效果优异和间歇性运行时重新启动速度快的典型优势[4],目前主要应用于村镇生活污水这类水质波动大、C/N较低的污水的处理。采用该技术处理雨水管汇集的住宅阳台洗涤废水是解决该问题的有益尝试,预期可使出水水质达到《城镇污水处理厂污染物排放标准》(GB 18918-2002)一级B标准。
1 实施方案
1.1 工程概况
本工程位于常州市武进区前黄镇永胜河河岸,在河岸的2个主要排放阳台洗涤废水的雨水管排放口上游新建溢流井,由污水提升泵将废水输送至交替曝气生物滤池污水处理一体化设备进行处理,处理后尾水就近排入河道。
1.2 工艺流程
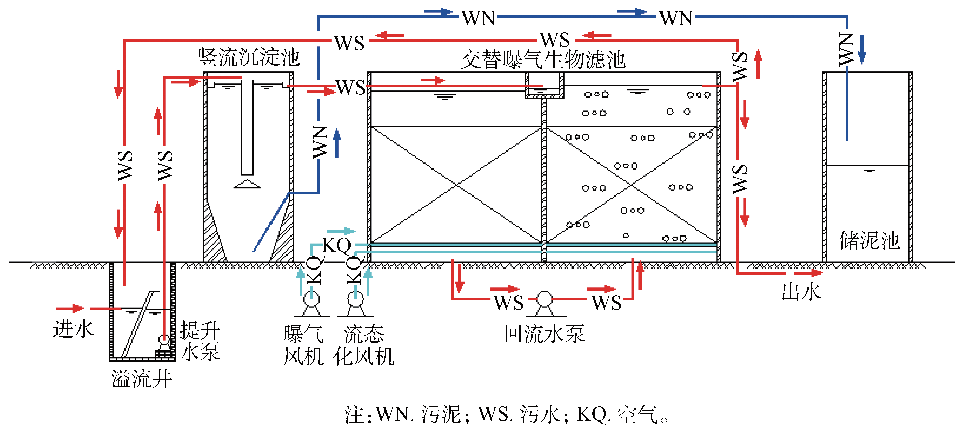
交替曝气生物滤池工艺流程如图1所示,雨水管道的污水经溢流井收集及潜污泵提升后进入竖流沉淀池,沉淀后的上清液进入交替曝气生物滤池中间的进水槽中,通过液位差的作用流入缺氧池上部,下向流通过颗粒滤料层到达缺氧池底部,再经回流泵进入好氧池底部,上向流通过好氧池颗粒滤料层到达好氧池上部,部分回流至缺氧池,部分排放出水。另外设置储泥池储存沉淀池中的污泥。
交替曝气是指每隔1个周期(48 h)曝气方向由一侧切换至另一侧,同时进出水方向也发生逆转。每侧反应池都经历好氧-缺氧环境以及基质贫乏-富余的动态循环变化,使得微生物具有优良的内碳源储存功能,对低C/N污水有较好的脱氮除磷效果[5],同时交替曝气解决了颗粒滤料因生物膜富集产生的堵塞问题。
图1 工艺流程图
Fig. 1 Process flow diagram
Fig. 1 Process flow diagram
1.3 设计参数
该工程设计处理水量为50~100 t·d−1,一体化处理设备占地面积为25 m2,滤料厚度为1 m,曝气风机风量为47~57 m³·h−1。
1.4 工程实验设计
工程稳定运行数月后,对低C/N下脱氮除磷效果进行监测评估,以验证工艺的典型优势;此外,选取1.52、1.90、2.28 m3·(m2·d)−13种水力负荷运行,探究交替曝气生物滤池技术在此工程应用中最优的水力负荷;交替曝气生物滤池刚切换曝气方向时,大部分出水是原先缺氧池的污水直接排放,造成短暂的出水水质不佳,因此,在切换曝气方向后1个周期内按先密后疏的时间间隔取进、出水水样分析,探究切换曝气方向伴随的进、出水方向逆转对短时出水水质影响的延续时间。
1.5 分析方法
采用密封消解法测定水样的COD浓度[6];采用纳氏试剂分光光度法(HJ 535-2009)测定水样的氨氮浓度;采用碱性过硫酸钾消解紫外分光光度法(HJ 636-2012)测定水样的总氮浓度;采用过硫酸钾消解钼锑抗分光光度法(GB 11893-1989)测定水样的总磷浓度。
2 工程运行效果
2.1 进水水质特征分析
实验过程中分别于晴、雨天对进水水质波动规律进行分析。图2为晴天和雨天1个周期内进水COD浓度的变化趋势,可以看出,晴天进水COD浓度较不稳定,平均进水浓度为37.71 mg·L−1;雨天进水COD浓度均保持在极低水平,说明雨天进水COD浓度会被雨水稀释。总体来说,无论晴、雨天,雨水管道汇集的洗涤废水中有机物浓度均较低。
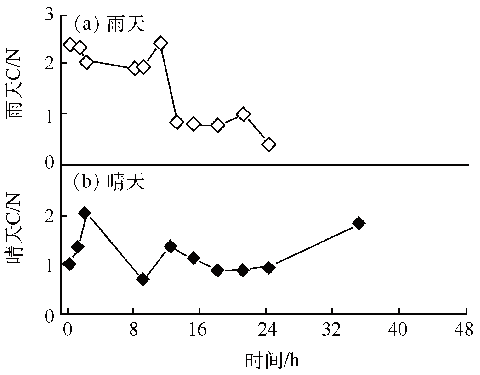
进水C/N变化规律如图3所示,大部分时候C/N<2,根据理论计算,生物法污水处理中当C/N达到2.86时才会有反硝化效果,实际上微生物自身生命活动也需碳源提供能量,所以C/N至少需达到4以上缺氧池才能完成反硝化[7],因此,该工程中进水C/N较低。
图2 晴天和雨天1个周期内进水COD浓度
Fig. 2 COD influent concentration in sunny and rainy days in one cycle
Fig. 2 COD influent concentration in sunny and rainy days in one cycle
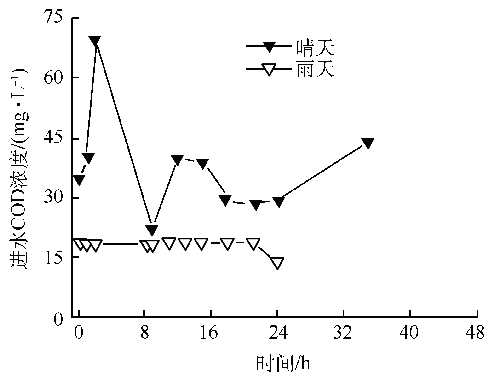
图3 雨天和晴天1个周期内进水C/N
Fig. 3 C/N of influent in sunny and rainy days in one cycle
Fig. 3 C/N of influent in sunny and rainy days in one cycle
2.2 低C/N条件下生物脱氮除磷
工程稳定运行后,着重研究雨天时极低C/N条件下1个周期内脱氮除磷效果,该实验过程中进水C/N如图3(a)所示,水力负荷为1.90 m3·(m2·d)−1。
图4为雨天1个周期内总氮去除效果,实验过程中发现进水溶解氧有较大波动,前21 h溶解氧范围为0.84~1.90 mg·L−1,之后迅速升高至9 mg·L−1左右,严重破坏了缺氧环境,导致21 h后总氮出水浓度升高。但前21 h内总氮平均出水浓度为6.80 mg·L−1,即使C/N低于1,总氮去除率亦能达70%以上。这说明只要溶解氧满足缺氧条件,该工程在低C/N水质情况下仍然具有较好的脱氮效果。这是因为滤池内微生物为了适应动态的环境变化,会在基质浓度较高时完成反硝化的同时大量储存内碳源,以供基质浓度不足时使用[8]。目前,大量研究表明,微生物的内碳源储存物主要是聚-β-羟基烷酸酯(PHAs),包括PHB、PHV、PH2MV等[9-13]。所以,交替曝气生物滤池非常适合处理低C/N以及水质波动较大的污水,其储存内碳源的机理有待进一步研究。
一般的前置反硝化滤池硝态氮的容积负荷为0.8~1.2 kg·(m3·d)−1[14],而在此工程中总氮容积负荷只有1.46~32.43 g·(m3·d)−1。这说明尽管总氮出水浓度已降至较低水平,但脱氮效率远未达上限。除溶解氧的较大波动外,造成总氮容积负荷低的原因有2个方面:一方面,进水碳源浓度较低,过低的有机容积负荷限制了微生物的生长与繁殖;另一方面,滤池填料厚度仅为1 m,远低于一般曝气生物滤池滤料厚度2~4 m,导致污水滤速相对较高。但是总体上对于较低C/N污水,该总氮容积负荷在可接受范围之内。
图4 雨天1个周期内总氮去除率及进出水浓度
Fig. 4 Removal rate and concentration of TN in rainy day in one cycle
Fig. 4 Removal rate and concentration of TN in rainy day in one cycle
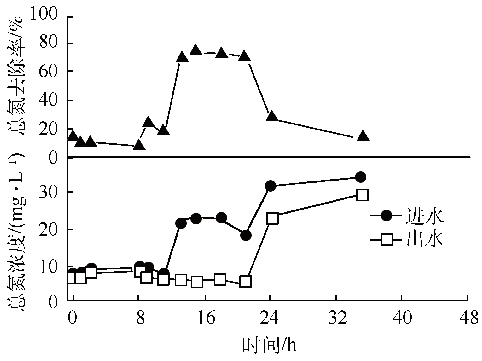
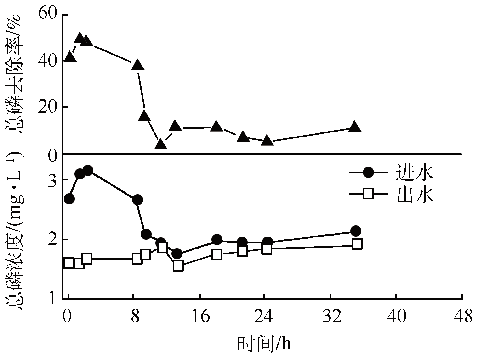
图5为雨天1个周期内总磷去除效果,出水总磷浓度范围为1.54~2.01 mg·L−1。当进水总磷浓度较高时,其去除率相对也较高,前5 h去除率接近50%。有研究表明,当系统为厌氧-缺氧交替运行方式时,能驯化出大量反硝化聚磷菌,在反硝化脱氮的同时实现除磷[15]。交替曝气生物滤池采用缺氧-好氧的交替运行方式,运行环境的动态循环变化与上述过程是相似的,因此,猜测系统对磷的去除主要通过反硝化除磷完成。但是总体来说除磷效率不够高,一方面有研究表明,相对于好氧吸磷过程,反硝化吸磷过程是以硝态氮作为电子受体而非氧气,这使得消耗单位NADH2所产生的ATP量大大降低,因此,吸收磷酸盐的能力也降低[16]。另一方面,由于颗粒填料上的微生物将进水碳源绝大部分用于缺氧环境中的反硝化过程或储存为内碳源,因而系统的剩余污泥产量小,而生物除磷主要通过排泥实现,所以不能使除磷效率达到较高水平。
图5 雨天1个周期内总磷去除率及进出水浓度
Fig. 5 Removal rate and concentration of TP in rainy day in one cycle
Fig. 5 Removal rate and concentration of TP in rainy day in one cycle
2.3 工艺条件优化
2.3.1 限制性工艺条件判断及优化
根据理论计算,硝化1 mg氮需消耗4.57 mg溶解氧[17],硝化反应器中溶解氧在4 mg·L−1左右比较合适[18]。交替曝气生物滤池曝气侧平均溶解氧浓度高达9 mg·L−1左右,大大减小了自养硝化菌与异养碳化菌对溶解氧的竞争,使得硝化反应速率较快,装置对氨氮具有良好的去除效果。而COD进水浓度较低,其去除效果没有太大的意义;总氮与总磷去除效果经常受进水溶解氧浓度的影响而有所波动。因此,主要通过1个周期内氨氮去除效果及氨氮容积负荷对水力负荷进行优化。实验主要对3个水力负荷进行对比,分别是1.52、1.90、2.28 m3·(m2·d)−1。
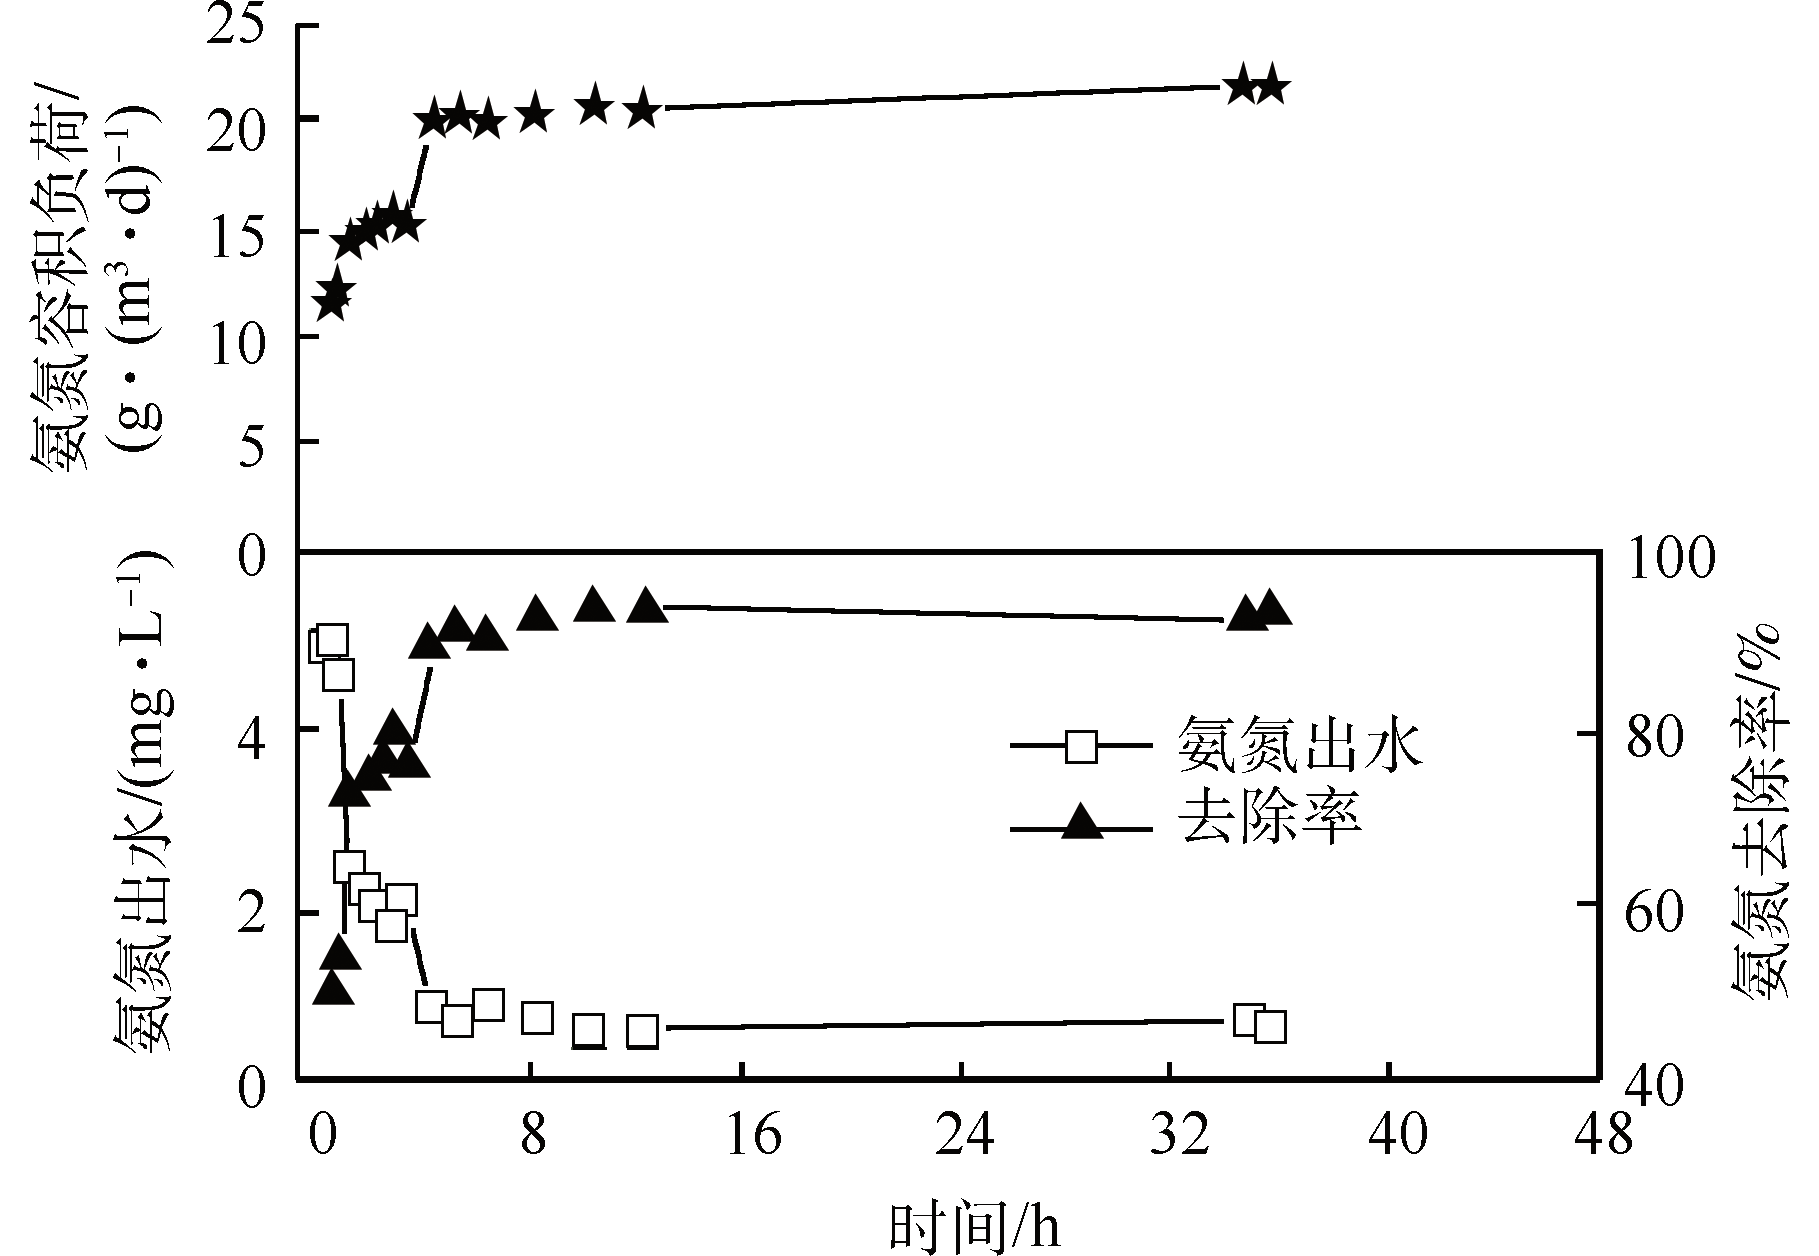
图6~图8为3种水力负荷下交替曝气生物滤池对氨氮的容积负荷及氨氮去除效果,平均氨氮容积负荷分别为16.84、23.88、17.28 g·(m3·d)−1,三者没有明显的差别,且均与氨氮去除率呈现相似的变化趋势,但是远低于一般曝气生物滤池的氨氮容积负荷(0.2~0.8 kg·(m3·d)−1)[19-20],而系统稳定后出水氨氮浓度均在0.60~2.86 mg·L−1的较低水平。由此可见,在该工程应用中,由于氨氮进水浓度不高,使得氨氮容积负荷也较低,远未达正常水平。因此,该工程可在较大水力负荷2.28 m3·(m2·d)−1下运行。
图6 水力负荷1.52 m3·(m2·d)−1时1个周期内氨氮容积负荷及氨氮去除效果
Fig. 6 NH4+-N volume loading and removal effect in one cycle when hydraulic load was 1.52 m3·(m2·d)−1
Fig. 6 NH4+-N volume loading and removal effect in one cycle when hydraulic load was 1.52 m3·(m2·d)−1
图6 水力负荷1.52 m3·(m2·d)−1时1个周期内氨氮容积负荷及氨氮去除效果
Fig. 6 NH4+-N volume loading and removal effect in one cycle when hydraulic load was 1.52 m3·(m2·d)−1
Fig. 6 NH4+-N volume loading and removal effect in one cycle when hydraulic load was 1.52 m3·(m2·d)−1
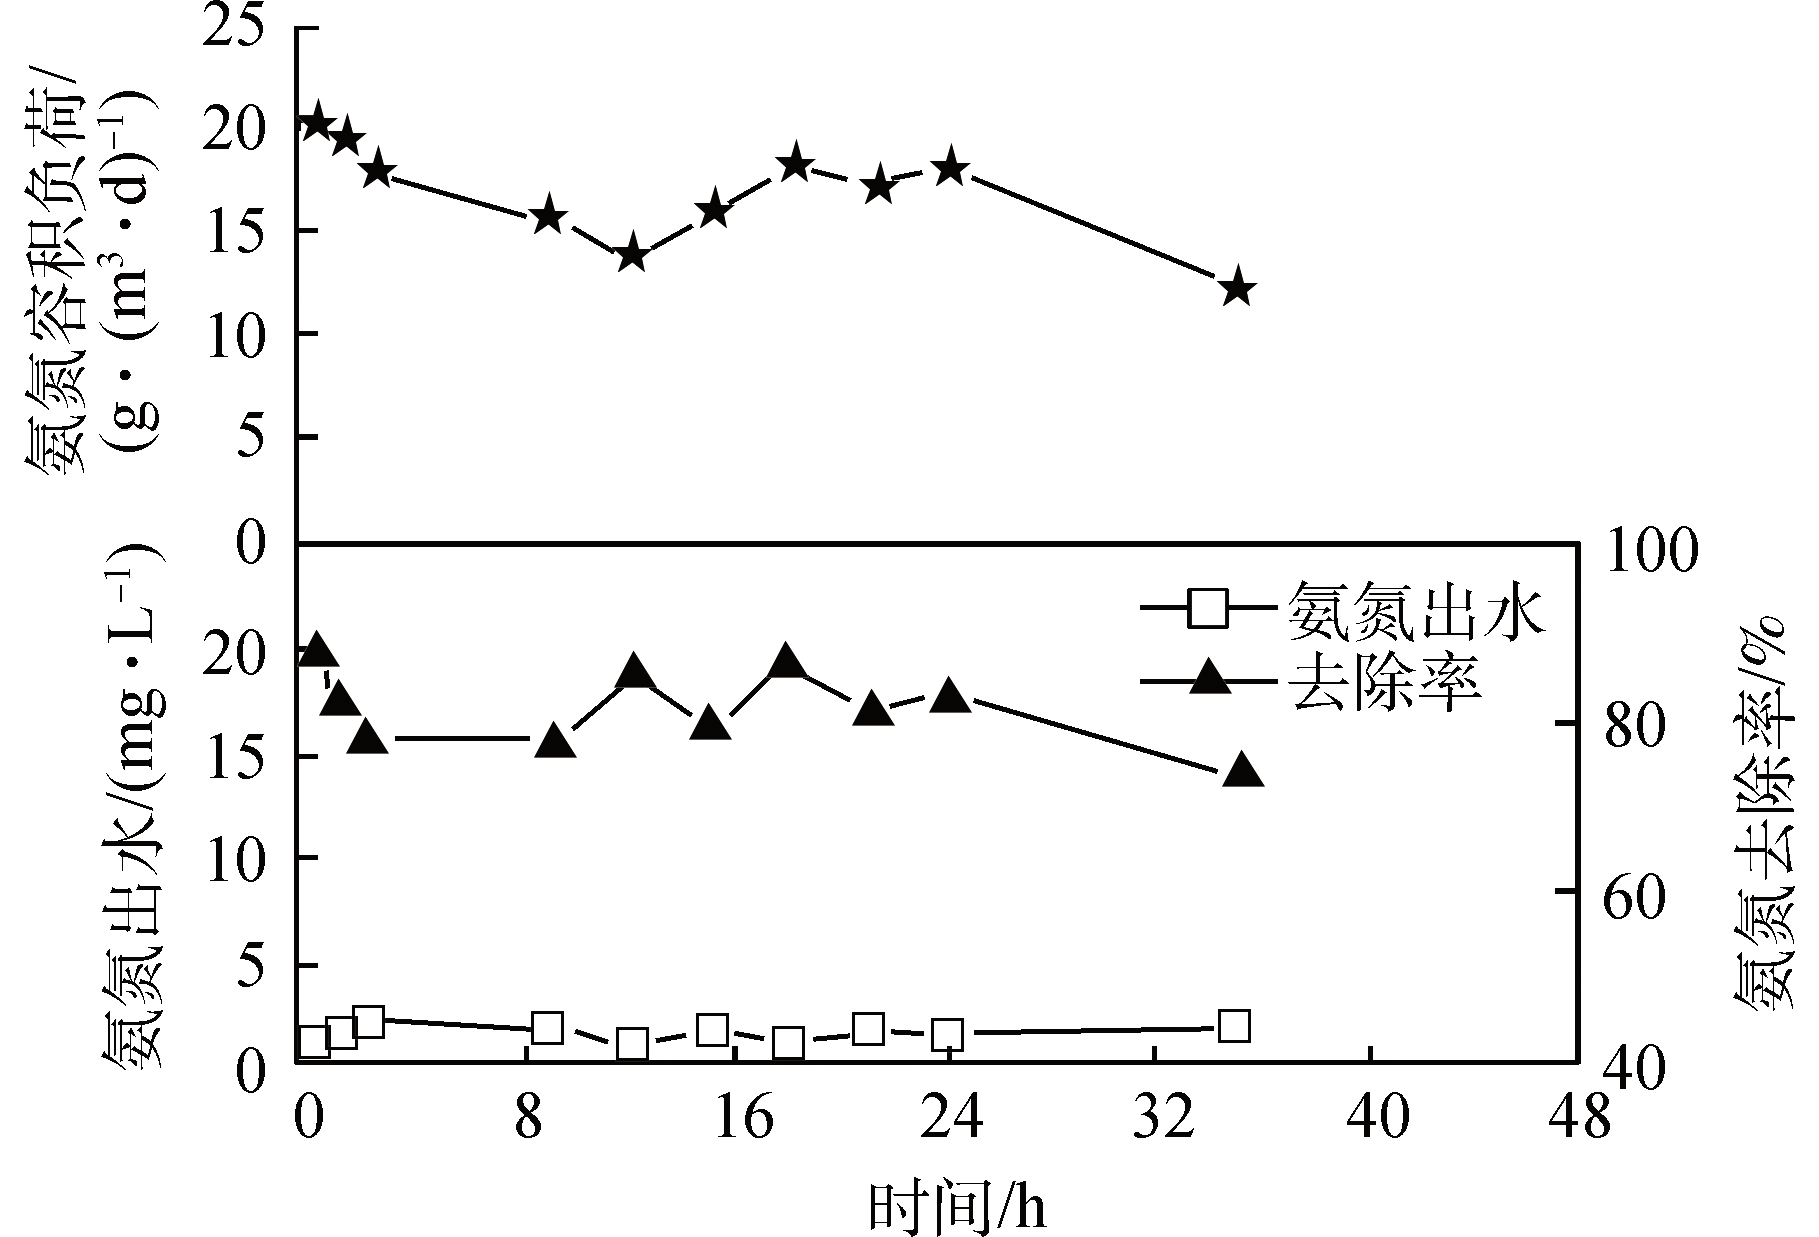
图7 水力负荷1.90 m3·(m2·d)−1时1个周期内氨氮容积负荷及氨氮去除效果
Fig. 7 NH4+-N volume loading and removal effect in one cycle when hydraulic load was 1.90 m3·(m2·d)−1
Fig. 7 NH4+-N volume loading and removal effect in one cycle when hydraulic load was 1.90 m3·(m2·d)−1
图7 水力负荷1.90 m3·(m2·d)−1时1个周期内氨氮容积负荷及氨氮去除效果
Fig. 7 NH4+-N volume loading and removal effect in one cycle when hydraulic load was 1.90 m3·(m2·d)−1
Fig. 7 NH4+-N volume loading and removal effect in one cycle when hydraulic load was 1.90 m3·(m2·d)−1
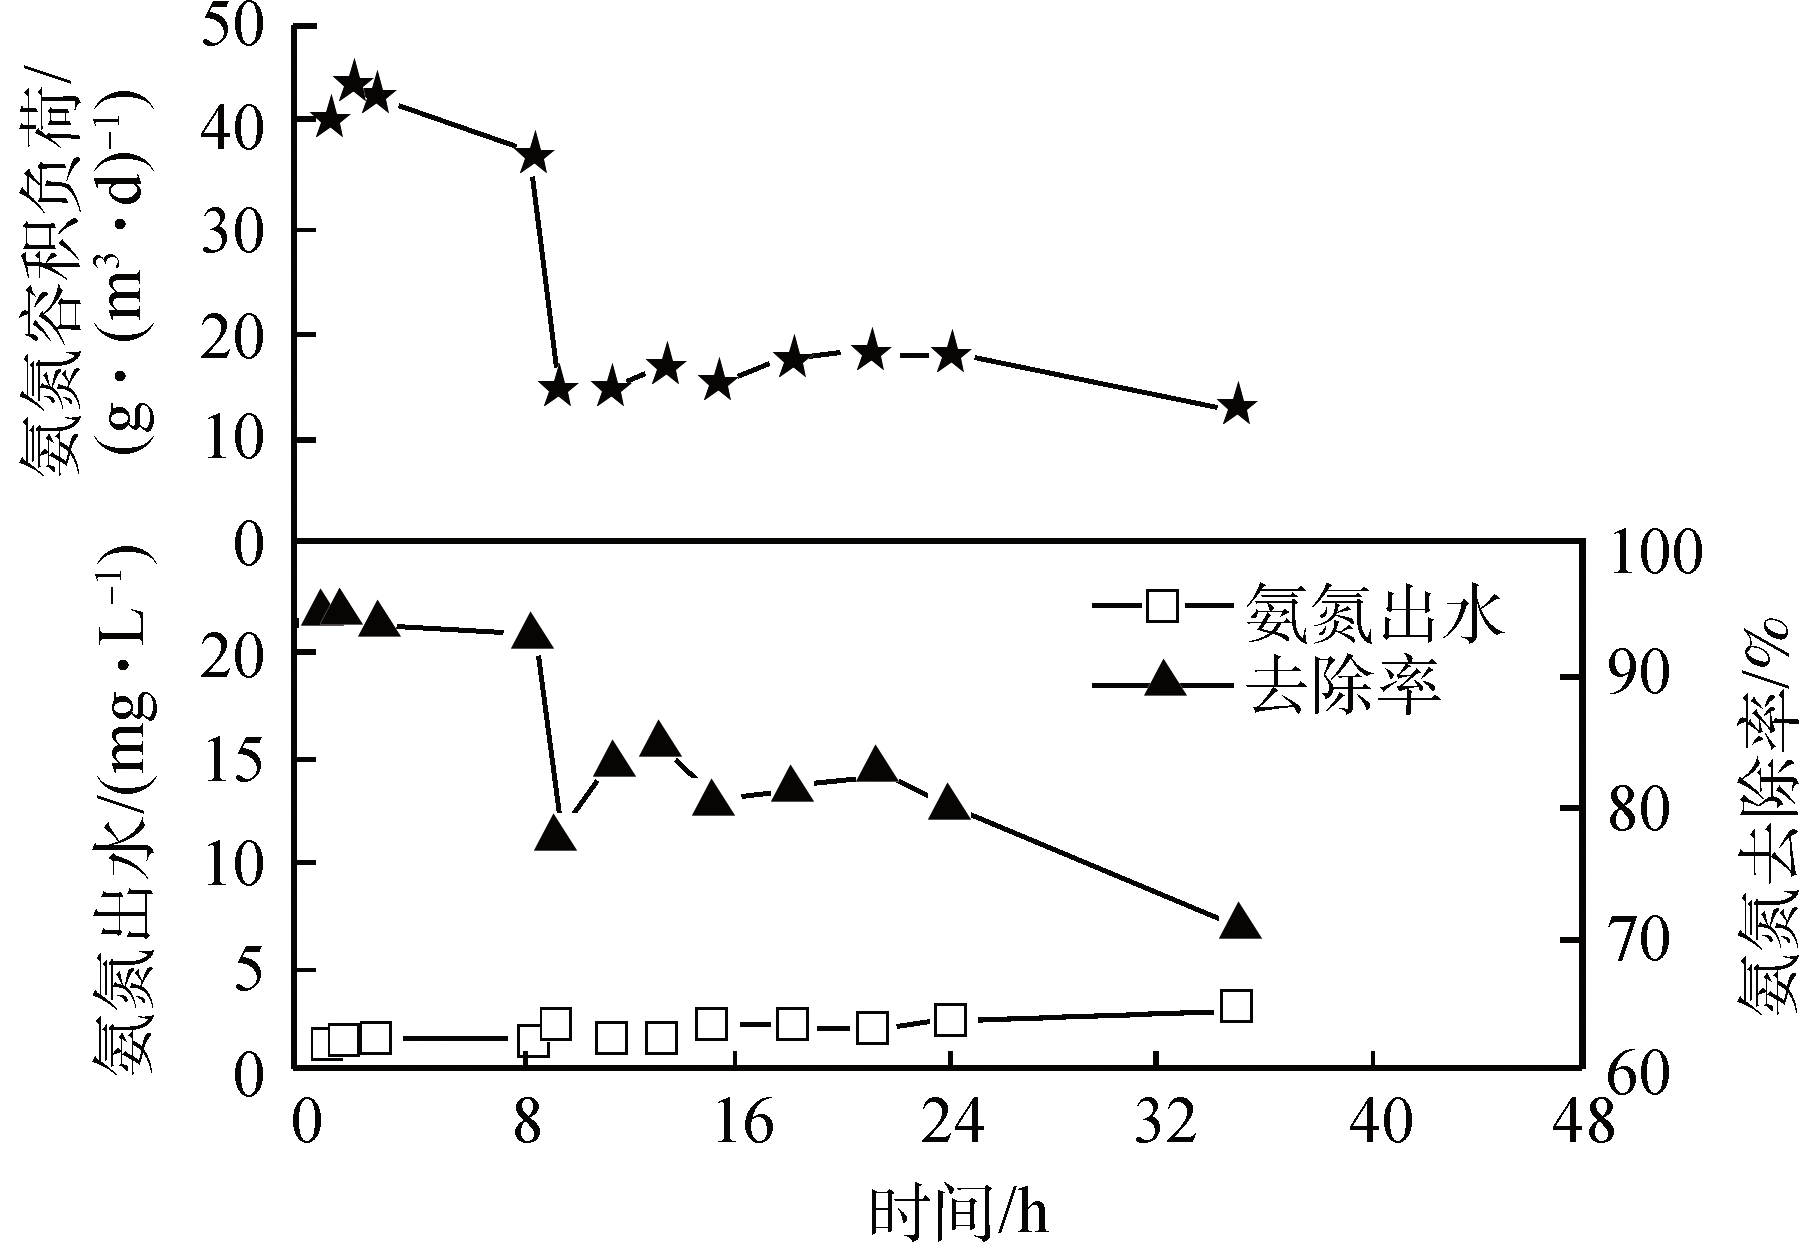
图8 水力负荷2.28 m3·(m2·d)−1时1个周期内氨氮容积负荷及氨氮去除效果
Fig. 8 NH4+-N volume loading and removal effect in one cycle when hydraulic load was 2.28 m3·(m2·d)−1
Fig. 8 NH4+-N volume loading and removal effect in one cycle when hydraulic load was 2.28 m3·(m2·d)−1
图8 水力负荷2.28 m3·(m2·d)−1时1个周期内氨氮容积负荷及氨氮去除效果
Fig. 8 NH4+-N volume loading and removal effect in one cycle when hydraulic load was 2.28 m3·(m2·d)−1
Fig. 8 NH4+-N volume loading and removal effect in one cycle when hydraulic load was 2.28 m3·(m2·d)−1
2.3.2 长期运行出水氨氮浓度的预测
为进一步验证水力负荷优化的结果,分别在3种水力负荷下以切换曝气后48 h内装置稳定后氨氮出水浓度为样本,将各工况下长期运行的氨氮出水浓度作为总体,在matlab中使用normfit函数[21]对总体均值和方差进行参数点估计(μ、σ)和区间估计(μ'、σ')。假设长期运行的氨氮出水浓度服从正态分布,且其方差未知,采用t检验返回参数h、p、ci来确定对样本总体特征的判断是否合理。输出参数h=0,则接受原假设;若h=1,则拒绝;p表示在原假设下样本均值出现的概率,p越大,原假设越可信;ci是样本均值的置信区间。
3种水力负荷下对长期运行时氨氮出水浓度预测结果以及t检验结果对比(如表1所示)。可知,3种水力负荷下长期运行时氨氮出水平均浓度的预测值及其区间估计都较低,没有明显的区别,且置信度都接近1,预测结果较为可靠。说明交替曝气生物滤池在3种水力负荷下均能取得较好的污染物处理效果,因此,可在较大水力负荷2.28 m3·(m2·d)−1下运行。
表1 不同水力负荷下氨氮出水浓度预测及t检验结果
Table 1 NH4+-N effluent concentration prediction and t-test results with different hydraulic loads
Table 1 NH4+-N effluent concentration prediction and t-test results with different hydraulic loads
水力负荷/(m3·(m2·d)−1) | 均值点估计 μ/(mg·L−1) | 方差点估计σ | 均值区间估计μ'/(mg·L−1) | 方差区间估计σ' | h | p | ci/(mg·L−1) |
1.52 | 1.66 | 0.39 | [1.38,1.94] | [0.27,0.71] | 0 | 1 | [1.38,1.94] |
1.90 | 1.88 | 0.47 | [1.58,2.18] | [0.33,0.80] | 0 | 1 | [1.58,2.18] |
2.28 | 1.18 | 0.63 | [0.79,1.56] | [0.45,1.05] | 0 | 0.999 | [0.79,1.56] |
2.4 交替曝气对出水水质影响及对策
为了探究切换曝气方向伴随的进出水逆转对出水水质影响的延续时间,需选择去除效果较为稳定的污染物种类来进行研究。从2.3讨论可知,氨氮出水浓度较低且较为稳定。因此,可采用氨氮去除效果作为进出水逆转对短时出水水质影响的评价因子。
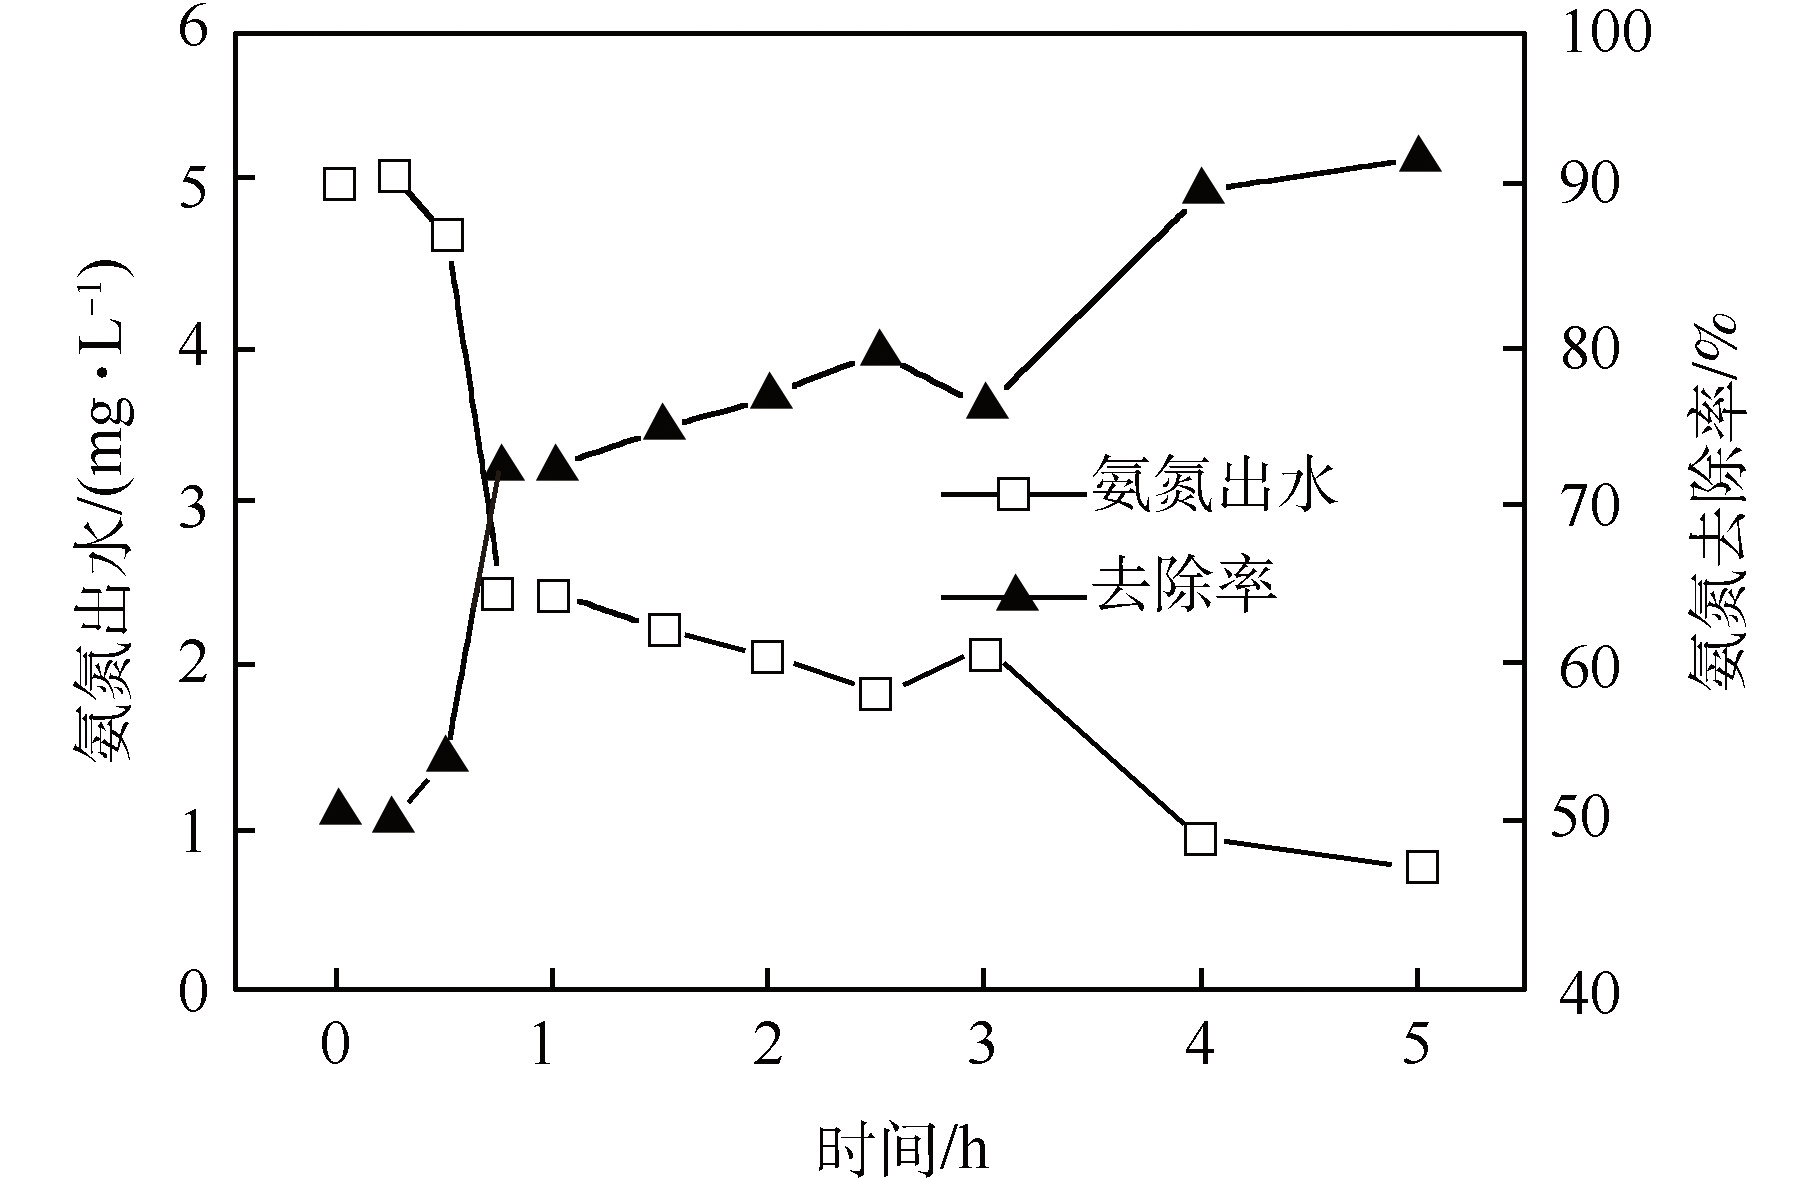
假设进出水方向逆转对出水效果的影响集中在0~5 h内,首先对交替曝气生物滤池切换曝气方向5 h后氨氮去除效果的稳定性进行探究。如图9所示,切换曝气方向5 h后出水氨氮浓度较为稳定,其范围为1.31~2.86 mg·L−1。这说明上述假设成立,进出水方向逆转对出水效果的影响确实在0~5 h内。随后,从切换曝气方向后开始计时,于0、0.25、0.5、0.75、1、1.5、2、3、4、5 h按照先密后疏的时间间隔依次取水样分析,氨氮处理效果如图10所示。切换曝气方向的30 min内出水氨氮浓度较高; 30 min~3 h内,氨氮的去除效果有了明显升高; 4 h后氨氮去除率已基本达到90%以上,出水氨氮浓度低至1 mg·L−1以下。由此说明,进出水逆转造成出水水质下降的延续时间大约为30 min,建议切换曝气后的前30 min内出水不排放,而是回流至溢流井重新处理。
图9 切换曝气方向5 h后氨氮去除效果
Fig. 9 NH4+-N removal effect after 5 h of switching aeration direction
Fig. 9 NH4+-N removal effect after 5 h of switching aeration direction
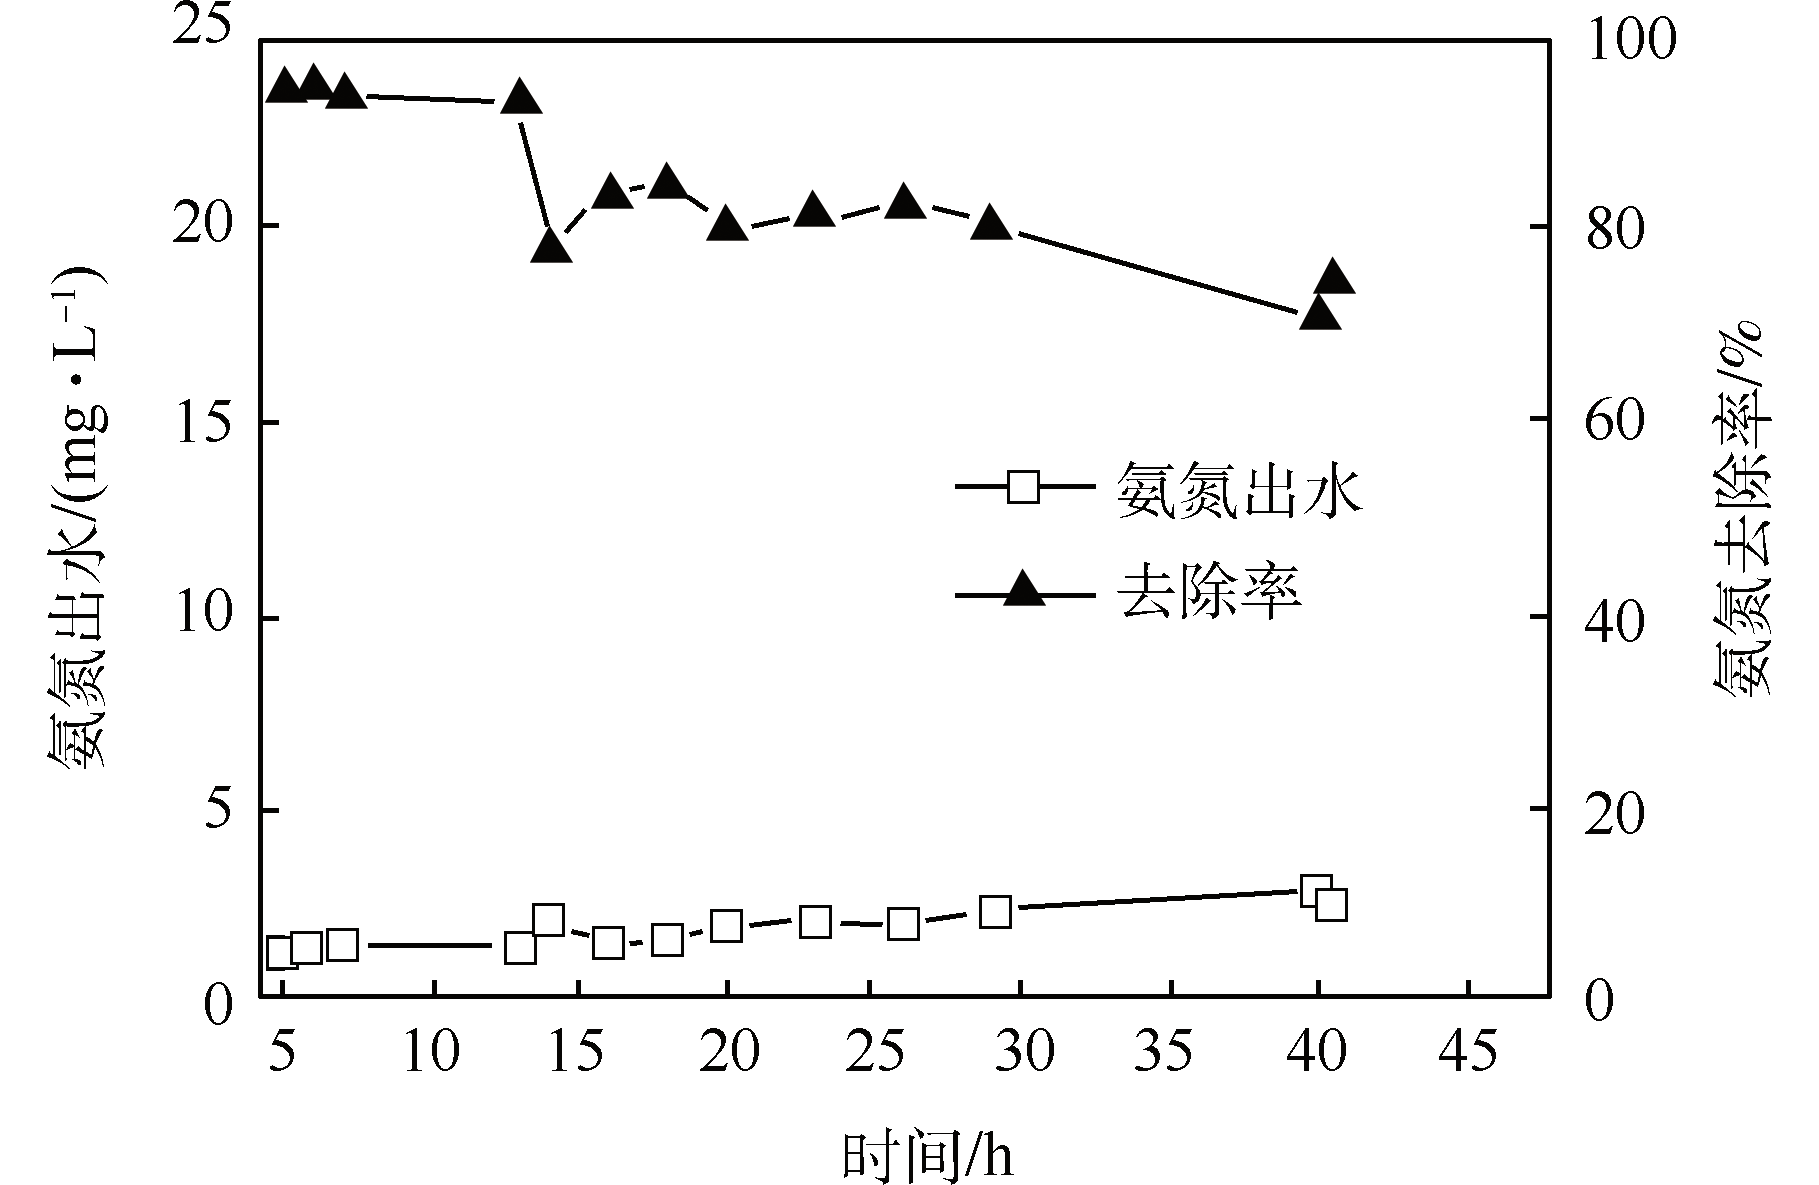
图10 切换曝气方向后5 h内氨氮去除效果
Fig. 10 NH4+-N removal effect within 5 h of switching aeration direction
Fig. 10 NH4+-N removal effect within 5 h of switching aeration direction
3 结论
1)对进水水质的分析结果表明,该类住宅阳台洗涤废水C/N大部分时候低于2,而交替曝气生物滤池在极低C/N时,仍然有较好的脱氮除磷效果,因此,该技术非常适合处理低C/N污水。但总氮去除率可进一步提高,若想进一步提高总氮去除率,需要控制进水溶解氧浓度,另外可适量添加碳源促进反硝化过程,或增大滤料层高度。
2)当水力负荷在1.52~2.28 m3·(m2·d)−1变化时,平均氨氮容积负荷变化不大,且均有较大上升空间;氨氮出水浓度始终较低,对长期运行时氨氮出水浓度的预测表明,3种水力负荷下平均出水浓度的区间估计均在0.79~2.18 mg·L−1的较低水平,且置信度均接近1。说明交替曝气生物滤池可在较大水力负荷2.28 m3·(m2·d)−1下运行。
3)研究切换曝气方向伴随的进出水逆转对出水水质影响的结果表明,切换曝气方向后的前30 min内出水水质急剧下降,30 min后出水水质逐步稳定。因此,交替曝气生物滤池技术在今后的应用中应该调整程序,使切换曝气方向后的前30 min出水回流至滤池前端重新处理。
 下载:
下载:
