

-
钴(Cobalt, Co)是海洋中一种关键的无机痕量金属,在海洋生物地球化学过程中扮演着重要角色。Co是海洋浮游生物的必需元素。浮游生物可利用Co作为金属因子构成体内一些有机结构,如作为维生素B12的中心原子在海洋生物中广泛存在[1-3];或利用Co作为辅基参与形成生物体内的金属酶,如替代锌参与碳酸酐酶的辅酶或利用Co胺素在体内合成蛋氨酸等[4-9]。生物吸收实验表明,在海洋环境中浮游生物对Co的需求可能介于锰和营养型金属元素(如锌等)之间[10],且与浮游生物的需求相比,海水中的生物可利用Co处于匮乏状态[11-12]。溶解态Co在海水中主要以自由离子或络合物的形态存在,且活性Co相对稳定络合态有着更高的生物活性[13]。
开阔大洋Co分布大多为营养盐型分布模式,表层的溶解态Co被生物消耗而浓度较低,随着再矿化作用浓度从表层到中深度呈上升趋势,中深度到深海呈稳定或下降的趋势。海盆尺度上的Co分布状况为:北冰洋表层Co的浓度极高,可达0.80 nmol·L−1,10倍于北大西洋和南太平洋的表层浓度;北冰洋深层水Co含量约为0.05—0.06 nmol·L−1,略高于太平洋深层水(0.03—0.04 nmol·L−1),而略低于大西洋深层水(0.01—0.09 nmol·L−1)[14-20]。大洋中Co的主要来源是陆地径流、沉积物再悬浮、热液活动及大气沉降[13,15,17-18]。Co从大洋的移除过程主要包括清除作用、生物吸收作用以及随铁锰氧化物等的共沉降[10,18,21-23]。全球大洋Co的通量模型估算结果表明:每年海底沉积物向海输送量达4.0×10¹⁰ g,大气沉降为3.8×10⁹ g,河流输送为3.4×10⁸ g。Co在大洋的平均停留时间约为70 a,其中上层海洋受到强烈的生物消耗、颗粒物沉降及再生等共同作用停留时间仅7 a,而深层海洋可长达250 a[24]。
河流是大洋Co的一个重要来源,并显著影响河口及近海Co的分布。例如,北冰洋在极点处受到穿极流携带的河流输入的补充,Co浓度高达0.21 nmol·L−1 [22];地中海和墨西哥湾表层水Co与盐度的显著负相关关系也表明河流输入对河口或和边缘海Co分布的重要影响 [15,25-27]。人类活动会导致河流中Co含量的增加,例如伊比利亚半岛南部工业区附近的河流体系中Co含量可达背景值的17700倍。这也意味着随着人类活动程度的加剧,河流向大洋输送Co的通量可能会增加[28]。
河口是河流向海物质输送的通道和关键界面,是生物地球化学循环中一种重要的环境体系[29-31]。河流中携带的Co在河口区域受移除作用、颗粒物解吸及悬浮颗粒物再生等作用的影响,并非完全参与全球海洋的生物地球化学循环。因此,Co在河口的行为决定了河流向海洋Co输送的最终通量。例如对圣劳伦斯河的研究指出,由于河口的移除效应,河流中携带的Co最终只有约8%能进入开阔大洋[23,32]。目前,河口区域Co的生物地球化学的行为及其影响因素尚未得出明确的结论,例如:韩国Geum河口Co表现为移除型[33];日本Sagami湾和Wakasa湾的河口区域在低/中盐度区域呈现出溶解态Co的最大值,且保守性随季节变化[34];加拿大Mackenzie河口区域Co则表现出非保守的添加行为[35]。河口Co的行为的不确定性限制了对河流向海洋Co输送通量的估算。
长江是我国第一大河,世界第三长河,河流总长度达6300 km,流域覆盖面积达180万km2,多年径流量平均值达9000亿 m3[36-37]。长江贡献了东海90%以上的淡水输入量,也是我国近海痕量金属的重要来源[37-38]。长江中的Co主要来自于流域岩石矿物的风化与侵蚀[39-40],已有报道长江上、中、下游水体中Co的平均浓度分别为1.53、0.85、0.85 nmol·L−1,若忽略河口的过滤器效应,长江每年向东海Co的输送通量可达40 吨[41]。而Co在长江口行为研究的缺失,限制了对长江向大洋Co输送通量及其生物地球化学规律的认识。为此,本文通过对长江口盐度梯度变化下Co浓度的观测,结合水文和化学辅助参数探讨长江口及其附近海域海水中痕量金属Co的生物地球化学行为及其季节变化。
-
本研究通过搭载同济大学海洋地质国家重点实验室共享航次(KECES-2019)和国家自然科学基金委员会共享航次,分别于2019年9月(秋季),2021年3月(春季)和2021年7月(夏季),在121.05°E—124.00°E,29.60°N—31.77°N的长江口区域,搭载“浙渔科2号 ”和“润江1号”科考船开展长江口及其附近海域痕量金属Co的季节性分布的研究。分别获取了24个秋季、32个春季和24个夏季长江口的表层水样品(图1)。
-
表层水样品采用实验室自制的痕量采水器,在船头位于水流的上游区域采集表层水样品。所取水样立即在船舱内搭建的洁净环境中使用蠕动泵经Pall® 0.8/0.2 μm的囊式滤器过滤后装入60 mL 低密度聚乙烯(Nalgene)样品瓶,并装入3层自封袋后封入样品箱,常温保存带回。
-
样品带回后的所有实验操作均在上海交通大学1000级微量金属洁净实验室的100级高效微粒空气(high efficiency particulate air,HEPA)过滤通风橱中进行。实验所用试剂及材料见表1。
seaFAST使用的缓冲液由氨水和醋酸按比例混合制备(pH=6.0±0.2),使用的洗脱液为0.5 mol.L−1的硝酸。ICP-MS自动进样器和seaFAST的润洗液均为0.5%的硝酸。小瓶、离心管和背板均在洁净实验室中按照以下步骤进行清洗[42-43]:在2%Citranox清洁剂中浸泡24 h,用超纯水冲洗7次,然后在10%盐酸中浸泡7 d,用超纯水冲洗7次,使用三层塑料自封袋密封。用于ICP-MS的氩气和氦气为超纯级(>99.999%)。
-
Milli-Q纯水机:Merck公司。seaFAST S2:Elemental Scientific公司。ESI-2DX自动进样器:Elemental Scientific公司。ICP-MS/MS:Thermo Fisher iCAP TQ电感耦合等离子质谱仪。ICP-MS/MS的工作条件见表2。
-
样品带回实验室后使用盐酸l按照1:1000的比例进行酸化并摇匀,静置保存3个月及以上,使未络合的各种形态的Co在酸介质中充分分解[44]。静置后的样品先使用以盐酸l酸化至pH=2的Milli-Q水进行适当稀释,以盐度(Salinity, S)为划分标准进行稀释,0≤S<1‰稀释100倍,1‰≤S<15‰时稀释20倍,S≥15‰时稀释10倍,以避免金属浓度过高而污染seaFAST系统。稀释后的样品使用seaFAST进行分离和富集[45-46],主要经过如下步骤。1. 上样:10 mL样品进入定量环,样品和缓冲液在线混合进入预浓缩柱。在这个过程中,元素被螯合树脂选择性吸附;2. 基质淋洗:超纯水和缓冲液在线混合后通过预富集柱后弃去,从而去除干扰离子和未被螯合的离子;3. 柱洗脱:0.5 mL的0.5 mol·L−1硝酸通过预富集柱,将被分析物从螯合树脂上洗脱至低密度聚乙烯背板,供ICP-MS/MS分析。
本研究用西太平洋表层标准海水(LEMON)为基体配制浓度梯度为0、0.001、0.005、0.01、0.05、0.1、0.2、0.5 μg.L−1的标准曲线进行定量。本方法经过严格的验证,Co的方法检出限为0.003 nmol·L−1,流程空白低于检测限。对加拿大国家研究委员会(National Research Council, Canada)认证的标准样品SLEW-3,SLR-6,CASS-6和NASS-7的分析结果见表3。
-
本文用于认识长江口Co生物地球化学规律的辅助参数,例如温度、盐度、营养盐、溶解氧及叶绿素等环境参数,通过同济大学海洋地质国家重点实验室共享航次和国家自然科学基金委共享航次的数据共享获取。所得数据以Ocean Data View进行平面图绘制,使用IBM SPSS statistics数据编辑器对样品各参数之间进行双变量相关性检验,相关性采用Pearson相关系数,显著性检验采用双尾检验。
-
本研究3个季节长江口及其邻近水域各站位表层水的盐度(S)、温度(T)及Co浓度详细数据见表4。2019年9月秋季航次的水温范围为26.39—29.46 ℃,盐度范围为0.00—32.10‰;2021年3月春季航次水温范围为10.10—17.00 ℃,盐度范围为0.19‰—34.82‰;2021年7月夏季航次水温范围为22.89—28.77 ℃,盐度范围为0.11‰—31.39‰。春季航次中长江口的水温偏低,而研究范围表层水整体盐度较高。在2021年7月和9月的夏秋两季,观测到的温盐范围接近。
本研究采取咸淡水划分模式,将研究区域划分为淡水区、冲淡水区及海水区。具体以盐度(S)1和30为界限[47-48],将S<1‰划分为淡水区域,1‰≤S≤30‰为冲淡水区域,S>30‰为海水区域,对各站位所属海域进行详细区分可知,2019年9月航次C1—C5位于淡水区,C18、Y6和Y7位于海水区,其余在冲淡水区;2021年3月航次B1—B2、C1—C3位于淡水区,A5的3—8号站、A6的3—8号站及A7的4—8号站位于海水区,其余站位在冲淡水区;2021年7月B1—B3、C1—C4位于淡水区,A5—3/5/6位于海水区,其余在冲淡水区。
-
长江口金属Co的浓度在不同季节有所差异:秋季Co浓度分布范围0.05—0.24 nmol·L−1,均值0.10 nmol·L−1;春季Co浓度分布范围为0.05—0.37 nmol·L−1,均值为0.13 nmol·L−1;夏季Co浓度较高,其分布范围在0.03—0.54 nmol·L−1,均值高达0.26 nmol·L−1,几乎达到春秋季节的最高值;以Co含量的均值来看,Co在长江口浓度的季节变化表现为夏季>春季>秋季。
从季节变化的角度对本研究中各水域的盐度、温度及Co浓度进行统计(表5)。对于全水域,秋季Co的平均浓度淡水>海水>冲淡水;春夏两季趋势一致Co浓度表现为淡水>冲淡水>海水的规律。区分咸淡水域后观察其在不同季节的浓度数据可知,淡水Co浓度随季节变化幅度最大,表现为秋季<春季<夏季;海水Co浓度随季节变化幅度较小,其含量春季<秋季<夏季;冲淡水中Co含量受到淡水及海水的共同作用,其浓度介于二者之间,表现为秋季<春季<夏季。
-
海水中Co的生物地球化学循环受到水团输运混合、盐度变化、吸附与解吸、生命活动等过程的影响。为解析驱动长江口Co生物地球化学行为的主要因素,在不考虑季节变化的前提下,将长江口所采样品按水域分析Co浓度与盐度(salinity, S)、温度(temperature, T)、溶解无机氮(dissolved inorganic nitrogen , DIN)、溶解无机磷酸盐(dissolved inorganic phosphates , DIP)、溶解态无机硅酸盐(dissolved inorganic silicate , DSi)、溶解氧(dissolved oxygen, DO)及叶绿素(chlorophyll, Chl)等环境因子的皮尔逊相关性(表6)。结果表明,在统计学上Co的浓度与环境参数之间存在一定程度上的相关,且不同水域和不同季节的相关性存在差异。
较好的相关性可以证明来源上的相关或生物地球化学行为上的相似[49],长江口及其邻近海域Co与盐度、3种营养盐及溶解氧表现出极显著相关,与叶绿素显著相关;相较于其他因子,盐度和氮营养盐与Co相关性较强。着眼于不同水域,淡水区域Co与水体中Chl和DO含量极显著正相关,与DIN、DSi显著相关;冲淡水区域Co与环境因子的相关性则较为复杂,与S、DIN及DO极显著相关,与DSi和Chl含量呈现显著相关;海水区域 Co的生物地球化学行为与环境因子的关系较为单一,仅与DIP表现出极显著的正相关关系。
DSi与Co的相关性或为来源上的相关。有研究表明,上游岩石矿物的强烈风化剥蚀或为长江中Co的主要来源[50-53],且Co与铝硅酸盐和其他风化条件等有着较好的相关性[54-55],因此越靠近淡水区二者相关性越强。DIP与Co则主要为生物地球化学行为上的相似,溶解态Co和可溶性活性磷酸盐(Co: DIP)在海洋透光带内表现为正相关,可以解释为该区域主要浮游生物群落对Co的利用程度及其随后从生物颗粒相再矿化在时间尺度上的综合积累信号[56-57];同时在海洋环境中浮游植物对 Co的比吸收率高于锰,这可能使得Co成为具有介于锰和更多营养类型元素(如锌)之间的生物地球化学效应的中间体,从而被更多浮游生物利用[10],因此Co与DIP的相关性在海水区域明显高于淡水区和冲淡水区。
当忽略地理位置,仅对Co随季节变化加以讨论,对长江口及其邻近海域Co浓度与环境因子做皮尔逊相关性分析(表7),以分析不同季节、水域条件下Co的生物地球化学循环可能的驱动因素。
盐度与Co在每个季节都表现出极显著的负相关,可以认为盐度是主导河口Co的重要影响因子,对墨西哥湾的研究也指出Co浓度与水体盐度有很强的线性关系[15, 25],且盐度升高时颗粒态Co更容易被移除[34],因此盐度升高时通常伴随着Co的浓度的降低。对于营养盐,DIN与Co始终表现出较好的相关性,且春季>夏季>秋季;DSi次之,春季>秋季>夏季;DIP与Co的相关性在3种营养盐中相对较低,仅在春夏季节表现出相关性,秋季相关性不显著。春秋两季Co与DSi的相关性大于夏季,或为 Co随铝硅酸盐的风化侵蚀作用较强所致。
对于各季节的特殊影响因子,秋季Co与温度存在较好的相关性,或为温度影响水体中的氧化细菌的活性所致[24];结合盐度及营养盐数据,温度也可以通过咸淡水混合程度或浮游生物消耗程度产生影响。春季时Co与营养盐相关性更强,同时与Chl也有着极显著的相关性,表现出生物吸收作用的主导地位。夏季与DO的极显著的负相关关系,可能是因为溶解氧会影响水体中Co的存留状态[18],由于夏季水温较高使得水体中溶氧较低,伴随氧化颗粒物的移除的Co减少,此外当沉积物中氧化颗粒物被还原时Co也将随之释放到水体中[26];夏季Co与DSi的强相关性或也指示来源上的增多。
-
Co在长江口及其邻近海域的浓度随盐度梯度的上升呈现降低趋势(图2)。西班牙Vigoria河口的研究指出河流输送是该区域Co的主要来源[26],本研究表明长江携带的Co也是影响河口Co分布的重要因素。其中,长江口的春季淡水端元Co浓度明显高于秋季,夏季的Co分布类似春季,但其浓度显著高于秋季与春季,河口处浓度可达0.5 nmol·L−1。
对不同季节Co浓度随盐度梯度的变化进行分析(图3),可见Co在长江口的生物地球化学行为除物理意义上的咸淡水混合导致的稀释作用外还存在其它因素的干扰,总体表现为移除型分布。相较而言,锦江(韩国)河口及麦肯齐河河口处Co在盐度为9‰—12‰范围内存在一个Co的峰值[33,35],加尔沃斯顿湾Co在河口中盐度区域表现出非保守的补充行为[58],但本研究在中盐度范围的样品量有限,导致对长江口中盐度Co行为的认识尚不清晰。
采用Vieira的方法[59]计算3个季节的Co移除率:对各航次中高盐度站位数据点进行线性拟合,拟合线见图3中3条虚线,拟合回归方程如图所示;取其截距(y0)与本研究在河口处0盐度区域的Co浓度平均值(C0)进行比对,最终对其移除率(removal rate, RR)进行量化(式1,表8)。
基于本研究3个季节的河口端Co浓度及移除率,采用长江水利网发布的《长江流域重要控制断面水资源监测通报》 (数据来源:www.cjw.gov.cn)所报道的大通站各季节长江向海输水量(Q),对3个季节长江向海输送的有效Co通量(flux)进行计算(式2),结果见表8。如表8所示,Co在长江口的移除效果秋季最为明显,夏季次之,春季较微。
表8展示了由3个航次长江口Co分布推算出的移除率,表现为秋季>夏季>春季。夏季移除率较高,但由于夏季淡水端元Co浓度最高且径流量极高,夏季向海输送Co通量最高;秋季移除率最高且淡水端元浓度最低,因此向海洋输送Co最少;春季虽径流量较低,但淡水端元Co浓度高于秋季,且移除率最低,因此Co的向海输送通量高于秋季,但受径流量及淡水端浓度限制,输送通量仍然低于夏季。综上所述,长江口Co的有效入海通量表现为夏季>春季>秋季。
-
目前对河流中Co的研究主要集中在重工业区域,人为因素造成的影响愈发显著,在工业区或点源污染的河流区域所采样品浓度显著高于本研究报道数据,如汉江[60]污染区Co浓度达38.01 nmol·L−1,印度Mahanadi河[61]污染区达57.35 nmol·L−1、Manjira河[62]达47.51 nmol·L−1,意大利的Po河[63]甚至可达103 nmol·L−1。全球河流向海输送Co通量估算见表9。Co浓度采用河流或河口处溶解态Co浓度的平均值,同时以河流径流量对各区域Co浓度进行归一化得Cn,计算其在全球各河流向海输送Co浓度的平均值。归一化系数即为河流径流量在给出的全部河流径流量之和中的占比。
对上述河流基于流量归一化估算出全球河流向海输送平均Co浓度为1.61 nmol·L−1。河流向海年输水量以3.80×10¹⁹ g计[76-77],在不考虑移除效果时,全球河流年向海输送Co通量可达3.60×10⁹ g。当考虑移除效果时,假设移除率采用本研究长江口3个季度移除率的平均值(36%),计算可得河流有效年向海输送通量仅为2.32×10⁹ g。
Gaillardet等根据全球河流溶解Co浓度计算所得的年通量为5.5×10⁹ g[74],而Tagliabue等基于Co/C为12 μmol·mol-1[24]估算出河流对全球大洋的Co年贡献值为3.4×10⁸ g。两种估算方法得到的通量相差1个数量级。在不考虑移除效果时,本研究的估算通量与Gaillardet的估算结果类似,但考虑到Co在河口区域的移除,Gaillardet估算的河流向海年输送Co的通量可能被高估。本研究表明了河口界面Co行为研究的重要性。如果考虑到河流携带颗粒物可能通过输运和解吸向海洋输送,河流向海年输送Co的通量达2.48×10¹⁰ g[23,32,78]。本文目前的数据无法对长江颗粒态Co的贡献进行定量,相关结论需待进一步研究。
-
本研究对Co在长江口的生物地球化学行为及其可能存在的机理做出如下阐释:(1)长江口及其临近海域的Co浓度分布呈现出明显的自河口向远海降低的趋势,整体表现出河口的移除行为;(2)从季节来看,长江口表层水Co浓度夏季>春季>秋季,春秋两季较为接近;(3)相关性分析表明Co浓度与盐度表现出强烈的相关性,表明咸淡水混合是调控长江口Co分布的主要因素;(4)长江口表层水Co在不同季节与不同营养盐种类呈现了不同的相关性,在春季显现出与叶绿素的相关性,夏季则与水体中溶解氧显著负相关;(5)长江口Co的移除率秋季>夏季>春季,向海有效输送通量夏季>春季>秋季;(6)河口的行为影响河流向海输送Co的通量,本研究表明了河口界面Co行为研究的重要性。
致谢:感谢国家自然科学基金委员会共享航次计划项目提供的共享航次(航次编号:NORC2021-03),以及同济大学海洋地质国家重点实验室共享航次(航次编号:KECES-2019)的资助。感谢“浙渔科2”号/“润江1”号科考船的船员帮助样品采集。感谢航次期间协助完成采样的同事和同学。感谢在样品分析、数据分析等方面提供帮助的同学。
长江口及其邻近海域表层水体Co的季节分布
Seasonal distribution of Co in the surface waters of the Changjiang Estuary and its adjacent waters
-
摘要: 钴(Co)对海洋中的生物地球化学循环过程起着不可或缺的作用。河口是陆源物质进入海洋的重要界面,而Co在长江口界面的生物地球化学行为尚不明确。本文使用自动固相萃取-电感耦合等离子体联用技术对长江口及其附近海域2019年9月(秋季)、2021年3月(春季)和2021年7月(夏季)的表层水中的溶解Co进行了分析。结果显示,秋季Co浓度的范围在0.05—0.24 nmol·L−1,均值为0.10 nmol·L−1;春季为0.05—0.37 nmol·L−1,均值为0.13 nmol·L−1,略高于秋季;夏季为0.03—0.54 nmol·L−1,均值高达0.26 nmol·L−1,浓度最高。Co与盐度、营养盐、叶绿素及溶解氧在不同季节表现出不同的相关性,表明长江口Co的行为受多因素的影响。长江口溶解Co浓度自河口向外海逐渐降低,整体表现为移除型分布类型。长江口Co移除率秋季>夏季>春季,向海有效输送通量夏季>春季>秋季。Abstract: Cobalt (Co) plays a crucial role in biogeochemical cycling processes in the ocean. Estuaries are the important interface for terrigenous materials to enter the ocean, and the biogeochemical behavior of Co at the interface of the Changjiang (Yangtze) estuary remains unclear. In this study, dissolved Co in the surface waters of the Changjiang River Estuary and its adjacent waters in September 2019 (autumn), March 2021 (spring) and July 2021 (summer) was analyzed by automatic solid phase extraction and inductively coupled plasma technology. The results show that the concentration of Co ranges from 0.05 to 0.24 nmol·L−1 with an average of 0.10 nmol·L−1 in autumn; 0.05 to 0.37 nmol·L−1 with an average of 0.13 nmol·L−1 in spring, slightly higher than that in autumn; 0.03 to 0.54 nmol·L−1 with an average of 0.26 nmol·L−1 in summer, which was the highest concentration. Co shows different correlations with salinity, nutrients, chlorophyll and dissolved oxygen in different seasons, indicating that the behavior of Co in the Changjiang Estuary is affected by multiple factors. The dissolved Co concentration in the Changjiang River Estuary gradually decreases from the estuary to the sea, showing a general removal-type distribution. The removal rate of Co in the Changjiang Estuary behaves as autumn> summer> spring, and the effective transport flux to the sea follows the order of summer> spring> autumn.
-
Key words:
- Changjiang Estuary /
- Co /
- seasonal distribution /
- estuarine behavior
-
钴(Cobalt, Co)是海洋中一种关键的无机痕量金属,在海洋生物地球化学过程中扮演着重要角色。Co是海洋浮游生物的必需元素。浮游生物可利用Co作为金属因子构成体内一些有机结构,如作为维生素B12的中心原子在海洋生物中广泛存在[1-3];或利用Co作为辅基参与形成生物体内的金属酶,如替代锌参与碳酸酐酶的辅酶或利用Co胺素在体内合成蛋氨酸等[4-9]。生物吸收实验表明,在海洋环境中浮游生物对Co的需求可能介于锰和营养型金属元素(如锌等)之间[10],且与浮游生物的需求相比,海水中的生物可利用Co处于匮乏状态[11-12]。溶解态Co在海水中主要以自由离子或络合物的形态存在,且活性Co相对稳定络合态有着更高的生物活性[13]。
开阔大洋Co分布大多为营养盐型分布模式,表层的溶解态Co被生物消耗而浓度较低,随着再矿化作用浓度从表层到中深度呈上升趋势,中深度到深海呈稳定或下降的趋势。海盆尺度上的Co分布状况为:北冰洋表层Co的浓度极高,可达0.80 nmol·L−1,10倍于北大西洋和南太平洋的表层浓度;北冰洋深层水Co含量约为0.05—0.06 nmol·L−1,略高于太平洋深层水(0.03—0.04 nmol·L−1),而略低于大西洋深层水(0.01—0.09 nmol·L−1)[14-20]。大洋中Co的主要来源是陆地径流、沉积物再悬浮、热液活动及大气沉降[13,15,17-18]。Co从大洋的移除过程主要包括清除作用、生物吸收作用以及随铁锰氧化物等的共沉降[10,18,21-23]。全球大洋Co的通量模型估算结果表明:每年海底沉积物向海输送量达4.0×10¹⁰ g,大气沉降为3.8×10⁹ g,河流输送为3.4×10⁸ g。Co在大洋的平均停留时间约为70 a,其中上层海洋受到强烈的生物消耗、颗粒物沉降及再生等共同作用停留时间仅7 a,而深层海洋可长达250 a[24]。
河流是大洋Co的一个重要来源,并显著影响河口及近海Co的分布。例如,北冰洋在极点处受到穿极流携带的河流输入的补充,Co浓度高达0.21 nmol·L−1 [22];地中海和墨西哥湾表层水Co与盐度的显著负相关关系也表明河流输入对河口或和边缘海Co分布的重要影响 [15,25-27]。人类活动会导致河流中Co含量的增加,例如伊比利亚半岛南部工业区附近的河流体系中Co含量可达背景值的17700倍。这也意味着随着人类活动程度的加剧,河流向大洋输送Co的通量可能会增加[28]。
河口是河流向海物质输送的通道和关键界面,是生物地球化学循环中一种重要的环境体系[29-31]。河流中携带的Co在河口区域受移除作用、颗粒物解吸及悬浮颗粒物再生等作用的影响,并非完全参与全球海洋的生物地球化学循环。因此,Co在河口的行为决定了河流向海洋Co输送的最终通量。例如对圣劳伦斯河的研究指出,由于河口的移除效应,河流中携带的Co最终只有约8%能进入开阔大洋[23,32]。目前,河口区域Co的生物地球化学的行为及其影响因素尚未得出明确的结论,例如:韩国Geum河口Co表现为移除型[33];日本Sagami湾和Wakasa湾的河口区域在低/中盐度区域呈现出溶解态Co的最大值,且保守性随季节变化[34];加拿大Mackenzie河口区域Co则表现出非保守的添加行为[35]。河口Co的行为的不确定性限制了对河流向海洋Co输送通量的估算。
长江是我国第一大河,世界第三长河,河流总长度达6300 km,流域覆盖面积达180万km2,多年径流量平均值达9000亿 m3[36-37]。长江贡献了东海90%以上的淡水输入量,也是我国近海痕量金属的重要来源[37-38]。长江中的Co主要来自于流域岩石矿物的风化与侵蚀[39-40],已有报道长江上、中、下游水体中Co的平均浓度分别为1.53、0.85、0.85 nmol·L−1,若忽略河口的过滤器效应,长江每年向东海Co的输送通量可达40 吨[41]。而Co在长江口行为研究的缺失,限制了对长江向大洋Co输送通量及其生物地球化学规律的认识。为此,本文通过对长江口盐度梯度变化下Co浓度的观测,结合水文和化学辅助参数探讨长江口及其附近海域海水中痕量金属Co的生物地球化学行为及其季节变化。
1. 材料与方法(Materials and methods)
1.1 采样区域
本研究通过搭载同济大学海洋地质国家重点实验室共享航次(KECES-2019)和国家自然科学基金委员会共享航次,分别于2019年9月(秋季),2021年3月(春季)和2021年7月(夏季),在121.05°E—124.00°E,29.60°N—31.77°N的长江口区域,搭载“浙渔科2号 ”和“润江1号”科考船开展长江口及其附近海域痕量金属Co的季节性分布的研究。分别获取了24个秋季、32个春季和24个夏季长江口的表层水样品(图1)。
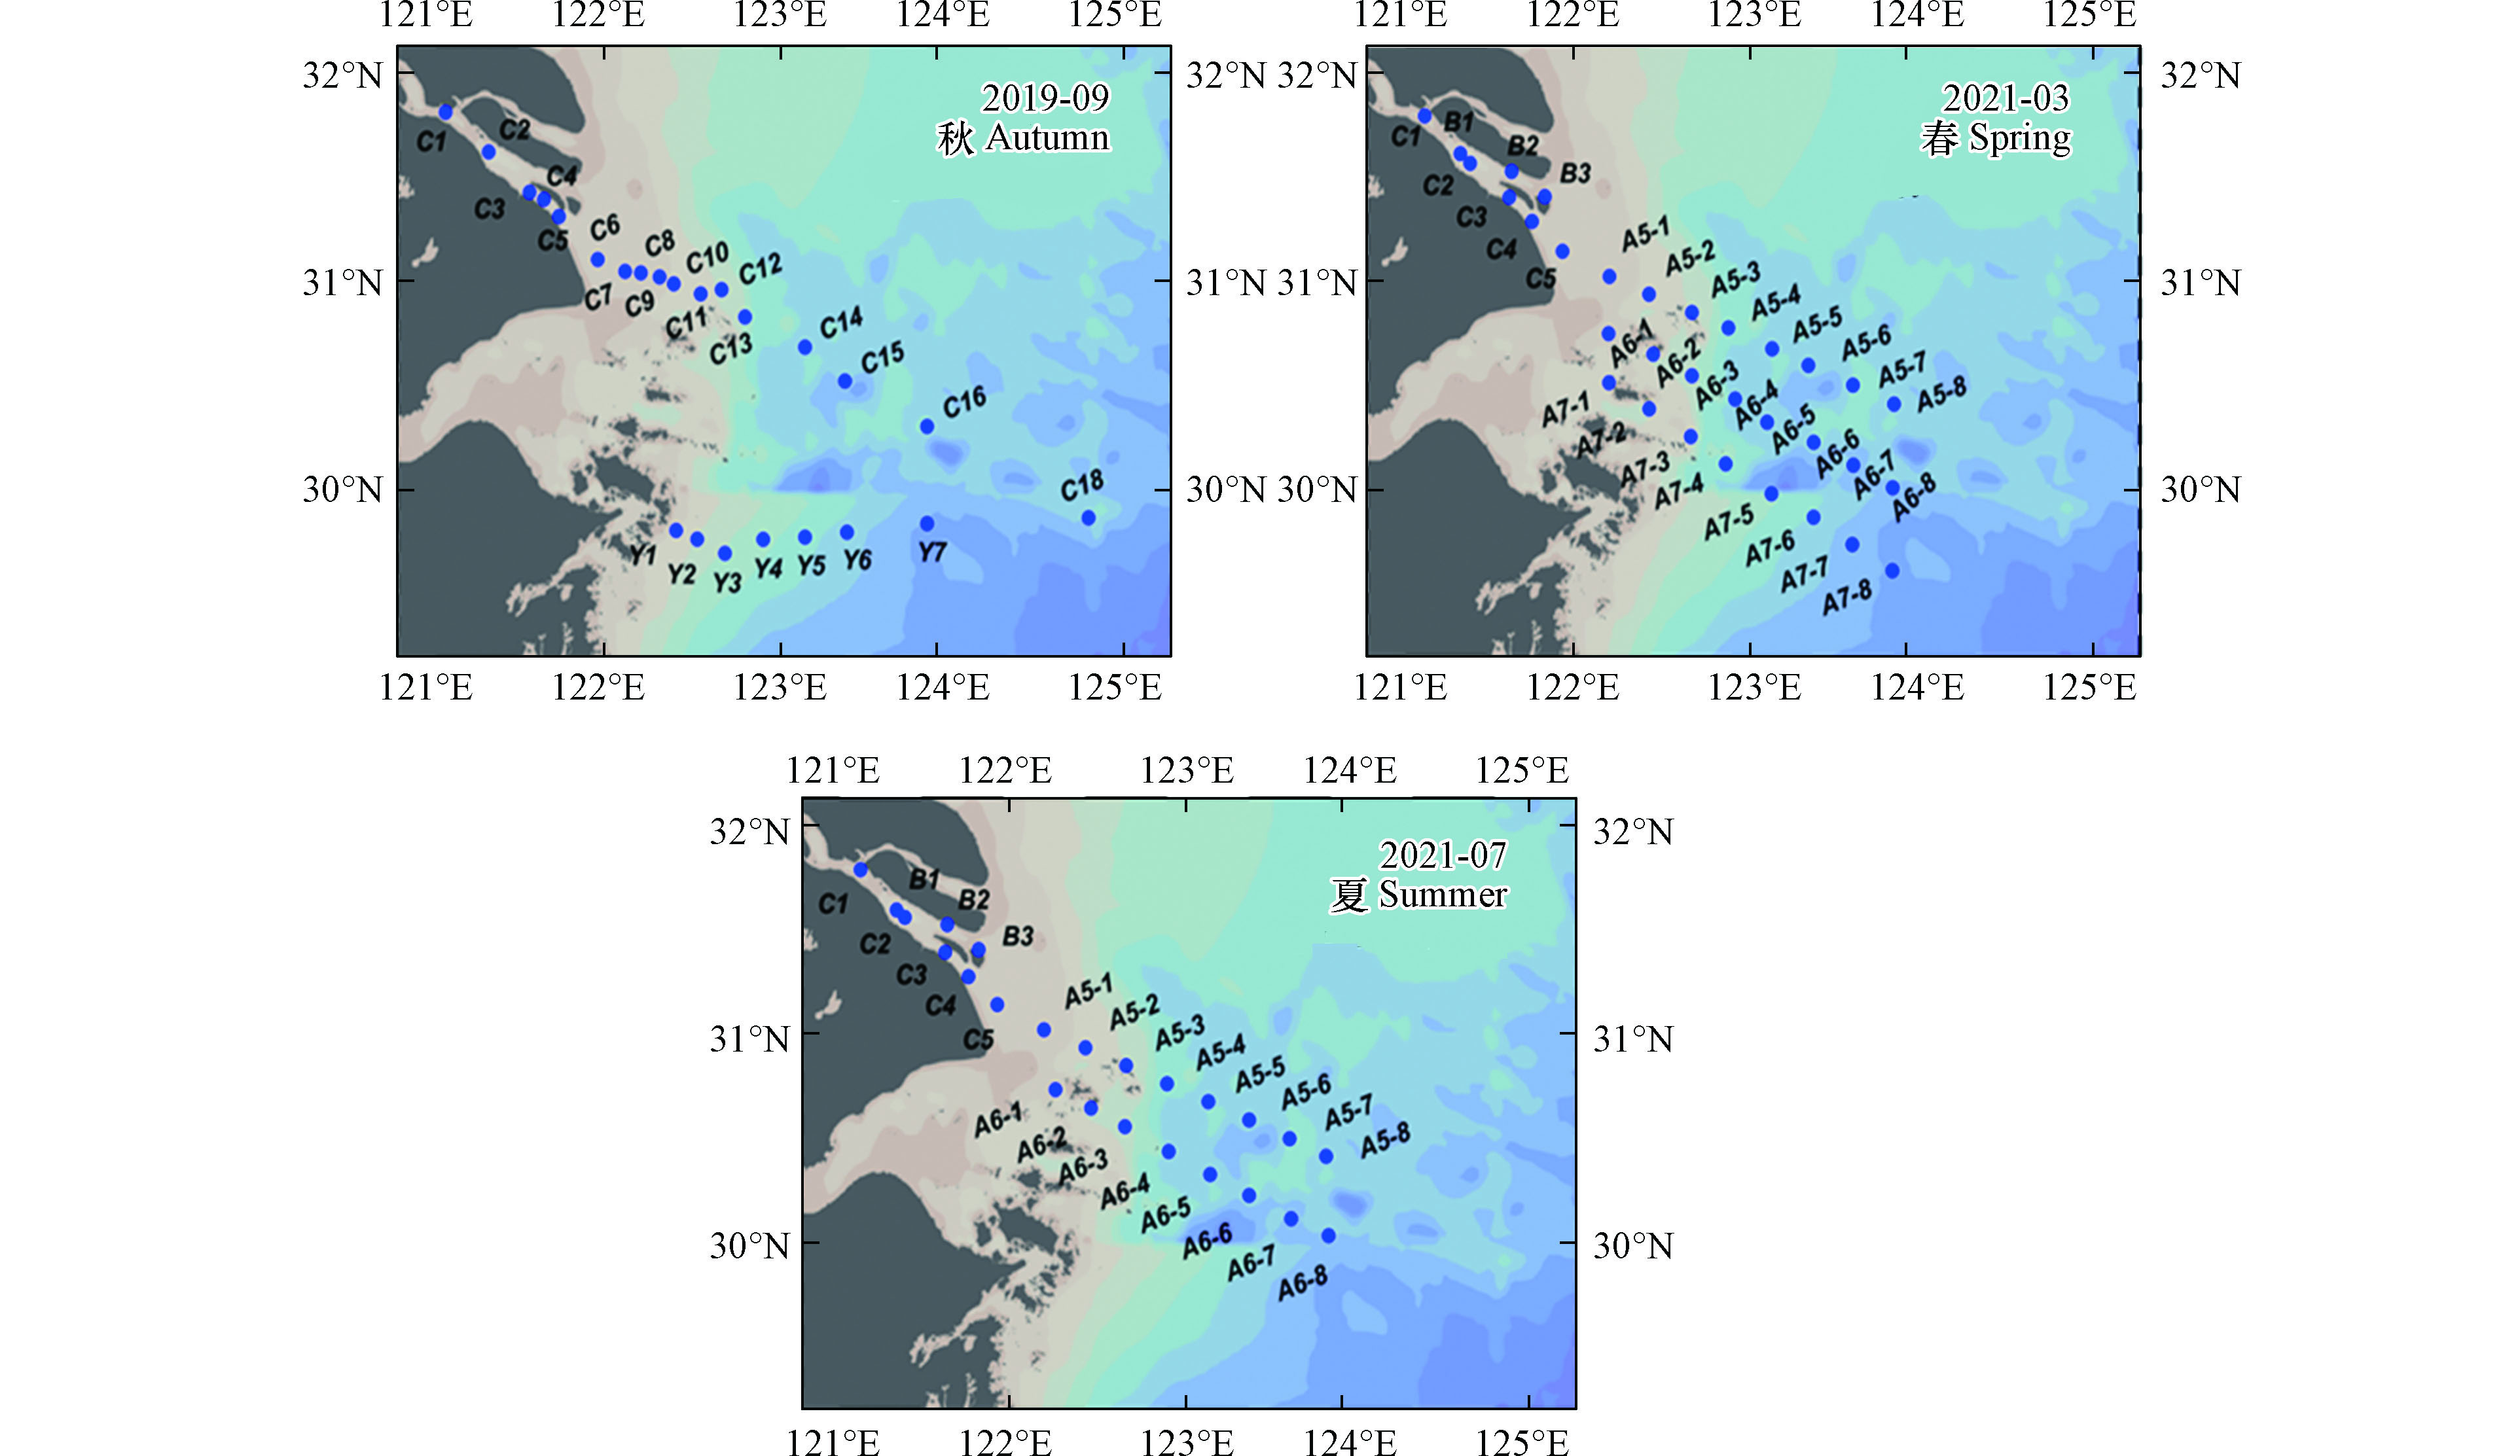 图 1 长江口及其邻近海域站位设置Figure 1. The sampling stations in the Changjiang Estuary and its adjacent waters
1.2 样品采集
表层水样品采用实验室自制的痕量采水器,在船头位于水流的上游区域采集表层水样品。所取水样立即在船舱内搭建的洁净环境中使用蠕动泵经Pall® 0.8/0.2 μm的囊式滤器过滤后装入60 mL 低密度聚乙烯(Nalgene)样品瓶,并装入3层自封袋后封入样品箱,常温保存带回。
1.3 材料与方法
1.3.1 试剂与材料
样品带回后的所有实验操作均在上海交通大学1000级微量金属洁净实验室的100级高效微粒空气(high efficiency particulate air,HEPA)过滤通风橱中进行。实验所用试剂及材料见表1。
表 1 试剂与材料Table 1. Reagents and materials类别 Category 名称 Name 纯度 Purity 公司 Company 用途 Application 试剂 硝酸 Optima级别 Thermo Fisher 配置洗脱液及润洗液等 盐酸1 Optima级别 Thermo Fisher 样品及超纯水酸化等 醋酸 Optima级别 Thermo Fisher 配制缓冲液等 氨水 Optima级别 Thermo Fisher 配制缓冲液等 盐酸2 Trace Metal级别 Thermo Fisher 实验用具清洗 钴标准溶液 ICP-MS级别 Inorganic Ventures 配置外标 Citranox酸性清洁剂 — Alconox 清洁实验所需用具 材料 低密度聚乙烯瓶 — Nalgene 样品采集及酸化 聚乙烯离心管 — VWR Scientific 样品预处理 低密度聚乙烯背板 — ESI 洗脱液收集 | Show Table DownLoad:
CSV
DownLoad:
CSV
seaFAST使用的缓冲液由氨水和醋酸按比例混合制备(pH=6.0±0.2),使用的洗脱液为0.5 mol.L−1的硝酸。ICP-MS自动进样器和seaFAST的润洗液均为0.5%的硝酸。小瓶、离心管和背板均在洁净实验室中按照以下步骤进行清洗[42-43]:在2%Citranox清洁剂中浸泡24 h,用超纯水冲洗7次,然后在10%盐酸中浸泡7 d,用超纯水冲洗7次,使用三层塑料自封袋密封。用于ICP-MS的氩气和氦气为超纯级(>99.999%)。
1.3.2 仪器设备
Milli-Q纯水机:Merck公司。seaFAST S2:Elemental Scientific公司。ESI-2DX自动进样器:Elemental Scientific公司。ICP-MS/MS:Thermo Fisher iCAP TQ电感耦合等离子质谱仪。ICP-MS/MS的工作条件见表2。
表 2 ICP-MS/MS的运行条件Table 2. Operating conditions of ICP-MS/MS运行参数Operating parameters 取值Value 聚焦透镜Focus Lens/V 1.25 透镜1 Lens/V −350 透镜2 Lens/V −148 碰撞/反应气体流速/ (mL·min−1) 4.5 偏转透镜 Deflection lens/V −30 雾化室温度 Spray Chamber temperature/℃ 2.7 蠕动泵转速/ (r·min−1) 40 冷却气流速 Cool flow /(L·min−1) 14 采样深度 Sampling depth/mm 5 功率 Plasma power/W 1550 辅助气流速 Auxilliary flow/ (L·min−1) 0.8 提取透镜电压 Extraction lens /V −120 载气流速 Nebulizer flow/ (L·min−1) 1.08 | Show TableDownLoad:
CSV
1.3.3 样品分析流程
样品带回实验室后使用盐酸l按照1:1000的比例进行酸化并摇匀,静置保存3个月及以上,使未络合的各种形态的Co在酸介质中充分分解[44]。静置后的样品先使用以盐酸l酸化至pH=2的Milli-Q水进行适当稀释,以盐度(Salinity, S)为划分标准进行稀释,0≤S<1‰稀释100倍,1‰≤S<15‰时稀释20倍,S≥15‰时稀释10倍,以避免金属浓度过高而污染seaFAST系统。稀释后的样品使用seaFAST进行分离和富集[45-46],主要经过如下步骤。1. 上样:10 mL样品进入定量环,样品和缓冲液在线混合进入预浓缩柱。在这个过程中,元素被螯合树脂选择性吸附;2. 基质淋洗:超纯水和缓冲液在线混合后通过预富集柱后弃去,从而去除干扰离子和未被螯合的离子;3. 柱洗脱:0.5 mL的0.5 mol·L−1硝酸通过预富集柱,将被分析物从螯合树脂上洗脱至低密度聚乙烯背板,供ICP-MS/MS分析。
本研究用西太平洋表层标准海水(LEMON)为基体配制浓度梯度为0、0.001、0.005、0.01、0.05、0.1、0.2、0.5 μg.L−1的标准曲线进行定量。本方法经过严格的验证,Co的方法检出限为0.003 nmol·L−1,流程空白低于检测限。对加拿大国家研究委员会(National Research Council, Canada)认证的标准样品SLEW-3,SLR-6,CASS-6和NASS-7的分析结果见表3。
表 3 标准参考物质Co分析结果( nmol·L−1)Table 3. Reported analytical results of certified reference seawater( nmol·L−1)国际标准物质Certified reference seawater NASS-7(n=10) CASS-6(n=10) SLEW-3(n=10) SLRs-6(n=10) 测试值 0.0007±0.0001 0.0036±0.0004 0.002±0.000 0.003±0.000 标准值 0.0009±0.0001 0.0040±0.0003 0.002±0.001 0.003±0.001 注:n为测试样本数,标准值由加拿大国家研究委员会发布. Note: n is the number of test samples, and the standard value is published by the National Research Council of Canada. | Show TableDownLoad:
CSV
1.4 辅助参数与数据处理
本文用于认识长江口Co生物地球化学规律的辅助参数,例如温度、盐度、营养盐、溶解氧及叶绿素等环境参数,通过同济大学海洋地质国家重点实验室共享航次和国家自然科学基金委共享航次的数据共享获取。所得数据以Ocean Data View进行平面图绘制,使用IBM SPSS statistics数据编辑器对样品各参数之间进行双变量相关性检验,相关性采用Pearson相关系数,显著性检验采用双尾检验。
2. 结果与讨论(Results and discussion)
2.1 不同季节长江口表层水的水文特征
本研究3个季节长江口及其邻近水域各站位表层水的盐度(S)、温度(T)及Co浓度详细数据见表4。2019年9月秋季航次的水温范围为26.39—29.46 ℃,盐度范围为0.00—32.10‰;2021年3月春季航次水温范围为10.10—17.00 ℃,盐度范围为0.19‰—34.82‰;2021年7月夏季航次水温范围为22.89—28.77 ℃,盐度范围为0.11‰—31.39‰。春季航次中长江口的水温偏低,而研究范围表层水整体盐度较高。在2021年7月和9月的夏秋两季,观测到的温盐范围接近。
表 4 本研究三个航次表层水温度(T)、盐度(S)和钴浓度(Co)Table 4. Temperature (T), salinity (S) and cobalt concentration(Co) in surface water of the three cruises in this study2019年9月(秋季)Autumn 2021年3月(春季)Spring 2021年7月(夏季)Summer 站位Site 盐度/‰Salinity 温度/℃Temperature Co/(nmol·L−1) 站位Site 盐度/‰Salinity 温度/℃Temperature Co/(nmol·L−1) 站位Site 盐度/‰Salinity 温度/℃Temperature Co/(nmol·L−1) C1 0.00 28.92 0.15 B1 0.20 12.41 0.22 B1 0.13 28.41 0.45 C2 0.00 28.67 0.19 B2 0.25 12.08 0.23 B2 0.14 28.62 0.46 C3 0.10 28.79 0.15 B3 1.17 11.88 0.22 B3 0.14 28.49 0.42 C4 0.10 28.87 0.24 C1 0.19 12.73 0.37 C1 0.14 28.39 0.40 C5 0.00 28.92 0.19 C2 0.20 12.45 0.28 C2 0.14 28.46 0.54 C6 2.80 27.77 0.10 C3 0.24 12.24 0.27 C3 0.15 28.48 0.52 C7 12.50 27.25 0.06 C4 1.00 11.97 0.26 C4 0.11 28.43 0.48 C8 15.10 27.47 0.06 C5 6.37 11.24 0.25 C5 2.84 28.30 0.41 C9 18.80 — 0.08 A5-1 23.69 10.10 0.13 A5-1 15.98 24.62 0.21 C10 22.10 26.88 0.05 A5-2 28.93 11.04 0.13 A5-2 21.45 25.06 0.19 C11 24.60 26.39 0.05 A5-3 30.64 11.90 0.12 A5-3 31.39 22.89 0.22 C12 22.10 — 0.12 A5-4 30.36 11.37 0.12 A5-4 29.77 26.69 0.27 C13 25.80 26.40 0.09 A5-5 31.63 12.08 0.08 A5-5 30.92 27.61 0.03 C14 23.10 27.42 0.09 A5-6 32.49 12.36 0.09 A5-6 30.06 28.03 0.10 C15 25.60 27.13 0.09 A5-7 32.71 12.52 0.08 A5-7 29.61 28.20 0.09 C16 25.60 27.43 0.06 A5-8 34.07 12.74 0.06 A5-8 29.08 28.24 0.11 C18 32.10 — 0.06 A6-1 21.09 10.66 0.12 A6-1 19.78 26.44 0.22 Y1 28.80 27.14 0.11 A6-2 26.89 11.09 0.07 A6-2 27.49 23.92 0.28 Y2 27.80 29.07 0.06 A6-3 31.37 12.12 0.13 A6-3 27.66 24.22 0.21 Y3 29.50 29.46 0.10 A6-4 33.20 14.14 0.05 A6-4 29.56 28.29 0.19 Y4 28.40 28.82 0.05 A6-5 33.51 14.17 0.06 A6-5 28.19 28.37 0.11 Y5 28.40 28.84 0.12 A6-6 33.94 14.01 0.07 A6-6 28.46 28.53 0.11 Y6 30.40 29.00 0.15 A6-7 34.01 13.49 0.06 A6-7 29.91 28.22 0.09 Y7 30.60 27.63 0.07 A6-8 34.28 14.89 0.05 A6-8 29.97 28.77 0.13 A7-1 25.89 11.08 0.12 A7-2 27.44 11.24 0.12 A7-3 29.62 12.28 0.12 A7-4 31.53 12.41 0.06 A7-5 34.29 15.62 0.10 A7-6 34.50 16.26 0.07 A7-7 34.82 16.74 0.12 A7-8 34.52 17.00 0.05 注:“—”表示数据缺失. Note: “—” means data missing. | Show TableDownLoad:
CSV
本研究采取咸淡水划分模式,将研究区域划分为淡水区、冲淡水区及海水区。具体以盐度(S)1和30为界限[47-48],将S<1‰划分为淡水区域,1‰≤S≤30‰为冲淡水区域,S>30‰为海水区域,对各站位所属海域进行详细区分可知,2019年9月航次C1—C5位于淡水区,C18、Y6和Y7位于海水区,其余在冲淡水区;2021年3月航次B1—B2、C1—C3位于淡水区,A5的3—8号站、A6的3—8号站及A7的4—8号站位于海水区,其余站位在冲淡水区;2021年7月B1—B3、C1—C4位于淡水区,A5—3/5/6位于海水区,其余在冲淡水区。
2.2 Co的浓度范围和季节变化
长江口金属Co的浓度在不同季节有所差异:秋季Co浓度分布范围0.05—0.24 nmol·L−1,均值0.10 nmol·L−1;春季Co浓度分布范围为0.05—0.37 nmol·L−1,均值为0.13 nmol·L−1;夏季Co浓度较高,其分布范围在0.03—0.54 nmol·L−1,均值高达0.26 nmol·L−1,几乎达到春秋季节的最高值;以Co含量的均值来看,Co在长江口浓度的季节变化表现为夏季>春季>秋季。
从季节变化的角度对本研究中各水域的盐度、温度及Co浓度进行统计(表5)。对于全水域,秋季Co的平均浓度淡水>海水>冲淡水;春夏两季趋势一致Co浓度表现为淡水>冲淡水>海水的规律。区分咸淡水域后观察其在不同季节的浓度数据可知,淡水Co浓度随季节变化幅度最大,表现为秋季<春季<夏季;海水Co浓度随季节变化幅度较小,其含量春季<秋季<夏季;冲淡水中Co含量受到淡水及海水的共同作用,其浓度介于二者之间,表现为秋季<春季<夏季。
表 5 长江口及其临近水域的钴浓度、盐度及温度Table 5. Co, salinity and temperature of the Changjiang Estuary and its adjacent waters季节Season 水域Area 盐度/‰Salinity 温度/℃Temperature Co/(nmol·L−1) 样本数Number 最小值Min 最大值Max 均值Mean 样本数Number 最小值Min 最大值Max 均值Mean 样本数Number 最小值Min 最大值Max 均值Mean 秋 全水域 24 0.00 32.10 18.93±11.82 21 26.39 29.46 28.01±0.97 24 0.05 0.24 0.10±0.05 淡水 5 0.00 0.10 0.04±0.05 5 28.67 28.92 28.83±0.10 5 0.14 0.24 0.18±0.04 冲淡水 16 2.80 29.50 22.56±7.20 14 26.39 29.46 27.68±0.99 16 0.05 0.12 0.08±0.02 海水 3 30.40 32.10 31.03±0.93 2 27.63 29.00 28.31±0.97 3 0.06 0.15 0.09±0.05 春 全水域 32 0.19 34.82 23.60±13.56 32 10.10 17.00 12.76±1.76 32 0.05 0.37 0.13±0.08 淡水 5 0.19 0.25 0.22±0.03 5 12.08 12.73 12.38±0.24 5 0.22 0.37 0.27±0.06 冲淡水 10 1.00 29.62 19.21±11.64 10 10.10 12.28 11.26±0.64 10 0.07 0.26 0.16±0.06 海水 17 30.36 34.82 33.05±1.46 17 11.37 17.00 13.75±1.80 17 0.05 0.13 0.08±0.03 夏 全水域 24 0.11 31.39 18.46±13.48 24 22.89 28.77 27.3±1.8 24 0.03 0.54 0.26±0.16 淡水 7 0.11 0.14 0.13±0.01 7 28.39 28.62 28.47±0.08 7 0.40 0.54 0.47±0.05 冲淡水 14 2.84 29.97 24.98±7.73 14 23.92 28.77 26.99±1.80 14 0.09 0.41 0.19±0.09 海水 3 30.06 31.39 30.79±0.68 3 22.89 28.03 26.18±2.8 3 0.03 0.22 0.12±0.10 | Show TableDownLoad:
CSV
2.3 驱动长江口Co分布变化的因素解析
海水中Co的生物地球化学循环受到水团输运混合、盐度变化、吸附与解吸、生命活动等过程的影响。为解析驱动长江口Co生物地球化学行为的主要因素,在不考虑季节变化的前提下,将长江口所采样品按水域分析Co浓度与盐度(salinity, S)、温度(temperature, T)、溶解无机氮(dissolved inorganic nitrogen , DIN)、溶解无机磷酸盐(dissolved inorganic phosphates , DIP)、溶解态无机硅酸盐(dissolved inorganic silicate , DSi)、溶解氧(dissolved oxygen, DO)及叶绿素(chlorophyll, Chl)等环境因子的皮尔逊相关性(表6)。结果表明,在统计学上Co的浓度与环境参数之间存在一定程度上的相关,且不同水域和不同季节的相关性存在差异。
表 6 各水域Co浓度与其它环境因子的皮尔逊相关性Table 6. Pearson correlation between Co and other environmental factors in different areas水域Area 盐度Salinity 温度Temperature 氮盐DIN 磷盐DIP 硅盐DSi 叶绿素Chlorophyll 溶解氧Dissolved oxygen 全水域 −0.73** 0.2 0.76** 0.33** 0.51** −0.22* −0.36** 淡水 0.27 0.25 0.70* −0.13 −0.72* −0.71** −0.75** 冲淡水 −0.44** −0.17 0.63** 0.22 0.39* −0.38* −0.57** 海水 −0.39 0.18 0.40 0.74** −0.06 0.36 0.02 注:**指相关性在0.01 级别上显著(双尾检验);*指相关性在0.05级别上显著(双尾检验). Note: ** indicates a very significant correlation at the 0.01 level (two-sided), and * indicates a significant correlation at the 0.05 level (two-sided). | Show TableDownLoad:
CSV
较好的相关性可以证明来源上的相关或生物地球化学行为上的相似[49],长江口及其邻近海域Co与盐度、3种营养盐及溶解氧表现出极显著相关,与叶绿素显著相关;相较于其他因子,盐度和氮营养盐与Co相关性较强。着眼于不同水域,淡水区域Co与水体中Chl和DO含量极显著正相关,与DIN、DSi显著相关;冲淡水区域Co与环境因子的相关性则较为复杂,与S、DIN及DO极显著相关,与DSi和Chl含量呈现显著相关;海水区域 Co的生物地球化学行为与环境因子的关系较为单一,仅与DIP表现出极显著的正相关关系。
DSi与Co的相关性或为来源上的相关。有研究表明,上游岩石矿物的强烈风化剥蚀或为长江中Co的主要来源[50-53],且Co与铝硅酸盐和其他风化条件等有着较好的相关性[54-55],因此越靠近淡水区二者相关性越强。DIP与Co则主要为生物地球化学行为上的相似,溶解态Co和可溶性活性磷酸盐(Co: DIP)在海洋透光带内表现为正相关,可以解释为该区域主要浮游生物群落对Co的利用程度及其随后从生物颗粒相再矿化在时间尺度上的综合积累信号[56-57];同时在海洋环境中浮游植物对 Co的比吸收率高于锰,这可能使得Co成为具有介于锰和更多营养类型元素(如锌)之间的生物地球化学效应的中间体,从而被更多浮游生物利用[10],因此Co与DIP的相关性在海水区域明显高于淡水区和冲淡水区。
当忽略地理位置,仅对Co随季节变化加以讨论,对长江口及其邻近海域Co浓度与环境因子做皮尔逊相关性分析(表7),以分析不同季节、水域条件下Co的生物地球化学循环可能的驱动因素。
表 7 Co浓度在不同季节与其他环境参数的皮尔逊相关性Table 7. Pearson correlation between Co and other environmental factors in different seasons季节Season 盐度Salinity 温度Temperature 氮盐DIN 磷盐DIP 硅盐DSi 叶绿素Chlorophyll 溶解氧Dissolved oxygen 秋季 −0.65** 0.55** 0.61** 0.10 0.62** −0.40 −0.15 春季 −0.93** −0.34 0.92** 0.56** 0.92** 0.83** −0.30 夏季 −0.92** 0.18 0.78** 0.67* 0.58* 0.15 −0.76** 注:**指相关性在0.01 级别上显著(双尾检验);*指相关性在0.05级别上显著(双尾检验). Note: ** indicates a very significant correlation at the 0.01 level (two-sided), and * indicates a significant correlation at the 0.05 level (two-sided). | Show TableDownLoad:
CSV
盐度与Co在每个季节都表现出极显著的负相关,可以认为盐度是主导河口Co的重要影响因子,对墨西哥湾的研究也指出Co浓度与水体盐度有很强的线性关系[15, 25],且盐度升高时颗粒态Co更容易被移除[34],因此盐度升高时通常伴随着Co的浓度的降低。对于营养盐,DIN与Co始终表现出较好的相关性,且春季>夏季>秋季;DSi次之,春季>秋季>夏季;DIP与Co的相关性在3种营养盐中相对较低,仅在春夏季节表现出相关性,秋季相关性不显著。春秋两季Co与DSi的相关性大于夏季,或为 Co随铝硅酸盐的风化侵蚀作用较强所致。
对于各季节的特殊影响因子,秋季Co与温度存在较好的相关性,或为温度影响水体中的氧化细菌的活性所致[24];结合盐度及营养盐数据,温度也可以通过咸淡水混合程度或浮游生物消耗程度产生影响。春季时Co与营养盐相关性更强,同时与Chl也有着极显著的相关性,表现出生物吸收作用的主导地位。夏季与DO的极显著的负相关关系,可能是因为溶解氧会影响水体中Co的存留状态[18],由于夏季水温较高使得水体中溶氧较低,伴随氧化颗粒物的移除的Co减少,此外当沉积物中氧化颗粒物被还原时Co也将随之释放到水体中[26];夏季Co与DSi的强相关性或也指示来源上的增多。
2.4 Co跨越长江口盐度梯度的行为分析
Co在长江口及其邻近海域的浓度随盐度梯度的上升呈现降低趋势(图2)。西班牙Vigoria河口的研究指出河流输送是该区域Co的主要来源[26],本研究表明长江携带的Co也是影响河口Co分布的重要因素。其中,长江口的春季淡水端元Co浓度明显高于秋季,夏季的Co分布类似春季,但其浓度显著高于秋季与春季,河口处浓度可达0.5 nmol·L−1。
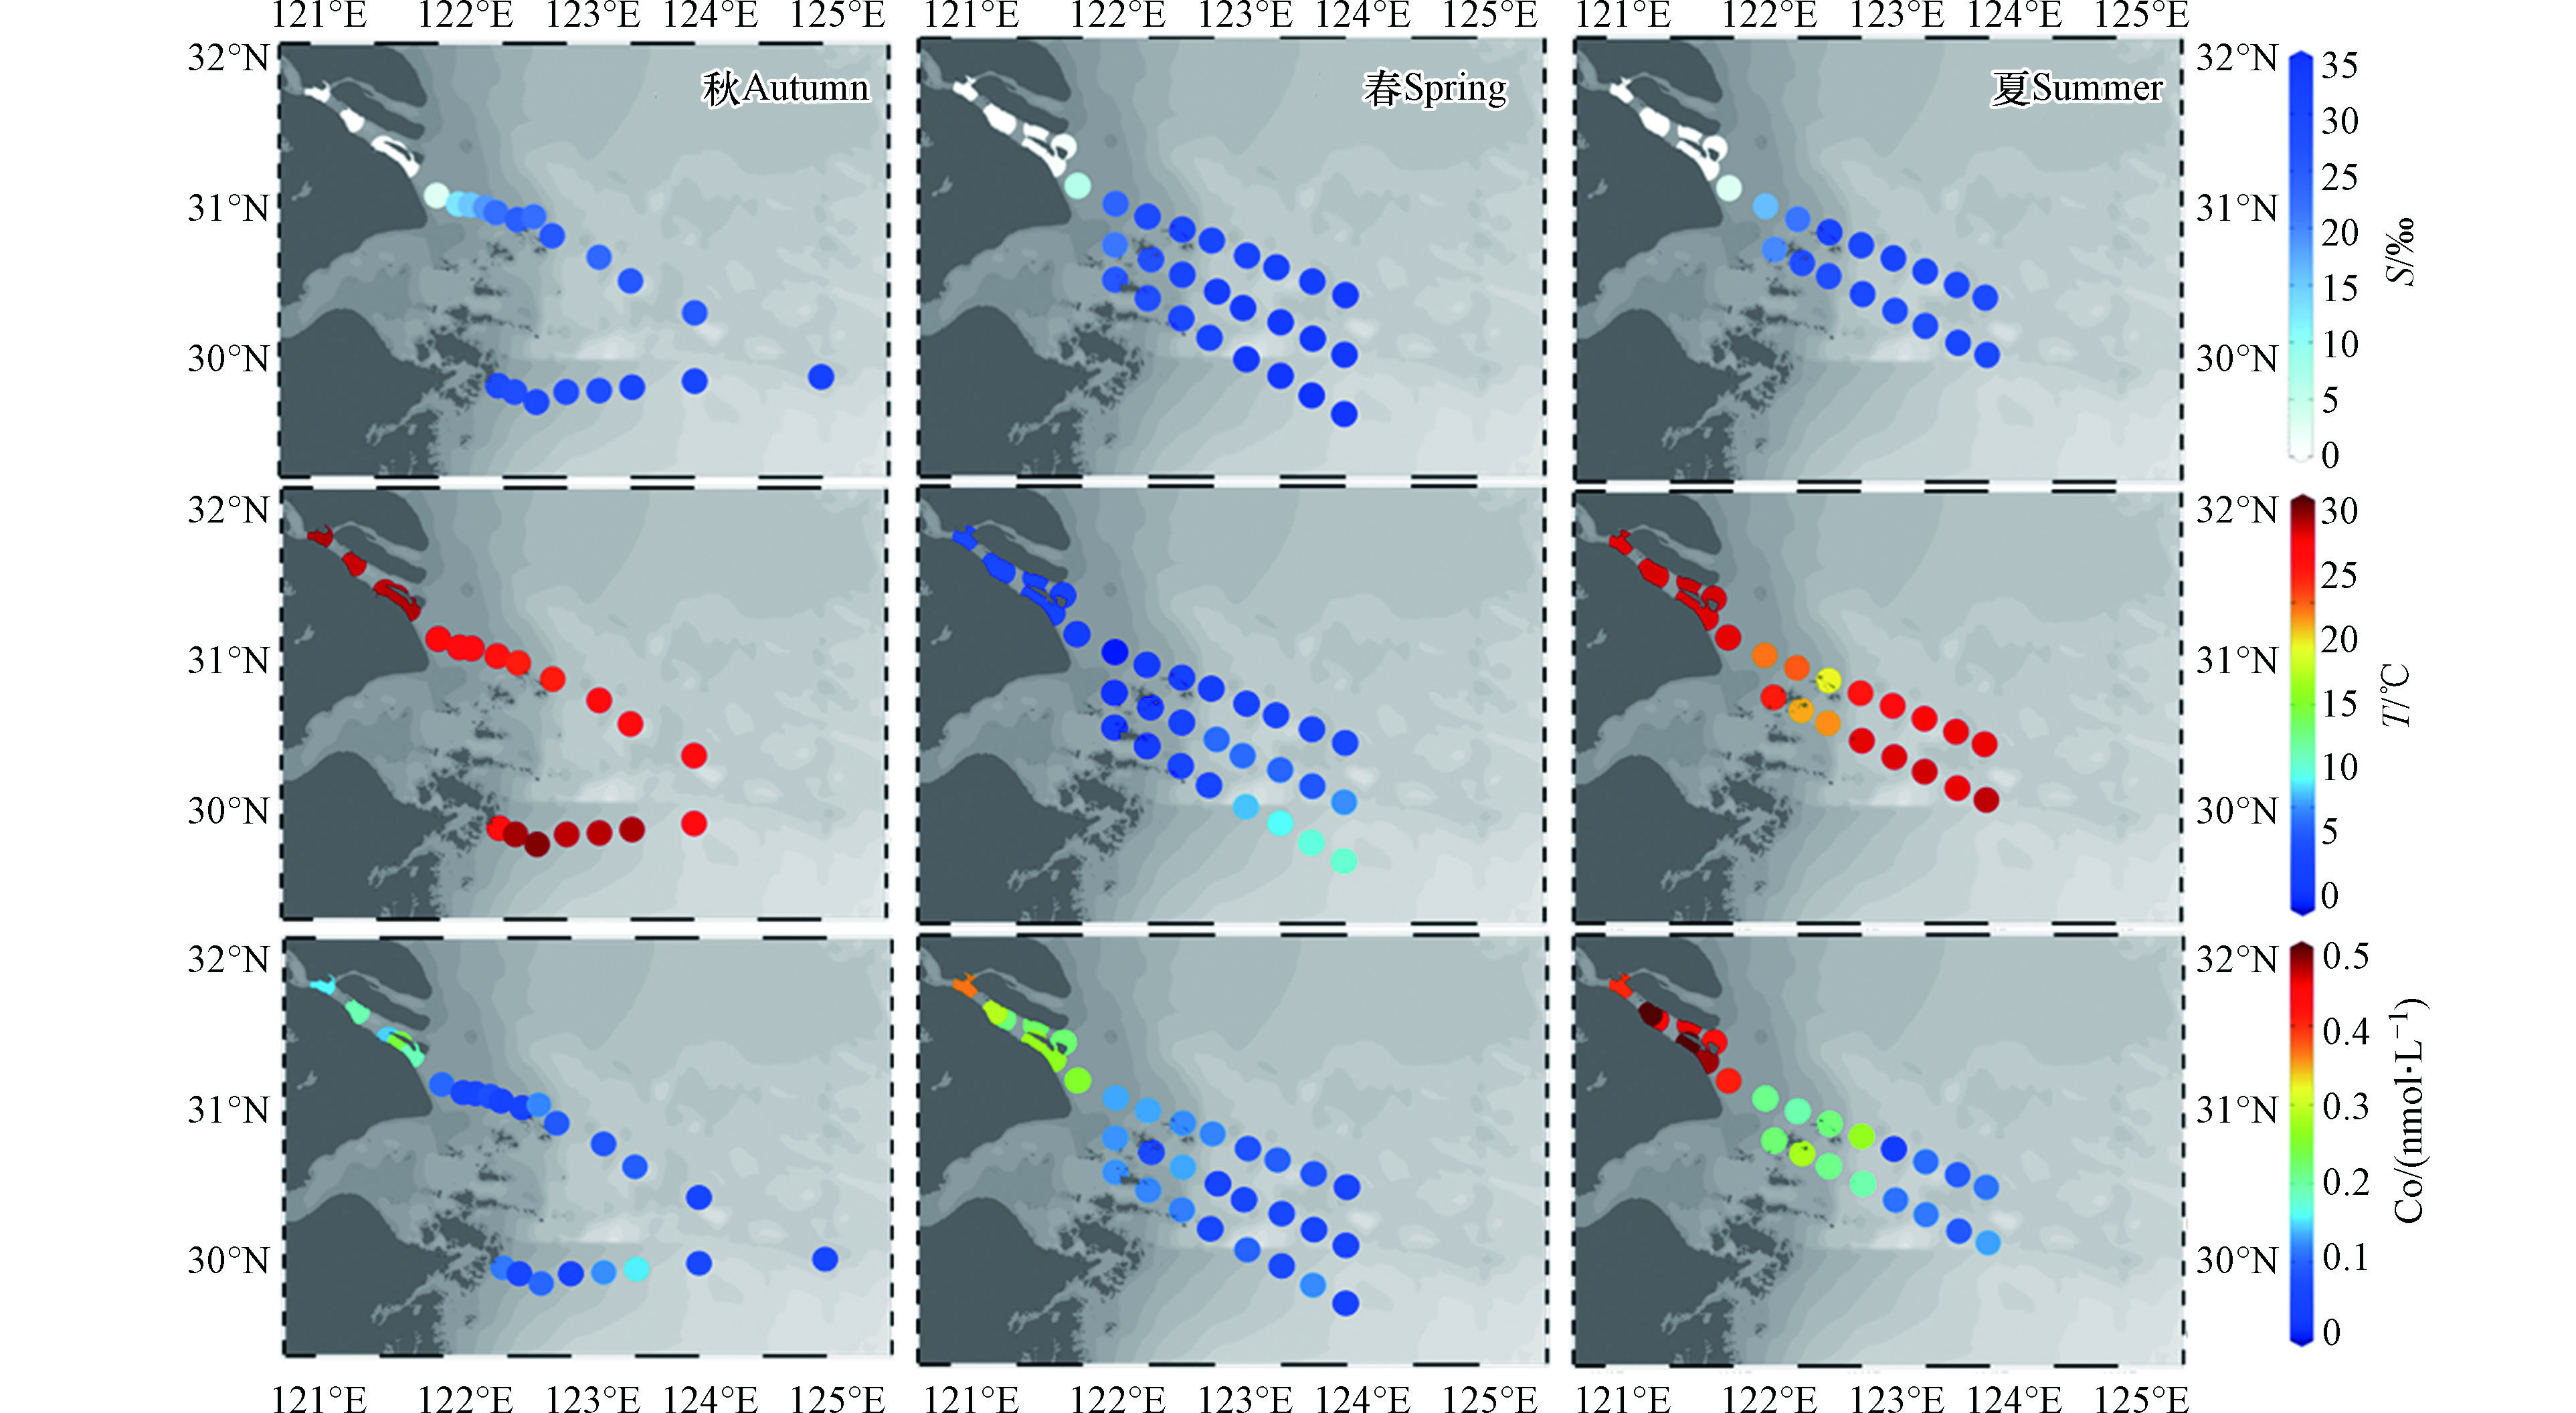 图 2 长江口及其邻近海域盐度、温度及钴浓度分布图Figure 2. The distribution of salinity, temperature and Co in the Changjiang Estuary and its adjacent waters
对不同季节Co浓度随盐度梯度的变化进行分析(图3),可见Co在长江口的生物地球化学行为除物理意义上的咸淡水混合导致的稀释作用外还存在其它因素的干扰,总体表现为移除型分布。相较而言,锦江(韩国)河口及麦肯齐河河口处Co在盐度为9‰—12‰范围内存在一个Co的峰值[33,35],加尔沃斯顿湾Co在河口中盐度区域表现出非保守的补充行为[58],但本研究在中盐度范围的样品量有限,导致对长江口中盐度Co行为的认识尚不清晰。
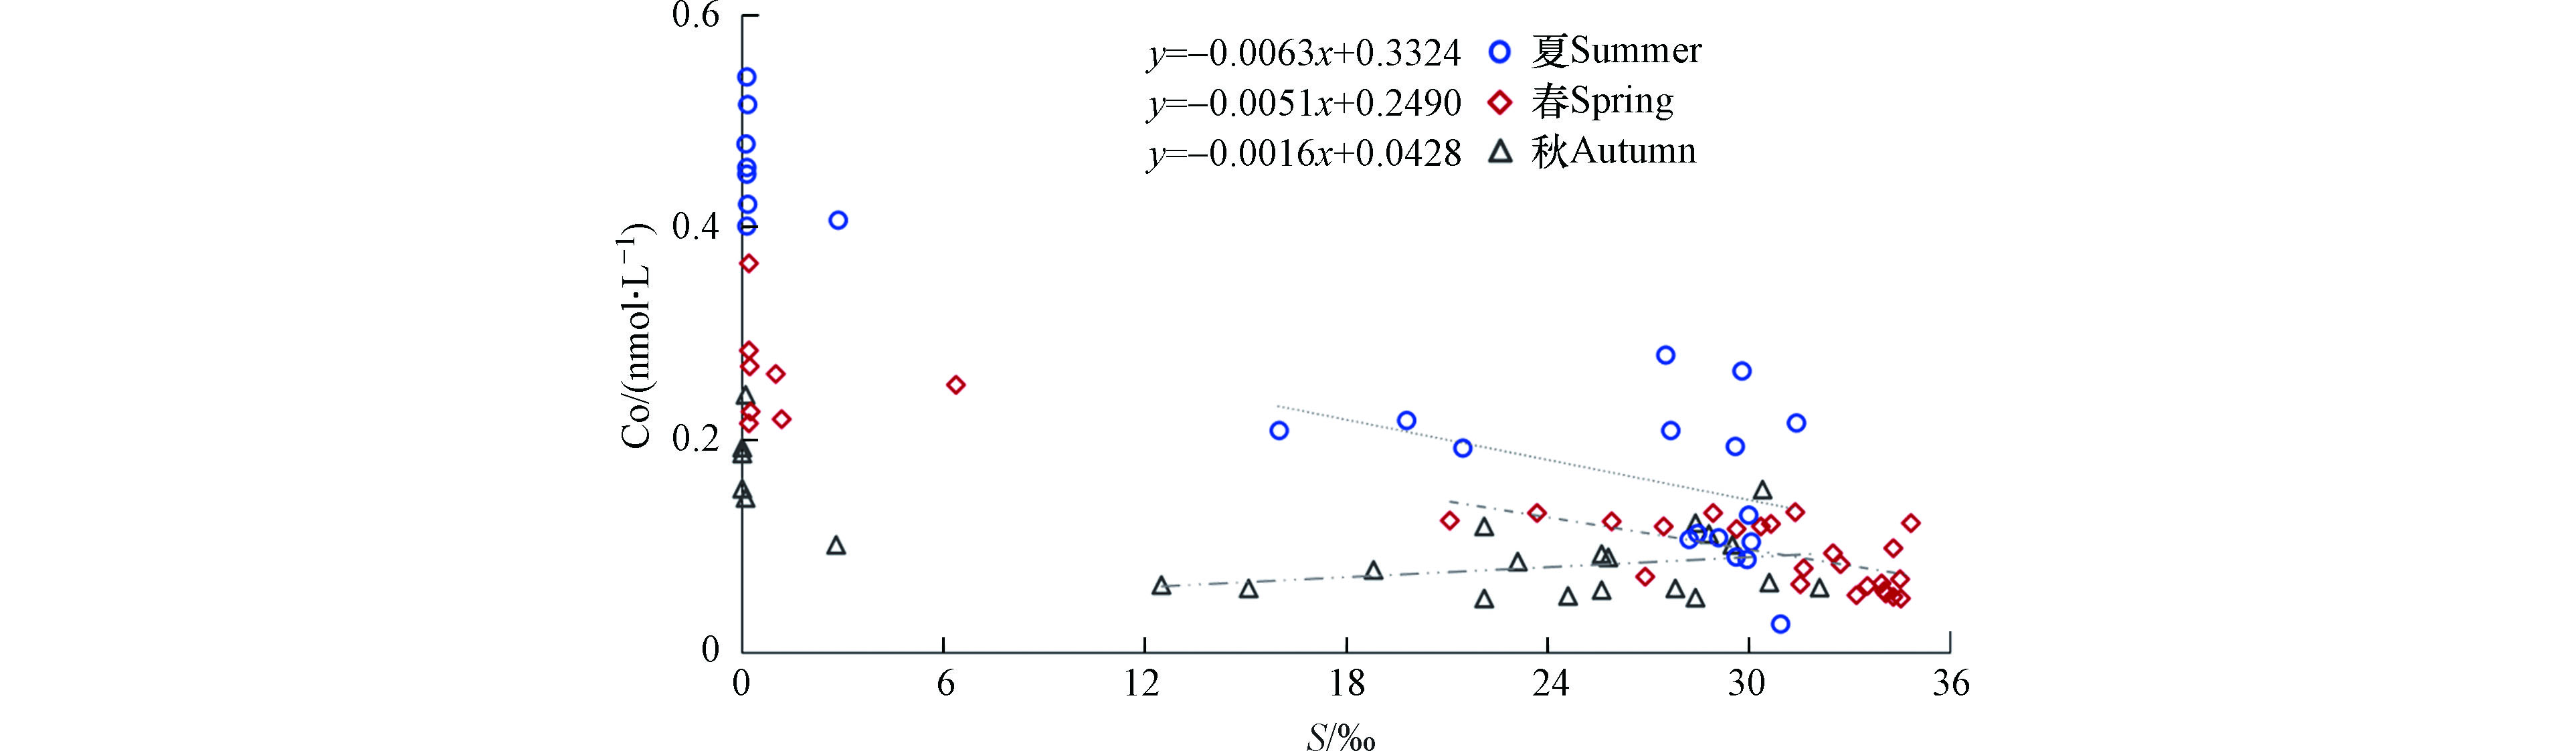 图 3 长江口Co跨越盐度梯度的分布状况Figure 3. Distribution of Co across the salinity gradient in the Changjiang Estuary
采用Vieira的方法[59]计算3个季节的Co移除率:对各航次中高盐度站位数据点进行线性拟合,拟合线见图3中3条虚线,拟合回归方程如图所示;取其截距(y0)与本研究在河口处0盐度区域的Co浓度平均值(C0)进行比对,最终对其移除率(removal rate, RR)进行量化(式1,表8)。
表 8 各季节长江口Co移除率及有效输送通量Table 8. Removal rate and effective flux of cobalt in the Changjiang Estuary in different seasons时间Time 季节Season C0 / (nmol·L−1) y0 / (nmol·L−1) 移除率/%RR 径流量/亿m3Runoff 有效通量/geffective flux 19年9月 秋 0.17 0.04 74.82 632.4 1.60×10⁵ 21年3月 春 0.26 0.25 4.23 530.3 7.78×10⁵ 21年7月 夏 0.46 0.33 27.74 1 178 2.31×10⁶ | Show TableDownLoad:
CSV
stringUtils.convertMath(!{formula.content}) (1) 基于本研究3个季节的河口端Co浓度及移除率,采用长江水利网发布的《长江流域重要控制断面水资源监测通报》 (数据来源:www.cjw.gov.cn)所报道的大通站各季节长江向海输水量(Q),对3个季节长江向海输送的有效Co通量(flux)进行计算(式2),结果见表8。如表8所示,Co在长江口的移除效果秋季最为明显,夏季次之,春季较微。
stringUtils.convertMath(!{formula.content}) (2) 表8展示了由3个航次长江口Co分布推算出的移除率,表现为秋季>夏季>春季。夏季移除率较高,但由于夏季淡水端元Co浓度最高且径流量极高,夏季向海输送Co通量最高;秋季移除率最高且淡水端元浓度最低,因此向海洋输送Co最少;春季虽径流量较低,但淡水端元Co浓度高于秋季,且移除率最低,因此Co的向海输送通量高于秋季,但受径流量及淡水端浓度限制,输送通量仍然低于夏季。综上所述,长江口Co的有效入海通量表现为夏季>春季>秋季。
2.5 世界河流Co的入海通量初步估算
目前对河流中Co的研究主要集中在重工业区域,人为因素造成的影响愈发显著,在工业区或点源污染的河流区域所采样品浓度显著高于本研究报道数据,如汉江[60]污染区Co浓度达38.01 nmol·L−1,印度Mahanadi河[61]污染区达57.35 nmol·L−1、Manjira河[62]达47.51 nmol·L−1,意大利的Po河[63]甚至可达103 nmol·L−1。全球河流向海输送Co通量估算见表9。Co浓度采用河流或河口处溶解态Co浓度的平均值,同时以河流径流量对各区域Co浓度进行归一化得Cn,计算其在全球各河流向海输送Co浓度的平均值。归一化系数即为河流径流量在给出的全部河流径流量之和中的占比。
表 9 世界大河Co浓度、径流量及归一化浓度(Cn)Table 9. Cobalt concentration, runoff and normalized concentration(Cn) in several worldwide rivers河流River 注入海洋Sea areas Co/(nmol·L−1) 径流量/亿m3Runoff 归一化系数Normalization coefficient Cn/(nmol·L−1) 参考文献References 亚马逊河(Amazon River) 大西洋 2.01 47462 0.47 0.94 [64-65] 密西西比河(Mississippi River) 墨西哥湾 0.16 6307 0.06 0.01 [66-67] 长江(Changjiang River) 东海 0.16 9282 0.09 0.01 本研究,[68] 黄河(Yellow River) 渤海 0.43 443 0.00 0.00 [42,68] 珠江(Pearl River) 南海 4.85 4821 0.05 0.23 [68-69] 锦江(韩国)(Geum River) 黄海 1.2 64 0.00 0.00 [33,70] 加尔沃斯顿湾(Galveston Bay) 大西洋 1.6 13600 0.13 0.22 [58] 万泉河(Wanquan River) 南海 1.16 52 0.00 0.00 [71] 文昌/文教河(Wenchang/Wenjiao River) 南海 3.07 6 0.00 0.00 [71] 麦肯齐河(Mackenzie River) 北冰洋 1.1 3160 0.03 0.03 [35] 淡水河(Tanshui River) 台湾海峡 0.3 70 0.00 0.00 [72] 刚果河(Congo River) 大西洋 1 12331 0.12 0.12 [73-74] 圣劳伦斯河(Saint Lawrence River) 大西洋 1.1 3374 0.03 0.04 [74-75] | Show TableDownLoad:
CSV
对上述河流基于流量归一化估算出全球河流向海输送平均Co浓度为1.61 nmol·L−1。河流向海年输水量以3.80×10¹⁹ g计[76-77],在不考虑移除效果时,全球河流年向海输送Co通量可达3.60×10⁹ g。当考虑移除效果时,假设移除率采用本研究长江口3个季度移除率的平均值(36%),计算可得河流有效年向海输送通量仅为2.32×10⁹ g。
Gaillardet等根据全球河流溶解Co浓度计算所得的年通量为5.5×10⁹ g[74],而Tagliabue等基于Co/C为12 μmol·mol-1[24]估算出河流对全球大洋的Co年贡献值为3.4×10⁸ g。两种估算方法得到的通量相差1个数量级。在不考虑移除效果时,本研究的估算通量与Gaillardet的估算结果类似,但考虑到Co在河口区域的移除,Gaillardet估算的河流向海年输送Co的通量可能被高估。本研究表明了河口界面Co行为研究的重要性。如果考虑到河流携带颗粒物可能通过输运和解吸向海洋输送,河流向海年输送Co的通量达2.48×10¹⁰ g[23,32,78]。本文目前的数据无法对长江颗粒态Co的贡献进行定量,相关结论需待进一步研究。
3. 结论(Conclusion)
本研究对Co在长江口的生物地球化学行为及其可能存在的机理做出如下阐释:(1)长江口及其临近海域的Co浓度分布呈现出明显的自河口向远海降低的趋势,整体表现出河口的移除行为;(2)从季节来看,长江口表层水Co浓度夏季>春季>秋季,春秋两季较为接近;(3)相关性分析表明Co浓度与盐度表现出强烈的相关性,表明咸淡水混合是调控长江口Co分布的主要因素;(4)长江口表层水Co在不同季节与不同营养盐种类呈现了不同的相关性,在春季显现出与叶绿素的相关性,夏季则与水体中溶解氧显著负相关;(5)长江口Co的移除率秋季>夏季>春季,向海有效输送通量夏季>春季>秋季;(6)河口的行为影响河流向海输送Co的通量,本研究表明了河口界面Co行为研究的重要性。
致谢:感谢国家自然科学基金委员会共享航次计划项目提供的共享航次(航次编号:NORC2021-03),以及同济大学海洋地质国家重点实验室共享航次(航次编号:KECES-2019)的资助。感谢“浙渔科2”号/“润江1”号科考船的船员帮助样品采集。感谢航次期间协助完成采样的同事和同学。感谢在样品分析、数据分析等方面提供帮助的同学。
-
图 1 长江口及其邻近海域站位设置
Figure 1. The sampling stations in the Changjiang Estuary and its adjacent waters
图 2 长江口及其邻近海域盐度、温度及钴浓度分布图
Figure 2. The distribution of salinity, temperature and Co in the Changjiang Estuary and its adjacent waters
图 3 长江口Co跨越盐度梯度的分布状况
Figure 3. Distribution of Co across the salinity gradient in the Changjiang Estuary
表 1 试剂与材料
Table 1. Reagents and materials
类别 Category 名称 Name 纯度 Purity 公司 Company 用途 Application 试剂 硝酸 Optima级别 Thermo Fisher 配置洗脱液及润洗液等 盐酸1 Optima级别 Thermo Fisher 样品及超纯水酸化等 醋酸 Optima级别 Thermo Fisher 配制缓冲液等 氨水 Optima级别 Thermo Fisher 配制缓冲液等 盐酸2 Trace Metal级别 Thermo Fisher 实验用具清洗 钴标准溶液 ICP-MS级别 Inorganic Ventures 配置外标 Citranox酸性清洁剂 — Alconox 清洁实验所需用具 材料 低密度聚乙烯瓶 — Nalgene 样品采集及酸化 聚乙烯离心管 — VWR Scientific 样品预处理 低密度聚乙烯背板 — ESI 洗脱液收集
下载: 导出CSV
表 2 ICP-MS/MS的运行条件
Table 2. Operating conditions of ICP-MS/MS
运行参数Operating parameters 取值Value 聚焦透镜Focus Lens/V 1.25 透镜1 Lens/V −350 透镜2 Lens/V −148 碰撞/反应气体流速/ (mL·min−1) 4.5 偏转透镜 Deflection lens/V −30 雾化室温度 Spray Chamber temperature/℃ 2.7 蠕动泵转速/ (r·min−1) 40 冷却气流速 Cool flow /(L·min−1) 14 采样深度 Sampling depth/mm 5 功率 Plasma power/W 1550 辅助气流速 Auxilliary flow/ (L·min−1) 0.8 提取透镜电压 Extraction lens /V −120 载气流速 Nebulizer flow/ (L·min−1) 1.08
下载: 导出CSV
表 3 标准参考物质Co分析结果( nmol·L−1)
Table 3. Reported analytical results of certified reference seawater( nmol·L−1)
国际标准物质Certified reference seawater NASS-7(n=10) CASS-6(n=10) SLEW-3(n=10) SLRs-6(n=10) 测试值 0.0007±0.0001 0.0036±0.0004 0.002±0.000 0.003±0.000 标准值 0.0009±0.0001 0.0040±0.0003 0.002±0.001 0.003±0.001 注:n为测试样本数,标准值由加拿大国家研究委员会发布. Note: n is the number of test samples, and the standard value is published by the National Research Council of Canada.
下载: 导出CSV
表 4 本研究三个航次表层水温度(T)、盐度(S)和钴浓度(Co)
Table 4. Temperature (T), salinity (S) and cobalt concentration(Co) in surface water of the three cruises in this study
2019年9月(秋季)Autumn 2021年3月(春季)Spring 2021年7月(夏季)Summer 站位Site 盐度/‰Salinity 温度/℃Temperature Co/(nmol·L−1) 站位Site 盐度/‰Salinity 温度/℃Temperature Co/(nmol·L−1) 站位Site 盐度/‰Salinity 温度/℃Temperature Co/(nmol·L−1) C1 0.00 28.92 0.15 B1 0.20 12.41 0.22 B1 0.13 28.41 0.45 C2 0.00 28.67 0.19 B2 0.25 12.08 0.23 B2 0.14 28.62 0.46 C3 0.10 28.79 0.15 B3 1.17 11.88 0.22 B3 0.14 28.49 0.42 C4 0.10 28.87 0.24 C1 0.19 12.73 0.37 C1 0.14 28.39 0.40 C5 0.00 28.92 0.19 C2 0.20 12.45 0.28 C2 0.14 28.46 0.54 C6 2.80 27.77 0.10 C3 0.24 12.24 0.27 C3 0.15 28.48 0.52 C7 12.50 27.25 0.06 C4 1.00 11.97 0.26 C4 0.11 28.43 0.48 C8 15.10 27.47 0.06 C5 6.37 11.24 0.25 C5 2.84 28.30 0.41 C9 18.80 — 0.08 A5-1 23.69 10.10 0.13 A5-1 15.98 24.62 0.21 C10 22.10 26.88 0.05 A5-2 28.93 11.04 0.13 A5-2 21.45 25.06 0.19 C11 24.60 26.39 0.05 A5-3 30.64 11.90 0.12 A5-3 31.39 22.89 0.22 C12 22.10 — 0.12 A5-4 30.36 11.37 0.12 A5-4 29.77 26.69 0.27 C13 25.80 26.40 0.09 A5-5 31.63 12.08 0.08 A5-5 30.92 27.61 0.03 C14 23.10 27.42 0.09 A5-6 32.49 12.36 0.09 A5-6 30.06 28.03 0.10 C15 25.60 27.13 0.09 A5-7 32.71 12.52 0.08 A5-7 29.61 28.20 0.09 C16 25.60 27.43 0.06 A5-8 34.07 12.74 0.06 A5-8 29.08 28.24 0.11 C18 32.10 — 0.06 A6-1 21.09 10.66 0.12 A6-1 19.78 26.44 0.22 Y1 28.80 27.14 0.11 A6-2 26.89 11.09 0.07 A6-2 27.49 23.92 0.28 Y2 27.80 29.07 0.06 A6-3 31.37 12.12 0.13 A6-3 27.66 24.22 0.21 Y3 29.50 29.46 0.10 A6-4 33.20 14.14 0.05 A6-4 29.56 28.29 0.19 Y4 28.40 28.82 0.05 A6-5 33.51 14.17 0.06 A6-5 28.19 28.37 0.11 Y5 28.40 28.84 0.12 A6-6 33.94 14.01 0.07 A6-6 28.46 28.53 0.11 Y6 30.40 29.00 0.15 A6-7 34.01 13.49 0.06 A6-7 29.91 28.22 0.09 Y7 30.60 27.63 0.07 A6-8 34.28 14.89 0.05 A6-8 29.97 28.77 0.13 A7-1 25.89 11.08 0.12 A7-2 27.44 11.24 0.12 A7-3 29.62 12.28 0.12 A7-4 31.53 12.41 0.06 A7-5 34.29 15.62 0.10 A7-6 34.50 16.26 0.07 A7-7 34.82 16.74 0.12 A7-8 34.52 17.00 0.05 注:“—”表示数据缺失. Note: “—” means data missing.
下载: 导出CSV
表 5 长江口及其临近水域的钴浓度、盐度及温度
Table 5. Co, salinity and temperature of the Changjiang Estuary and its adjacent waters
季节Season 水域Area 盐度/‰Salinity 温度/℃Temperature Co/(nmol·L−1) 样本数Number 最小值Min 最大值Max 均值Mean 样本数Number 最小值Min 最大值Max 均值Mean 样本数Number 最小值Min 最大值Max 均值Mean 秋 全水域 24 0.00 32.10 18.93±11.82 21 26.39 29.46 28.01±0.97 24 0.05 0.24 0.10±0.05 淡水 5 0.00 0.10 0.04±0.05 5 28.67 28.92 28.83±0.10 5 0.14 0.24 0.18±0.04 冲淡水 16 2.80 29.50 22.56±7.20 14 26.39 29.46 27.68±0.99 16 0.05 0.12 0.08±0.02 海水 3 30.40 32.10 31.03±0.93 2 27.63 29.00 28.31±0.97 3 0.06 0.15 0.09±0.05 春 全水域 32 0.19 34.82 23.60±13.56 32 10.10 17.00 12.76±1.76 32 0.05 0.37 0.13±0.08 淡水 5 0.19 0.25 0.22±0.03 5 12.08 12.73 12.38±0.24 5 0.22 0.37 0.27±0.06 冲淡水 10 1.00 29.62 19.21±11.64 10 10.10 12.28 11.26±0.64 10 0.07 0.26 0.16±0.06 海水 17 30.36 34.82 33.05±1.46 17 11.37 17.00 13.75±1.80 17 0.05 0.13 0.08±0.03 夏 全水域 24 0.11 31.39 18.46±13.48 24 22.89 28.77 27.3±1.8 24 0.03 0.54 0.26±0.16 淡水 7 0.11 0.14 0.13±0.01 7 28.39 28.62 28.47±0.08 7 0.40 0.54 0.47±0.05 冲淡水 14 2.84 29.97 24.98±7.73 14 23.92 28.77 26.99±1.80 14 0.09 0.41 0.19±0.09 海水 3 30.06 31.39 30.79±0.68 3 22.89 28.03 26.18±2.8 3 0.03 0.22 0.12±0.10
下载: 导出CSV
表 6 各水域Co浓度与其它环境因子的皮尔逊相关性
Table 6. Pearson correlation between Co and other environmental factors in different areas
水域Area 盐度Salinity 温度Temperature 氮盐DIN 磷盐DIP 硅盐DSi 叶绿素Chlorophyll 溶解氧Dissolved oxygen 全水域 −0.73** 0.2 0.76** 0.33** 0.51** −0.22* −0.36** 淡水 0.27 0.25 0.70* −0.13 −0.72* −0.71** −0.75** 冲淡水 −0.44** −0.17 0.63** 0.22 0.39* −0.38* −0.57** 海水 −0.39 0.18 0.40 0.74** −0.06 0.36 0.02 注:**指相关性在0.01 级别上显著(双尾检验);*指相关性在0.05级别上显著(双尾检验). Note: ** indicates a very significant correlation at the 0.01 level (two-sided), and * indicates a significant correlation at the 0.05 level (two-sided).
下载: 导出CSV
表 7 Co浓度在不同季节与其他环境参数的皮尔逊相关性
Table 7. Pearson correlation between Co and other environmental factors in different seasons
季节Season 盐度Salinity 温度Temperature 氮盐DIN 磷盐DIP 硅盐DSi 叶绿素Chlorophyll 溶解氧Dissolved oxygen 秋季 −0.65** 0.55** 0.61** 0.10 0.62** −0.40 −0.15 春季 −0.93** −0.34 0.92** 0.56** 0.92** 0.83** −0.30 夏季 −0.92** 0.18 0.78** 0.67* 0.58* 0.15 −0.76** 注:**指相关性在0.01 级别上显著(双尾检验);*指相关性在0.05级别上显著(双尾检验). Note: ** indicates a very significant correlation at the 0.01 level (two-sided), and * indicates a significant correlation at the 0.05 level (two-sided).
下载: 导出CSV
表 8 各季节长江口Co移除率及有效输送通量
Table 8. Removal rate and effective flux of cobalt in the Changjiang Estuary in different seasons
时间Time 季节Season C0 / (nmol·L−1) y0 / (nmol·L−1) 移除率/%RR 径流量/亿m3Runoff 有效通量/geffective flux 19年9月 秋 0.17 0.04 74.82 632.4 1.60×10⁵ 21年3月 春 0.26 0.25 4.23 530.3 7.78×10⁵ 21年7月 夏 0.46 0.33 27.74 1 178 2.31×10⁶
下载: 导出CSV
表 9 世界大河Co浓度、径流量及归一化浓度(Cn)
Table 9. Cobalt concentration, runoff and normalized concentration(Cn) in several worldwide rivers
河流River 注入海洋Sea areas Co/(nmol·L−1) 径流量/亿m3Runoff 归一化系数Normalization coefficient Cn/(nmol·L−1) 参考文献References 亚马逊河(Amazon River) 大西洋 2.01 47462 0.47 0.94 [64-65] 密西西比河(Mississippi River) 墨西哥湾 0.16 6307 0.06 0.01 [66-67] 长江(Changjiang River) 东海 0.16 9282 0.09 0.01 本研究,[68] 黄河(Yellow River) 渤海 0.43 443 0.00 0.00 [42,68] 珠江(Pearl River) 南海 4.85 4821 0.05 0.23 [68-69] 锦江(韩国)(Geum River) 黄海 1.2 64 0.00 0.00 [33,70] 加尔沃斯顿湾(Galveston Bay) 大西洋 1.6 13600 0.13 0.22 [58] 万泉河(Wanquan River) 南海 1.16 52 0.00 0.00 [71] 文昌/文教河(Wenchang/Wenjiao River) 南海 3.07 6 0.00 0.00 [71] 麦肯齐河(Mackenzie River) 北冰洋 1.1 3160 0.03 0.03 [35] 淡水河(Tanshui River) 台湾海峡 0.3 70 0.00 0.00 [72] 刚果河(Congo River) 大西洋 1 12331 0.12 0.12 [73-74] 圣劳伦斯河(Saint Lawrence River) 大西洋 1.1 3374 0.03 0.04 [74-75]
下载: 导出CSV
-
[1] GUILLLARD R R L, CASSIE V. Minimum cyanocobalamin requirements of some marine centric diatoms1 [J]. Limnology and Oceanography, 1963, 8(2): 161-165. doi: 10.4319/lo.1963.8.2.0161 [2] RAUX E, SCHUBERT H L, WARREN M J. Biosynthesis of cobalamin (vitamin B12): A bacterial conundrum [J]. Cellular and Molecular Life Sciences:CMLS, 2000, 57(13/14): 1880-1893. [3] MARTENS J H, BARG H, WARREN M J, et al. Microbial production of vitamin B12 [J]. Applied Microbiology and Biotechnology, 2002, 58(3): 275-285. doi: 10.1007/s00253-001-0902-7 [4] SUNDA W G, HUNTSMAN S A. Cobalt and zinc interreplacement in marine phytoplankton: Biological and geochemical implications [J]. Limnology and Oceanography, 1995, 40(8): 1404-1417. doi: 10.4319/lo.1995.40.8.1404 [5] YEE D, MOREL F M M. In vivo substitution of zinc by cobalt in carbonic anhydrase of a marine diatom [J]. Limnology and Oceanography, 1996, 41(3): 573-577. doi: 10.4319/lo.1996.41.3.0573 [6] LANE T W, MOREL F M M. Regulation of carbonic anhydrase expression by zinc, cobalt, and carbon dioxide in the marine diatom Thalassiosira weissflogii [J]. Plant Physiology, 2000, 123(1): 345-352. doi: 10.1104/pp.123.1.345 [7] KELLOGG R M, MCILVIN M R, VEDAMATI J, et al. Efficient zinc/cobalt inter-replacement in northeast Pacific diatoms and relationship to high surface dissolved Co: Zn ratios [J]. Limnology and Oceanography, 2020, 65(11): 2557-2582. doi: 10.1002/lno.11471 [8] ZHANG Y, RODIONOV D A, GELFAND M S, et al. Comparative genomic analyses of nickel, cobalt and vitamin B12 utilization [J]. BMC Genomics, 2009, 10: 78. doi: 10.1186/1471-2164-10-78 [9] HEAL K R, QIN W, RIBALET F, et al. Two distinct pools of B12 analogs reveal community interdependencies in the ocean [J]. Proceedings of the National Academy of Sciences of the United States of America, 2017, 114(2): 364-369. doi: 10.1073/pnas.1608462114 [10] MOFFETT J W, HO J. Oxidation of cobalt and manganese in seawater via a common microbially catalyzed pathway [J]. Geochimica et Cosmochimica Acta, 1996, 60(18): 3415-3424. doi: 10.1016/0016-7037(96)00176-7 [11] SAITO M A, GOEPFERT T J, RITT J T. Some thoughts on the concept of colimitation: Three definitions and the importance of bioavailability [J]. Limnology and Oceanography, 2008, 53(1): 276-290. doi: 10.4319/lo.2008.53.1.0276 [12] MOORE C M, MILLS M M, ARRIGO K R, et al. Processes and patterns of oceanic nutrient limitation [J]. Nature Geoscience, 2013, 6(9): 701-710. doi: 10.1038/ngeo1765 [13] CHMIEL R, LANNING N, LAUBACH A, et al. Major processes of the dissolved cobalt cycle in the North and equatorial Pacific Ocean [J]. Biogeosciences, 2022, 19(9): 2365-2395. doi: 10.5194/bg-19-2365-2022 [14] NOBLE A E, LAMBORG C H, OHNEMUS D C, et al. Basin-scale inputs of cobalt, iron, and manganese from the Benguela-Angola front to the south Atlantic Ocean [J]. Limnology and Oceanography, 2012, 57(4): 989-1010. doi: 10.4319/lo.2012.57.4.0989 [15] DULAQUAIS G, BOYE M, MIDDAG R, et al. Contrasting biogeochemical cycles of cobalt in the surface western Atlantic Ocean [J]. Global Biogeochemical Cycles, 2014, 28(12): 1387-1412. doi: 10.1002/2014GB004903 [16] DULAQUAIS G, BOYE M, RIJKENBERG M J A, et al. Physical and remineralization processes govern the cobalt distribution in the deep western Atlantic Ocean [J]. Biogeosciences, 2014, 11(6): 1561-1580. doi: 10.5194/bg-11-1561-2014 [17] HAWCO N J, OHNEMUS D C, RESING J A, et al. A dissolved cobalt plume in the oxygen minimum zone of the eastern tropical South Pacific [J]. Biogeosciences, 2016, 13(20): 5697-5717. doi: 10.5194/bg-13-5697-2016 [18] NOBLE A E, OHNEMUS D C, HAWCO N J, et al. Coastal sources, sinks and strong organic complexation of dissolved cobalt within the US North Atlantic GEOTRACES transect GA03 [J]. Biogeosciences, 2017, 14(11): 2715-2739. doi: 10.5194/bg-14-2715-2017 [19] SCHLITZER R, ANDERSON R F, DODAS E M, et al. The GEOTRACES intermediate data product 2017 [J]. Chemical Geology, 2018, 493: 210-223. doi: 10.1016/j.chemgeo.2018.05.040 [20] BUNDY R M, TAGLIABUE A, HAWCO N J, et al. Elevated sources of cobalt in the Arctic Ocean [J]. Biogeosciences, 2020, 17(19): 4745-4767. doi: 10.5194/bg-17-4745-2020 [21] BRULAND K W, LOHAN M C. Controls of trace metals in seawater[M]//Treatise on Geochemistry. Amsterdam: Elsevier, 2003: 23-47. [22] NOBLE A E, SAITO M A, MAITI K C, et al. Cobalt, manganese, and iron near the Hawaiian Islands: A potential concentrating mechanism for cobalt within a cyclonic eddy and implications for the hybrid-type trace metals [J]. Deep Sea Research Part Ⅱ:Topical Studies in Oceanography, 2008, 55(10/11/12/13): 1473-1490. [23] HAWCO N J, LAM P J, LEE J M, et al. Cobalt scavenging in the mesopelagic ocean and its influence on global mass balance: Synthesizing water column and sedimentary fluxes [J]. Marine Chemistry, 2018, 201: 151-166. doi: 10.1016/j.marchem.2017.09.001 [24] TAGLIABUE A, HAWCO N J, BUNDY R M, et al. The role of external inputs and internal cycling in shaping the global ocean cobalt distribution: Insights from the first cobalt biogeochemical model [J]. Global Biogeochemical Cycles, 2018, 32(4): 594-616. doi: 10.1002/2017GB005830 [25] SAITO M A, MOFFETT J W. Temporal and spatial variability of cobalt in the Atlantic Ocean [J]. Geochimica et Cosmochimica Acta, 2002, 66(11): 1943-1953. doi: 10.1016/S0016-7037(02)00829-3 [26] SANTOS-ECHEANDIA J, PREGO R, COBELO-GARCÍA A, et al. Porewater geochemistry in a Galician Ria (NW Iberian Peninsula): Implications for benthic fluxes of dissolved trace elements (Co, Cu, Ni, Pb, V, Zn) [J]. Marine Chemistry, 2009, 117(1/2/3/4): 77-87. [27] DULAQUAIS G, PLANQUETTE H, L'HELGUEN S, et al. The biogeochemistry of cobalt in the Mediterranean Sea [J]. Global Biogeochemical Cycles, 2017, 31(2): 377-399. [28] BARRIO-PARRA F, ELÍO J, de MIGUEL E, et al. Environmental risk assessment of cobalt and manganese from industrial sources in an estuarine system [J]. Environmental Geochemistry and Health, 2018, 40(2): 737-748. doi: 10.1007/s10653-017-0020-9 [29] BECK M W, HECK K L, ABLE K W, et al. The Identification, Conservation, and Management of Estuarine and Marine Nurseries for Fish and InvertebratesA better understanding of the habitats that serve as nurseries for marine species and the factors that create site-specific variability in nursery quality will improve conservation and management of these areas [J]. BioScience, 2001, 51(8): 633-641. doi: 10.1641/0006-3568(2001)051[0633:TICAMO]2.0.CO;2 [30] ELSDON T S, de BRUIN M B N A, DIEPEN N J, et al. Extensive drought negates human influence on nutrients and water quality in estuaries [J]. Science of the Total Environment, 2009, 407(8): 3033-3043. doi: 10.1016/j.scitotenv.2009.01.012 [31] WETZ M S, YOSKOWITZ D W. An ‘extreme’ future for estuaries?Effects of extreme climatic events on estuarine water quality and ecology [J]. Marine Pollution Bulletin, 2013, 69(1/2): 7-18. [32] BEWERS J M, YEATS P A. Oceanic residence times of trace metals [J]. Nature, 1977, 268(5621): 595-598. doi: 10.1038/268595a0 [33] BYRD J T, LEE K W, LEE D S, et al. The behavior of trace metals in the Geum estuary, Korea [J]. Estuaries, 1990, 13(1): 8. doi: 10.2307/1351426 [34] TAKATA H, AONO T, TAGAMI K, et al. Processes controlling cobalt distribution in two temperate estuaries, Sagami Bay and Wakasa Bay, Japan [J]. Estuarine, Coastal and Shelf Science, 2010, 89(4): 294-305. doi: 10.1016/j.ecss.2010.08.003 [35] KIPP L E, HENDERSON P B, WANG Z A, et al. Deltaic and estuarine controls on Mackenzie River solute fluxes to the Arctic Ocean [J]. Estuaries and Coasts, 2020, 43(8): 1992-2014. doi: 10.1007/s12237-020-00739-8 [36] YANG S L, XU K H, MILLIMAN J D, et al. Decline of Yangtze River water and sediment discharge: Impact from natural and anthropogenic changes [J]. Scientific Reports, 2015, 5: 12581. doi: 10.1038/srep12581 [37] SUN X S, FAN D J, LIU M, et al. Persistent impact of human activities on trace metals in the Yangtze River Estuary and the East China Sea: Evidence from sedimentary records of the last 60 years [J]. Science of the Total Environment, 2019, 654: 878-889. doi: 10.1016/j.scitotenv.2018.10.439 [38] DONG A G, ZHAI S K, ZABEL M, et al. Heavy metals in Changjiang estuarine and offshore sediments: Responding to human activities [J]. Acta Oceanologica Sinica, 2012, 31(2): 88-101. doi: 10.1007/s13131-012-0195-y [39] ZHANG J, HUANG W W, LIU M G, et al. Drainage basin weathering and major element transport of two large Chinese rivers (Huanghe and Changjiang) [J]. Journal of Geophysical Research:Oceans, 1990, 95(C8): 13277-13288. doi: 10.1029/JC095iC08p13277 [40] 夏星辉, 张利田, 陈静生. 岩性和气候条件对长江水系河水主要离子化学的影响 [J]. 北京大学学报(自然科学版), 2000, 36(2): 246-252. XIA X H, ZHANG L T, CHEN J S. The effect of lithology and climate on major ion chemistry of the Yangtze River system [J]. Acta Scientiarum Naturalium Universitatis Pekinensis, 2000, 36(2): 246-252(in Chinese).
[41] 吴文涛, 冉祥滨, 李景喜, 等. 长江水体常量和微量元素的来源、分布与向海输送 [J]. 环境科学, 2019, 40(11): 4900-4913. WU W T, RAN X B, LI J X, et al. Sources, distribution, and fluxes of major and trace elements in the Yangtze River [J]. Environmental Science, 2019, 40(11): 4900-4913(in Chinese).
[42] LI L, LIU J H, WANG X J, et al. Dissolved trace metal distributions and Cu speciation in the southern Bohai Sea, China [J]. Marine Chemistry, 2015, 172: 34-45. doi: 10.1016/j.marchem.2015.03.002 [43] CUTTER G, ANDERSSON P, CODISPOTI L, et al. Sampling and sample-handling protocols for GEOTRACES cruises[R]. GEOTRACES Standards and Intercalibration Committee , 2010. [44] FLORENCE T M, BATLEY G E. Trace metals species in sea-water—I: Removal of trace metals from sea-water by a chelating resin [J]. Talanta, 1976, 23(3): 179-186. doi: 10.1016/0039-9140(76)80166-X [45] LI L, WANG X J, LIU J H, et al. Dissolved trace metal (Cu, Cd, Co, Ni, and Ag) distribution and Cu speciation in the southern Yellow Sea and Bohai Sea, China [J]. Journal of Geophysical Research:Oceans, 2017, 122(2): 1190-1205. doi: 10.1002/2016JC012500 [46] WUTTIG K, TOWNSEND A T, van der MERWE P, et al. Critical evaluation of a seaFAST system for the analysis of trace metals in marine samples [J]. Talanta, 2019, 197: 653-668. doi: 10.1016/j.talanta.2019.01.047 [47] 苏育嵩, 李凤岐, 王凤钦. 渤、黄、东海水型分布与水系划分 [J]. 海洋学报(中文版), 1996, 18(6): 1-7. SUN Y H, LI F Q, WANG F Q. Distribution and division of water systems in Bohai, Yellow Sea and East China Sea [J]. Acta Oceanologica Sinica, 1996, 18(6): 1-7(in Chinese).
[48] 李健华. 近海与河口区域沉积层与上覆水体间水动力的数学模型及特性研究[D]. 广州: 华南理工大学, 2018. LI J H. Study on hydrodynamic mathematical model and its characteristics between sediment and overlying water in the offshore and estuarine areas[D]. Guangzhou: South China University of Technology, 2018(in Chinese).
[49] KUCUKSEZGIN F, ULUTURHAN E, BATKI H. Distribution of heavy metals in water, particulate matter and sediments of Gediz River (Eastern Aegean) [J]. Environmental Monitoring and Assessment, 2008, 141(1/2/3): 213-225. [50] KLAVINŠ M, BRIEDE A, RODINOV V, et al. Heavy metals in rivers of Latvia [J]. Science of the Total Environment, 2000, 262(1/2): 175-183. [51] CHEN J S, WANG F Y, XIA X H, et al. Major element chemistry of the Changjiang (Yangtze River) [J]. Chemical Geology, 2002, 187(3/4): 231-255. [52] MENDIGUCHÍA C, MORENO C, GARCÍA-VARGAS M. Evaluation of natural and anthropogenic influences on the Guadalquivir River (Spain) by dissolved heavy metals and nutrients [J]. Chemosphere, 2007, 69(10): 1509-1517. doi: 10.1016/j.chemosphere.2007.05.082 [53] WANG L, WANG Y P, XU C X, et al. Analysis and evaluation of the source of heavy metals in water of the River Changjiang [J]. Environmental Monitoring and Assessment, 2011, 173(1/2/3/4): 301-313. [54] RUBIO B, NOMBELA M A, VILAS F. Geochemistry of major and trace elements in sediments of the ria de Vigo (NW Spain): An assessment of metal pollution [J]. Marine Pollution Bulletin, 2000, 40(11): 968-980. doi: 10.1016/S0025-326X(00)00039-4 [55] ROJAS J C, VANDECASTEELE C. Influence of mining activities in the North of Potosi, Bolivia on the water quality of the Chayanta River, and its consequences [J]. Environmental Monitoring and Assessment, 2007, 132(1/2/3): 321-330. [56] STERNER R W, ELSER J J. Ecological Stoichiometry: The biology of elements from molecules to the biosphere[M]//HARRIS G. Ecological Stoichiometry: Biology of Elements from Molecules to the Biosphere[M]. Princeton University Press, 2002. [57] SAITO M A, NOBLE A E, HAWCO N, et al. The acceleration of dissolved cobalt's ecological stoichiometry due to biological uptake, remineralization, and scavenging in the Atlantic Ocean [J]. Biogeosciences, 2017, 14(20): 4637-4662. doi: 10.5194/bg-14-4637-2017 [58] WEN L S, SANTSCHI P, GILL G, et al. Estuarine trace metal distributions in Galveston Bay: Importance of colloidal forms in the speciation of the dissolved phase [J]. Marine Chemistry, 1999, 63(3/4): 185-212. [59] VIEIRA L H, KRISCH S, HOPWOOD M J, et al. Unprecedented Fe delivery from the Congo River margin to the South Atlantic Gyre [J]. Nature Communications, 2020, 11(1): 556. doi: 10.1038/s41467-019-14255-2 [60] LI S Y, ZHANG Q F. Spatial characterization of dissolved trace elements and heavy metals in the upper Han River (China) using multivariate statistical techniques [J]. Journal of Hazardous Materials, 2010, 176(1/2/3): 579-588. [61] SUNDARAY S K, NAYAK B B, KANUNGO T K, et al. Dynamics and quantification of dissolved heavy metals in the Mahanadi River estuarine system, India [J]. Environmental Monitoring and Assessment, 2012, 184(2): 1157-1179. doi: 10.1007/s10661-011-2030-x [62] KRISHNA A K, SATYANARAYANAN M, GOVIL P K. Assessment of heavy metal pollution in water using multivariate statistical techniques in an industrial area: A case study from Patancheru, Medak District, Andhra Pradesh, India [J]. Journal of Hazardous Materials, 2009, 167(1/2/3): 366-373. [63] DAVIDE V, PARDOS M, DISERENS J, et al. Characterisation of bed sediments and suspension of the river Po (Italy) during normal and high flow conditions [J]. Water Research, 2003, 37(12): 2847-2864. doi: 10.1016/S0043-1354(03)00133-7 [64] ESPINOZA VILLAR J C, GUYOT J L, RONCHAIL J, et al. Contrasting regional discharge evolutions in the Amazon Basin (1974-2004) [J]. Journal of Hydrology, 2009, 375(3/4): 297-311. [65] HOLLISTER A, de CARVALHO L M, GLEDHILL M, et al. Distribution and size fractionation of dissolved cobalt and nickel along the Amazon Estuary and mixing plume[C]//Goldschmidt Abstracts. Geochemical Society, 2020. [66] SHILLER A M, BOYLE E A. Trace elements in the Mississippi River Delta outflow region: Behavior at high discharge [J]. Geochimica et Cosmochimica Acta, 1991, 55(11): 3241-3251. doi: 10.1016/0016-7037(91)90486-O [67] SHIM M J, SWARZENSKI P W, SHILLER A M. Dissolved and colloidal trace elements in the Mississippi River delta outflow after Hurricanes Katrina and Rita [J]. Continental Shelf Research, 2012, 42: 1-9. doi: 10.1016/j.csr.2012.03.007 [68] ZHANG J. Biogeochemistry of Chinese estuarine and coastal waters: Nutrients, trace metals and biomarkers [J]. Regional Environmental Change, 2002, 3(1/2/3): 65-76. [69] OUYANG T P, ZHU Z Y, KUANG Y Q, et al. Dissolved trace elements in river water: Spatial distribution and the influencing factor, a study for the Pearl River Delta Economic Zone, China [J]. Environmental Geology, 2006, 49(5): 733-742. doi: 10.1007/s00254-005-0118-8 [70] KIM D, CHO H E, WON E J, et al. Environmental fate and trophic transfer of synthetic musk compounds and siloxanes in Geum River, Korea: Compound-specific nitrogen isotope analysis of amino acids for accurate trophic position estimation [J]. Environment International, 2022, 161: 107123. doi: 10.1016/j.envint.2022.107123 [71] FU J, TANG X L, ZHANG J, et al. Estuarine modification of dissolved and particulate trace metals in major rivers of East-Hainan, China [J]. Continental Shelf Research, 2013, 57: 59-72. doi: 10.1016/j.csr.2012.06.015 [72] FANG T H, LIN C L. Dissolved and particulate trace metals and their partitioning in a hypoxic estuary: The Tanshui Estuary in Northern Taiwan [J]. Estuaries, 2002, 25(4): 598-607. doi: 10.1007/BF02804893 [73] DUPRÉ B, VIERS J, DANDURAND J L, et al. Major and trace elements associated with colloids in organic-rich river waters: Ultrafiltration of natural and spiked solutions [J]. Chemical Geology, 1999, 160(1/2): 63-80. [74] GAILLARDET J, VIERS J, DUPRÉ B. Trace elements in river waters[M]//Treatise on Geochemistry. Amsterdam: Elsevier, 2003: 225-272. [75] CHABAUX F, RIOTTE J, DEQUINCEY O. 13. U-Th-Ra fractionation during weathering and river transport [J]. Reviews in Mineralogy and geochemistry, 2003, 52(1): 533-576. doi: 10.2113/0520533 [76] BERNER E K, BERNER R. Global environment: Water, air, and geochemical cycles[M]. Princeton University Press, 1996. [77] LITTLE S H, VANCE D, WALKER-BROWN C, et al. The oceanic mass balance of copper and zinc isotopes, investigated by analysis of their inputs, and outputs to ferromanganese oxide sediments [J]. Geochimica et Cosmochimica Acta, 2014, 125: 673-693. doi: 10.1016/j.gca.2013.07.046 [78] MILLIMAN J D, FARNSWORTH K L. River Discharge to the Coastal Ocean: a global synthesis [M]. Cambridge: Cambridge University Press, 2013. -

 点击查看大图
计量
- 文章访问数: 3480
- HTML全文浏览数: 3480
- PDF下载数: 74
- 施引文献: 0
