-
全球污水处理厂碳排放量约占总量的1.6%[1-2],我国则占全社会总量的1%~2%[3]。其中,CH4排放量可占达全社会的4%,N2O排放量可达5%。随着提标改造的进行,污水处理行业的碳排放量和排放强度呈上升趋势[4]。因此,污水处理行业仍是“双碳”目标重点关注的行业之一[5]。
现有国内外污水处理厂的碳排放研究主要通过边界界定、源解析、决策建议等方式揭示较大规模污水处理厂碳排放数据的年际变化规律[6]。随着“减污降碳协同增效”需求的提出,减排策略的精准性要求逐渐提升,以往基于年数据的碳排放定量评估已不能充分指导精准减排策略的实施,而基于连续月变化数据的精准碳排放定量评估研究也尚不多见[7]。同时,联合国政府间气候变化专门委员会 (IPCC) 清单模型法中的碳排放因子值往往对应行业和国家的宏观信息,在单个水厂精准评估中往往产生偏差,难以揭示碳排放的动态变化规律[8-9],而采用国外推荐值的排放因子评估我国水厂的适用性也尚存争议[10-11]。因此,基于我国污水处理厂精准运行调度和监测数据,兼顾碳排放核算时空边界条件的复杂性和可获得性,参考我国水厂基准和动态碳排放特征拟定排放因子,才能针对“双碳”目标实施路径的需求弥补相关研究领域的知识缺口。
基于北京市作为首都所应在“双碳”目标中起带头作用的需求,本研究以北京市某区3座典型区级污水处理厂 (处理总量达全区的30%) 为评估对象,结合我国校准后的排放因子,综合参考《城镇水务系统碳核算与减排路径技术指南》 (以下简称“指南”) [12]、《污水处理厂低碳运行评价技术规范》 (以下简称“规范”) [13]和《IPCC 2006 年国家温室气体清单指南 2019 修订版》 (以下简称“清单”) 碳排放核算方法[14],精准识别各个水厂基于月变化数据的动态碳排放边界及特征,对各厂各运行阶段碳排放影响的核心要素及其响应模式进行定量计算分析,梳理“双碳”目标下适合北京市某区各水厂实际运行特征且可行的碳减排路径与策略,为有效助力实现我国污水处理厂精准“双碳”目标提供参考。
-
本研究涉及污水处理厂分别命名为A厂、B厂和C厂,日设计规模总计达17×104 t·d−1,其中A厂为2×10⁴ t·d−1、B厂为10×104 t·d−1、C厂为5×10⁴ t·d−1。各厂主体工艺路线如图1所示,A厂为A2O+MBR,B厂为改良型SBR工艺、C厂则采用C-TECH (循环式活性污泥法) 工艺。3座污水处理厂受纳水体均为周边河流。本研究涉及的3座污水处理厂均无CH4回收装置,且剩余污泥全为浓缩脱水外运后第三方处置。
-
本研究核算污水处理厂运行维护过程产生的碳排放,参照“指南”的排放因子法进行计算,未明确提供的参数同时参考 “清单”和“规范”进行补充。整体碳排放核算可分为直接和间接两部分:直接排放主要核算污水处理产生的化石源CO2、CH4和N2O,排入受纳水体时产生的CH4、N2O及污泥处置产生的碳排放量;间接排放主要核算电能消耗和药耗所产生的碳排放;污水处理生物过程CO2直接排放不纳入排放清单。污水处理厂主要耗电设备有曝气设备、污泥处理设备和提升泵[15]。药耗主要包括外加碳源、絮凝剂和助凝剂、液氯和调控用酸碱等[16]。此外,每种药剂在其生产及运输等过程中也会有碳排放,用其相应的碳排放系数进行衡量[17]。在核算污泥处置过程中的碳排放时,本研究主要考虑浓缩脱水时产生的碳排放。
-
根据“指南”、“清单”和“规范”提供的核算方法进行碳排放核算,主要碳排放因素的计算过程如下。
1) 污水处理产生的化石源CO2排放的核算参考式 (1)~(3) 。
式中:
CESCO2−WW 为污水处理化石源CO2排放强度,以削减每吨以COD表征的耗氧有机物所消耗的CO2当量计,kgCO2eq·m−3;MFCF 为化石源CO2排放比例 (式 (2) ) ;SRT 为生物固体平均停留时间,d;194.7 为污泥内源呼吸CO2产率,kg·kg−1;HRT 为生物反应池水力停留时间,d;MLVSS 为生物池混合液挥发性悬浮固体平均质量浓度,mg·L−1;4.49 为单位质量氨氮硝化固定的CO2质量,kg·kg−1;TKNin 为污水处理厂进水总凯氏氮质量浓度,mg·L−1;TKNeff 为污水处理厂出水总凯氏氮质量浓度,mg·L−1;0.124 为微生物 (C5H7O2N) 体内含N质量比;FCF 为污水处理厂进水中化石源有机物比例,取值10%;Tb 为水温, ℃;1.1 为BOD5矿化产生 CO2产量;Bin 为污水处理厂进水BOD5,mg·L−1;Bex 为运行过程中人为投加的额外碳源,mg·L−1;Beff 为污水处理厂出水BOD5,mg·L−1;1.47 为污水处理厂进水总BOD与BOD5之比;1.42 为微生物细胞BOD5当量,kg·kg−1;0.67 为绝对产率系数,kg·kg−1;Kd 为衰减系数,d−1 (式 (3) ) 。2) 污水处理产生的CH4排放的核算参考式 (4) 。
式中:
CESCH4−ww 为污水处理单元CH4排放强度,kg CO2eq·m−3;Bin 为污水处理厂进水BOD5,mg·L−1;EFCH4−ww 为污水处理单元 CH4排放因子,kg·kg−1;MCH4−T 为回收或处理去除的 CH4 气体量,kg·m−3,取值为0;28 为CH4的全球变暖潜能,常数,kg·kg−1。3) 污水处理产生的N2O排放的核算参考式 (5) 。
式中:
CESN2O−ww 为污水处理 N2O 排放强度,kg CO2eq·m−3;TNin 为污水处理厂进水中总氮,mg·L−1;EFN2O−ww 为生物处理污水过程中N2O排放因子,kg·kg−1;MN2O−T 为回收或处理去除的N2O气体量,kg·m−3,取值为0;22/14 为1/2 N2O与N分子质量比;265 为N2O的全球变暖潜能,常数,kg·kg−1。4) 排入受纳水体产生的CH4的核算参考式 (6) 。
式中:
CESCH4−re 为受纳水体CH4排放强度,kg CO2eq·m−3;B″in 为排入受纳水体的处理出水中BOD5 ,mg·L−1;EFCH4−re 为受纳水体中CH4排放因子,kg·kg−1;28 为CH4的全球变暖潜能,常数,kg·kg−1。5) 排入受纳水体产生的N2O的核算参考式 (7) 。
式中:
CESN2O−re 为受纳水体N2O排放强度,kg CO2eq·m−3;TN″eff 为排入受纳水体处理出水中总氮,mg·L−1;EFN2O−re 为受纳水体中 N2O 排放因子,kg·kg−1;22/14 为1/2 N2O 与N分子质量比;265 为N2O的全球变暖潜能,常数,kg·kg−1。6) 污泥处置产生的碳排放的核算参考式 (8) 。本研究污泥处理处置采用浓缩脱水后外包处理,因此进行碳排放核算时仅考虑浓缩脱水碳排放强度,具体计算公式如式 (8) [49]。
式中:
CESCO2 为污泥浓缩脱水碳排放强度;MDS 为进行处理的污泥干重,t·d−1;B 为污泥脱水比能耗,kWh·t−1;EFd 为该地区电力排放因子,kg·kWh−1;Q 为评价年内总处理水量,m3·a−1。7) 电力消耗产生的碳排放的核算参考式 (9) 。
式中:
CESd 为运行维护消耗购入电力产生的碳排放强度,kg CO2eq·m−3;Ed 为评价年内运行维护总耗电量,kWh·a−1;EFd 为该地区电力排放因子,kg·kWh−1;Q 为评价年内总处理水量,m3·a−1。8) 药耗产生的碳排放的核算参考式 (10) 。
式中:
CEScl 为所消耗药剂生产环节碳排放量,kg CO2eq;Mcl,i 为第i种药剂使用量,t;EFcl,i 为第i种材料的排放因子,kg·t−1;n 为总计使用n种材料;Q 为评价年内总处理水量,m3·a−1。9) 污染物碳排放强度的核算参考式 (11)~(13) 。为更客观评估有效用于污染物去除的碳排放特征,本研究也对不同污染物去除当量的碳排放强度进行计算[18]。
式中:
CESWW 为吨水碳排放强度,kg CO2eq·m−3;CESCOD为 COD碳排放强度,t CO2eq·t−1;CESTN为 TN碳排放强度,t CO2eq·t−1;CESTP 为TP碳排放强度,t CO2eq·t−1。 -
对碳排放核算结果进行敏感性分析,通过敏感性系数定量衡量污水处理厂碳排放敏感性,敏感性系数越大代表该因素对污水处理厂碳排放的影响越大[19]。由于污水处理厂碳排放主要源于直接碳排放 (化石源CO2、CH4、N2O) 、间接碳排放 (电力消耗、药耗) 和污泥处理处置,故主要对这三部分进行整体敏感性分析。敏感性系数具体计算公式为式 (14)。
式中:Z表示敏感性系数;
ΔC/C 表示污水处理厂碳排放变化率;Δx/x 表示影响因素变化率。 -
运维基础数据采用了2021年该区3座典型污水处理厂污水日处理量、污染物的入厂及出厂日均浓度、日耗电量、日药耗量、日脱水污泥产量等,均来源于污水处理厂每日测量统计。具体各个污水处理厂的运维基础数据如表1所示。
-
根据“指南”、“清单”和“规范”统筹考虑综合排放因子,A厂、B厂和C厂不同处理工艺污水处理单元CH4排放因子分别取值为0.012 1、0.01、0.01 kg·kg−1;3座水厂污水生物处理过程中N2O排放因子则依次取值为0.009 3、0.020 2、0.020 2 kg·kg−1;由于3座水厂均排入河流,故受纳水体CH4排放因子取0.114 kg·kg−1,受纳水体N2O排放因子取值0.005 kg·kg−1。其他排放因子均参考“指南”对应取值,电耗排放因子采用华北区域电网推荐值0.941 9 kg·kWh−1;药耗排放因子中,葡萄糖溶液[20]、多效高分子除磷剂[20]、聚丙烯酰胺、次氯酸钠、三氯化铁和生石灰分别取值为1.47、2.50、1.48、0.99、0.26和1.10 kg·t−1。
-
1) 碳排放量及碳排放强度分析。北京某区3座代表性区级污水处理厂运维阶段年碳排放总量为10.21 万t CO2eq。直接碳排放量为4.00×10⁴ t CO2eq,其中化石源CO2碳排放量为1.00×10⁴ t CO2eq,CH4碳排放量为0.41×10⁴t CO2eq,N2O碳排放量为2.48×10⁴ t CO2eq,污泥脱水碳排放量为0.11×10⁴ t CO2eq。间接碳排放量为6.21×10⁴ t CO2eq,其中电耗碳排放量和药耗碳排放量分别为4.01×10⁴ t CO2eq和2.20×10⁴ t CO2eq。药耗碳排放中,葡萄糖溶液碳排放量为0.90×10⁴ t CO2eq,多效高分子除磷剂碳排放量为0.91×10⁴t CO2eq。由于处理水量、污染物去除负荷和污水处理电力消耗的差异,只讨论碳排放总量关系并不能客观反映不同水厂信息的可比性。因此,通过计算碳排放强度来实现更精确评估,结果如表2所示。2021年3座污水厂吨水碳排放强度为1.35~1.98 kg CO2eq·m−3,平均值为1.6 kg CO2eq·m−3,处于现有报道值0.1~2.4 kg CO2eq·m−3的中上水平[8, 21]。吨水碳排放强度一般受污水出水浓度和电力消耗效率的影响。此外,N2O和CH4的碳排放与TN和COD这2种污染物的质量浓度有关[8, 22],进水中高TN可能升高N2O碳排放的贡献。针对污染物碳排放强度,COD碳排放强度A厂 (8.62 t CO2eq·t−1) >C厂 (3.66 t CO2eq·t−1) >B厂 (3.16 t CO2eq·t−1) ,TN碳排放强度A厂 (67.84 t CO2eq·t−1) >C厂 (42.49 ( t CO2eq·t−1) >B厂 (36.44 t CO2eq·t−1) ,而TP碳排放强度A厂 (384.81 t CO2eq·t−1) >C厂 (297.29 t CO2eq·t−1) >B厂 (176.69 t CO2eq·t−1) 。综上所述,单位污染物去除的碳排放强度B厂最小。这主要与处理技术类型、电耗效率、药耗投量和处理规模效应等有关[23]。
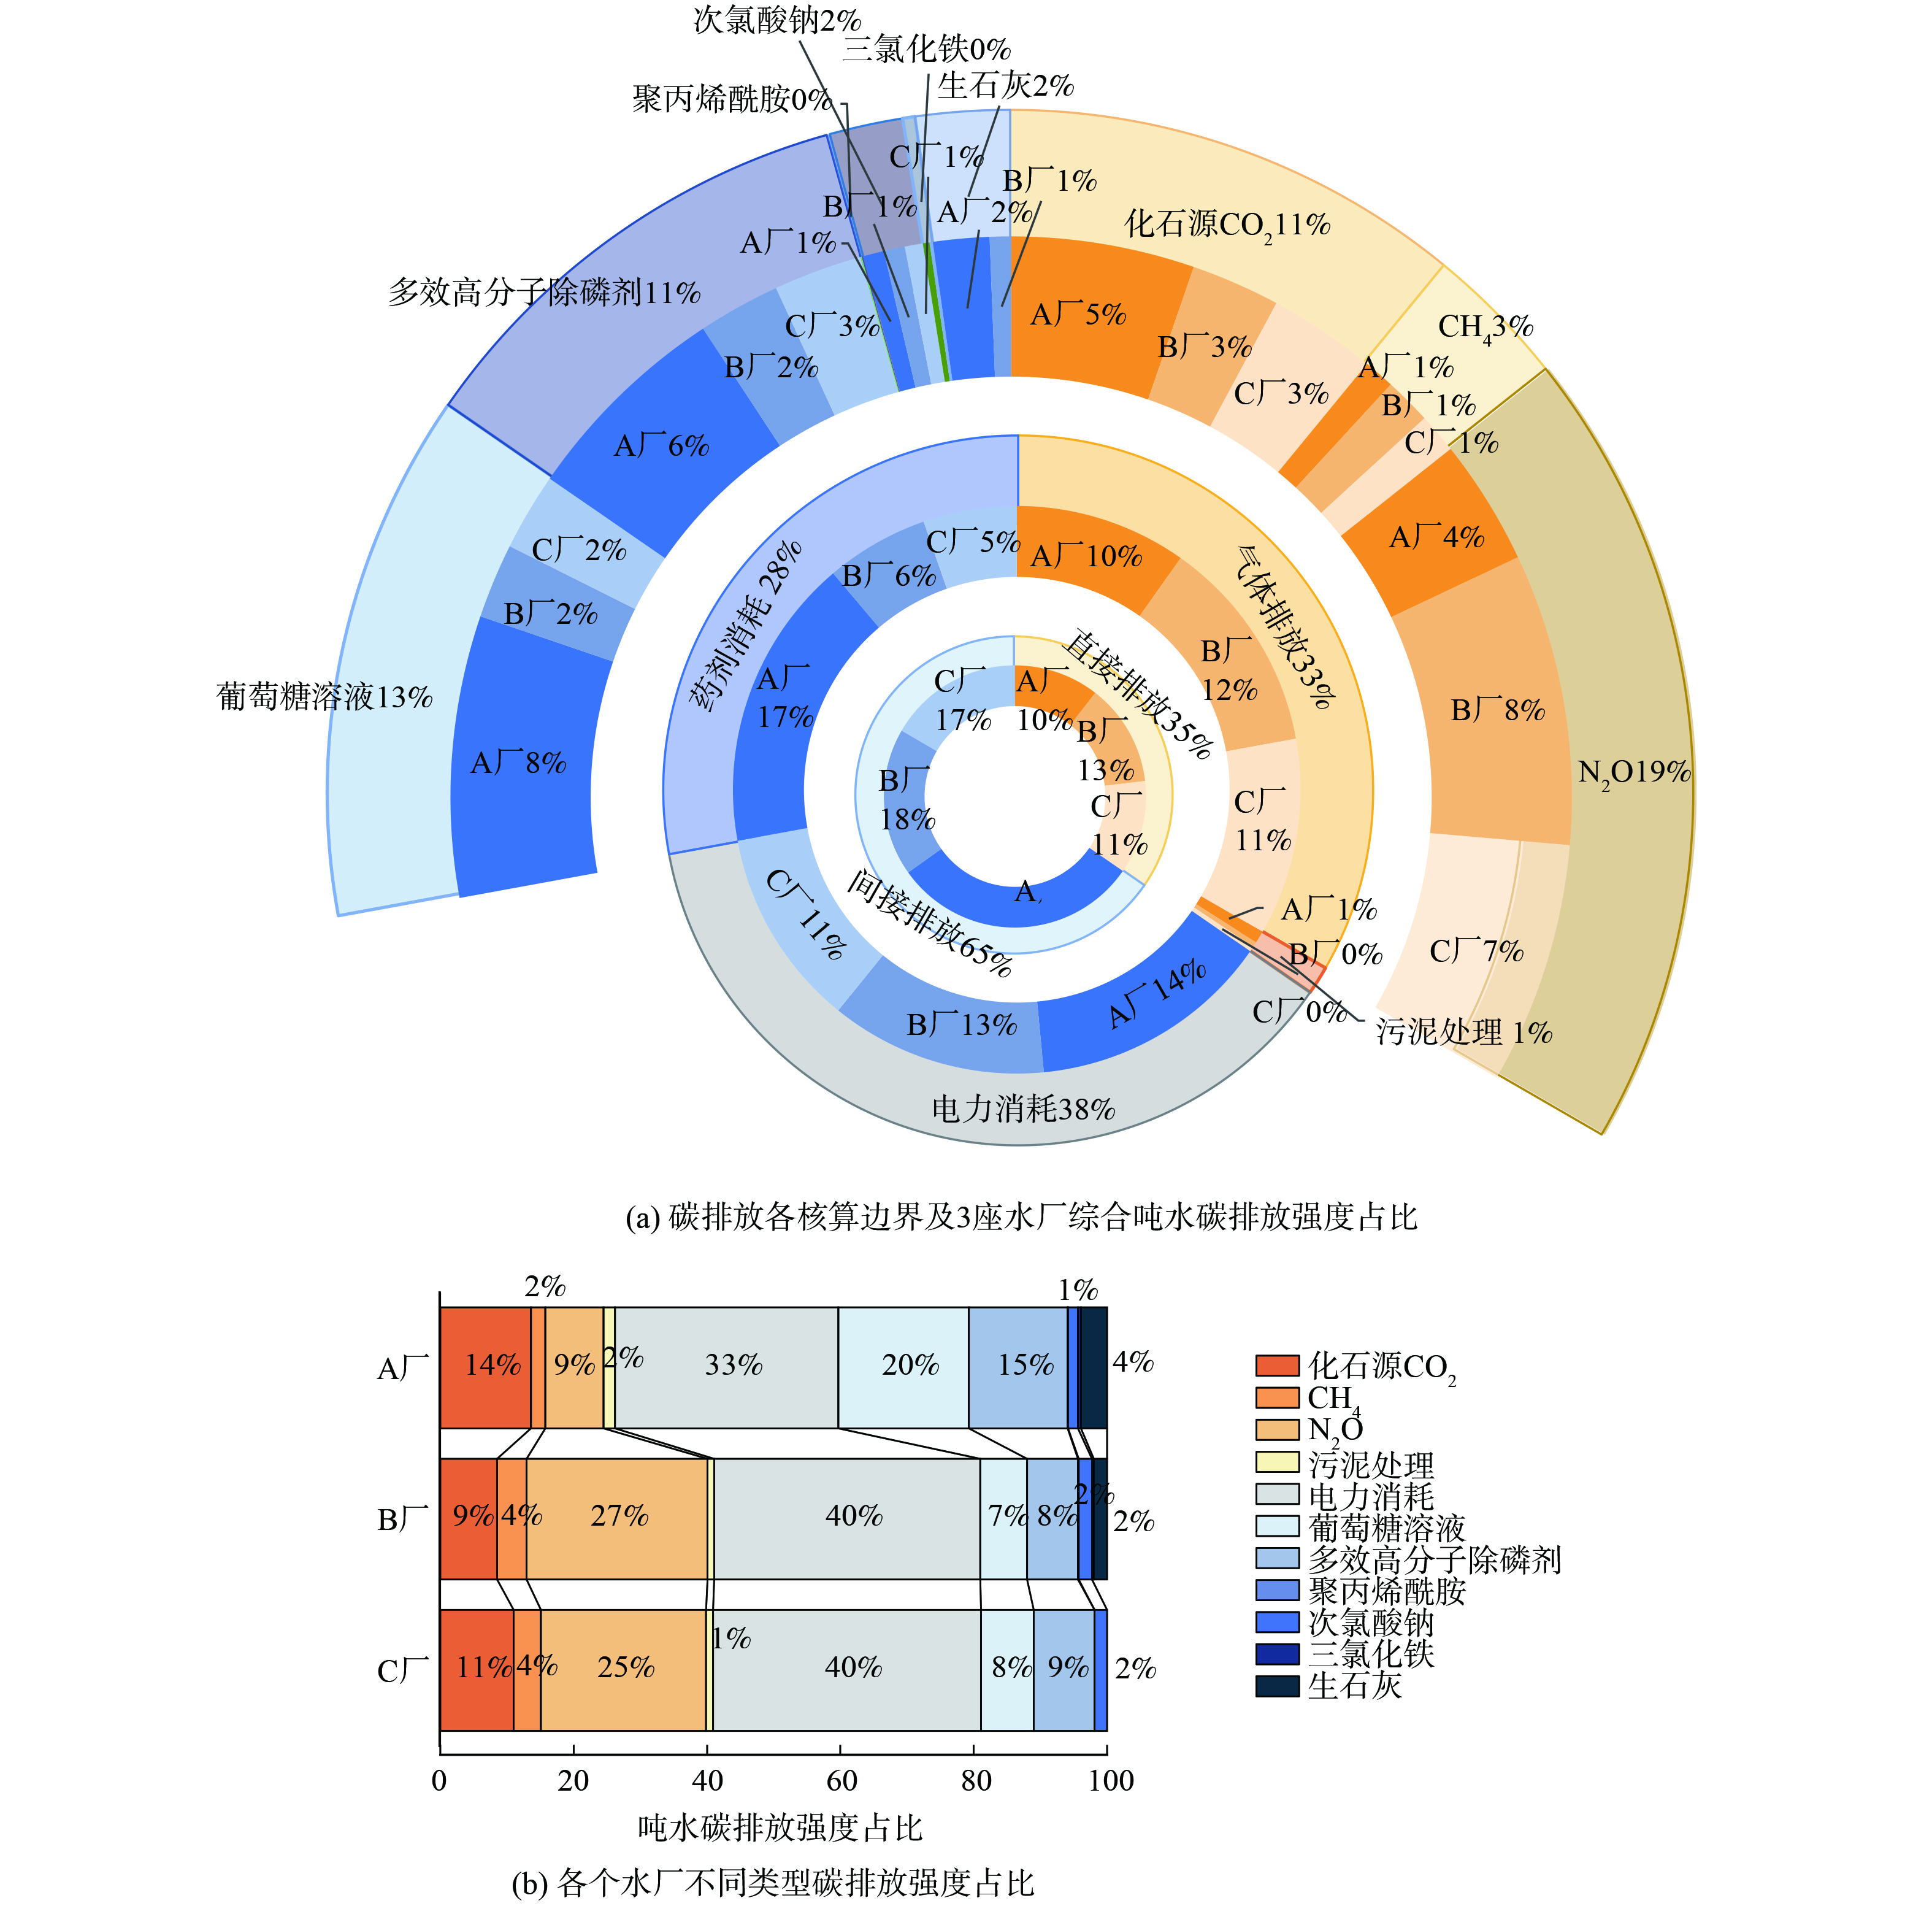
2) 碳排放源解析。对3座污水处理厂进行碳排放源解析,结果如图2所示。3座水厂的碳排放总量以间接碳排放为主,约占总碳排放量的65%,其中A厂占比最大 (31%) ,C厂占比最小 (17%) 。细分类别显示,电力消耗占总碳排放的38%,是更主要的间接碳排放来源[24],相较其他研究 (38%~50%) 处于较低水平[25],其中A厂仍占比最大 (14%) ,C厂占比最小 (11%) 。而药剂消耗占总碳排放的28%,主要来自葡萄糖溶液 (13%) 和多效高分子除磷剂 (11%) ,聚丙烯酰胺、次氯酸钠、三氯化铁和生石灰的碳排放均低于5%。在直接碳排放中,N2O碳排放占比最大 (19%) ,化石源CO2碳排放占比其次 (11%) ,CH4碳排放占比最小 (3%) ,其中B厂占比最大 (13%) ,A厂占比最小 (10%) 。N2O的全球增温潜势和排放因子高于CH4和CO2,故N2O的直接碳排放占比更大。污泥处理的碳排放仅占1%。
各污水处理厂碳排放源解析结果如图2 (b) 所示。A厂吨水碳排放强度中,间接排放占比达73%,其中药剂消耗碳排放占比40% (葡萄糖溶液20%,多效高分子除磷剂15%) ,电力消耗碳排放占比33%;直接排放占比27% (化石源CO2碳排放占比14%,N2O碳排放占比9%) 。因此,A厂的碳排放主要受药剂消耗和电力消耗的间接排放影响。这可能主要是由于我国市政设计单位为保障污水处理厂出水稳定达标,在设计时取值偏保守,而实际运行的平均进水浓度及进水量常不满足设计水平,负荷率偏低,常规设计也较少使用变频器、高效风机等节能设备,故吨水电耗偏高;同时,工艺中污染物过滤、吸附过程也需要大量电力和药耗[26]。
B厂吨水碳排放强度中,间接排放占比为60%,其中电力消耗碳排放占比40%,药剂消耗碳排放占比20% (葡萄糖溶液7%,多效高分子除磷剂8%) ;直接排放占比40% (化石源CO2碳排放占比9%,N2O碳排放占比27%) 。而C厂吨水碳排放强度中,间接排放占比较大为59%,其中电力消耗碳排放占比40%,药剂消耗碳排放占比19% (葡萄糖溶液8%,多效高分子除磷剂9%) ;直接排放占比41% (化石源CO2碳排放占比11%,N2O碳排放占比25%) 。因此,B厂和C厂的碳排放主因是电力消耗所引起的间接排放和污水处理过程中的N2O直接排放,该现象在我国其他污水处理厂也有出现[20]。其中,N2O直接碳排放量较高,主要由SBR工艺特点决定,AOB的反硝化作用和NH2OH的氧化过程会造成硝化过程大量N2O排放,而大量新鲜污水的高浓度有机物可促进异养微生物的呼吸作用,消耗自养硝化菌代谢所需的DO条件[27]。综上所述,北京该区的3座区级污水处理厂主要受电力消耗的间接碳排放和N2O直接碳排放控制,符合其他研究趋势[28]。
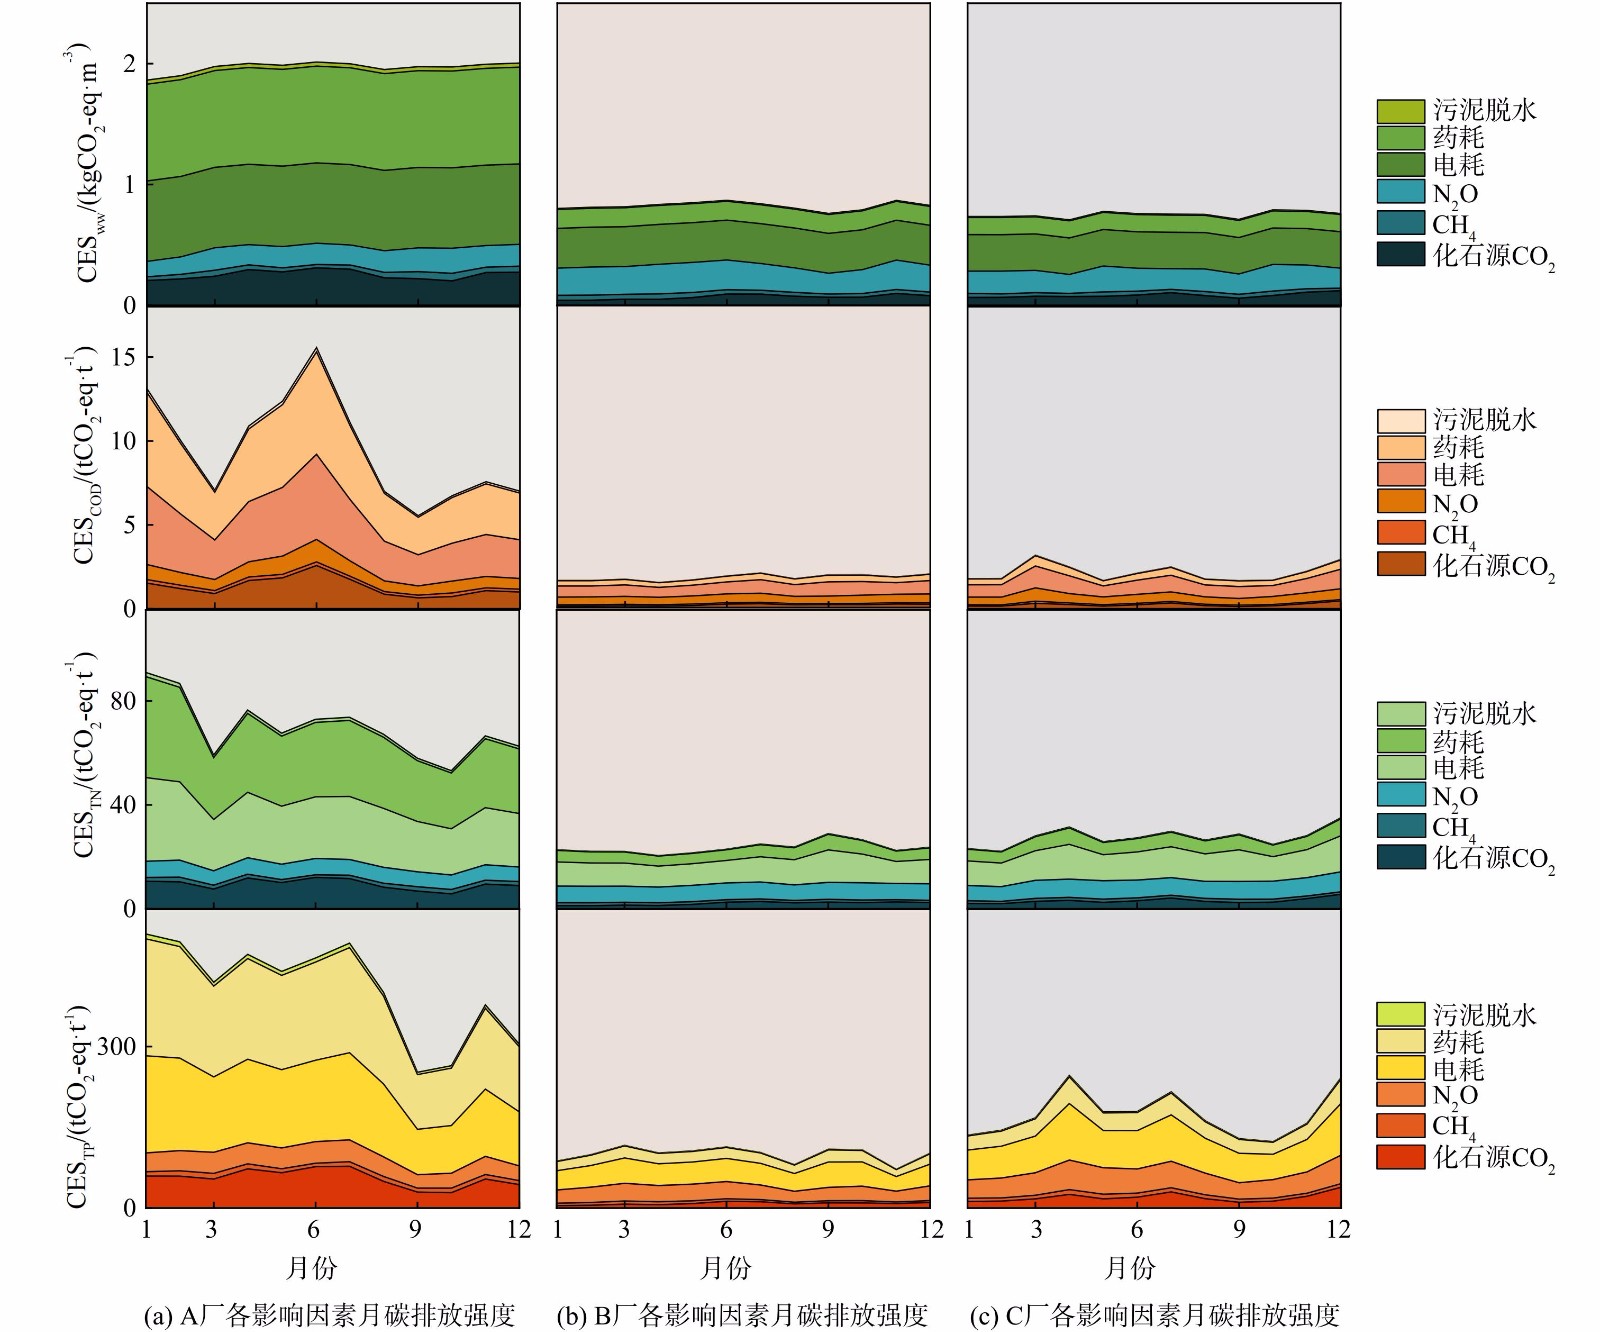
3) 月碳排放强度及变化趋势分析。整合3座污水处理厂月吨水碳排放强度与月去除当量碳排放强度数据,结果如图3所示。针对月吨水碳排放强度,A厂受季节影响较小,月数据波动不大;B厂中由药耗、电耗和N2O引起的碳排放在9月份波动下降。这主要源于临时试验性运行策略优化,而化石源CO2和CH4的排放量全年基本稳定;C厂则受季节影响相对较大,这可能与C-TECH工艺受温度影响较大有关。针对月去除当量碳排放强度,A厂数值整体大于其他水厂,且各类污染物月去除当量碳排放强度波动较大,COD碳排放强度为5.55~15.57 t CO2eq·t−1,TN碳排放强度为59.16~90.98 t CO2eq·t−1,TP碳排放强度为252.18~509.14 t CO2eq·t−1,主要碳排放低值在9—10月出现。这主要来自8月起新承接的较高浓度进水,出水水质稳定情况下去除效率获得提升。B厂的COD碳排放强度在3.19 t CO2eq·t−1上下波动,TN碳排放强度在36.79 t CO2eq·t−1附近波动,TP碳排放强度总体为129.95~180.19 t CO2eq·t−1,总体平均值最低,相对波动较小。这主要是由于改良型SBR较耐冲击负荷,脱氮效果良好的同时能高效地使有机物浓度达标[29]。C厂的COD碳排放强度约为3.84 t CO2eq·t−1、TN碳排放强度约为43.15 t CO2eq·t−1。TP碳排放强度为222.25~443.77 t CO2eq·t−1,总体平均值居中,且随不同月份波动较大。这可能是由于每月去除污染物的质量浓度受温度影响较大所致[30]。
综上所述,3座污水处理厂的月碳排放强度变化趋势各异。A厂的吨水碳排放强度在全年保持稳定,B厂在9月份有所下降,而C厂水厂受季节影响较大。除B厂COD碳排放强度和TN碳排放强度波动较小外,各个厂COD碳排放强度、TN碳排放强度和TP碳排放强度总体受季节影响波动显著。
-
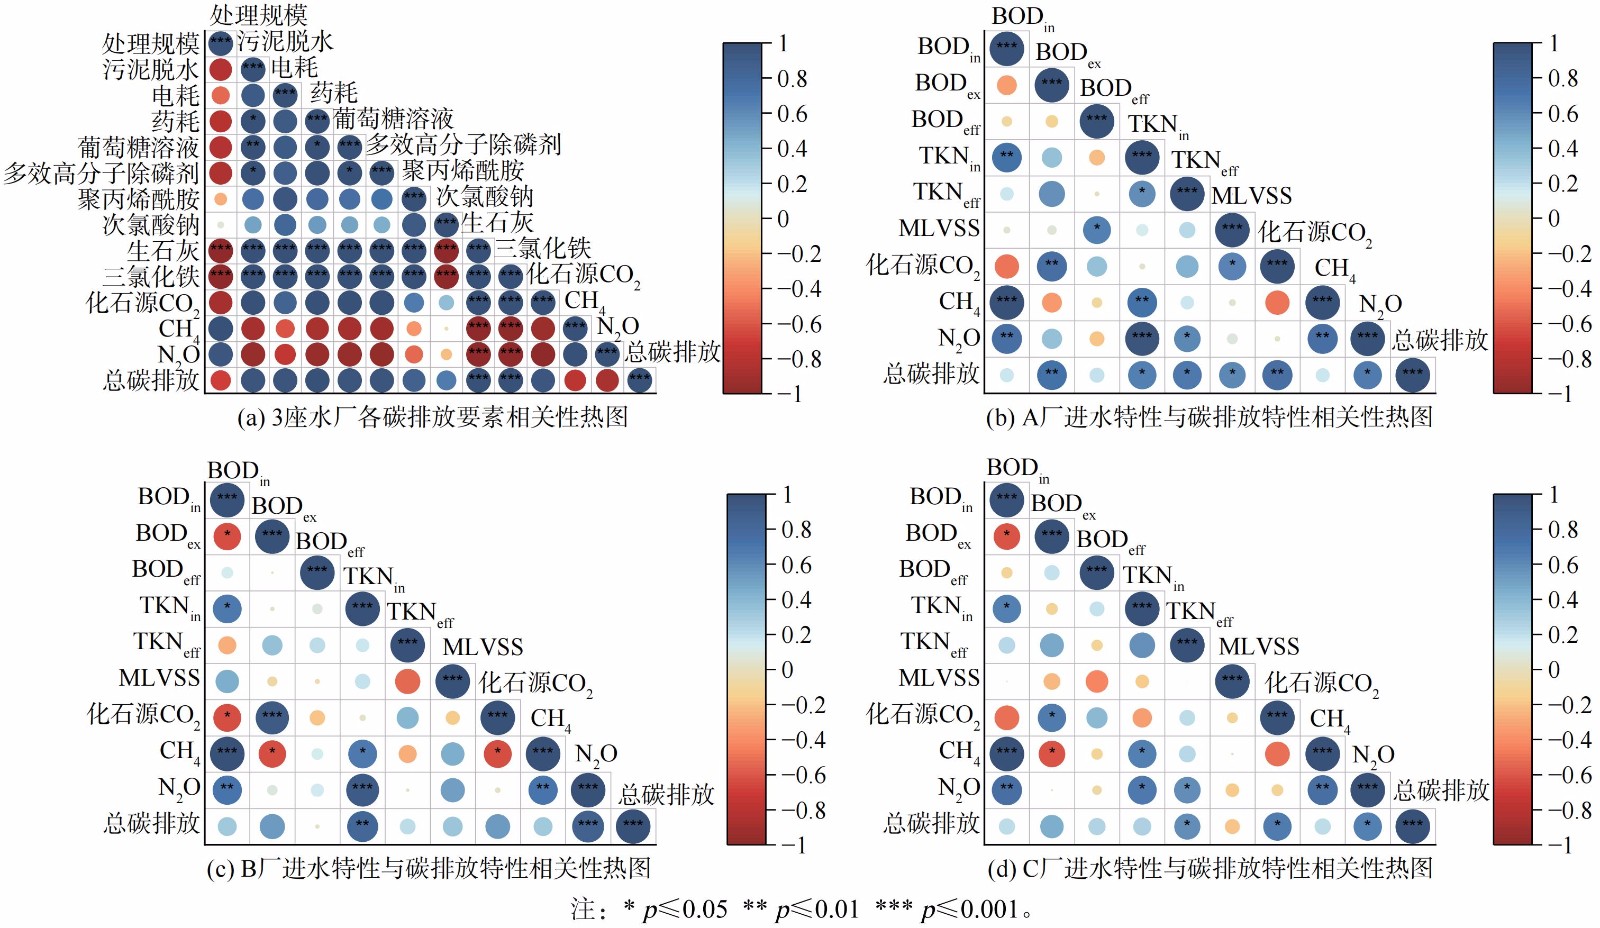
1) 不同影响因素与各类碳排放强度相关性分析。采用皮尔森相关系数分析各要素与总碳排放强度之间的相关性,结果如图4所示。污水处理厂处理规模与总碳排放强度呈负相关 (R=-0.7) ,即处理规模越大,平均碳排放效率 (carbon emission efficiency) 越高[31]。本研究中B厂处理规模最大,故吨水碳排放强度最低,处理能效最优,与其他研究所示规律一致[32]。综合考虑小型污水处理厂处理成本高、单位能耗高和管理问题,规模在设计或改造中应该被认真考虑,以最大程度地减少碳排放[33]。污水处理厂污泥脱水的直接碳排放与总碳排放呈正相关 (R=0.98) ,这可能是因为在污泥脱水过程中产生的有机物质分解产生了额外的碳排放从而增加了总碳排放量[34]。不同药剂与碳排放强度的相关性不同,葡萄糖溶剂、多效高分子除磷剂、聚丙烯酰胺和次氯酸钠与总碳排放同样呈正相关 (R=0.98,R=0.97,R=0.88,R=0.66) 。电消和药耗与总碳排放呈正相关 (R=0.98,R=0.99) ,与源解析和辅证研究结果相关分析一致[2]。
具体而言,A厂 (图4(b)) BODin与CH4和N2O呈极显著相关 (R=1,R=0.76) 。人为外加碳源BODex与化石源CO2呈显著相关 (R=0.75) ,并且与总碳排放呈极显著相关 (R=0.73) 。TKNin与CH4和N2O呈极显著相关 (R=0.73,R=0.97) ,并且与总碳排放呈显著相关 (R=0.66) 。MLVSS与总碳排放呈显著相关 (R=0.6) 。因此,A厂的BODin、TKNin和人为外加碳源与CH4、N2O和总碳排放量密切相关,需要消减MLVSS、BODex、TKN产生的碳排放。B厂 (图4(c)) BODin与化石源CO2呈显著相关 (R=−0.64) ,且与CH4和N2O呈极显著相关 (R=1,R=0.71) 。人为外加碳源BODex与化石源CO2呈极显著相关 (R=0.93) 。TKNin与CH4和N2O呈显著相关 (R=0.69,R=0.91) ,且与总碳排放呈极显著相关 (R=0.8) 。因此,B厂的TKNin和BODex与CH4、N2O和总碳排放量密切相关,需重点关注BODex、TKN及产生的N2O。C厂 (图4(d)) BODin与CH4和N2O呈极显著相关 (R=1,R=0.76) 。人为外加碳源BODex与CH4呈显著相关 (R=−0.6) 。TKNin与CH4和N2O呈显著相关 (R=0.65,R=0.69) 。TKNeff、化石源CO2、N2O和总碳排放呈显著相关 (R=0.58,R=0.67,R=0.66) 。因此,C厂的BODin、TKNeff和BODex与CH4、N2O和总碳排放量密切相关。
2) 碳排放核算模型敏感性分析。敏感性分析结果如图5所示。3座水厂对不同核算边界的敏感程度基本一致,主要是电耗、药耗、N2O和化石源CO2。药耗中葡萄糖溶液和多效高分子除磷剂敏感性系数最大,而不同水厂在碳排放核算边界的各项因素中也表现出不同的敏感性。A厂的药耗敏感性系数最大 (Z=0.48) ,说明该厂的碳排放量对药剂使用的变化最为敏感。此外,A厂的电耗敏感性系数较大 (Z=0.41) ,表明该厂的碳排放量对电力消耗的变化也非常敏感。同时,葡萄糖溶液和多效高分子除磷剂的敏感性系数也较大 (Z=0.23,Z=0.17) ,减少相关物质的依赖性可能有助于减少碳排放。B厂的敏感性分析结果显示,该厂的电耗敏感性系数 (Z=0.61) 最大,其次是N2O排放和药耗 (Z=0.32,Z=0.31) 。因此,B厂优化电力消耗并控制N2O排放将有助于减少该水厂的碳排放。C厂结果表明,该厂的电耗敏感性系数最大 (Z=0.58) ,其次是N2O排放和药耗 (Z=0.32,Z=0.31) ,与B厂类似。综上所述,各厂的碳排放量受电力消耗、N2O排放和药耗的影响更为敏感。
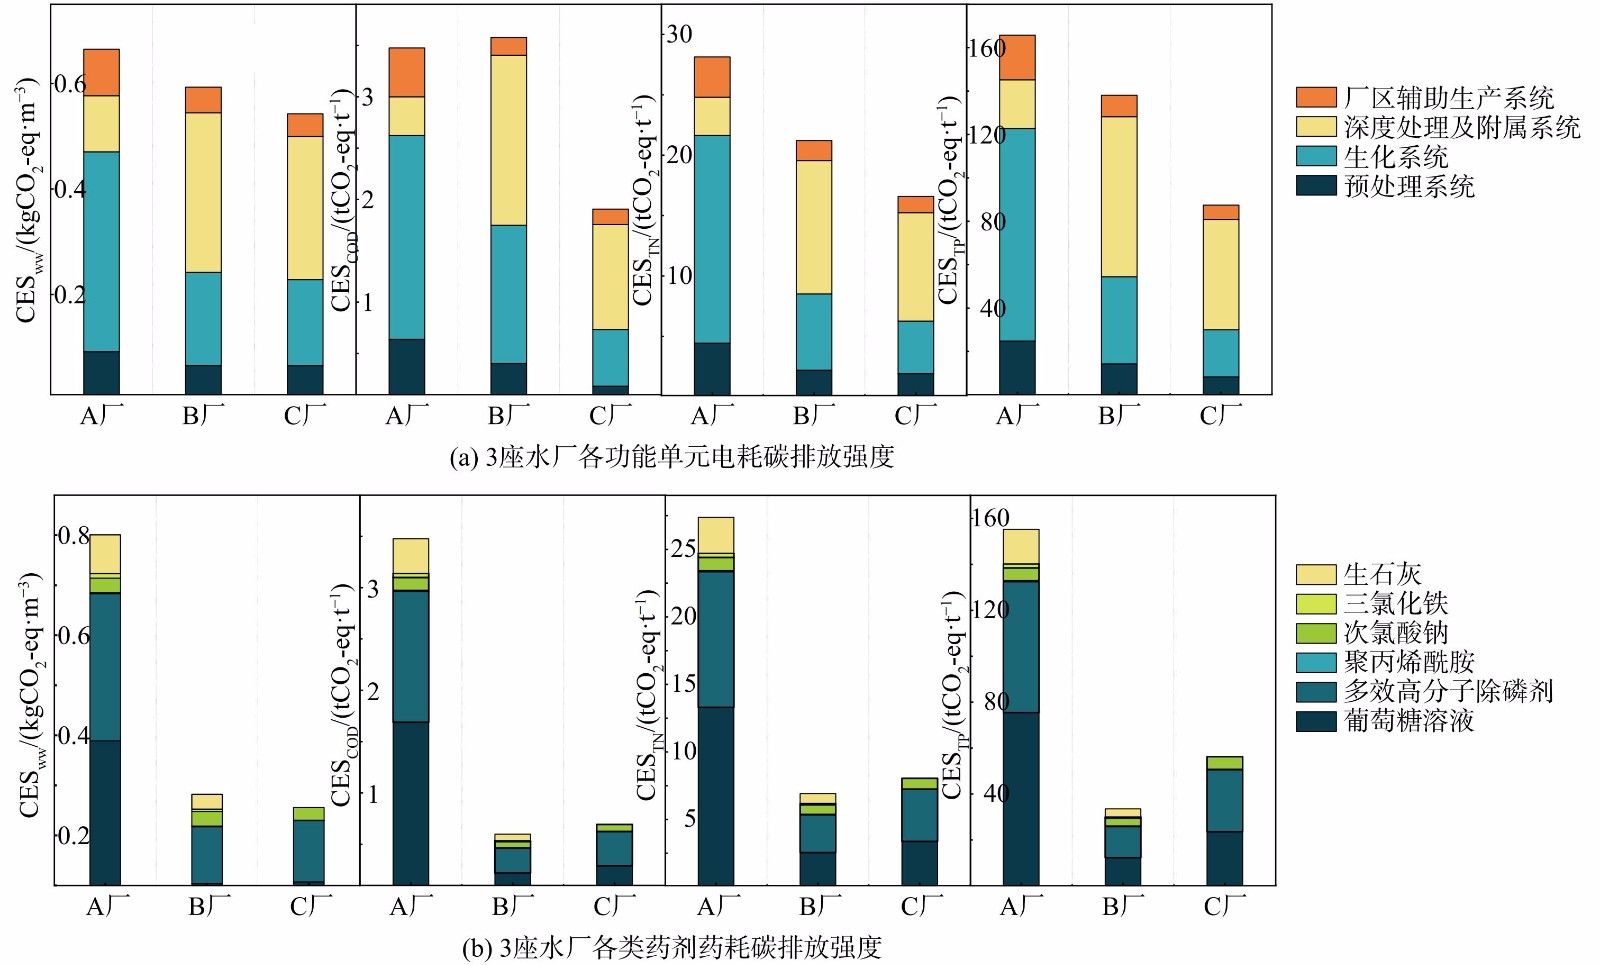
3) 各类碳排放强度主因分析。综合前述碳排放量及碳排放强度占比、相关性和敏感性分析结果,电力和药剂消耗导致的间接排放是所研究污水处理厂的主要碳排放贡献因素。污水处理工艺类型是影响碳排放强度的重要因素[35],也决定了工艺中各电力和药剂消耗的碳排放主贡献特征,故对各类碳排放强度电力和药剂消耗主因素比较分析,结果如图6所示。A厂使用的A2O+MBR工艺中,电力消耗碳排放强度主要来源于生化系统,其吨水碳排放强度为0.38 kg CO2eq·m−3,而单位污染物去除碳排放强度占比更大,该贡献主要来自A2/O+MBR工艺中好氧池曝气、混合液回流、MBR曝气及抽吸所需要的泵耗。A厂的药耗碳排放强度则主要来自葡萄糖溶液和多效高分子除磷剂的使用,而葡萄糖溶液作为人工碳源对单位污染物去除碳排放强度影响的占比更大。与A厂不同,B厂采用的改良型SBR工艺中电力消耗碳排放强度主要来自深度处理及附属系统和生化系统,其吨水碳排放强度分别为0.30 kg CO2eq·m−3和0.18 kg CO2eq·m−3,单位污染物去除碳排放强度深度处理及附属系统占比更大,该贡献主要来自为保障高品质出水所使用的CMF单元和后续高级氧化单元。B厂的药耗碳排放强度显著小于A厂,主要贡献来自多效高分子除磷剂的使用,这与气浮深度除磷单元的设置直接相关,而葡萄糖溶液在单位污染物去除碳排放强度中的占比显著增加。C厂采用的C-TECH工艺是间歇式活性污泥法 (SBR) 的一种变型工艺,其主要吨水碳排放强度贡献单元与B厂类似,为深度处理及附属系统和生化系统,分别达到0.27 kg CO2eq·m−3和0.16 kg CO2eq·m−3,但单位污染物去除碳排放强度显著低于其他两厂,且深度处理及附属系统占比更大,该贡献主要来自C-TECH强化处理单元和后续消毒单元。C厂药耗吨水碳排放强度低于B厂,主要贡献来自多效高分子除磷剂的使用,而单位污染物去除碳排放强度高于B厂,葡萄糖溶液在单位污染物去除碳排放强度中的占比也类似增加,这可能与规模效应造成的差异有关。综上所述,A厂的电力消耗碳排放强度主要来自生化系统,药耗碳排放强度主要来自葡萄糖溶液和多效高分子除磷剂的使用,而B厂和C厂的电力消耗碳排放强度主要来自深度处理及附属系统,药耗碳排放强度主要来自多效高分子除磷剂的使用,C厂整体上更符合低碳运行的要求。
-
1) 降低电力消耗。3座水厂主要的电力消耗间接碳排放来自生化系统和深度处理及附属系统,故曝气泵和水泵为主要能耗设备。因此,主要可通过优化曝气组件、曝气模式、曝气结构、气泵类型等方面提高曝气过程效率,防止过渡曝气;同时对易磨损、易腐蚀的水泵等设备进行定期及时维护,优化水泵类型,从而可减少水泵的电力消耗;最终可从设备配置和能效评估制定适合现场碳减排优化的整体电力控制策略,最终降低厂区整体运行电耗[36]。
2) 降低药耗。额外投加碳源、多效高分子除磷剂等药耗是产生碳排放的另一个主要原因,污水处理中的药剂投加环节究其本质是通过生化反应来去除污水中的污染物。因此,在生化处理环节需要投加碳源和多种化学药剂。这些原材料在其生产和运输过程中消耗能源,在投加过程中也消耗一定能源,故优化药剂投加环节,有助于节能降耗减少碳排放。目前,解决措施主要是对加药系统进行配置升级。如在曝气池末端出水投加的PAC除磷药剂,由常用的变频计量泵升级为数字泵,通过监测曝气池出水正磷酸盐浓度对PAC药剂进行精确投加,加药量有不同程度的降低。该技术可同时应用到污水处理厂的其他药剂投加段,一段时间后对于药耗成本的降低较为可观。另外,还可引入运用Al技术对污水水量、水质等参数和加药系统运行数据等进行大数据分析,形成最优算法模型在现场子以实施,从而实现加药系统精细化控制,也能有效降低药品消耗以及设备运行能耗。
3) 改善污水处理工艺。采用高效低碳的水处理工艺,可有效降低污水处理全流程碳排放。对于常规活性污泥处理工艺而言,可通过硝化过程中的高DO(>0.5 mg·L−1)、反硝化过程中尽量避免溶解氧的存在、高COD/N质量比(>3.5)、较大的污泥龄(>10 d)和适当的pH(6.8~8.0),来减少N2O的产生以有效抑制污水处理直接碳排放[37]。对于变革性的污水处理工艺而言,可通过碳源分离技术在一级处理中改变碳流向,使污水中大部分耗氧有机物 (以COD计) 进入到污泥中,将提高污泥厌氧消化的产能效率,进而提高污水处理厂能源自给率。同时,也可采用替碳策略,通过回收资源、能源并向社会输出,从而抵消自身产生的部分碳排放。如可采用水源热泵技术,回收污水中的余温热能并为周边地区制冷或供暖,减少碳排放量。北欧国家一些污水处理厂已凭借厌氧消化产甲烷并热电联产,以及余温热能利用等技术实现能源的回收利用[38]。
4) 建设新概念污水处理厂。许多资源导向处理技术的稳定运行,主要在实验室规模得到证明,进一步的技术进步、整合和全尺度示范将是实现其商业化应用必需的,我国已率先展开类似应用。如新建的宜兴概念污水处理厂是一个创新中心,具有每天处理1 000 m3的能力,正在引领展示各种领先的污水处理技术并积极推动其整合。我国还在建设几个类似的污水处理厂,预计这些先导性厂站可能引领中国的技术创新和污水处理厂的升级,从而最终重塑整个城市污水部门[39]。另一方面,污水处理厂的运营管理对提高系统效率也至关重要[40]。
-
1) 对北京市3座不同工艺的代表性区级污水处理厂运维阶段碳排放进行统计、核算并结合统计学方法加以分析,结果表明采用MBR工艺的A厂的碳排放强度最大 (1.99 kg CO2eq·m−3) ,采用改良型SBR工艺的B厂次之 (1.48 kg CO2eq·m−3) ,C厂选用的C-TECH工艺碳排放强度为1.35 kg CO2eq·m−3,更符合低碳要求。然而B厂在去除单位污染物所产生的碳排放为三厂最低 (3.16,36.44,176.69 t CO2eq·t −1) ,且B厂碳排放受季节影响小,污染去除更为稳定,更符合“双碳”要求。
2) 各碳排放核算边界中,直接碳排放中N2O排放量占比最大,间接排放中电力消耗占比最大,药耗紧随其后也占据一定比例。相关性分析和敏感性分析结果表明,由电力和药剂消耗造成的间接碳排放与总碳排放相关性大,且更为敏感。由此可见,电力消耗和药剂投加产生的碳排放是污水处理厂减排的重要控制环节,通过精准定位优化高能耗设备、升级投药系统技术以及改善新处理工艺、建设新概念污水处理厂来减少碳排放是转向绿色环保污水处理过程的有效方案。
基于月排放数据的北京3座区级污水处理厂年碳排放特征
Characterization of annual carbon emissions of three district-level wastewater treatment plants in Beijing based on monthly emission data
-
摘要: 以3座北京市某区代表性区级污水处理厂为研究对象,综合《城镇水务系统碳核算与减排路径技术指南》、《污水处理厂低碳运行评价技术规范》和《IPCC 2006 年国家温室气体清单指南 2019 修订版》碳排放核算方法,采用定量统计、相关性分析及敏感性分析等手段对污水处理厂正常运行状态下碳排放核算和影响因素进行特征分析和规律识别,并提出针对性减排路径建议。结果表明:C厂C-TECH工艺的吨水碳排放强度为三厂最低1.35 kg CO2eq·m−3,处于我国较低水平,接近“双碳”目标要求;而B厂改良SBR工艺的单位污染去除碳排放强度较小,其COD碳排放强度为3.16 t CO2eq·t−1,TN碳排放强度为36.44 t CO2eq)·t−1,TP碳排放强度为176.69 t CO2eq·t−1,处于我国中上水平,从效能角度更接近“双碳”目标要求。不同工艺产生的温室气体、进水水质波动及用电消耗导致三厂碳排放强度上存在差异,但各工艺的主排碳因子均为间接碳排放 (A厂、B厂和C厂中分别占73%、59%和59%) ,间接碳排放的主贡献因子为电力消耗 (A厂、B厂和C厂中分别占33%、40%和40%) 。相关性分析发现,各水厂碳排放强度还与N2O造成的直接碳排放有较大相关性,3座水厂年排放N2O 2.48×10⁴ t CO2eq,A厂、B厂和C厂中相关性系数值分别达到0.68、0.87、0.66。敏感性分析表明,整体碳排放强度对电力消耗、N2O排放和药耗的变化更为敏感,药耗中葡萄糖溶液和多效高分子除磷剂对碳排放强度影响较大。以上结果表明,北京区级污水处理厂应从优化曝气系统、水泵效能等节电措施和调整水厂加药模式等节药措施上实现减排。Abstract: In order to support the planning and implementation of emission reduction pathways for wastewater treatment plants in the northern region of China, this paper taked three representative district-level wastewater treatment plants in a district of Beijing as the research object, synthesized the Carbon Accounting and Emission Reduction Pathway Technical Guidelines for Urban Water Systems, the Technical Specification for Evaluation of Low-Carbon Operation of Wastewater Treatment Plants, and the carbon emission accounting method of the IPCC 2006 Guidelines for National Greenhouse Gas Inventories, Revised 2019, and adopted the quantitative statistics, correlation analysis, and sensitivity analysis, quantitative statistics, correlation analysis and sensitivity analysis to characterize and identify the patterns of carbon emission accounting and influencing factors under the normal operating state of wastewater treatment plants, and to propose targeted emission reduction paths. The results showed that the ton of water carbon emission intensity of C-TECH process of C plant was the lowest at 1.35 kg CO2eq·m-3 for the three plants, which was at a lower level in China and close to the target requirement of "double-carbon". The carbon emission intensity of the unit pollution removal of B plant's improved SBR process was small, and the COD carbon emission intensity of was 3.16 t CO2eq·t-1, TN carbon emission intensity was 36.44 3.16 t CO2eq·t-1, TP carbon emission intensity was 176.69 3.16 t CO2eq·t-1, which was in the middle and upper level in our country, while it was closer to the target requirement of "double carbon" from the viewpoint of efficiency. The greenhouse gases generated by different processes, fluctuations in water quality and electricity consumption led to differences in the carbon emission intensity of the three plants. Despite the differences in carbon emission intensity of different processes, the main carbon emission factor of each process was indirect carbon emission (73%, 59% and 59% in Plant A, Plant B and Plant C, respectively), and the main contributor of indirect carbon emission was electricity consumption (33%, 40% and 40% in Plant A, Plant B and Plant C, respectively). The correlation analysis found that the carbon emission intensity of each water plant also had a large correlation with the direct carbon emission caused by N2O, and the three water plants emitted 24.8 million t CO2-eq of N2O annually, with correlation coefficients of 0.68, 0.87, and 0.66 in Plants A, B, and C, respectively. The sensitivity analysis showed that the overall carbon emission intensity was more sensitive to the changes in electric power consumption, N2O emission, and drug consumption, and the overall carbon emission intensity was more sensitive to the changes in electric power consumption, N2O emission, and drug consumption. Glucose solution and multi-effect polymer phosphorus remover in drug consumption had a greater impact on carbon emission intensity. The above results indicated that the emission reduction should be achieved by optimizing the efficiency of aeration system and pump and adjusting the dosing mode of water plant for the district-level wastewater treatment plants in Beijing.
-
表 1 3座污水处理厂运维基础数据信息
Table 1. Basic operation and maintenance data information of three sewage treatment plants
指标及单位 A厂 B厂 C厂 污水日处理量Q/(万t·d−1) 1.7 11.2 5.9 生物池温度Tb/ ℃ 18 20.24 24.67 生物池MLVSS浓度/(mg·L−1) 6 540.46 5 455.81 5 018.35 生物池HRT/d 0.56 0.5 0.62 生物池SRT/d 13 15 14 进水BOD5,Bin/(mg·L−1) 115.07 224.46 176.94 人为投加的额外碳源质量浓度Bex/(mg·L−1) 140.29 54.34 50.78 出水BOD5,Beff/(mg·L−1) 1.22 0.68 1.58 进水COD,Cin/(mg·L−1) 290.76 510.53 385.10 出水COD,Ceff/(mg·L−1) 13.83 20.76 18.96 进水总磷,TPin/(mg·L−1) 6.15 8.50 4.47 出水总磷,TPeff/(mg·L−1) 0.08 0.10 0.07 进水总氮,TNin/(mg·L−1) 39.46 46.47 37.95 出水总氮,TNeff/(mg·L−1) 10.27 6.03 7.80 进水总凯氏氮,TKNin/(mg·L−1) 35.66 37.43 33.36 出水总凯氏氮,TKNeff/(mg·L−1) 5.322 3.31 4.01 进水氨氮,NH3-N/(mg·L−1) 29.66 28.08 26.56 出水氨氮,NH3-N/(mg·L−1) 0.37 0.55 0.57 外运污泥干重/(t·d−1) 12 60 73 外运污泥含水率 60% 80% 80% 污泥脱水比能耗/(kWh·t−1) 50.5 28.3 28.3 预处理系统能耗/(kWh·d−1) 1 650 7 755 4 077 生化系统能耗/(kWh·d−1) 6 840 21 010 10 200 深度处理及附属系统能耗/(kWh·d−1) 1 920 35 955 16 990 厂区辅助生产系统能耗/(kWh·d−1) 1 590 5 780 2 713 总电能消耗/(kWh·d−1) 12 000 70 500 33 980 葡萄糖溶液消耗/(t·d−1) 4.50 7.90 4.30 多效高分子除磷剂消耗/(t·d−1) 2.00 5.10 2.90 聚丙烯酰胺消耗/(t·d−1) 0.02 0.10 0.02 次氯酸钠消耗/(t·d−1) 0.50 3.30 1.50 三氯化铁消耗/(t·d−1) 0.60 0.20 — 生石灰消耗/(t·d−1) 1.20 0.30 — 直接碳排放量/(×104 t CO2eq) 0.32 2.49 1.19 间接碳排放量/(×104 t CO2eq) 0.91 3.58 1.72 总碳排放量/(×104 t CO2eq) 1.23 6.07 2.91 表 2 3座污水处理厂不同年均碳排放强度比较
Table 2. Comparison of different annual carbon emission intensities of three sewage treatment plants
排放指标及单位 厂号 污水直接排放 资源能源消耗间接排放 合计 气体排放 污泥处理 电力消耗 药耗 化石源CO2 CH4 N2O 葡萄糖溶液 多效高分子除磷剂 聚丙烯酰胺 次氯酸钠 三氯化铁 生石灰 CESww/(kg CO2eq·m−3) A厂 0.27 0.05 0.17 0.03 0.67 0.39 0.29 1.74×10⁻³ 0.03 9.18×10⁻³ 0.08 1.99 B厂 0.13 0.07 0.4 0.01 0.59 0.1 0.11 1.32×10⁻³ 0.03 4.64×10⁻³ 0.03 1.48 C厂 0.15 0.06 0.33 0.01 0.54 0.11 0.12 0.5×10⁻³ 0.03 — — 1.35 CESCOD/(t CO2eq·t−1) A厂 1.17 0.19 0.76 0.15 2.89 1.69 1.28 0.008 0.13 0.04 0.34 8.62 B厂 0.27 0.14 0.86 0.03 1.26 0.22 0.24 0.003 0.06 0.01 0.06 3.16 C厂 0.4 0.15 0.91 0.04 1.47 0.29 0.33 0.001 0.07 — — 3.66 CESTN/(t CO2eq·t−1) A厂 9.18 1.47 5.95 1.15 22.72 13.3 10.05 0.06 1 0.31 2.65 67.84 B厂 3.13 1.6 9.9 0.35 14.54 2.54 2.79 0.032 0.72 0.11 0.72 36.44 C厂 4.68 1.73 10.53 0.45 17.06 3.37 3.87 0.016 0.79 — — 42.49 CESTP/(t CO2eq·t−1) A厂 52.07 8.32 33.77 6.51 128.89 75.43 57.02 0.34 5.65 1.78 15.05 384.81 B厂 15.2 7.73 47.99 1.7 70.52 12.33 13.54 0.16 3.47 0.55 3.51 176.69 C厂 32.72 12.1 73.66 3.14 119.39 23.58 27.04 0.11 5.54 — — 297.29 -
[1] HE J,LI Z,ZHANG X,et al. Towards carbon neutrality:A study on China's long-term low-carbon transition pathways and strategies[J]. Environmental Science and Ecotechnology, 2022, 9: 100134. doi: 10.1016/j.ese.2021.100134 [2] LU L,GUEST J S,PETERS C A,et al. Wastewater treatment for carbon capture and utilization[J]. Nature Sustainability, 2018, 1(12): 750-758. doi: 10.1038/s41893-018-0187-9 [3] 戴晓虎,张辰,章林伟,等. 碳中和背景下污泥处理处置与资源化发展方向思考[J]. 给水排水, 2021, 57(3): 1-5. doi: 10.13789/j.cnki.wwe1964.2021.03.001 [4] 郭盛杰,黄海伟,董欣,等. 中国城镇污水处理行业温室气体排放核算及其时空特征分析[J]. 给水排水, 2019, 45(4): 56-62. doi: 10.13789/j.cnki.wwe1964.2019.04.009 [5] 杨勤. 基于生命周期评价的污水处理工艺低碳研究 [D]. 兰州: 兰州大学, 2012. [6] BUKHARY S,BATISTA J,AHMAD S. Water-energy-carbon nexus approach for sustainable large-scale drinking water treatment operation[J]. Journal of Hydrology, 2020, 587: 124953. doi: 10.1016/j.jhydrol.2020.124953 [7] 宋宝木,秦华鹏,马共强. 污水处理厂运行阶段碳排放动态变化分析:以深圳某污水处理厂为例[J]. 环境科学与技术, 2015, 38(10): 204-209. [8] XI J,GONG H,ZHANG Y,et al. The evaluation of GHG emissions from Shanghai municipal wastewater treatment plants based on IPCC and operational data integrated methods (ODIM) [J]. Science of The Total Environment, 2021, 797: 148967. doi: 10.1016/j.scitotenv.2021.148967 [9] WILLIS J L,YUAN Z,MURTHY S. Wastewater GHG accounting protocols as compared to the state of GHG science[J]. Water Environment Research, 2016, 88(8): 704-714. doi: 10.2175/106143016X14609975746965 [10] PAUSTIAN K, RAVINDRANATH N H, AMSTEL A V. 2006 IPCC guidelines for national greenhouse gas inventories[J]. International Panel on Climate Change, 2006. DOI: http://dx.doi.org/10.1016/S1462-9011(99)00023-4. [11] 张岳,葛铜岗,孙永利,等. 基于城镇污水处理全流程环节的碳排放模型研究[J]. 中国给水排水, 2021, 37(9): 65-74. doi: 10.19853/j.zgjsps.1000-4602.2021.09.011 [12] 中国城镇供水排水协会编. 城镇水务系统碳核算与减排路径技术指南 [M]. 北京: 中国建筑工业出版社, 2022. [13] 中国环境保护产业协会. 污水处理厂低碳运行评价技术规范: T/CAEPI -2022 [S]. 2022. [14] IPCC. 2019 Refinement to the 2006 IPCC Guidelines for National Greenhouse Gas Inventory [R]. 2019. [15] SARPONG G,GUDE V G. Near future energy self-sufficient wastewater treatment schemes[J]. International Journal of Environmental Research, 2020, 14(4): 479-488. doi: 10.1007/s41742-020-00262-5 [16] 鲍志远. 典型城市污水处理工艺温室气体排放特征及减排策略研究 [D]. 北京: 北京林业大学, 2019. [17] 谢淘,汪诚文. 污水处理厂温室气体排放评估[J]. 清华大学学报 (自然科学版) , 2012, 52(4): 473-477. [18] WANG J,ZHANG N,XU S,et al. Carbon footprint analysis and comprehensive evaluation of municipal wastewater treatment plants under different typical upgrading and reconstruction modes[J]. Science of The Total Environment, 2023, 880: 163335. doi: 10.1016/j.scitotenv.2023.163335 [19] 彭卓,郭春梅,汪磊磊,等. 绿色建筑全生命周期CO2排放敏感性与减碳潜力研究[J]. 天津城建大学学报, 2021, 27(6): 436-441. [20] 周政, 李怀波, 王燕, 等. 低碳氮比进水 AAO 污水处理厂低碳运行 [J]. 中国环境科学, 42 (11) : 5088-5099. [21] GARFI M,FLORES L,FERRER I. Life Cycle Assessment of wastewater treatment systems for small communities:Activated sludge,constructed wetlands and high rate algal ponds[J]. Journal of Cleaner Production, 2017, 161: 211-219. doi: 10.1016/j.jclepro.2017.05.116 [22] DIAS D F,MARQUES R,MARTINS C,et al. The impact of a seasonal change in loading rate on the nitrous oxide emissions at the WWTP of a tourist region[J]. Science of The Total Environment, 2022, 804: 149987. doi: 10.1016/j.scitotenv.2021.149987 [23] GALLEGO-SCHMID A,TARPANI R R Z. Life cycle assessment of wastewater treatment in developing countries:a review[J]. Water Research, 2019, 153: 63-79. doi: 10.1016/j.watres.2019.01.010 [24] YAN P,SHI H X,CHEN Y P,et al. Optimization of recovery and utilization pathway of chemical energy from wastewater pollutants by a net-zero energy wastewater treatment model[J]. Renewable and Sustainable Energy Reviews, 2020, 133: 110160. doi: 10.1016/j.rser.2020.110160 [25] BAO Z,SUN S,SUN D. Assessment of greenhouse gas emission from A/O and SBR wastewater treatment plants in Beijing,China[J]. International Biodeterioration & Biodegradation, 2016, 108: 108-114. [26] 宋新新,刘杰,林甲,等. 碳中和时代下我国能量自给型污水处理厂发展方向及工程实践[J]. 环境科学学报, 2022, 42(4): 53-63. doi: 10.13671/j.hjkxxb.2021.0384 [27] 鲍志远. 典型城市污水处理工艺温室气体排放特征及减排策略研究 [D]. 北京: 北京林业大学, 2020. [28] CHEN W,ZHANG Q,HU L,et al. Understanding the greenhouse gas emissions from China’s wastewater treatment plants:Based on life cycle assessment coupled with statistical data[J]. Ecotoxicology and Environmental Safety, 2023, 259: 115007. doi: 10.1016/j.ecoenv.2023.115007 [29] 张克强,季民,雷英春,等. 一种处理高氨氮有机废水改良SBR反应器的性能研究[J]. 农业环境科学学报, 2004(5): 1009-1013. doi: 10.3321/j.issn:1672-2043.2004.05.038 [30] 张跃瀚. SBR微膨胀活性污泥法处理生活污水的研究 [D]. 沈阳: 沈阳建筑大学, 2020. [31] CHEN H, ZHENG Y, ZHOU K, et al. Carbon emission efficiency evaluation of wastewater treatment plants: evidence from China [J]. Environmental Science and Pollution Research, 2023: 1-11. [32] ZENG S,CHEN X,DONG X,et al. Efficiency assessment of urban wastewater treatment plants in China:Considering greenhouse gas emissions[J]. Resources,Conservation and Recycling, 2017, 120: 157-165. [33] HE Y,ZHU Y,CHEN J,et al. Assessment of energy consumption of municipal wastewater treatment plants in China[J]. China Shanghai Municipal Engineering Design & Research Ins, 2019, 228: 399-404. [34] 王琳,李德彬,刘子为,等. 泥处理处置路径碳排放分析[J]. 中国环境科学, 2022, 42(5): 2404-2412. [35] WANG H, YANG Y, KELLER A A, et al. Comparative analysis of energy intensity and carbon emissions in wastewater treatment in USA, Germany, China and South Africa[J]. Applied Energy, 2016, 184: 873-881. [36] 范成成, 董焱城, 耿文洋, 等. 河南省某AAO-MBR污水厂运行调控及节能降耗研究[C]// 中国环境科学学会2022年科学技术年会--环境工程技术创新与应用分会场, 南昌, 2022: 207-213 [37] 尚会来,彭永臻,王淑莹,等. 污水生物脱氮过程中N2O的产生和减量化控制[J]. 中国给水排水, 2008(16): 104-108. [38] 郝晓地,赵梓丞,李季,等. 污水处理厂的能源与资源回收方式及其碳排放核算:以芬兰Kakolanm?ki污水处理厂为例[J]. 环境工程学报, 2021, 15(9): 2849-2857. [39] DU W J,LU J Y,HU Y R,et al. Spatiotemporal pattern of greenhouse gas emissions in China’s wastewater sector and pathways towards carbon neutrality[J]. Nature Water, 2023, 1(2): 166-175. doi: 10.1038/s44221-022-00021-0 [40] WERKNEH A A, GEBRU S B. Development of ecological sanitation approaches for integrated recovery of biogas, nutrients and clean water from domestic wastewater [J]. Environment and Sustainability, 2022: 100095. 期刊类型引用(7)
1. 何俊卿,崔芳囡,王曼,石磊,程荣,郑祥. MBR工艺医院污水处理系统碳排放特征研究. 环境科学研究. 2025(02): 243-252 .  百度学术
百度学术
2. 陈彩云,颜佳洁,何美龙. 四类典型二级生化污水处理工艺的碳足迹比较评价及减排潜力分析. 福建轻纺. 2024(01): 4-11+26 .  百度学术
百度学术
3. 耿建斌. 基于内源性反硝化强化技术的市政污水处理厂节能降耗低碳改造研究. 环境与发展. 2024(04): 84-88 .  百度学术
百度学术
4. 章易博,柴文波,王长智,金正宇,逯慧杰. 城镇污水处理厂碳排放核算与基于BioWin的减污降碳模拟. 环境科学学报. 2024(09): 427-438 .  百度学术
百度学术
5. 杨清雯,陈惠鑫,石磊,程荣,郑祥. 渗滤液处理过程碳排放核算及减碳路径探索. 环境科学研究. 2024(11): 2444-2452 .  百度学术
百度学术
6. 卢茜,吴永贵,王怡然,韩义琴. 贵阳市下沉式再生水厂运行阶段碳排放特征研究. 环境工程. 2024(11): 106-114 .  百度学术
百度学术
7. 谭丽琼,朱正,于亚男,索思雨,赵梦云,梁文艳. 再生水湿地中氮和多环芳烃污染特征及其耦合修复机制. 环境科学研究. 2024(12): 2710-2721 .  百度学术
百度学术
其他类型引用(3)
-


 下载:
下载:


