-
持久性和可迁移有机污染物 (persistent and mobile organic contaminants, PMOCs) 是一类人工合成的高极性有机污染物,具有在环境中降解缓慢,在水中有持久性和可迁移性的特点[1]。随着食品制造业、制药业和化工业的快速发展,越来越多的PMOCs随着生活污水和工业废水的排放进入天然水体[2]。目前,监管措施多集中在多氯联苯[3]、有机氯农药[4]这类具有环境持久性 (半衰期长达数年) 、迁移性、生物蓄积性、毒性的有机污染物 (persistent,bioaccumulative and toxic contaminants, PBT) [5],但其在水循环中迁移性较弱,趋向于在生物相和沉积物中会沉积或积聚[6]。PMOCs不仅具有PBT环境持久性的特点,还不容易吸附到土壤和沉积物的表面,在水循环中有很强的扩散能力,会影响到地表水和地下水水质,并最终威胁到饮用水源安全[7]。
目前,气相色谱-质谱联用法 (GC-MS) [8-9]和液相色谱-质谱联用法 (LC-MS) [10-11]是检测PMOCs的主要方法。其中,高效液相色谱-串联质谱技术 (HPLC-MS /MS) 凭借高灵敏度和高选择性的优势在检测极性有机物中更为常用。基于相关文献,本研究选择了17种极性高、环境排放潜力大、难降解的PMOCs作为研究对象,包括人工甜味剂、医药中间体、化工助剂等[12-13]。本研究对固相萃取条件和HPLC-MS/MS 参数进行优化,建立同时测定17种PMOCs的分析方法。在北京潮白河、广东北江和河北滹沱河进行布点采样,测定不同地区水样中的PMOCs的存在水平,旨在为我国水环境中新污染物的监管提供数据支撑。
-
本研究共购买17种PMOCs标准品,2种人工甜味剂包括安赛蜜 (ACE) 和糖精 (SAC);5种医药中间体包括金刚烷胺 (AMANT)、4-甲基氨基硫脲 (MTSC)、N-氨乙基哌嗪 (PEA)、三氟甲烷磺酸 (TFMSA)、硫酸钾酯钠 (MS);10种化工助剂包括1,3-二邻甲苯基胍 (DTG)、二苯胍 (DPG)、苄基三甲基氯化铵 (BETMA)、己内酰胺 (CAP) 、N,N-二甲基苄胺 (BDMA) 、磷酸三 (2-氯丙基) 酯 (TCPP)、对甲苯黄酰胺 (MBSA) 、二甲苯磺酸钠 (XSA)、2-丙烯酰胺基-2-甲基丙磺酸盐 (AMPSA)、双酚S (BPS)。17种PMOCs标准品 (纯度>99%)、HPLC级甲醇、乙腈、甲酸、乙酸铵和0.45 μm玻璃纤维滤膜购自上海安谱公司,Oasis HLB、Oasis MCX和Envi-18固相萃取柱分别购自美国Waters公司和Supelco公司。用甲醇配制含有待测PMOCs 2 000 mg·L−1的单标储备溶液和混标储备液,根据需要进一步配制使用液。
-
依据《地表水和污水监测技术规范》 (HJ/T 91—2002) [14]和《地下水环境监测技术规范》 (HJ 164-2020) [15]分别于2022年4月 (春季,平水期) 、2022年9月 (秋季,丰水期) 采集北京市潮白河地表水和地下水,地表水样品S1和S2取自潮白河上游,S3、S4和S5取自潮白河下游,采集深度为0~1 m;地下水样品1#和2#位于一期工程间歇受水区,3#、4#和5#位于一期工程常年受水区,采集深度为30 m。2022年4月,采集广东北江韶关至佛山段10个地表水样品,采集深度为0~1 m。2022年10月,采集河北滹沱河正定至无极段10个地表水样品,采集深度为0~1 m。每个样点采集水样3 L。
水样采用SPE处理,具体流程为:用0.45 μm玻璃纤维滤膜过滤2 L水样,分别用5 mL乙腈、甲醇和超纯水活化固相萃取柱,2 L水样通过固相萃取柱富集,用10 mL的乙腈对固相萃取柱中的目标物进行洗脱处理,收集洗脱液,用无水硫酸钠脱水后经过旋转蒸发仪和氮吹仪浓缩至0.5 mL待测[16]。
-
高效液相色谱柱 (Inert Suatain C18 column,150 mm×4.6 mm,5 μm) ,进样体积10 μL,柱温40 ℃,用乙腈和含10 mmol·L−1乙酸铵的水溶液作为流动相进行梯度洗脱,0~9 min乙腈由40%升至80%,9~12 min乙腈由80%降至40%,12~15 min保持乙腈为40%平衡3 min,选用电喷雾离子源 (ESI) 和多反应监测模式 (MRM) ,雾化气和干燥器流速分别为3和15 L·min−1,去溶剂温度和加热区温度分别为250 ℃和400 ℃,17种PMOCs的质谱参数如表1 所示。
-
在实验过程中利用超纯水进行空白基质加标实验 (混合溶液的浓度梯度为0、10、30、80、150、300 ng·L−1) ,基于加标回收率和5个平行样的相对标准偏差验证固相萃取前处理方法可靠性。方法检出限( LODs)和方法定量限( LOQs)分别以3倍信噪比 (S /N = 3) 和10倍信噪比 (S /N= 10) 进行计算。每批次样品均分析试剂空白;每分析一批样品至少做1个空白进行校正;仪器每12小时做1次溶剂空白,检查仪器的污染状况。
-
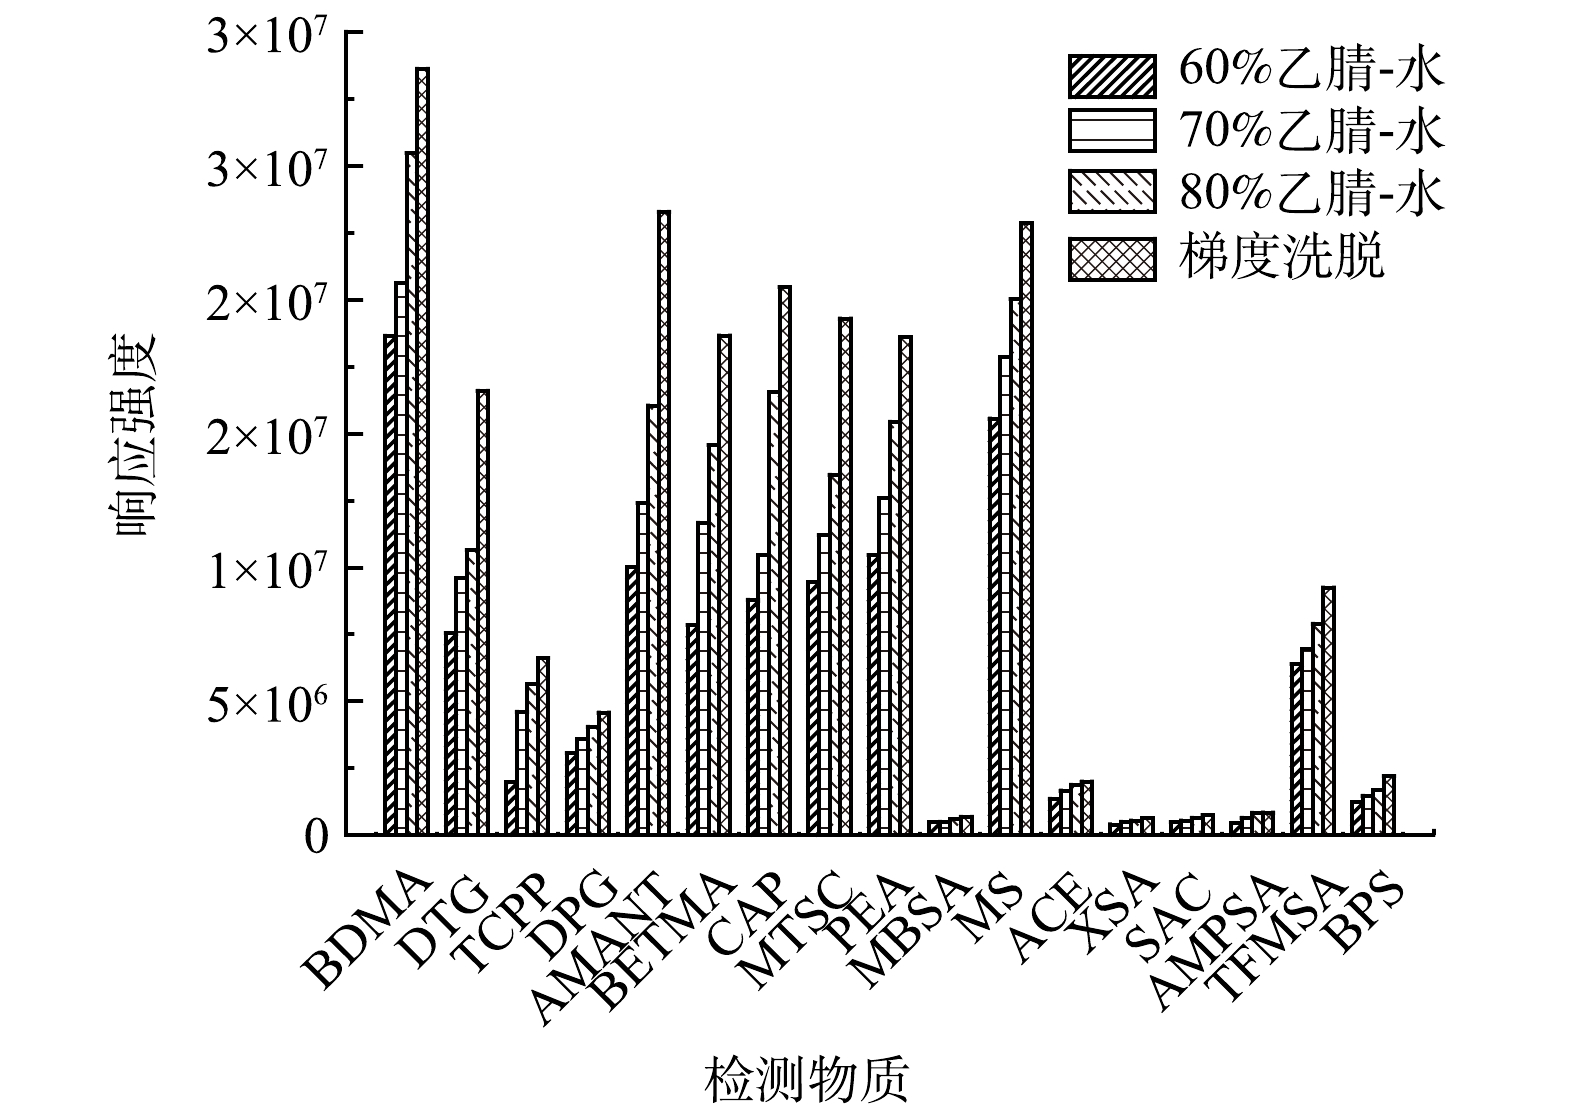
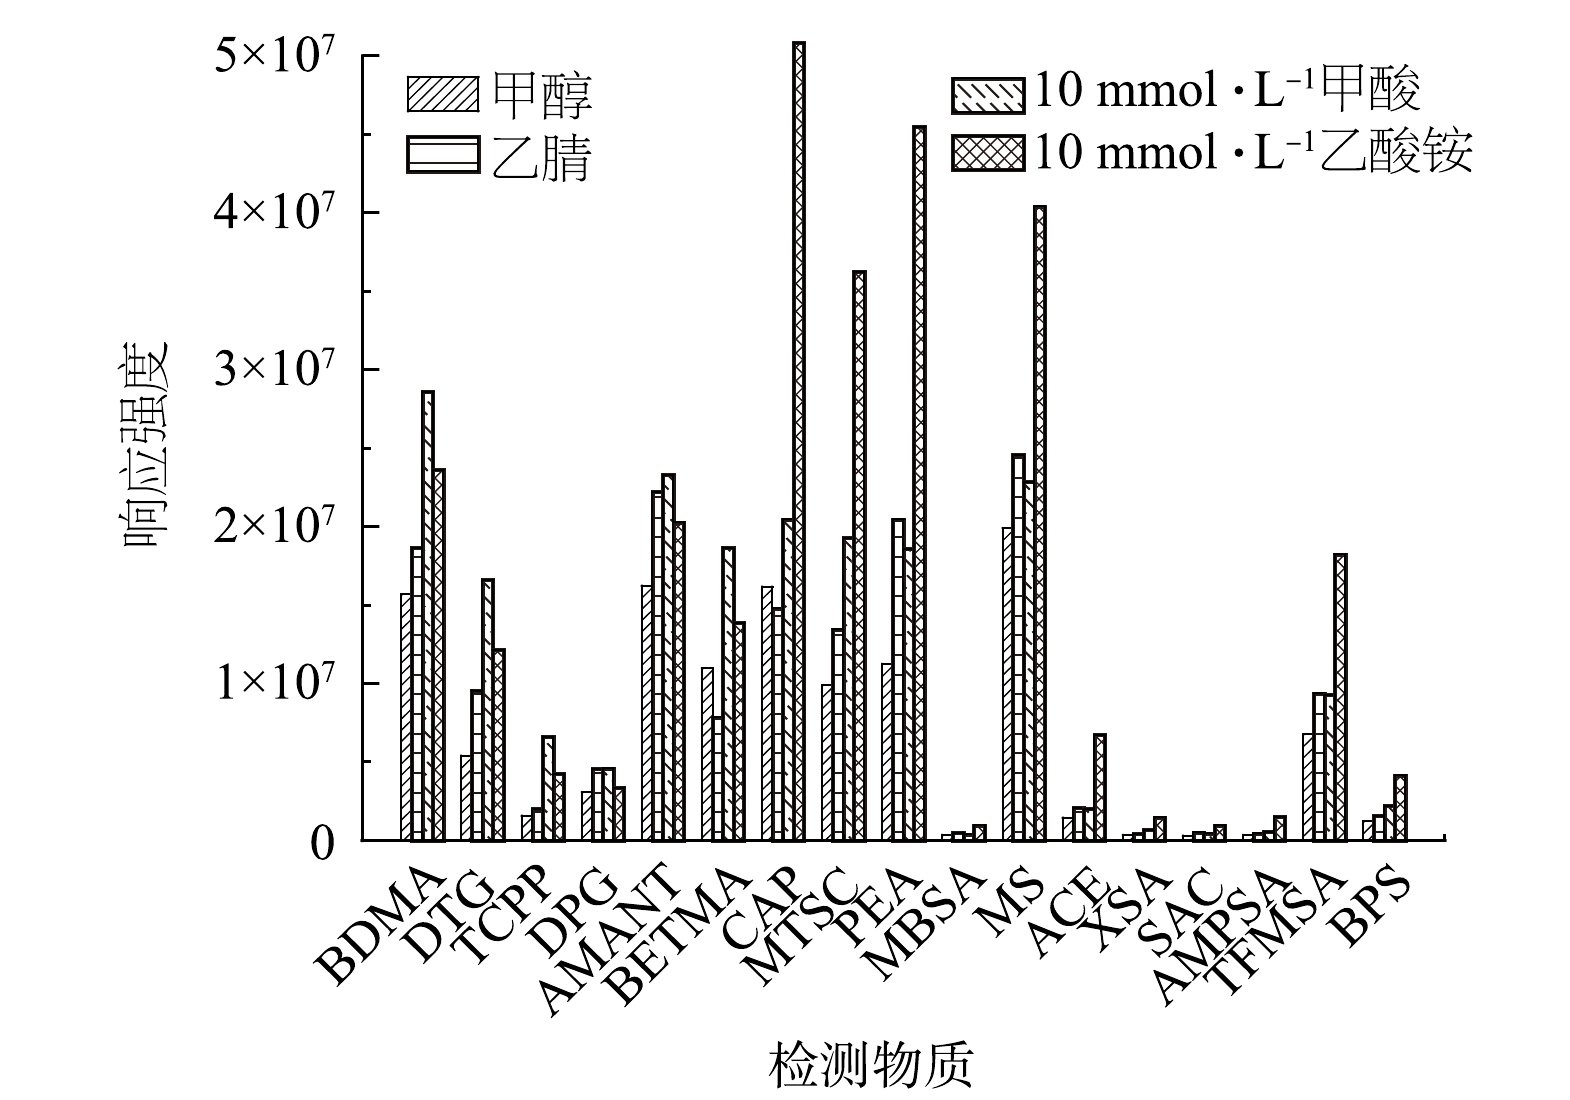
实验优化了流动相水、甲醇和乙腈的组成和比例,BETMA和CAP的响应强度在甲醇-水体系下比乙腈-水体系高28.46%和8.58%,其余的15种PMOCs在乙腈-水体系下响应强度增大18.94%~76.84%,选择乙腈-水体系作为流动相。60%、70%、80%乙腈-水等度洗脱和经过反复优化的梯度洗脱结果如图1所示, 17种PMOCs在梯度洗脱条件下的响应强度最高。HPLC-MS/MS在正离子模式下,加甲酸可以提高其响应强度[17],而在负离子模式下加乙酸铵可以提高其响应强度[18]。实验研究了含10 mmol·L−1甲酸和10 mmol·L−1乙酸铵的水溶液作为无机相分别进行梯度洗脱的效果,实验结果如图2所示,发现含10 mmol·L−1甲酸的水溶液做无机相,正离子模式下的PMOCs响应强度提高了20.04%~53.37%,负离子模式下的PMOCs相应强度降低了6.97%~33.17%。采用含10 mmol·L−1乙酸铵的水溶液作为无机相,负离子模式下的PMOCs响应强度提高12.36%~259.64%,特别是响应强度较低的MBSA、XSA、SAC和AMPSA,增加10 mmol·L−1乙酸铵后,其响应强度提高了94.39%~259.27%。正离子模式下的4种PMOCs响应强度只降低8.77%~23.29%,因此,有机相选择乙腈,无机相选择含10 mmol·L−1乙酸铵的水溶液作为流动相进行检测。
-
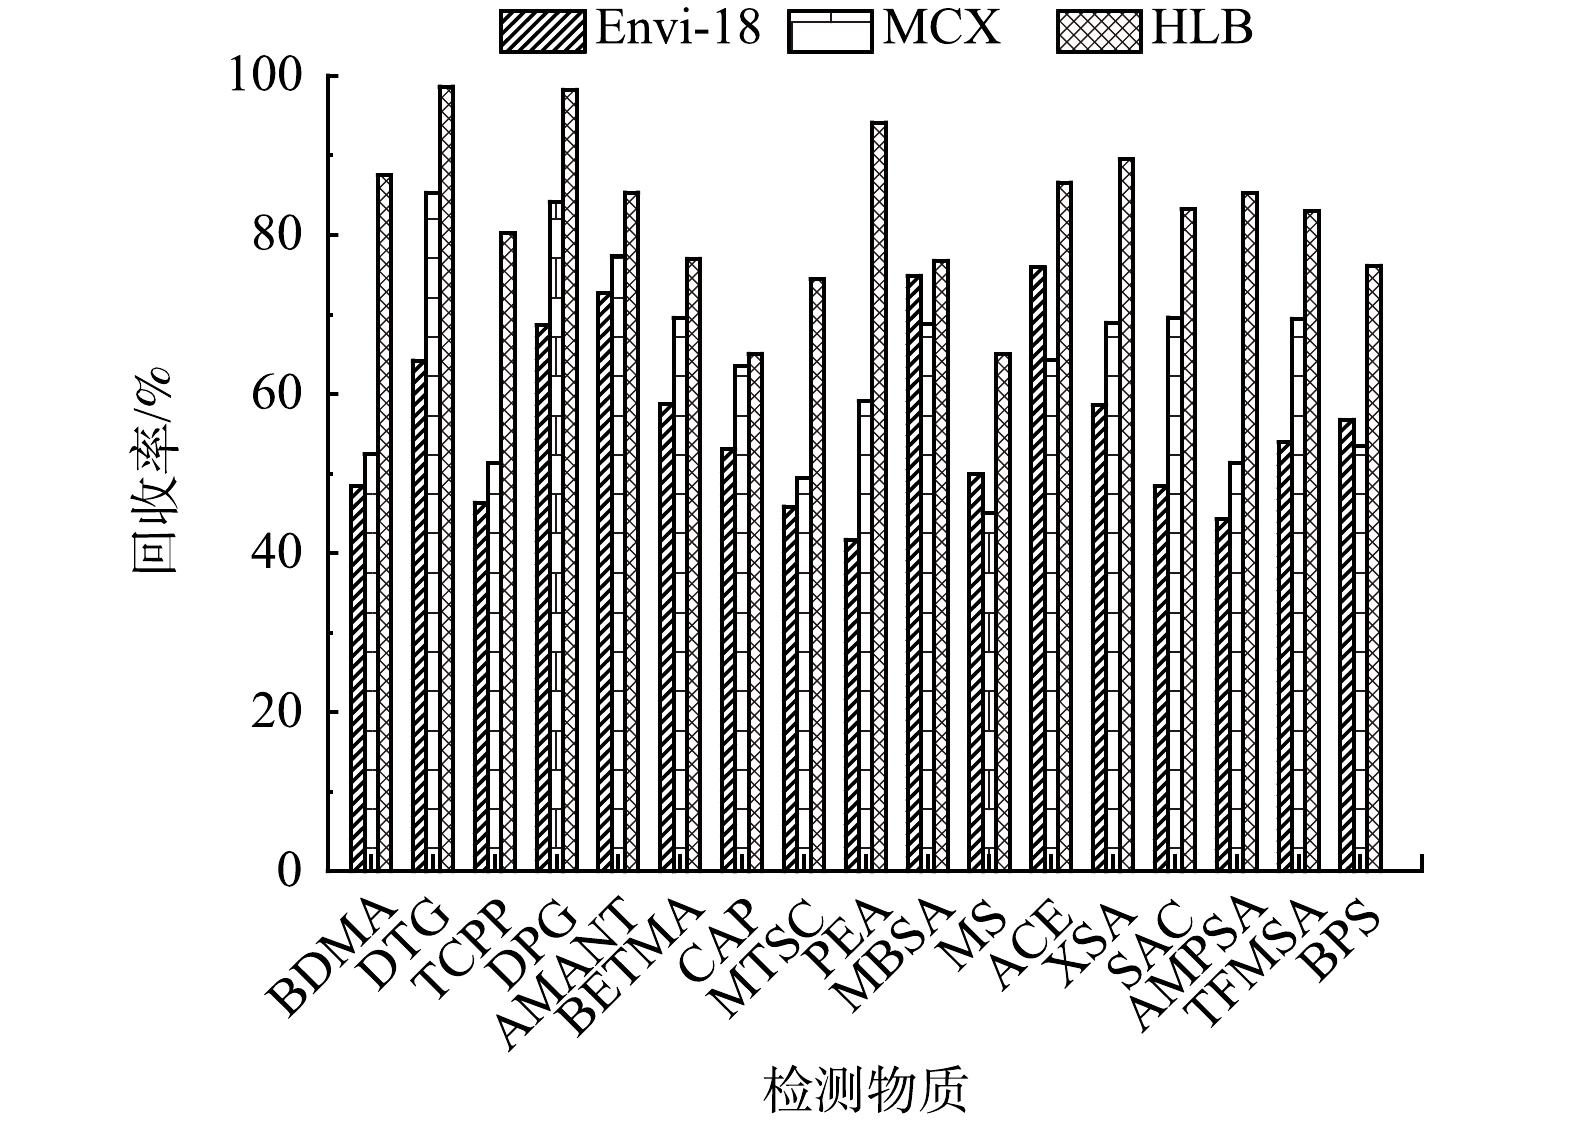
常用的固相萃取柱有Oasis WCX、Oasis HLB、Oasis MCX、Envi-18等[19]。HLB柱含有特定比例的亲水基和疏水基,使其适合提取多种极性的分析物[20]。MCX具有反相和阳离子交换双重保留性能,对碱性化合物有良好的保留能力[21]。Envi-18含碳量大于17%,是一种较为通用的固相萃取柱。比较了Envi-18、MCX和HLB对PMOCs的富集效果。3种固相萃取柱的富集效果如图3所示,HLB柱、MCX柱和Envi-18柱对PMOCs的萃取的回收率分别为76.14%~98.65%、45.03%~85.31%和41.69%~75.92%,故实验中水样固相萃取选择HLB柱。
-
方法回收率、相对标准偏差 (RSD) 、相关系数R2、检出限 (LODs,S/N=3) 和定量限 (LOQs,S/N=10) ,结果如表2所示:17种PMOCs相关系数均大于0.99,方法检出限为0.04~0.35 ng·L−1,定量限为0.13~1.16 ng·L−1,回收率为65.01%~98.65%,RSD为3.6%~8.9%。MONTES等[22]采用混合模式固相萃取法-液相色谱-串联质谱法检测了西班牙地表水中23种PMOCs,该方法的检出限为0.02~18 ng·L−1,定量限为0.1~60 ng·L−1,回收率为60%~107%。干志伟等[23]采用固相萃取-液相色谱-串联质谱法同时测定水中7种人工甜味剂,该方法定量限为0.1~6 ng·L−1,回收率为82.4%~93.5%。上述方法的回收率与定量限与本研究方法相近。
-
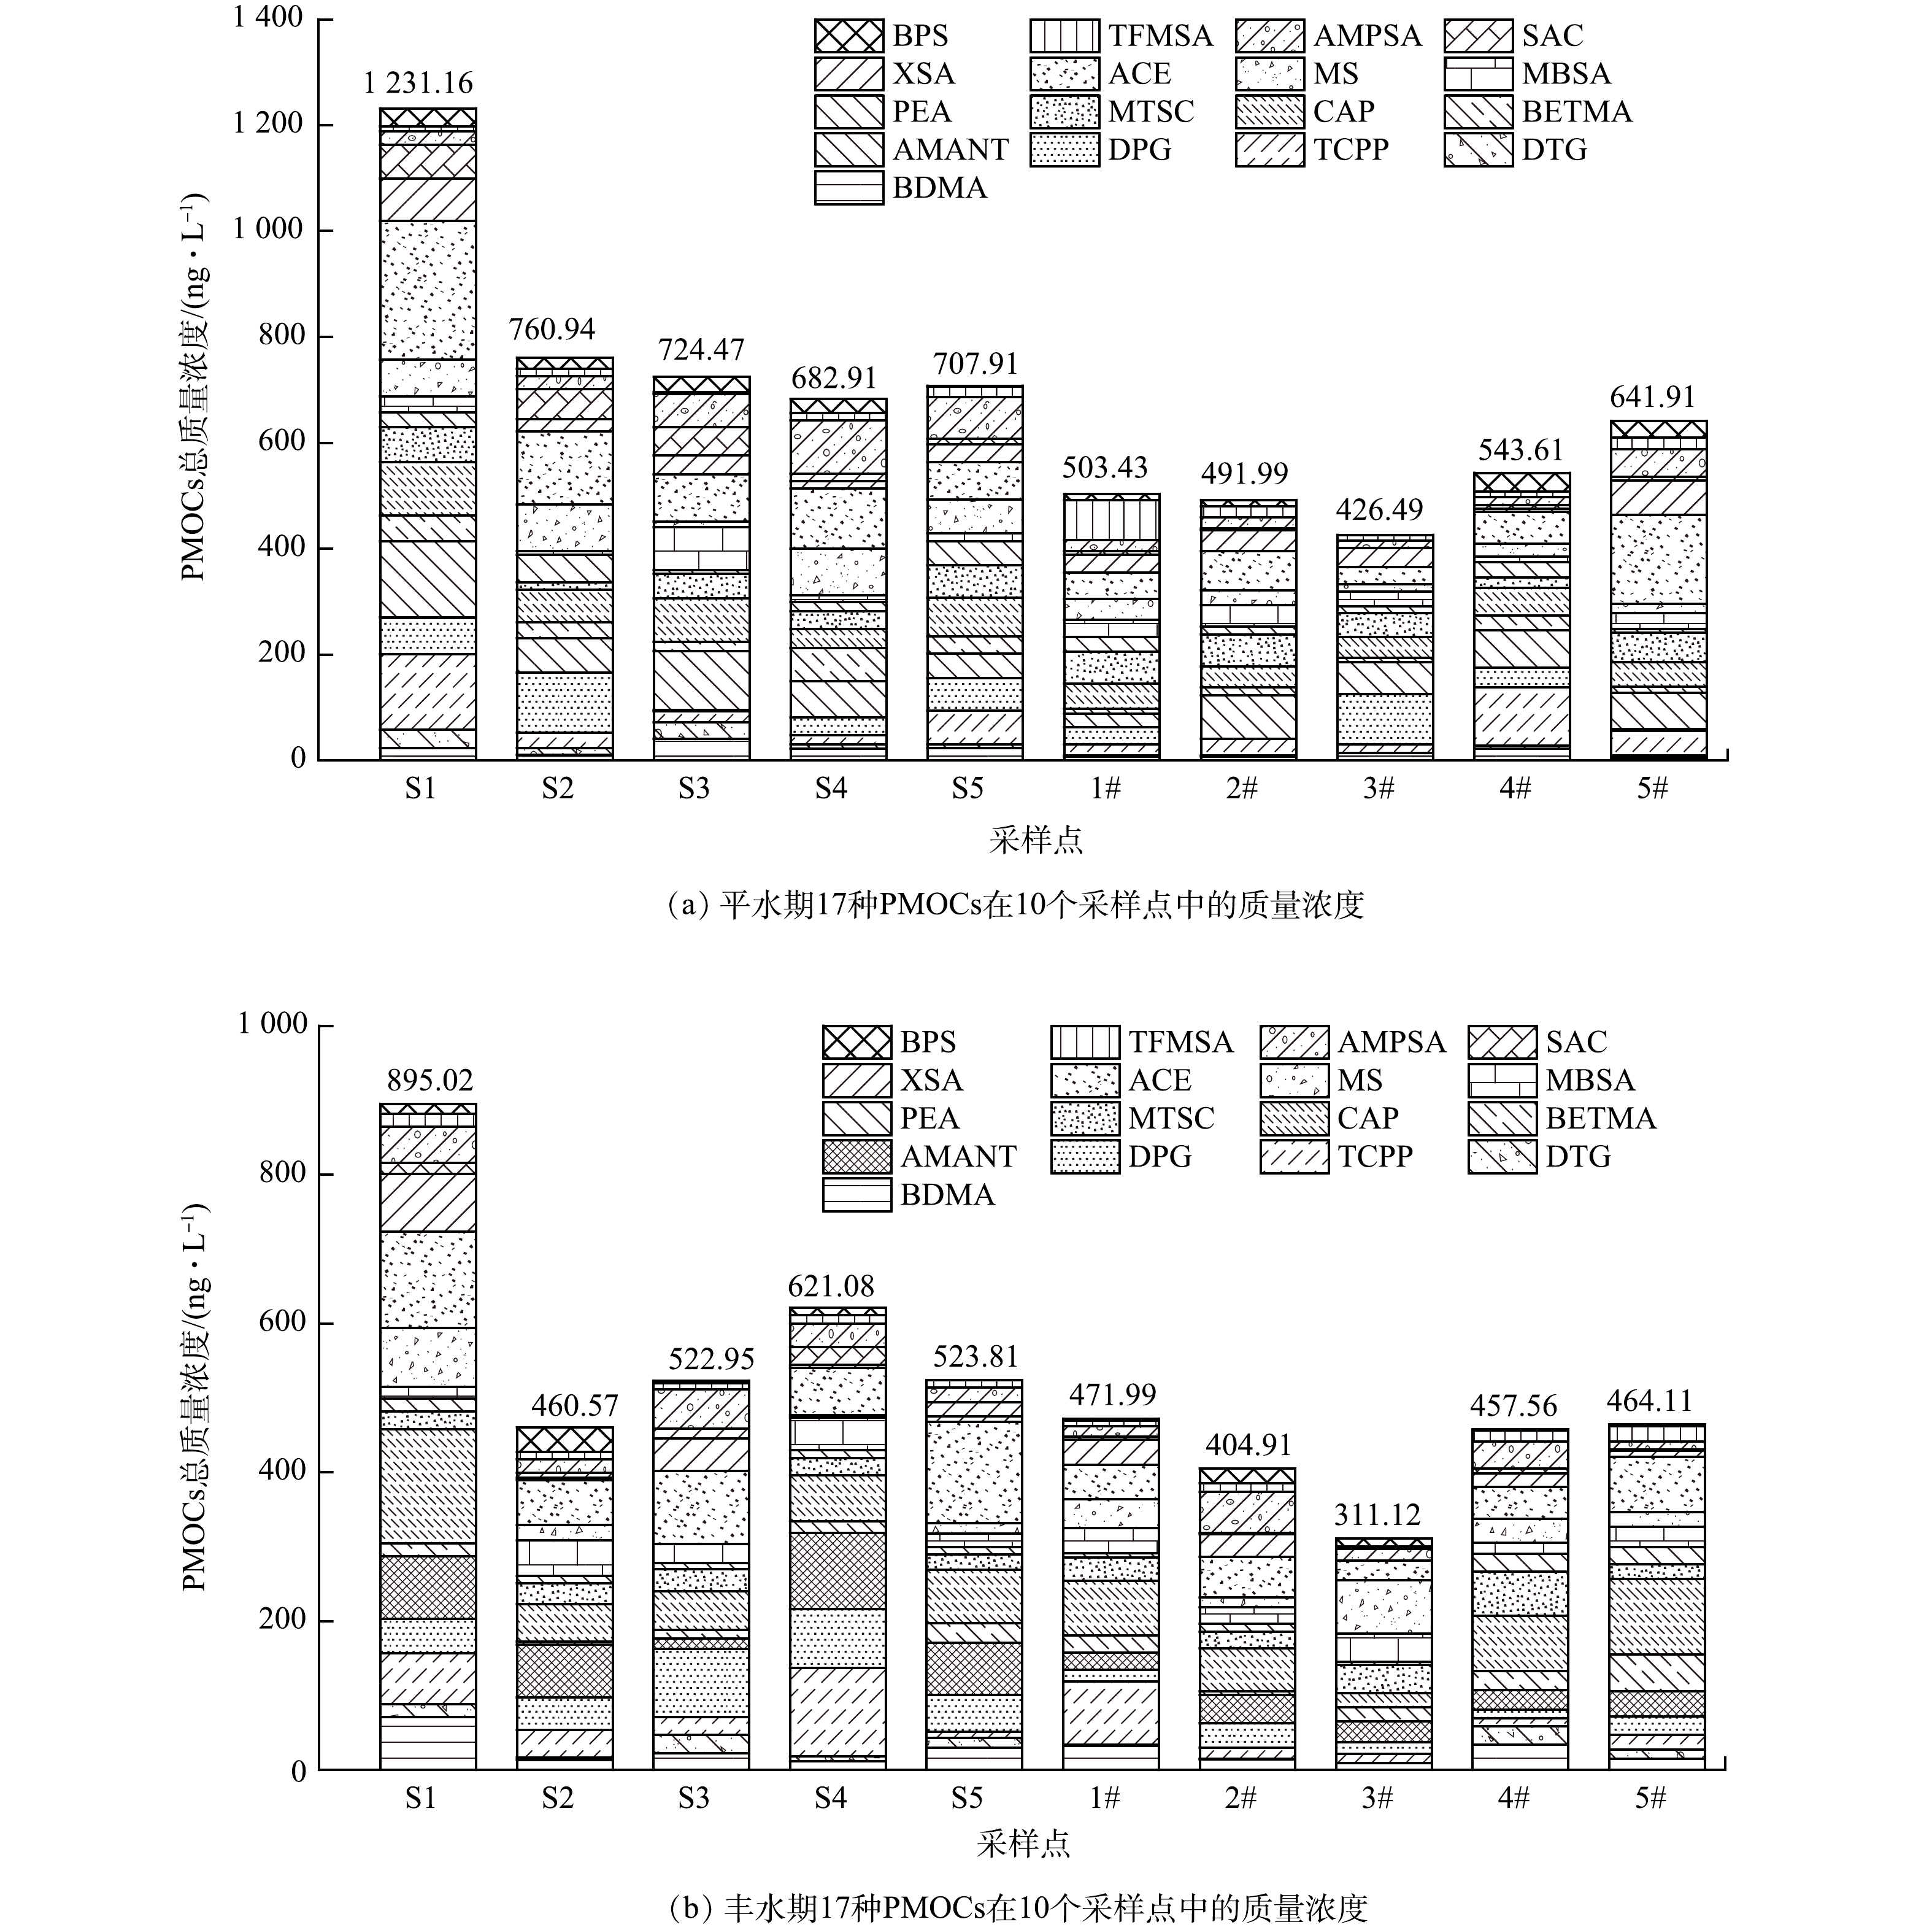
1) 北京潮白河地表水和地下水中PMOCs的检测。潮白河平水期和丰水期水样中PMOCs的检测结果如表3和表4所示,17种PMOCs在地下水和地表水中均有检出,地表水质量浓度范围为ND~261.75 ng·L−1,地下水质量浓度范围为ND~109.69 ng·L−1。地表水中安赛蜜 (ACE) 、金刚烷胺 (AMANT) 和己内酰胺 (CAP) 的质量浓度相对较高,分别为59.78~261.75、13.37~143.84和36.56~153.71 ng·L−1。地下水中安赛蜜 (ACE)、金刚烷胺 (AMANT) 和磷酸三 (2-氯丙基) 酯 (TCPP) 的质量浓度相对较高,分别为25.61~168.11、22.41~70.58和10.61~109.69 ng·L−1。ACE是常用的人工甜味剂,广泛应用于食品、药物和个人护理品。ACE在污水处理厂中去除效果差,并且在环境中难以被吸附或降解[24-25]。AMANT是一种抗病毒药物,可直接或间接引起生物体神经损伤[26]。AMANT由于价格低廉,大量用于养殖业,在生物体中多以原药形式排入外界环境,对环境中的动植物等产生一定的影响[27]。CAP在化工领域的应用极为广泛,因其具有良好的水溶性且具有毒性,中国、美国、欧盟等均将其列入常规监测和优先监测的污染物名单[28]。TCPP作为增塑剂和阻燃剂在聚氨酯泡沫、PVC、纺织品中使用,相关研究表明TCPP具有神经毒性、内分泌干扰性、基因突变性和致癌等多种危害[29]。
17种PMOCs的时空分布如图4所示,2022年4月地表水ƩPMOCs的质量浓度范围为682.91~1 231.76 ng·L−1,地下水ƩPMOCs的质量浓度范围为446.49~641.91 ng·L−1;2020年9月地表水ƩPMOCs的质量浓度范围为522.95~895.02 ng·L−1,地下水ƩPMOCs的质量浓度范围为311.12~471.99 ng·L−1。PMOCs在地表水中的质量浓度高于地下水中的浓度,这可能是污染物在向地下水迁移的过程中,由于土壤的吸附作用、微生物的生物降解以及污染物在地下水中产生的弥散作用导致地下水中PMOCs的质量浓度减少[30-31] 。潮白河地表水上游S1样点PMOCs质量浓度明显高于地表水其它采样点。5个地下水样点中PMOCs质量浓度相差没有地表水明显,3#样点在减河和潮白河交汇处下游,减河补水稀释作用可能导致此点PMOCs质量浓度低于其它几个样点,4号和5号样点上游存在俸伯桥和彩虹桥排污口,可能导致PMOCs质量浓度有所上升。地表水和地下水在4月份 (平水期) 的PMOCs质量浓度高于9月份 (丰水期) 的PMOCs质量浓度。北京属于典型的暖温带半湿润半干旱季风气候,夏季高温多雨,冬季寒冷干燥,春、秋短促,9月份降水多于4月份,雨水稀释作用可能是9月份PMOCs质量浓度较低的原因。
2) 广东北江地表水中PMOCs的检测。北江水样中PMOCs的检测结果见表5,17种PMOCs均有检出,其质量浓度范围为0.83~444.46 ng·L−1。ƩPMOCs质量浓度最高的采样点为 B01,其质量浓度为1 476.21 ng·L−1。北江中安赛蜜 (ACE) 、磷酸三 (2-氯丙基) 酯 (TCPP) 和己内酰胺 (CAP) 的质量浓度相对较高,分别为60.49~433.14、17.76~444.46和41.68~108.76 ng·L−1。
3) 河北滹沱河地表水中PMOCs的检测。河北滹沱河水样中PMOCs的检测结果见表6,17种PMOCs均有检出,其质量浓度范围为ND~218.10 ng·L−1。ƩPMOCs质量浓度最高的采样点为 H06,其质量浓度为824.11 ng·L−1。滹沱河中金刚烷胺 (AMANT) 、己内酰胺 (CAP) 和磷酸三 (2-氯丙基) 酯 (TCPP) 的质量浓度较高,分别为4.36~218.10、14.33~101.14和11.82~222.60 ng·L−1。
4) 国内外水体中PMOCs存在水平对比。17种PMOCs在潮白河、北江和滹沱河中均有检出,其ƩPMOCs平均质量浓度分别为604.69、740.45和505.11 ng·L−1,北江ƩPMOCs平均质量浓度高于潮白河和滹沱河,其原因可能是北江流域有许多的化工生产企业,而潮白河和滹沱河属于生态涵养区,PMOCs排放源较少。虽然国内关于水体中PMOCs作为一大类物质进行检测还没有相关的文献报道,但是部分研究人员对水体中一些属于PMOCs的物质进行了检测。
桂建业等[24]采用离子色谱-串联质谱法在石家庄地表水中检测到安赛蜜 (ACE) 的质量浓度为32.2~955.1 ng·L−1,地下水中的质量浓度为5.9~92.5 ng·L−1。JIN等[32]采用超高效液相色谱-串联质谱法在太湖、辽河和浑河检测的双酚S (BPS) 质量浓度分别为0.28~37、0.22~52和0.61~46 ng·L−1。李栋等[33]采用液相色谱-质谱联用法在长江南京段水源水中检测到磷酸三 (2-氯丙基) 酯 (TCPP) 的质量浓度为6.02~318.23 ng·L−1。上述三种PMOCs检出质量浓度与本研究水体浓度相近。
水体中PMOCs污染现状系统性的研究主要集中在欧洲。BUERGE等[34] 采用固相萃取法-液相色谱-串联质谱联用法检测到瑞士地表水中ACE质量浓度高达4 700 ng·L−1,地下水中ACE质量浓度为20~2 600 ng·L−1。MONTES等[22]采用混合模式固相萃取法-液相色谱-串联质谱法检测了西班牙地表水中PMOCs,其中糖精 (SAC) 质量浓度为77~7 707 ng·L−1,二甲苯磺酸钠 (XSA) 质量浓度为11~1 767 ng·L−1。SCHULZ等[35] 采用混合模式液相色谱-质谱联用法在德国、西班牙和荷兰各类水体中检出了43种典型PMOCs, 其中苄基三甲基氯化铵 (BETMA) 质量浓度高达400 ng·L−1。潮白河、北江和滹沱河地表水中SAC质量浓度分别为9.60~63.71、4.54~31.70和ND~22.44 ng·L−1,XSA质量浓度分别为14.29~79.45、20.93~130.85和3.64~43.09 ng·L−1,BETMA质量浓度分别为18.15~62.59、 23.99~79.06和2.28~159.80 ng·L−1。欧洲水体中ACE、SAC,XSA和BETMA质量浓度明显高于本研究水体中的浓度,其余PMOCs质量浓度与本研究结果相近。
-
1) 采用HLB固相萃取柱对水样中17种PMOCs进行固相萃取,用乙腈和含10 mmol·L−1乙酸铵的水溶液作为流动相,该方法的准确度和精密度均可满足水体中PMOCs的检测分析要求,17种PMOCs的方法检出限为0.04~0.35 ng·L−1,定量限为0.13~1.16 ng·L−1,回收率为65.01%~98.65%。
2) 17种PMOCs在潮白河、北江和滹沱河中均有检出,其ƩPMOCs平均质量浓度分别为604.69、740.45和505.11 ng·L−1,北江PMOCs的质量浓度高于潮白河和滹沱河。北京潮白河地表水中ACE、AMANT和CAP的质量浓度相对较高。广东北江中ACE、TCPP和CAP的质量浓度相对较高。石家庄滹沱河中AMANT、CAP和TCPP的质量浓度较高。北京潮白河地表水中PMOCs的质量浓度高于地下水中的质量浓度,地表水和地下水在平水期的PMOCs质量浓度高于丰水期的质量浓度。
水体中17种持久性和可迁移有机污染物的检测
Determination of 17 persistent and mobile organic contaminants (PMOCs) in water
-
摘要: 持久性和移动性有机污染物 (persistent and mobile organic contaminants, PMOCs) 在环境中降解缓慢,并且可以通过水体循环进行迁移。由于缺乏水体中PMOCs的高效富集和准确测定方法,导致关于PMOCs在水体中存在水平的可靠监测数据较少。通过优化固相萃取条件和高效液相色谱-串联质谱参数,建立了同时检测水中17种PMOCs的分析方法。采用HLB固相萃取柱对水样中的PMOCs进行富集,乙腈和含10 mmol·L−1乙酸铵的水溶液作为流动相进行梯度洗脱,PMOCs检出限为0.04~0.35 ng·L−1,定量限为0.13~1.16 ng·L−1,回收率为65.01%~98.65%。在北京潮白河、广东北江和河北滹沱河进行布点采样,并测定其PMOCs的质量浓度。实验结果表明:17种PMOCs在潮白河、北江和滹沱河中均有检出,其ƩPMOCs平均质量浓度分别为604.69、740.45和505.11 ng·L−1。潮白河地表水中安赛蜜、金刚烷胺和己内酰胺的质量浓度相对较高,分别高达261.75、143.84和153.71 ng·L−1。北江中安赛蜜、磷酸三 (2-氯丙基) 酯和己内酰胺的质量浓度相对较高,分别高达433.14、444.46和108.76 ng·L−1。滹沱河中金刚烷胺、己内酰胺和磷酸三 (2-氯丙基) 酯的质量浓度较高,分别高达218.10、101.14和222.60 ng·L−1。本研究结果可为地表水和地下水水体中PMOCs的检测评价提供参考。
-
关键词:
- 持久性和可迁移有机污染物 /
- 高效液相色谱-串联质谱仪 /
- 固相萃取 /
- 地表水 /
- 地下水
Abstract: The persistent and mobile organic contaminants (PMOCs) in aquatic environments degrade very slowly and present a great ability to spread through the water cycle. Due to the lack of both enrichment and determination methods for PMOCs analysis in water samples, only a few reliable monitoring data as regards the real levels of these compounds. The analytical methods were developed to determine 17 PMOCs in the surface and ground water with solid-phase extraction (SPE) pretreatment and liquid chromatography-tandem mass spectrometry (HPLC-MS/MS). Water samples were concentrated by SPE with the HLB cartridge, and gradient elution was performed using methanol and 10 mmol·L−1 ammonium acetate as the mobile phases. The limits of detection (LODs) and quantitation (LOQs) for the 17 PMOCs ranged from 0.04~0.35 ng·L−1 and 0.13~1.16 ng·L−1, respectively. The average recoveries of the 17 PMOCs ranged from 65.01%~98.65%. Water samples were collected and detected from Chaobai River (Beijing), Beijiang River (Guangdong) and Hutuo River (Hebei). The average concentrations of ƩPMOCs were respectively 604.69, 740.45 and 505.11 ng·L−1. The concentrations of acesulfame, amantadine and caprolactam in the Chaobai River were relatively high, as high as 261.75, 143.84 and 153.71 ng·L−1. The concentrations of acesulfame, tris(1-chloro-2-propyl) phosphate and caprolactam in the Chaobai River were relatively high, as high as 433.14, 444.46, 108.76 ng·L−1. The concentrations of amantadine, caprolactam and tris(1-chloro-2-propyl) phosphate in the Hutuo River were relatively high, as high as 218.10, 101.14 and 222.60 ng·L−1. This study can provide a reference for the detection assessment of PMOCs in surface water and groundwater. -
除草剂在农业生产中必不可少,其中阿特拉津(C8H14ClN5,atrazine,ATZ)就是使用最广泛的氯类除草剂之一[1]。阿特拉津非常稳定,会污染土壤和水环境[2],从而影响生态系统并对人类构成健康风险。欧盟在2003年就禁止了阿特拉津,但在中国、巴西和伊朗等发展中国家仍广泛使用[3]。目前,我国在河流、湖泊和水库中陆续检出到阿特拉津,并表现出逐年增加的趋势[4]。由于阿特拉津及其代谢产物毒性大,传统的处理技术如吸附和生化处理难以将其有效去除[1,4]。以臭氧催化氧化法和Fenton/类Fenton氧化法为代表的高级氧化法虽然能有效地氧化ATZ,但臭氧产生成本高,实际利用率低,Fenton/类Fenton氧化法pH范围小,反应过程中产生大量污泥[1,5]。因此,迫切需要研究更高效的处理方法。
近年来,由于SO4·−具有极高的氧化-还原电位(2.50~3.10 eV,HO·为1.89~2.72 eV)、相对较长的半衰期(30~40 μs,HO·为20 ns)和广泛的pH适用范围(2~8)[6-8],基于SO4·−的催化氧化技术已成为极富希望的处理方法[9-10]。由于过一硫酸盐(peroxymonosulfate, PMS)非均相催化剂主要以过渡金属氧化物为主,其中以氧化钴的催化效率最高[11-12],但不够稳定,浸出的钴离子可能对环境有害[13]。为克服这一问题,最有效的方法之一是制备钙钛矿结构的钴基催化剂[14-15]。具有ABO3结构的钙钛矿复合金属氧化物用作PMS催化剂受到了广泛的关注[16],A位点一般为稀土金属,与氧形成密集的立方堆积,对其结构的稳定起着主要作用;B位点一般为过渡金属,占据八面体中心,影响电子转移能力和氧空位的数量,从而影响催化活性[17]。A位金属通常为金属镧,有利于B位金属的暴露而不影响催化活性[18-19]。在LaBO3中,Co被认为是最活跃的金属,因为Co(Ⅱ)/Co(Ⅲ)氧化还原对能催化PMS产生更多的ROS(reactive oxygen species)[20]。LaCoO3已被证明可有效活化PMS以降解萘普生[21]、四环素[22]、卡马西平[23]和2-苯基-5-磺基苯并咪唑[24]。然而,有关LaCoO3活化PMS降解ATZ性能和降解机理,以及ATZ与LaCoO3表面吸附态PMS之间是否存在直接电子传递作用,并导致其对ATZ降解,尚缺乏相关报道。
阴离子对PMS催化体系具有重要影响[25],共存阴离子在实际废水中经常出现,研究阴离子对PMS催化体系的影响具有重要意义。阴离子一方面可能改变催化剂的稳定性,另一方面可能通过干扰自由基的产生和后续反应[26],在负载型Co3O4活化PMS降解罗丹明B体系中,Cl−有轻微的促进作用[27];而HCO3−、CO32−和Cl−会明显抑制钴酸锰活化PMS降解有机染料[28]。有研究表明,实际废水与模拟废水的处理效果存在较大差异,可能是实际废水中无机阴离子产生了干扰[29]。关于阴离子对PMS催化体系性能的研究还不太充分。为此,本研究系统地探究了常见无机阴离子和腐植酸(HA)对催化体系的影响。
本文采用溶胶-凝胶法制备了钙钛矿催化剂,并将其用于活化PMS降解ATZ,评价了催化剂类型、PMS投加量、催化剂投加量、ATZ质量浓度、pH和实验用水等因素的影响,讨论了Cl−、NO3−、HCO3−、H2PO4− 和SO42−及HA的影响,阐明了PMS的催化机理。
1. 材料与方法
1.1 实验试剂
硝酸镧(La(NO3)3·6H2O)、硝酸钴(Co(NO3)2·6H2O)、无水柠檬酸(C6H8O7)、叔丁醇(TBA)、L-组氨酸(C6H9N3O2)、硫酸(H2SO4)、对苯醌(p-BQ)、氢氧化钠(NaOH)、乙腈(色谱纯)、5,5-二甲基-1-吡咯啉-N-氧化物(DMPO),2,2,6,6-四甲基哌啶(TEMP)和过一硫酸盐(PMS,KHSO5·0.5KHSO4·0.5K2SO4)购自上海阿拉丁生化科技股份有限公司。阿特拉津(ATZ,≥97%)和甲醇(CH3OH)购自上海麦克林生化科技有限公司。此外,实验中使用的化学药品和溶剂除单独注明外均为分析纯。
1.2 钙钛矿催化剂制备方法
采用溶胶-凝胶法制备钙钛矿催化剂[30]。将一定比例的金属硝酸盐溶解在50 mL去离子水中,完全溶解后,添加柠檬酸(添加物质的量等于总金属物质的量)作为配体,随后将金属硝酸盐和柠檬酸的混合物搅拌2.00 h,然后继续搅拌并在80.00 ℃水浴加热直至凝胶状物质出现。所得到的凝胶随后在105.00 ℃下烘干6.00 h得到海绵状材料,冷却后将其研磨成细粉,随后在马弗炉中煅烧4.00 h(800.00 ℃,5.00 ℃·min−1)。冷却后将样品用无水乙醇和纯水洗净数次并烘干保存待用。
1.3 实验方法
将0.01 g阿特拉津溶于1.00 L(10.00 mg·L−1)去离子水中,搅拌24.00 h待用。将15.00 mg催化剂和4 mL PMS溶液(0.1 mmol·L−1)加入到100.00 mL ATZ溶液中,以300.00 r·min−1的转速搅拌,实验温度为室温(25±1.00) ℃。取样时在取样管中预先加入1.00 mL的甲醇(1.00 mol·L−1),用注射器取出反应液1.00 mL,过0.45 μm水系膜后待测。
催化降解实验:分别设置不同的ATZ初始质量浓度(1.00、2.50、5.00、7.50和10.00 mg·L−1)、PMS初始质量浓度(0.064、0.128、0.256、0.320、0.384和0.512 g·L−1)、催化剂投加量(0.05、0.10、0.15、0.20和0.25 g·L−1)和模拟废水初始pH(3.00、4.00、5.42、7.00、9.00和11.00)。
无机阴离子影响实验:分别设置Cl−、NO3−、HCO3−、H2PO4−和SO42−(1.00、5.00、10.00和20.00 mmol·L−1)、腐殖酸(10、20、50和100 mg·L−1)和不同实验用水(纯净水、自来水和地表水)。其中纯净水由分析型超纯水机(WP-UP-WF-30,沃特浦,中国)制得,电导率约为1~10 μS·cm−1(25 ℃),自来水为广州大学城管道自来水,地表水取自珠江广州大学城河段南亭村断面)。
1.4 分析方法
利用扫描电子显微镜(SEM,蔡司-Sigma300,牛津能谱,德国)观测LaCoO3表面形貌;利用能谱仪(EDS,蔡司-Sigma300,牛津能谱,德国)测定元素组成;利用X射线衍射仪(XRD,Bruker D8 Advance,德国)检测LaCoO3的结构;利用X射线光电子能谱仪(XPS,ThermoFisher Nexsa,美国)分析LaCoO3表面元素和价态;利用电化学工作站(CHI760E,辰华,中国)测定计时电流;利用电子顺磁共振(EPR,Bruker-EMXplus-10/12,德国)检测体系中的ROS。
采用高效液相色谱(HPLC,Waters-e2695,USA)检测样品中ATZ的质量浓度[31]。色谱柱为C-18(Waters,5 μm,4.6 mm×250 mm),检测器为紫外检测器(2998 PDA Detector),流动相由乙腈和0.10%乙酸溶液组成,其体积比为60%:40%,流速1.00 mL·min−1,柱温40 ℃,检测波长221.00 nm,注射体积20.00 μL。采用电感耦合等离子体质谱(ICP-MS,Agilent 7700/7800,美国)检测镧元素和钴元素的浸出质量浓度。pH由pH-3c仪(Rex,上海雷磁,中国)测定。
2. 结果与讨论
2.1 催化剂表征
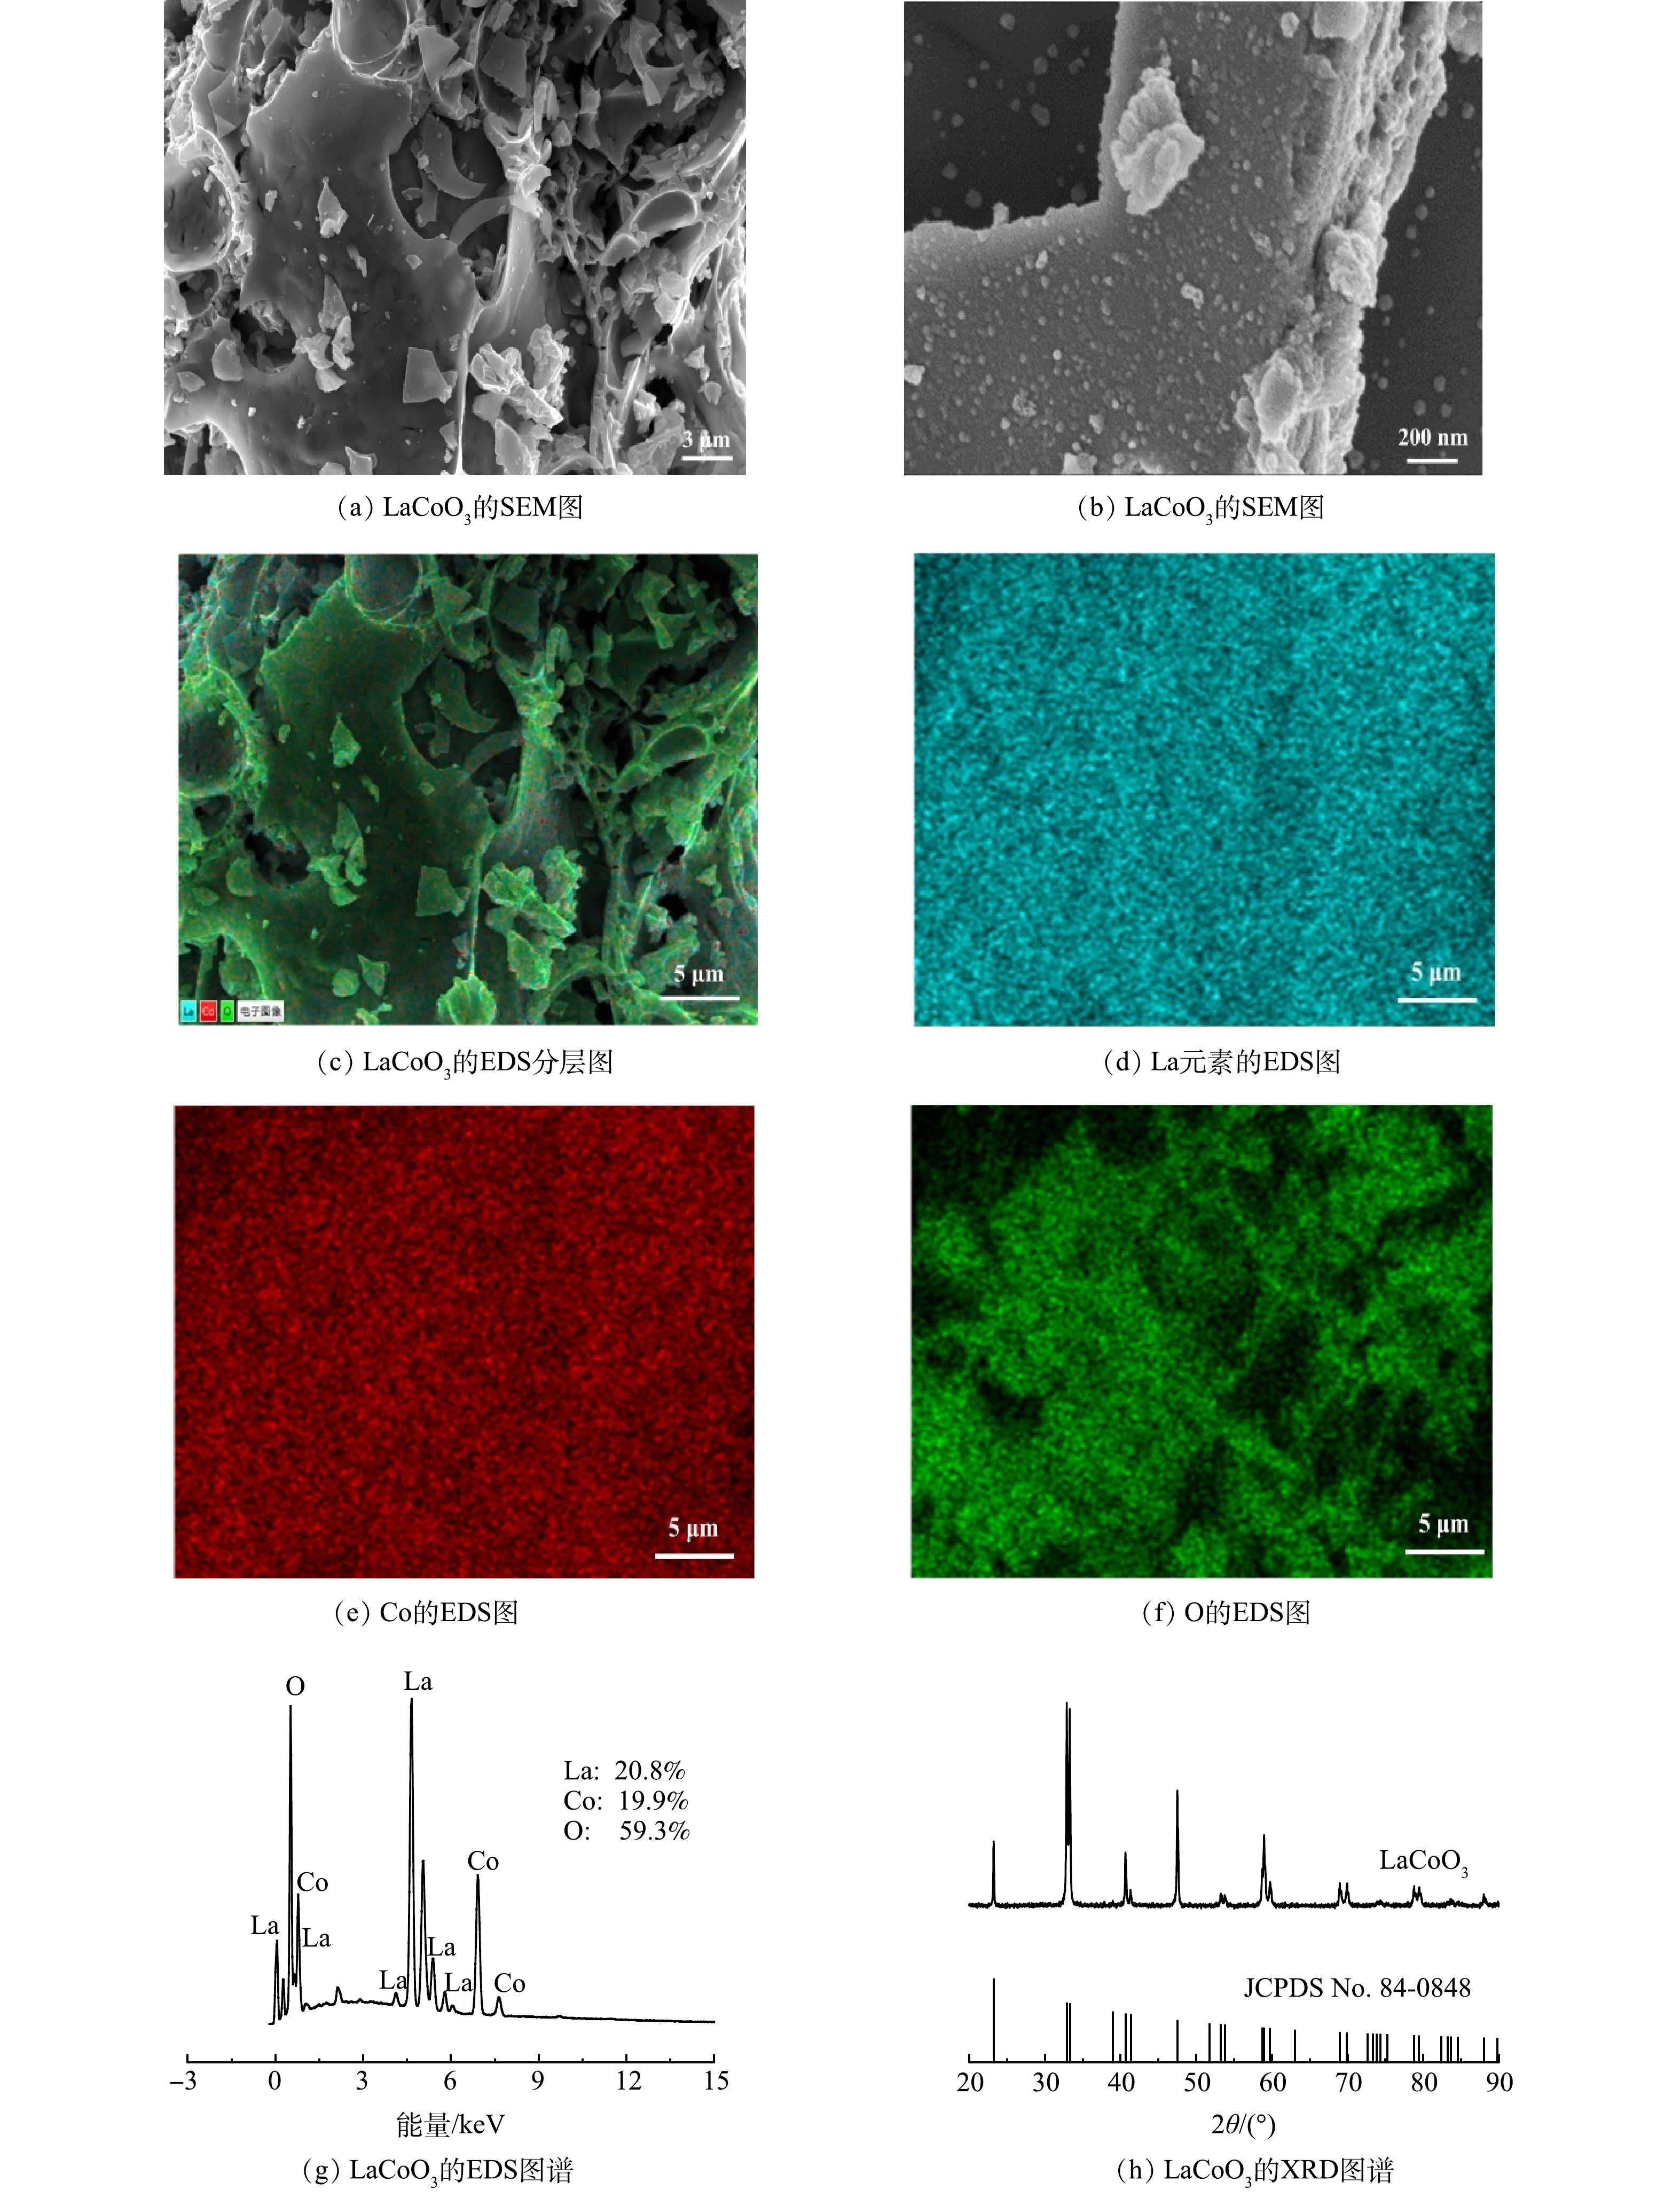
1) SEM、EDS和XRD分析。如图1(a)~(b)所示,LaCoO3具有立体块状结构,表面存在许多细颗粒,这有利于催化。为了进一步确认LaCoO3表面元素,还对其进行了元素映射分析。如图1(c)~(f)所示,La、Co和O在所选区域均匀分布,La和Co的密度低于O元素。EDS成像进一步揭示了LaCoO3表面元素由La、Co和O元素组成。如图1(g)所示,La、Co和O元素比近似为1∶1∶3,这与化学式基本一致。为了确认LaCoO3的晶体结构,进行了XRD测试。由图1(h)可以看出,样品在2θ为23.20°,32.80°,33.30°和47.50°的特征衍射峰与LaCoO3(JCPDS 84-0848)匹配。这说明催化剂具有结构良好的钙钛矿结构,除LaCoO3相外,没有形成Co3O4和La2O3等常见的氧化物杂质。
2) XPS分析。利用XPS对LaCoO3的元素和化学状态进行了研究。图2(a)为LaCoO3的全尺寸XPS能谱。此外,还利用C1s(284.80 eV)对各元素能谱进行了标定。由图2(b)可见,位于830.00~840.00 eV和847.00~857.00 eV分别对应于La3d5/2和La3d3/2。833.60、837.70、850.50和854.60 eV的峰可以归因于La(Ⅲ)[32]。钙钛矿中B位元素的价态尤为重要。如图2(c)所示,Co2p能谱由4个峰组成。Co2p3/2峰(780.6 eV)和Co2p1/2峰(795.6 eV)可归因于Co(Ⅲ),Co2p3/2峰(782.00 eV)和Co2p1/2峰(796.60 eV)则由Co(Ⅱ)产生[8]。由图2(c)中Co2p3/2的峰强度计算可知,使用前催化剂中Co(Ⅱ)和Co(Ⅲ)的含量分别为46%和54%;使用后则为40%和60%,由Co2p1/2的数据也得到相同的结果。多次使用后的催化剂的催化性能有所降低,这说明低价态Co(Ⅱ)含量与催化性能密切相关。O1s能谱的XPS能谱如图2(d)所示。钙钛矿中以528.40、529.60、530.80和532.30 eV为中心的峰分别对应晶格氧(OL)、表面氧(Os)、氧空位(Ov)和吸附的分子水[33]。本研究制备的LaCoO3使用前含有大量的OL和Ov,使用后OL和Ov的相对比例分别由19.50%和39.80%降至0.00%和27.30%。这可能是由于其参与到了Co(Ⅲ)/Co(Ⅱ)的氧化还原反应中[34],关于氧的各种形态分布与催化性能之间的关系还需要进一步深入研究。
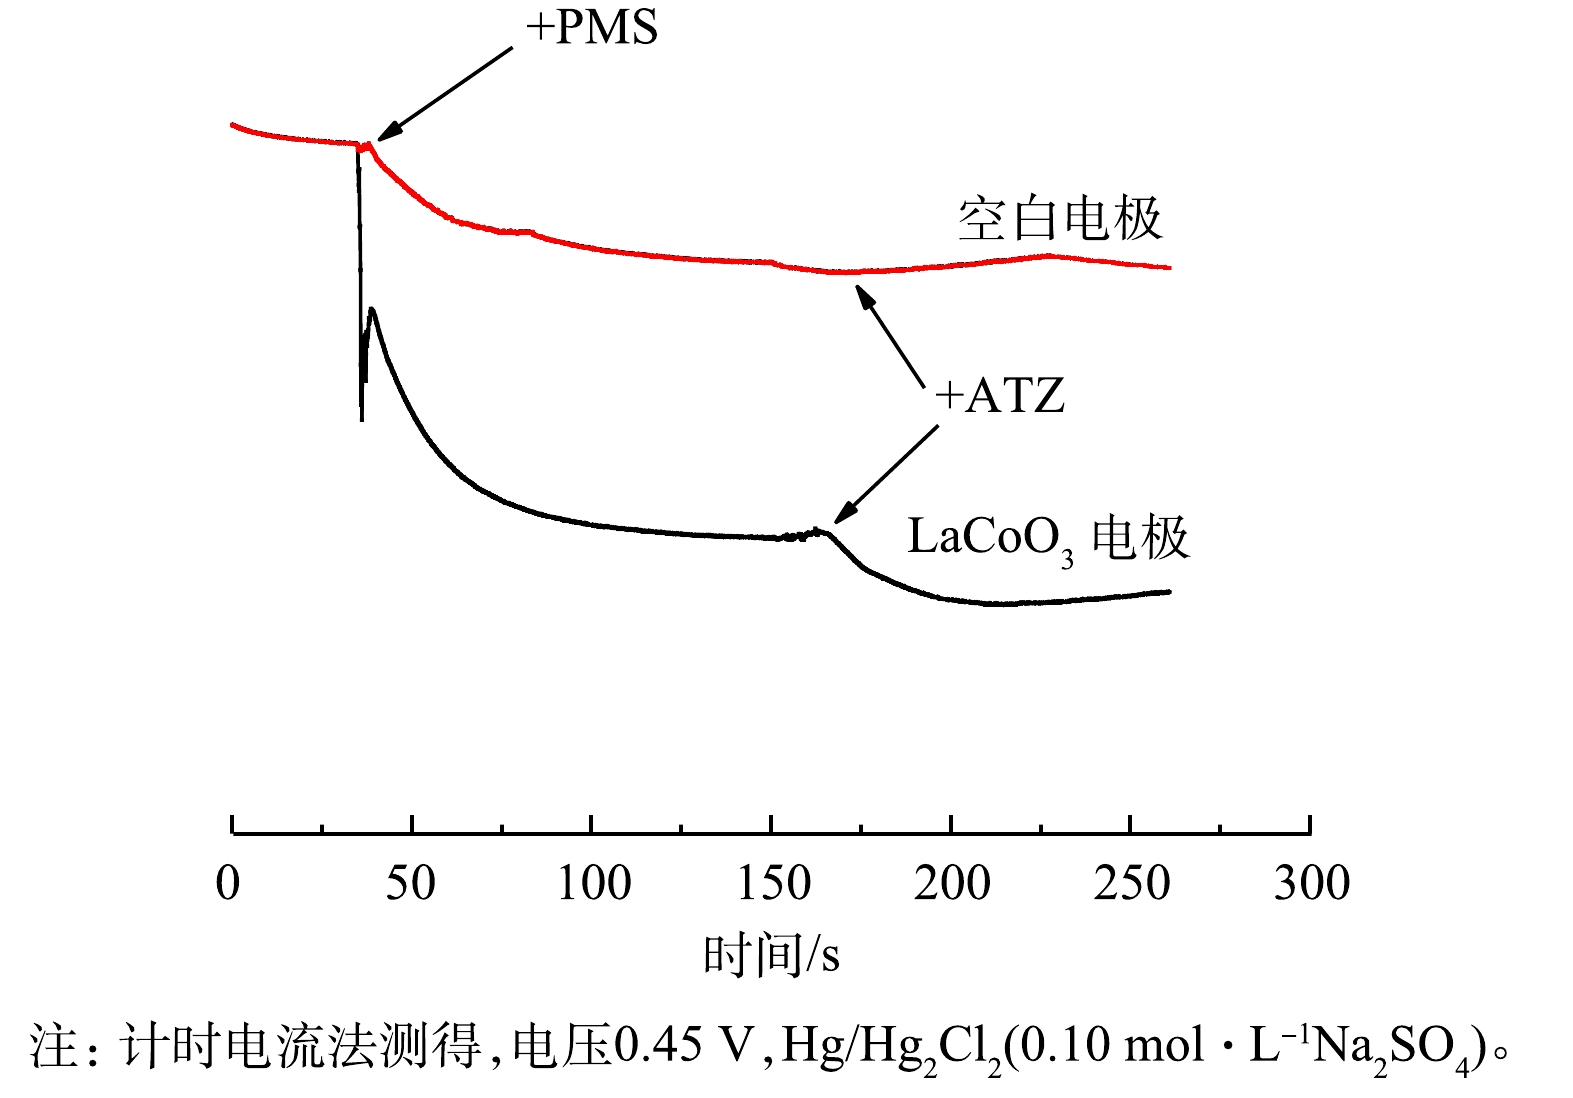
3)计时电流测定。如图3所示,添加PMS对电流输出有明显影响。这表明PMS和LaCoO3表面之间确实发生了电子转移[35]。随着ATZ的加入,电流也发生了变化,预示着LaCoO3可以有效地介导电子从ATZ转移到PMS[36-38]。相比之下,空白电极在添加PMS和ATZ后表面电流的变化很小。
2.2 不同因素对LaCoO3/PMS体系降解ATZ的影响
1)材料筛选实验。不同催化体系下ATZ的去除结果如图4(a)所示。单独的PMS几乎不能氧化ATZ。所有体系对ATZ的吸附不显著,去除率均小于5.00%。几种钙钛矿活化PMS催化氧化ATZ的效率为LaCoO3>LaCuO3>LaMnO3>LaFeO3,在10 min内,LaFeO3、LaMnO3和LaCuO3对ATZ的去除率分别为7.00%、17.00%和73.00%,而LaCoO3活化PMS后对ATZ的去除率几乎为100.00%,相应的速率常数分别为0.005、0.011、0.070和0.129 min−1。显然,B位元素对LaBO3的催化性能有重大影响。此外,考虑到使用过程中钴元素会浸出,还制备了2种核壳结构催化剂。但初步研究结果(图4(a))表明,在使用2种核壳结构催化剂的情况下,反应速率常数由LaCoO3的0.129 min−1降到0.037 min−1和0.041 min−1。这表明外围的壳抑制了核的催化性能,还需要深入研究。本文后续研究选择LaCoO3作为催化剂。
2) ATZ初始质量浓度对LaCoO3/PMS体系降解效果的影响。如图4(b)所示,所有选定质量浓度均在10 min内有效降解,在前2 min内快速衰减,当ATZ初始质量浓度由2.50 mg·L−1增加到10.00 mg·L−1时,相应的降解速率常数由1.210 min−1降至0.728 min−1。原因可能是在相同条件下,固定的催化剂用量和PMS质量浓度所产生的自由基总量是恒定的,无法在特定时间内将高质量浓度的ATZ完全降解。结果表明,ATZ的降解速率常数发生了变化。分析可能的原因为:ROS与ATZ及其中间产物之间均可能发生反应,在活性氧总量一致的情况下,ATZ质量浓度越高,催化剂表面新生成的中间产物质量浓度也越高,阻碍了ATZ向催化剂表面的传质,催化剂表面ATZ质量浓度下降,表观速率常数降低。因此,选择10.00 mg·L−1为后续实验初始质量浓度。
3) PMS投加量对LaCoO3/PMS体系降解ATZ的影响。如图4(c)所示,随着PMS浓度的增加,ATZ的降解速率迅速增加。因为PMS质量浓度越高,可以增强与催化剂的接触,从而产生更多的活性氧。当PMS质量浓度由0.320 g·L−1增加到0.512 g·L−1时,速率常数反而略有降低。这可能是因为过量的SO4·−会发生自淬灭[39]。综合考虑后续研究选择0.256 g·L−1作为PMS的质量浓度。
4)催化剂用量对LaCoO3/PMS体系降解ATZ的影响。如图4(d)所示,在不添加催化剂的情况下,10 min内PMS降解ATZ的速率常数仅为0.004 min−1;催化剂用量为0.05 g·L−1时,速率常数提高到0.088 min−1,说明LaCoO3能有效催化PMS降解ATZ;催化剂用量为0.15 g·L−1时,速率常数增加到0.129 min−1。主要原因是随着催化剂用量的增加,催化剂表面的活性位点增多,催化PMS的能力增强,从而产生更多的ROS以降解污染物[40]。因此,后续研究中选择0.15 g·L−1作为催化剂用量。
5) pH对LaCoO3/PMS体系降解ATZ的影响。由图4(e)可见,当pH为3.00~5.42时,去除率随初始pH的增加而增加。当pH升高到11.00时,速率常数由0.129 min−1下降到0.003 min−1,pH=5.42为最佳条件。PMS的形式主要取决于溶液的pH及其pKa2(pKa2=9.40)。在酸性和中性条件下,主要存在形式为HSO5−[12],SO4·−或HSO5−与OH−/H2O反应生成HO·,SO4·−和HO·的存在可获得较高的ATZ去除率。PMS在酸性条件下比中性或碱性条件下更稳定,导致活化相对较慢。此外,H+还消耗了一定量的SO4·−和HO·,导致这2种自由基的不必要消耗[27]。以上原因共同导致了ATZ降解率的下降。当pH>9.00时,PMS的主要存在形式转化为SO52−[10]。此外,SO52−的催化活性低于HSO5−,在pH>10.00时,催化剂表面会形成氢氧化钴,限制了ATZ的降解,降低了催化剂的催化活性[41]。
6)催化剂的稳定性。如图4(f)所示,在前2次重复实验中,ATZ的去除率变化不明显;经第3次使用后,性能稍有下降,10.00 min后速率常数由0.129 min−1降到0.100 min−1,第5次后降至0.087 min−1。这可能是由于LaCoO3使用过程中表面结构和活性中心发生了变化。采用ICP-MS检测从LaCoO3/PMS中浸出La和Co元素质量浓度,反应60 min后La元素浸出质量浓度为5.72 mg·L−1,Co元素浸出质量浓度为0.85 mg·L−1,催化剂具有一定的稳定性。
2.3 共存阴离子对LaCoO3/PMS体系降解ATZ的影响
1) NO3−对LaCoO3/PMS体系降解ATZ的影响。如图5(a)所示,NO3−轻微抑制ATZ的降解。这是因为NO3−不会引起溶液pH的变化,对氧化剂的稳定性没有影响;其次,NO3−对催化剂的催化活性也没有影响[42]。但NO3−可以与HO·和SO4·−反应形成氧化能力较弱的硝酸根自由基(NO3·−),如式(1)和式(2)所示[42-43]。
NO−3+SO4⋅−↔SO2−4+NO3⋅−k=2.10×10²L⋅(mol⋅s)−1 (1) NO−3+HO⋅↔OH−+NO3⋅−k<5.00×10⁵L⋅(mol⋅s)−1 (2) 2) SO42−对LaCoO3/PMS体系降解ATZ的影响。SO42−对ATZ的降解比NO3−表现出更为轻微抑制作用。这是因为与NO3−一样,SO42−不会改变溶液的pH,对催化剂的催化活性也没有影响。其次SO42−是惰性离子,不会与HO·和SO4·−反应[44]。
3) Cl−对LaCoO3/PMS体系降解ATZ的影响。如图5(c)所示,当Cl−浓度从1.00 mmol·L−1增加到20.00 mmol·L−1时,对ATZ的降解呈现出先抑制后促进的现象,低浓度的Cl−(<10.00 mmol·L−1)抑制降解,而高浓度的Cl−(>10.00 mmol·L−1)可促进降解。这可能是由于较低浓度的Cl−会优先与SO4·−反应,而产生活性更小的Cl·,从而减弱了ATZ的降解;当Cl−浓度进一步增大,Cl−通过双电子转移直接与PMS反应产生活性氯(即Cl·、Cl2·−和Cl2,
E0Cl· E0cl2·− E0Cl2 4) HCO3−对LaCoO3/PMS体系降解ATZ的影响。如图5(d)所示,HCO3−浓度从1.00 mmol·L−1增加到20.00 mmol·L−1时,速率常数从0.015 min−1降至0.005 min−1。这是因为HCO3−可以改变溶液的pH,会影响PMS的稳定性。此外,pH的变化也会影响催化剂的表面电荷,从而影响其催化性能。最后,HCO3−还会与SO4·−和HO·反应生成氧化能力较弱的活性物种(式(3)~式(4))[47-49]。
HCO−3+SO4⋅−↔SO2−4+HCO3⋅−k=9.1×10⁶L⋅(mol⋅s)−1 (3) HCO−3+HO⋅↔OH−+HCO3⋅−k=8.5×10⁶L⋅(mol⋅s)−1 (4) 5) H2PO4−对LaCoO3/PMS体系降解ATZ的影响。如图5(e)所示,添加1 mmol·L−1 H2PO4−后,ATZ的降解速率常数由0.129 min−1降至0.047 min−1。H2PO4−浓度由1.00 mmol·L−1增加到20.00 mmol·L−1时,速率常数由0.047 min−1降至0.034 min−1。这是由于H2PO4−可以改变溶液的pH,这会进一步影响PMS的稳定性和催化剂的催化活性。此外,H2PO4−与催化剂表面的活性位点具有较强的络合能力。有研究表明,H2PO4−可以在零价铁表面[50]、氧化铈纳米颗粒表面形成络合从而影响催化剂的催化活性[51]。此外,H2PO4−可以淬灭HO·和SO4·−(式(5)~式(6))[42,49]。
H2PO−4+SO4⋅−↔SO2−4+H2PO4⋅−k=7×10⁶L⋅(mol⋅s)−1 (5) H2PO−4+HO⋅↔OH−+H2PO4⋅−k=8×10⁵L⋅(mol⋅s)−1 (6) 2.4 天然有机物和实验用水对LaCoO3/PMS体系降解ATZ的影响
天然有机物(NOM)在地表水中普遍存在,含有丰富的官能团(羧基、酚羟基和醇基等),这些基团可与催化剂上的活性中心和有机污染物相互作用,从而影响ATZ的去除[52]。本研究以腐植酸(HA)作为典型的NOM,考察了反应体系对ATZ去除的影响,结果图6(a)所示。微量的HA的抑制作用较弱,当HA投加量为100 mg·L−1时,ATZ的速率常数降低到0.092 min−1。这是因为带负电荷的HA在水中会与催化剂表面的金属活性中心螯合,阻碍活性中心的暴露,抑制催化。事实上,天然水体中的HA含量相对较低,微量的HA对反应体系影响较小。此外,ATZ溶液配制用水也会对催化效果产生极大影响。如图6(b)所示,在自来水和地表水中,LaCoO3/PMS对ATZ的去除速率常数分别降至0.082 min−1和0.005 min−1。这说明LaCoO3/PMS体系受实验用水中共存离子和其他成分的影响较大。
2.5 反应机理
通过淬灭实验,测定了LaCoO3/PMS体系中产生或存在的自由基。甲醇(MeOH)是有效的SO4·−和HO·淬灭剂(
kso4⋅− kHO⋅ kHO⋅ kso4⋅− 本研究中使用L-组氨酸淬灭单线态氧(1O2,0.15 V)。结果表明,加入1 mmol·L−1的L-组氨酸便终止了反应的进行。这是由于L-组氨酸会可以快速消除PMS[54]。为了排除PMS质量浓度降低对ATZ去除的影响,通过一系列实验验证1O2是否为主要活性物质。如图4(c)所示,当PMS质量浓度进一步增加到0.384 g·L−1时,ATZ的去除速率常数没有显着变化。这表明过量的PMS不能被有限的LaCoO3催化剂完全活化。因此,通过在反应体系中加入1 mmol·L−1L-组氨酸来测试0.384 g·L−1 PMS的消耗,发现消耗了44%PMS,这表明系统中仍然存在56% PMS。然而,在本研究中,L-组氨酸的抑制作用仍然显著(Kobs下降到0.022 min−1),并且体系中残留的PMS超过0.124 g·L−1。这表明LaCoO3活化剩余的PMS产生的1O2被淬灭,从而削弱了降解效果,因此,1O2是LaCoO3/PMS 系统中的主要活性物质。
对苯醌(p-BQ)常用来淬灭O2·−(
ko2⋅− kHO· 为了进一步验证上述推论,对LaCoO3/PMS系统中可能生成的ROS进行电子顺磁共振(EPR)测试分析。如图8所示,在捕获剂/PMS系统中无法识别出明显的自由基信号。说明PMS自身不能产生ROS。如图8(a)所示,加入LaCoO3后,分别在系统中观察到DMPO-HO·和DMPO-SO4·−加合物的特征峰。这表明生成了SO4·−和HO·。此外,信号比为1:1:1的TEMP-1O2加合物的三重特征峰也被清晰地观察到,表明1O2参与了催化过程。然而,随着LaCoO3的引入,并没有观察到DMPO-O2·−加合物信号,这意味着在LaCoO3/PMS系统中O2·−可以忽略不计。综上所述,推测LaCoO3/PMS体系中存在SO4·−、HO·和1O2,且SO4·−和1O2优先于HO·与ATZ反应。
基于以上结果,LaCoO3/PMS体系中存在自由基氧化和非自由基氧化过程。在自由基氧化过程中,通常Co(Ⅱ)是PMS催化产生SO4·−和HO·的主要活性位点[58](式(7)~式(9))。另外,LaCoO3中的晶格氧(OL)可提供电子生成SO4·−[58](式(10))。在非自由基反应过程中,Co(Ⅱ)作为主要吸附位点,可与SO5·−反应生成1O2(式(11)),OL也可随着Co(Ⅱ)和Co(Ⅲ)的还原而转化为1O2(式(12))[59-60]。另外,SO5·−由于反应速率高而催化能低,易发生自反应,导致1O2的产生(式(13)~式(14))[61]。LaCoO3上丰富的氧空位更容易吸附PMS从而自分解,促进1O2的析出[62](式(15)~式(16))。此外,氧空位的存在也为B位金属阳离子的氧化还原循环的实现提供了连接,从而提高了催化稳定性[20,58]。综上所述,LaCoO3优异的催化性能主要是由于氧空位、表面Co(Ⅱ)位点和晶格氧的存在,产生了大量的ROS (式(17))所致。
Co(Ⅱ)+HSO−5↔Co(Ⅲ)+SO4⋅−+OH− (7) Co(Ⅲ)+HSO−5↔SO5⋅−+Co(Ⅱ)+H+ (8) SO4⋅−+H2O↔SO2−4+H++HO⋅ (9) SO5⋅−+OL↔SO4⋅−+O2 (10) Co(Ⅱ)+SO5⋅−↔Co(Ⅲ)+1O2+SO2−4 (11) Co(Ⅲ)+2O2−L↔Co(Ⅱ)+1O2+3e− (12) HSO−5↔SO5⋅−+H++e− (13) 2SO5⋅−↔1O2+S2O2−8 (14) HSO−5+HSO−5↔OV↔HSO−6+HSO−4 (15) HSO−6↔HSO−4+1O2 (16) SO4⋅−,1O2,HO⋅+ATZ↔中间体↔CO2+H2O+SO2−4 (17) 3. 结论
1)在最佳条件下(ATZ=10.00 mg·L−1,LaCoO3= 0.15 g·L−1,PMS=0.256 g·L−1,初始pH=5.42),ATZ可在10.00 min内快速被完全降解。经过5次循环实验,ATZ的去除率在可接受范围内,反应60 min后Co元素浸出质量浓度为0.85 mg·L−1。
2) SO42−和NO3−轻微抑制LaCoO3活化PMS降解ATZ,高浓度的Cl−促进了降解,H2PO4−、HCO3−和低浓度的Cl−及天然有机物HA抑制了降解。
3) LaCoO3具有立体的块状组织结构,表面存在许多细颗粒原点;LaCoO3含有大量的氧空位,表面Co(Ⅱ)位点、氧空位和晶格氧在反应中起到了重要作用;在LaCoO3/PMS体系存在电子转移过程。
4) LaCoO3/PMS体系中存在SO4·−、HO·和1O2,且SO4·−和1O2优先于HO·与ATZ反应。
-
表 1 17种PMOCs的LC-MS/MS优化参数
Table 1. The details of LC-MS/MS operating parameters of 17 PMOCs
化合物 出峰时间/min 母离子 (m/z) 定量离子 (m/z) Q1/V CE/V Q3/V BDMA 2.548 135.70 90.90/65.00/38.95 −30 −25/-35/-54 −30/-25/-15 DTG 2.134 239.70 132.95/107.95/106.10 −30 −21/-22/-30 −14/-21/-19 TCPP 7.152 328.60 99.00/174.85/252.95 −23 −23/-13/-9 −19/-19/-29 DPG 2.145 211.60 119.00/76.95/94.00 −29 −22/-40/-21 −22/-28/-18 AMANT 2.294 151.70 135.05/78.9/77.00 −30 −18/-35/-44 −26/-28/-29 BETMA 2.293 150.90 92.05/91.00/65.10 −30 −21/-22/-38 −17/-17/-24 CAP 2.592 111.10 79.95/95.85/81.00 12 22/23/20 30/17/29 MTSC 3.421 111.90 80.05/95.90/80.90 11 22/24/19 30/17/29 PEA 1.464 111.10 79.95/96.00/81.00 11 23/23/19 30/17/30 MBSA 2.053 169.80 106.05/63.85/79.00 18 16/46/27 18/23/30 MS 3.483 111.10 79.95/96.00/81.00 12 24/23/20 30/17/28 ACE 1.488 162.00 82.00/78.05/40.00 11 13/29/28 30/30/14 XSA 1.638 185.20 80.00/121.10/118.85 12 30/22/25 30/22/21 SAC 1.499 182.00 41.90/105.85/62.00 20 36/21/23 14/19/25 AMPSA 1.504 206.00 135.00/79.95/70.00 14 22/29/25 25/30/26 TFMSA 1.987 149.00 79.90/98.80/68.90 16 23/23/31 30/17/27 BPS 2.948 249.00 107.95/92.00/155.90 17 30/36/20 20/30/16 表 2 17种PMOCs的回收率、相对标准偏差、线性相关系数及检测限
Table 2. Recovery rate, RSD, correlation coefficients, detection limit of 17 PMOCs
化合物 回收率/% RSD/% 相关系数R2 检出限/(ng·L-1) 定量限/(ng·L-1) BDMA 87.49 4.8 0.998 0.09 0.29 DTG 98.65 8.8 0.999 0.08 0.27 TCPP 80.21 7.1 0.996 0.13 0.43 DPG 98.24 6.1 0.998 0.21 0.69 AMANT 85.32 3.6 0.995 0.12 0.39 BETMA 76.98 8.7 0.999 0.18 0.59 CAP 65.05 5.1 0.995 0.04 0.13 MTSC 74.40 4.9 0.998 0.12 0.39 PEA 94.10 7.5 0.998 0.15 0.49 MBSA 76.73 6.2 0.994 0.31 1.02 MS 65.01 6.1 0.995 0.11 0.36 ACE 86.58 5.4 0.998 0.26 0.86 XSA 89.50 5.6 0.993 0.35 1.16 SAC 83.21 7.6 0.996 0.24 0.79 AMPSA 85.21 8.9 0.995 0.33 1.09 TFMSA 82.99 7.7 0.998 0.17 0.56 BPS 76.12 3.6 0.996 0.16 0.53 表 3 平水期17种PMOCs在10个采样点中的质量浓度
Table 3. Mass concentrations of 17 kinds of PMOCs in 10 sampling points in flat water period
化合物 地表水质量浓度 /(ng·L−1) 地下水质量浓度 /(ng·L−1) S1 S2 S3 S4 S5 1# 2# 3# 4# 5# BDMA 23.32 11.22 41.03 22.64 23.44 6.97 7.84 14.56 22.46 5.16 DTG 34.56 12.81 31.27 8.19 6.76 2.57 1.65 ND 6.31 5.22 TCPP 143.34 28.77 21.47 17.64 64.64 21.71 31.47 35.85 109.69 45.61 DPG 68.79 113.62 1.70 32.42 61.22 31.79 ND 95.11 36.72 2.98 AMANT 143.84 64.69 111.17 68.97 45.66 25.33 81.70 60.46 70.58 68.84 BETMA 48.82 30.71 18.15 62.59 33.02 9.67 16.11 8.08 28.53 11.88 CAP 101.82 61.26 81.11 36.56 73.27 47.36 39.68 39.58 51.76 46.16 MTSC 64.88 13.41 46.99 33.11 60.55 60.49 59.75 45.66 19.99 55.51 PEA 28.11 52.84 7.41 17.89 45.43 27.34 14.99 11.61 28.17 6.66 MBSA 30.56 6.98 80.56 12.43 14.69 33.36 40.12 28.64 10.82 29.99 MS 69.75 88.29 10.35 87.57 64.73 38.49 27.86 13.49 24.55 17.97 ACE 261.75 137.13 89.38 113.13 69.94 50.24 73.87 32.29 59.74 168.11 XSA 79.45 23.09 35.31 14.29 34.59 33.51 39.81 36.64 7.05 65.09 SAC 63.71 57.21 53.48 14.38 9.60 7.45 4.4 ND 6.02 6.63 AMPSA 25.36 24.08 63.29 100.48 79.66 20.59 20.59 12.90 15.10 52.32 TFMSA 10.29 14.35 3.16 14.26 18.65 74.65 20.66 11.62 10.36 21.24 BPS 33.41 20.52 28.63 26.36 2.06 11.91 11.49 ND 35.76 32.53 ƩPMOCs 1 231.76 760.94 724.47 682.91 707.91 503.43 491.99 446.49 543.61 641.91 注:ND表示未检出。 表 4 丰水期17种PMOCs在10个采样点中的质量浓度
Table 4. Mass concentrations of 17 kinds of PMOCs in 10 sampling points in abundant water period
化合物 地表水质量浓度/(ng·L−1) 地下水质量浓度/(ng·L−1) S1 S2 S3 S4 S5 1# 2# 3# 4# 5# BDMA 71.23 13.81 22.81 11.77 29.83 32.87 14.07 9.26 34.12 14.96 DTG 17.10 3.29 24.43 6.97 13.67 1.71 1.13 ND 24.65 12.34 TCPP 68.94 36.69 23.82 118.8 8.16 84.53 14.93 12.56 10.61 20.26 DPG 45.91 43.93 91.85 79.25 49.49 15.88 33.27 15.18 11.94 24.58 AMANT 83.84 71.14 13.37 102.18 69.88 22.41 37.23 28.22 26.05 34.21 BETMA 17.42 3.94 11.64 15.80 26.45 23.93 5.39 19.09 25.61 49.03 CAP 153.71 49.94 52.43 61.60 72.01 73.35 57.15 19.38 73.88 101.14 MTSC 23.55 27.84 30.13 22.55 20.07 30.75 22.68 37.84 60.30 19.87 PEA 17.42 10.26 7.52 11.43 9.77 6.24 10.57 3.52 23.25 23.30 MBSA 15.56 48.11 25.82 42.79 18.76 33.42 22.41 38.5 15.08 26.86 MS 79.77 20.65 ND 3.77 13.53 38.69 12.79 71.97 32.11 20.62 ACE 128.72 59.78 98.09 63.61 135.94 46.32 54.75 25.61 42.41 73.37 XSA 77.48 3.25 44.16 3.61 7.72 34.16 30.9 ND 18.65 8.19 SAC 15.46 6.82 12.94 24.16 19.16 4.02 1.76 ND 6.53 2.26 AMPSA 48.70 18.23 52.42 31.02 19.93 13.79 54.72 16.08 36.42 10.20 TFMSA 17.09 9.21 8.26 11.97 9.44 7.43 11.48 3.11 14.55 20.74 BPS 13.13 33.68 3.31 9.82 ND 2.49 19.68 10.81 1.41 2.17 ƩPMOCs 895.03 460.57 522.95 621.08 523.81 471.99 404.91 311.12 457.56 464.11 注:ND表示未检出。 表 5 北江中PMOCs在10个采样点中的质量浓度
Table 5. Mass concentrations of 17 kinds of PMOCs in 10 sampling points in the Beijiang River
ng·L−1 化合物 B01 B02 B03 B04 B05 B06 B07 B08 B09 B10 BDMA 60.65 81.75 52.21 105.47 44.18 60.49 31.53 54.76 20.91 39.72 DTG 21.43 38.15 21.69 17.51 11.97 7.97 9.19 4.19 17.72 7.73 TCPP 444.46 120.06 37.87 57.93 152.75 27.73 17.76 43.50 25.20 72.15 DPG 10.58 23.42 18.97 114.19 3.36 17.87 1.65 31.81 51.42 7.72 AMANT 55.81 25.93 10.42 16.22 10.81 44.99 18.80 36.07 48.21 14.26 BETMA 23.99 79.06 69.55 78.31 27.46 78.42 32.29 30.34 62.82 53.16 CAP 79.44 99.71 96.62 198.76 47.09 41.68 57.76 49.69 64.96 78.87 MTSC 64.84 46.47 31.28 21.37 36.35 30.78 25.32 29.07 43.82 33.06 PEA 6.16 7.37 5.09 7.42 4.23 5.92 7.53 5.96 27.36 8.35 MBSA 38.13 10.63 28.44 18.10 47.27 10.27 9.46 32.28 10.16 8.45 MS 17.16 28.96 18.74 7.48 13.68 20.90 13.15 12.25 26.36 17.62 ACE 433.14 134.13 127.47 26.50 217.85 99.06 270.24 123.51 233.37 60.49 XSA 130.85 38.70 33.05 26.76 20.93 84.65 27.15 24.41 29.34 23.86 SAC 31.70 22.65 15.90 13.74 14.09 6.19 5.65 7.32 9.35 4.54 AMPSA 20.47 18.34 41.14 27.86 35.04 34.71 29.25 58.86 111.40 64.94 TFMSA 36.09 17.65 4.62 16.71 5.14 16.41 6.73 25.37 24.74 7.14 BPS 1.31 1.28 3.41 6.65 2.09 0.83 1.16 0.93 27.59 1.72 ƩPMOCs 1 476.21 794.26 616.47 760.98 694.29 588.87 564.62 570.32 834.73 503.78 注:ND表示未检出。 表 6 滹沱河中PMOCs在10个采样点中的质量浓度
Table 6. Mass concentrations of 17 kinds of PMOCs in 10 sampling points in the Hutuo River
ng·L−1 化合物 H01 H02 H03 H04 H05 H06 H07 H08 H09 H10 BDMA 11.19 24.74 71.31 31.78 60.38 77.03 28.32 38.08 52.41 35.06 DTG 0.95 1.52 1.27 3.13 13.40 24.80 49.03 3.85 4.84 9.29 TCPP 19.27 222.60 11.82 21.12 77.13 43.66 70.52 20.44 30.51 20.53 DPG 2.04 3.46 47.20 8.18 35.09 14.07 22.06 22.92 94.93 29.86 AMANT 4.36 11.63 14.15 9.72 140.59 218.10 171.78 24.64 69.36 13.86 BETMA 8.07 19.18 9.48 3.84 14.78 54.57 87.63 2.28 159.80 31.46 CAP 73.88 14.33 89.86 141.14 43.80 38.76 53.71 46.21 60.41 73.35 MTSC 17.89 10.28 6.51 4.78 11.59 9.95 23.37 11.08 5.48 2.54 PEA 4.44 9.84 8.93 7.16 11.81 6.83 7.48 4.86 4.05 3.69 MBSA 16.19 19.55 63.20 29.95 4.04 16.76 25.10 89.73 63.49 51.13 MS 2.08 39.42 32.02 33.96 13.87 9.19 24.23 40.88 48.69 18.46 ACE 61.97 6.46 51.61 18.33 86.07 241.16 20.50 24.68 6.89 9.67 XSA 12.67 2.56 5.11 7.24 10.88 43.09 37.60 3.64 6.28 11.35 SAC ND 9.13 1.05 3.93 22.44 2.43 6.13 0.73 0.88 1.18 AMPSA 26.04 55.74 40.45 26.16 41.12 11.33 35.13 17.37 54.92 60.66 TFMSA 3.09 9.19 8.03 6.26 10.21 6.26 6.94 4.06 3.48 3.76 BPS ND 1.16 1.05 1.14 5.35 6.12 4.46 1.31 4.23 1.36 ƩPMOCs 264.13 460.79 463.05 357.82 602.55 824.11 673.99 356.76 670.65 377.21 注:ND表示未检出。 -
[1] ARP H P, BEOWN T N, BEREGER U, et al. Ranking REACH registered neutral, ionizable and ionic organic chemicals based on their aquatic persistency and mobility[J]. Environmental Science:Processes & Impacts, 2017, 19(7): 939-955. [2] 刘艺, 于洋, 金彪, 等. 持久、迁移性有机污染物的水污染现状、分析检测方法和去除技术[J]. 地球化学, 2021, 50(3): 305-316. [3] 王薛平, 黄星, 毕春娟, 等. 滴水湖及其环湖水系沉积物、土壤中多氯联苯的空间分布特征及风险评价[J]. 环境科学, 2016, 37(6): 2121-2130. [4] 罗淑文, 刘兴泉, 吴峰华, 等. 有机氯农药污染现状及检测技术研究进展[J]. 农业工程技术, 2022, 42(26): 84-87. [5] 王宏, 杨霓云, 闫振广, 等. 我国持久性、生物累积性和毒性(PBT)化学物质评价研究[J]. 环境工程技术学报, 2011, 1(5): 414-419. [6] HOLOUBEK I, KOCAN A, HOLOUBKOVA I, et al. Persistent, bioaccumulative, and toxic compounds in Central and Eastern Europe–Hot spots[J]. Arhiv za higijenu rada i toksikologiju, 2001, 52(2): 239-251. [7] REEMTSMA T, BERGER U, ARP H P, et al. Mind the gap: persistent and mobile organic compounds water contaminants that slip through[J]. Environmental Science & Technology, 2016, 50(19): 10308-10315. [8] 刘茵. 气相色谱法测定N-乙烯基己内酰胺中己内酰胺残留量[J]. 化学工程与装备, 2011(2): 148-149. [9] 许丰. 毛细管气相色谱法测定硫酸金刚烷胺注射液的含量[J]. 安徽医学, 2013, 34(10): 1526-1528. doi: 10.3969/j.issn.1000-0399.2013.10.038 [10] MONTES R, AGUIRRE J, VIDAL X, et al. Screening for polar chemicals in water by trifunctional mixed-mode liquid chromatography–high resolution mass spectrometry[J]. Environmental Science & Technology, 2017, 51(11): 6250-6259. [11] 乐浩鸣, 梁泉, 卢银兵, 等. HPLC-MS-MS法快速筛查4种常见强极性除草剂[J]. 中国法医学杂志, 2022, 37(1): 65-68. doi: 10.13618/j.issn.1001-5728.2022.01.014 [12] SCHULZE S, STTLER D, NEUMANN M, et al. Using REACH registration data to rank the environmental emission potential of persistent and mobile organic chemicals[J]. Science of the Total Environment, 2018, 625(1): 1122-1128. [13] NEUWALD I, MUSCHKET M, ZAHN D, et al. Filling the knowledge gap: A suspect screening study for 1310 potentially persistent and mobile chemicals with SFC- and HILIC-HRMS in two German river systems[J]. Water Research, 2021, 204: 117645. doi: 10.1016/j.watres.2021.117645 [14] 中华人民共和国国家环境保护总局. 地表水和污水监测技术规范: HJ/T 91-2002[S]. 北京: 中国环境出版社, 2003 [15] 中华人民共和国生态环境部. 地下水环境监测技术规范: HJ 164-2020[S]. 北京: 中国环境出版社, 2021. [16] 韩超, 梁存珍, 高欲乾, 等. 水体中27种有机磷阻燃剂(OPFRs)的检测及风险评价[J]. 环境工程学报, 2022, 16(5): 1737-1747. [17] 陈玫宏, 徐怀洲, 宋宁慧, 等. 高效液相色谱-串联质谱法同时测定水体和沉积物中12种有机磷酸酯类化合物[J]. 分析化学, 2017, 45(7): 987-995. [18] HUNTSCHA S, SINGER H P, MCARDELL C S, et al. Multiresidue analysis of 88 polar organic micropollutants in ground, surface and wastewater using online mixed-bed multilayer solid-phase extraction coupled to high performance liquid chromatography–tandem mass spectrometry[J]. Journal of Chromatography A, 2012, 1268: 74-83. doi: 10.1016/j.chroma.2012.10.032 [19] ANGELES L F, AGA D S. Catching the elusive persistent and mobile organic compounds: novel sample preparation and advanced analytical techniques[J]. Trends in Environmental Analytical Chemistry, 2020, 25: e00078. doi: 10.1016/j.teac.2019.e00078 [20] DIAS N C, POOLE C F. Mechanistic study of the sorption properties of OASIS® HLB and its use in solid-phase extraction[J]. Chromatographia, 2002, 56(5): 269-275. [21] BOULARD L, DIERKES G, TERNES T. Utilization of large volume zwitterionic hydrophilic interaction liquid chromatography for the analysis of polar pharmaceuticals in aqueous environmental samples: benefits and limitations[J]. Journal of Chromatography A, 2018, 1535: 27-43. doi: 10.1016/j.chroma.2017.12.023 [22] MONTES R, RODIL R, CELA R, et al. Determination of persistent and mobile organic contaminants (PMOCs) in water by mixed-mode liquid chromatography–tandem mass spectrometry[J]. Analytical chemistry, 2019, 91(8): 5176-5183. doi: 10.1021/acs.analchem.8b05792 [23] 干志伟, 孙红文, 王若男, 等. 固相萃取-离子对液相色谱-质谱法检测水环境中7种人工甜味剂[C]. 持久性有机污染物论坛2012暨第七届持久性有机污染物全国学术研讨会论文集. 2012: 3. [24] 桂建业, 孙威, 张辰凌, 等. 离子色谱-串联质谱法分析环境水体中痕量人工甜味剂[J]. 分析化学, 2016, 44(03): 361-366. [25] SCHEURER M, STORCK F R, BRAUCH H J, et al. Performance of conventional multi-barrier drinking water treatment plants for the removal of four artificial sweeteners[J]. Water research, 2010, 44(12): 3573-3584. doi: 10.1016/j.watres.2010.04.005 [26] MOHLE E, METZGER J W. Drugs in municipal sewage effluents: screening and biodegradation studies[M]. ACS Publications, 2001: 192-205. [27] 赵军强, 韩典峰, 田秀慧, 等. 食品中金刚烷胺的危害, 检测方法和残留风险研究进展[J]. 中国渔业质量与标准, 2022, 12(3): 64-71. [28] 朱丽波, 徐能斌, 冯加永, 等. 双柱串联-超高效液相色谱-质谱法检测水中的4种胺类物质[J]. 分析化学, 2013, 41(4): 594-597. [29] VEEN I V D, BOER J D. Phosphorus flame retardants: Properties, production, environmental occurrence, toxicity and analysis[J]. Chemosphere, 2012, 88(10): 1119-1153. doi: 10.1016/j.chemosphere.2012.03.067 [30] LI J, LU J, XIANG L, et al. Adsorption and aerobic biodegradation of four selected endocrine disrupting chemicals in soil–water system[J]. International Biodeterioration & Biodegradation, 2013, 76(1): 3-7. [31] YING G G, KOOKANA R S. Sorption and degradation of estrogen-like-endocrine disrupting chemicals in soil[J]. Environmental Toxicology and Chemistry, 2005, 24(10): 2640-2645. doi: 10.1897/05-074R.1 [32] JIN H, ZHU L. Occurrence and partitioning of bisphenol analogues in water and sediment from Liaohe River Basin and Taihu Lake, China[J]. Water Research, 2016, 103: 343-351. doi: 10.1016/j.watres.2016.07.059 [33] 李栋, 张圣虎, 张芹, 等. 长江南京段水源水中有机磷酸酯的污染特征与风险评估[J]. 环境科学, 2020, 41(1): 205-212. doi: 10.13227/j.hjkx.201907149 [34] BUERGE I J, BUSER H R, KAHLE M, et al. Ubiquitous occurrence of the artificial sweetener acesulfame in the aquatic environment: an ideal chemical marker of domestic wastewater in groundwater[J]. Environmental science & technology, 2009, 43(12): 4381-4385. [35] SCHULZE S, ZAHN D, MONTES R, et al. Occurrence of emerging persistent and mobile organic contaminants in European water samples[J]. Water research, 2019, 153: 80-90. doi: 10.1016/j.watres.2019.01.008 -


 下载:
下载:

