-
水环境与人类生命息息相关,自然水体的水质一直受到高度关注[1-3]。我国东部河湖水网密集,亟需从时空分布和持续观测方面提升传统地面水质监测手段。随着卫星遥感技术的发展,采用高分辨率卫星遥感观测河湖水质的技术具有很大潜力和发展前景。因此,很多学者围绕湖泊水质开展了遥感技术的应用研究。黄灵光等[4]基于卫星Landsat8/OLI反演了鄱阳湖叶绿素a质量浓度;刘文雅等[5]基于辐射传输模型反演了巢湖叶绿素a质量浓度;岳程鹏等[6]基于Landsat8/OLI反演了乌梁素海浮游植物生物量;孟凡晓等[7]基于Landsat8/OLI数据反演了南海近岸悬浮泥沙与叶绿素a质量浓度。以上研究都是针对湖泊水质监测进行的,然而,关于水质变化极快的河流水质遥感监测研究尚不多见。这可能是由于与高空间分辨率卫星过境的重访频率较低,且海岸带水网密集区域常受云盖影响有关。以上两点因素导致遥感技术有效观测水质参数变化的数据有限、时间频率较低,难以满足快速变化的河流水质监测。水质遥感的机理是基于光学传感器可探测到水体组分如浮游植物色素、悬浮物的浓度变化,从而引起光吸收和散射特性的变化。然而,非光敏性质的水质参数如DO、NH3-N等一般无法直接探测到。本课题组尝试通过叶绿素a质量浓度间接反演非光敏性质的水质参数。
另外,海岸带河湖水质常受潮汐动力影响,而近年利用水质动力模型分析水质变化的方法已得到发展[8-9]。CHEN等[10]基于Delft3D模型构建了上海市淀山湖水动力和水生生态耦合模型,对淀山湖的藻华生长影响因素进行了分析。然而,水质动力模型的模拟过程较为复杂,往往需要大量实测数据作为边界条件,不易操作,更难以实际应用。
本研究拟选择卫星Landsat8/OLI数据,遥感定量反演叶绿素a质量浓度,并通过Delft3D模型模拟感潮河流-黄浦江的水动力特征,以实现水质参数DO、NH3-N和CODMn的模拟;又根据叶绿素a质量浓度表征着光能自养生物量[11]和水体富营养状况[12-14],再通过构建研究区叶绿素a与水质参数的回归模型,最终实现卫星遥感观测与定量反演感潮河流的水质参数,为类似河流水质遥感监测提供参考。
全文HTML
-
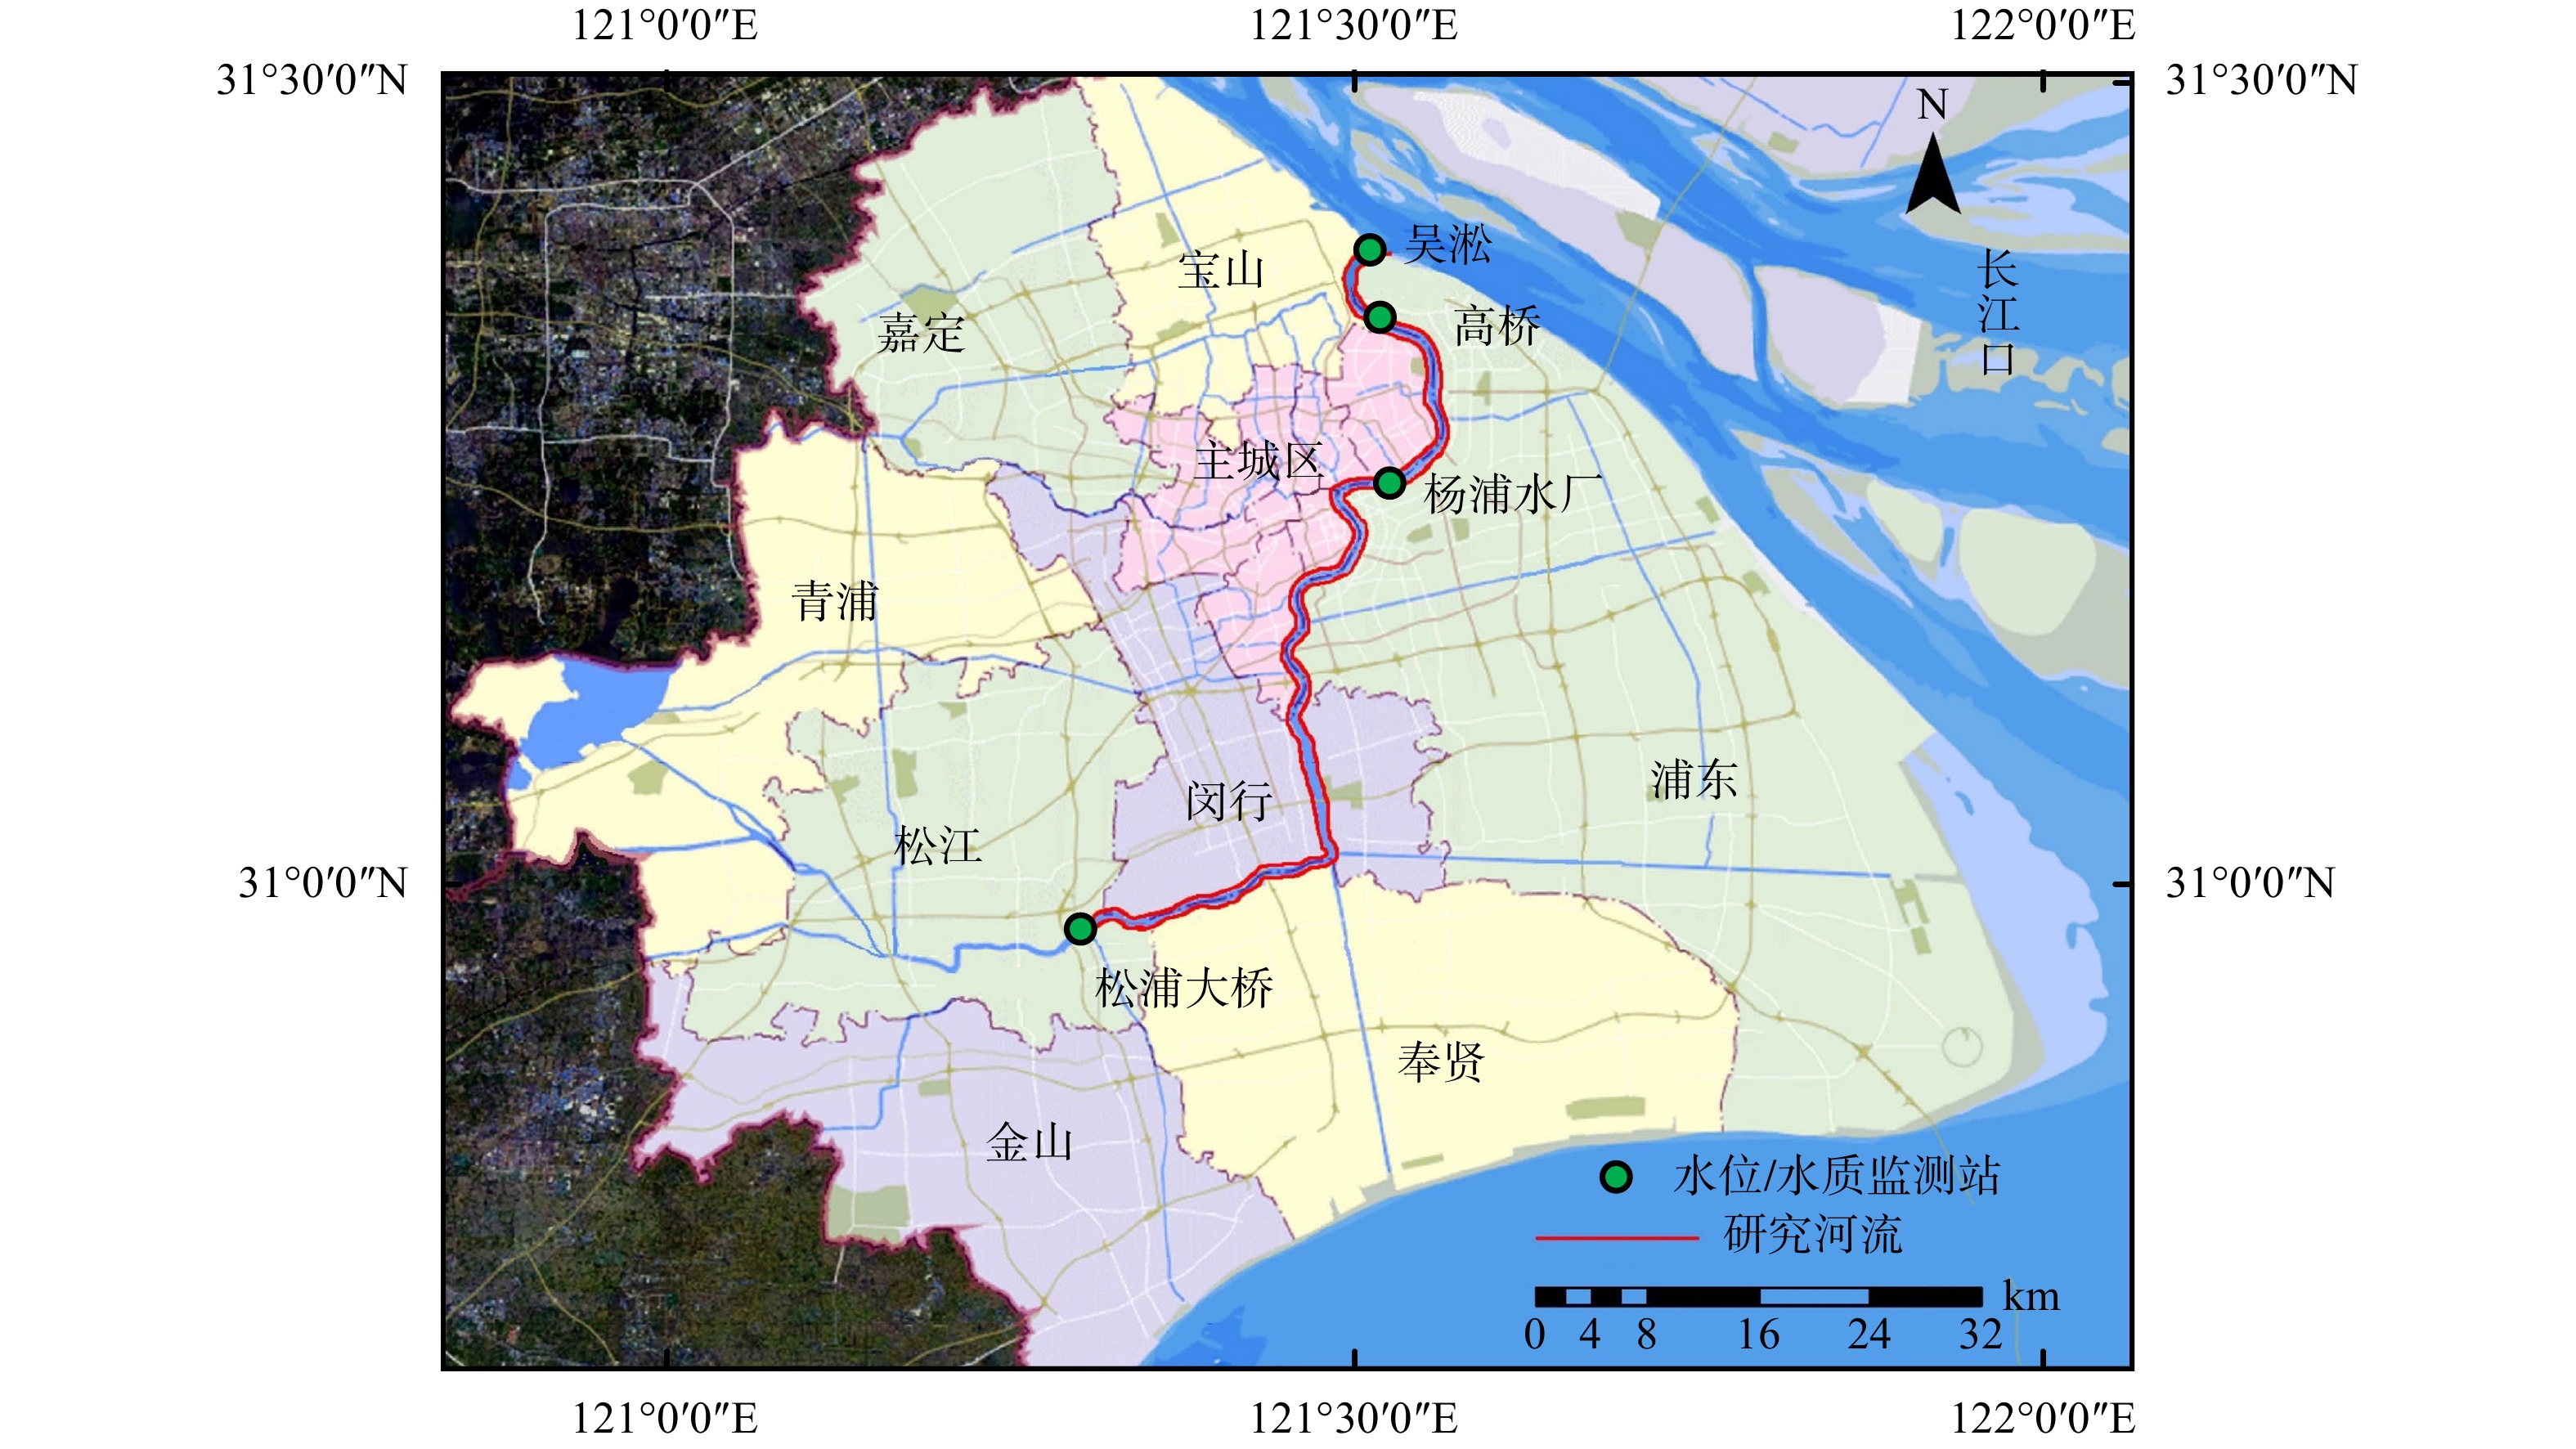
黄浦江位于东经121°13′20″E~121°31′24″E,北纬30°57′23″N~31°23′38″N,是长江汇入东海之前的最后一条支流,也是连接太湖与长江口的一条感潮河流。黄浦江全长约113 km,河宽300~770 m,至吴淞口注入长江。本研究涉及的区域是黄浦江自松浦大桥至吴淞口段(见图1)。该河段水质受长江口潮汐水动力变化影响,采用Delft3D水质动力模型进行了水质模拟,以提高模拟的准确性。
-
1)地面实测数据。地面实测数据包括实测光谱数据与水质数据。地面实测光谱数据采用手持ASD获得,每次采集10条光谱曲线并取均值;水质数据由现场采样带回实验室测得。本研究地面数据于2019-07-05、2019-07-06,2019-08-12、2019-08-13,2019-09-17、2019-09-18、2019-11-10、2019-11-11这8 d的野外采样获得,共71组。采样点位置及数量见表1。
叶绿素a质量浓度的测量采用分光光度法,精确量取50 mL样品进行低压抽滤,将其富集在直径25 mm、孔径0.7 μm的Whatman GF/F玻璃纤维滤膜上,然后迅速放入细胞培养皿中并用铝箔包好避光,放入−40 ℃冰箱中保存待测。样品测量用Lambda 1050双光束紫外/可见红外分光光度计进行,将冷冻的样品放入5 mL甲醇中,4 ℃避光静置一夜,萃取后用分光光度计分别测量652 nm和665 nm处的吸光度A652和A665[15]。
叶绿素a质量浓度参考藻类常用的计算方法[15]得到(见式(1))。
式中:[Chla]为叶绿素a的质量浓度,mg·m−3。
2)遥感影像数据。由于研究区黄浦江宽度限制,选择空间分辨率较高的Landsat8/OLI的level-1级产品作为数据源,数据从美国地质调查局(USGS)(https://earthexplorer.usgs.gov/)下载得到,Landsat8/OLI由9个波段组成,包括4个可见光波段,1个近红外波段,2个短波红外波段,1个全色波段与1个卷云波段。本研究中使用的11幅遥感影像日期与研究区内各监测站的观测数据保持一致,分别为2013-08-13、2013-08-29、2013-11-17、2013-12-03、2013-12-19、2014-02-21、2014-03-09、2014-04-10、2014-05-12、2014-05-28、2014-06-13,过境时间均为北京时间上午10:27。
3) Delft3D模型输入数据。Delft3D模型的水动力模块用到的数据主要有边界数据、水下地形、实测水位、流量数据等。边界数据由遥感影像的归一化水体指数(normalized difference water index,NDWI)获得,将阈值设为0,把陆地与水体区域区分开,以分界线作为水边线,作为参考计算边界。
水下地形数据以5幅中国海图为基础数据,包括44211吴淞口至高桥港、44212高桥港至日晖港、44213日晖港至闵行、44214闵行至米市渡、44251吴淞口航道。在ArcGIS中首先将投影与坐标系按照海图的投影与坐标设置为墨卡托投影、2000国家大地坐标系,在点文件中逐点标记高程数据点,并依照海图上的高程赋值,共获得3 882个高程点。
水位与流量数据监测站位置见表2。其中,逐时水位数据由潮汐表获得,流量数据为松浦大桥处的逐月实测数据,水位验证数据为高桥处的数据。黄浦江的水质参数DO、NH3-N和CODMn为水质动力模型的的初始边界条件,从上海市水务局(上海市海洋局)网站(http://swj.sh.gov.cn/)获得。水质模拟的输入边界条件为吴淞口、松浦大桥的逐月数据,验证数据为杨浦水厂处的数据。
1.1. 研究区域
1.2. 研究数据
-
选择VANHELLEMONT等[16]提出的ACOLITE大气校正算法对Landsat8/OLI影像进行校正[17-19],得到目标的遥感反射率。TANG等[20]对Landsat8/OLI的大气校正方法进行了对比验证。结果表明,ACOLITE具有较好的精度。故本研究采用了ACOLITE大气校正方法对Landsat8/OLI影像进行大气校正。
-
由于地面实测光谱是以1 nm为间隔的高光谱数据,Landsat8/OLI通道是有一定带宽的多光谱数据,因此,地面实测光谱的某一波长并不能代表整个通道。为解决这个问题,以等效波长[21-23]来代替整个通道的波长,修正公式见式(2)。
式中:
Xi 为通道i 对应的等效波长;gi(λ) 为通道i 的波谱响应函数;λ1和λ2为通道i 的上下限;Xλ代表通道i 对应的地面实测高光谱的遥感反射率Rrs,sr−1。 -
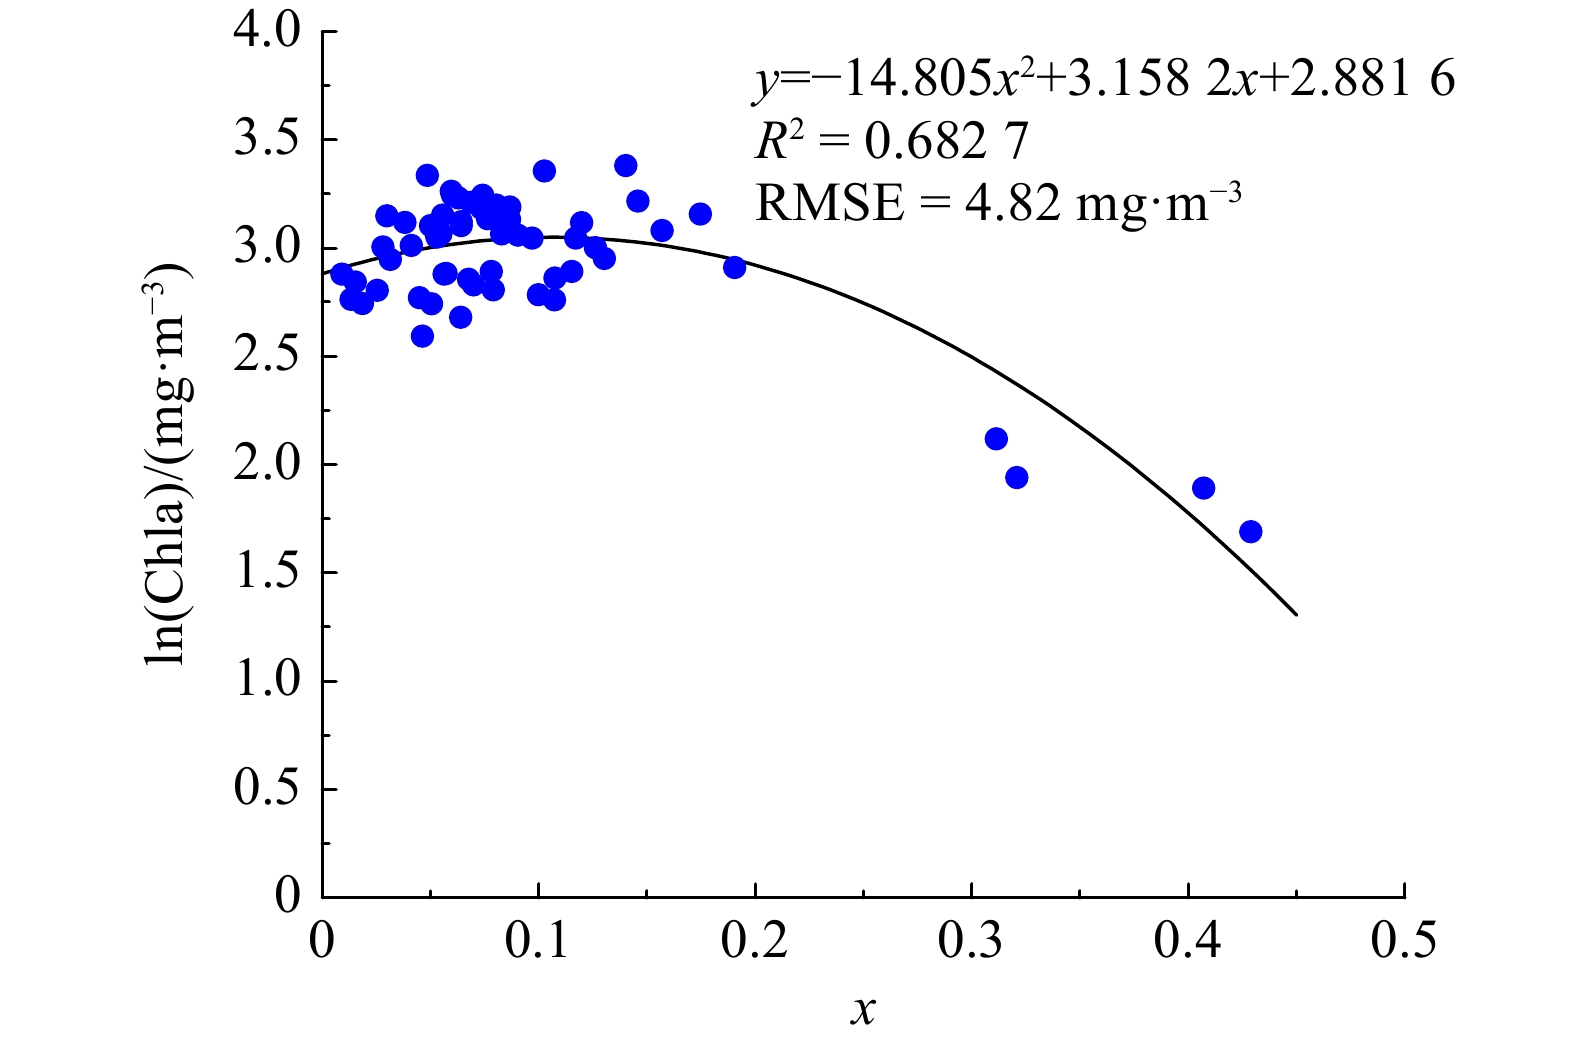
内陆水体叶绿素a质量浓度的反演主要是根据浮游植物及颗粒物的吸收和散射光谱特征,并基于特征光谱波段或波段组合实现。浮游植物吸收光谱的峰值位于波长440 nm和675 nm附近。而对于内陆水体,在440 nm附近通常会受非色素悬浮物和黄色物质吸收的影响,故675 nm附近为较理想的候选波段。又因浮游植物吸收光谱的谷值位于560 nm附近,此波段与颗粒物散射密切相关,故也是理想的候选波段。根据现场实测的光谱数据,去掉受光照条件不稳定因素影响后的60个数据,使用K折交叉的方法建立了2个波段组合与叶绿素a质量浓度高度相关的叶绿素a质量浓度反演模型。将原始训练数据集分割成5个不重合的子数据集,分别做5次模型训练和验证,每次使用其中4个子数据集训练模型,剩余的1个子数据集验证模型,以保证每次训练与验证数据集均不同,最终得到的模型见式(3)。其中,x计算公式见式(4)。
其中:
式中:Chla代表叶绿素a质量浓度,mg·m−3;Rrs(561)可对应Landsat8/OLI的第3通道(中心波长为561 nm)的遥感反射率,sr−1;Rrs(655)可对应Landsat8/OLI的第4通道(中心波长为655 nm)处的遥感反射率,sr−1。
对K折交叉的5次训练误差和验证误差分别求平均值,得到反演的叶绿素a质量浓度平均相对误差为0.31 mg·m−3,均方根误差为4.82 mg·m−3(见图2)。
2.1. Landsat8/OLI大气校正
2.2. 地面光谱预处理
2.3. 叶绿素a质量浓度遥感模型的构建
-
Delft3D是由荷兰代尔夫特水力研究所(WL/Delft Hydraulics)研究开发的一套功能强大的计算机软件包,可模拟二维和三维的水体流动、水质演变等[24]。Delft3D通过拟合边界的直线或曲线正交网格来计算非稳定流,在纳维斯托克斯(Navier-Stokes)方程的基础上进行离散求解[25-26],计算稳定性好、速度快且计算结果科学可靠。水动力模拟前需要建立网格,Delft3D模型所使用的计算网格为正交曲线网格[27]。
在水动力模拟中,将研究区域黄浦江划分为1 290个×8个网格,单个网格在M方向约为40 m,N方向约为68 m。将海图水深点在Quickin模块中进行插值,得到水下地形。在水下地形落差较大的情况下,进行地形平滑算法处理,本研究将平滑系数调整为0.1。
水动力模拟在FLOW模块中进行,上游边界给定的数据来自松浦大桥站2013年8月—2014年7月的逐月实测流量数据,下游边界给定的数据来自吴淞口站2013年8月至2014年7月的逐小时水位数据。模型参数设置见表3,在综合考虑模型精度与计算效率的基础上,时间步长设置为30 s,利用高桥站的水位数据对水动力模拟结果进行验证。
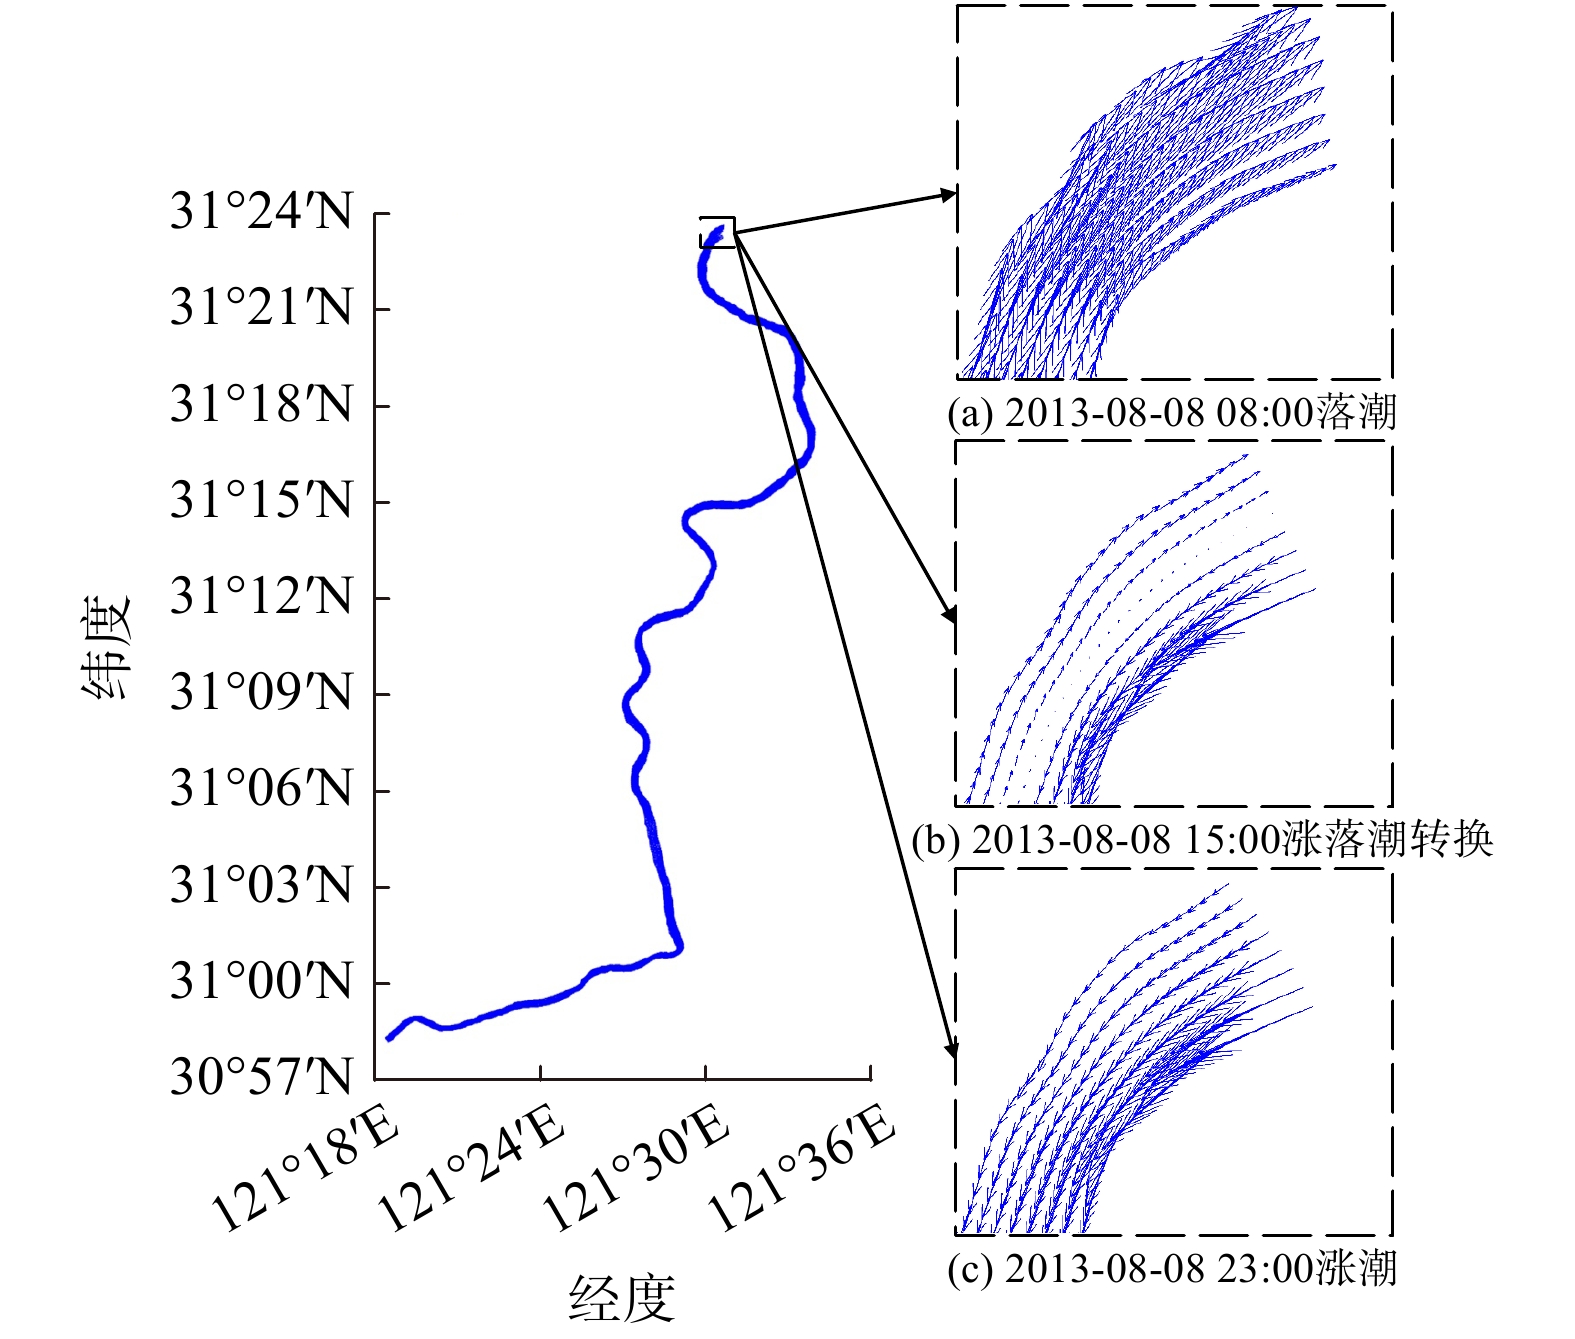
黄浦江在吴淞口处流入长江口,故吴淞口附近的水位会受到潮汐的影响,水动力模拟过程中的流向流速如图3。在吴淞口段,水流时而由黄浦江内向长江口流动,时而转向由长江口向黄浦江内流动。图3中2013-08-08,08:00水流由黄浦江向长江口流动,流速较大,说明此时吴淞口附近处于落潮时段;15:00水流开始转为由长江口向黄浦江内流动,流速变小;23:00水流则完全变为由长江口向黄浦江内流动,但流速相对较小。由此说明,此时吴淞口附近处于涨潮时段,这也进一步表明黄浦江感潮河流的特性。
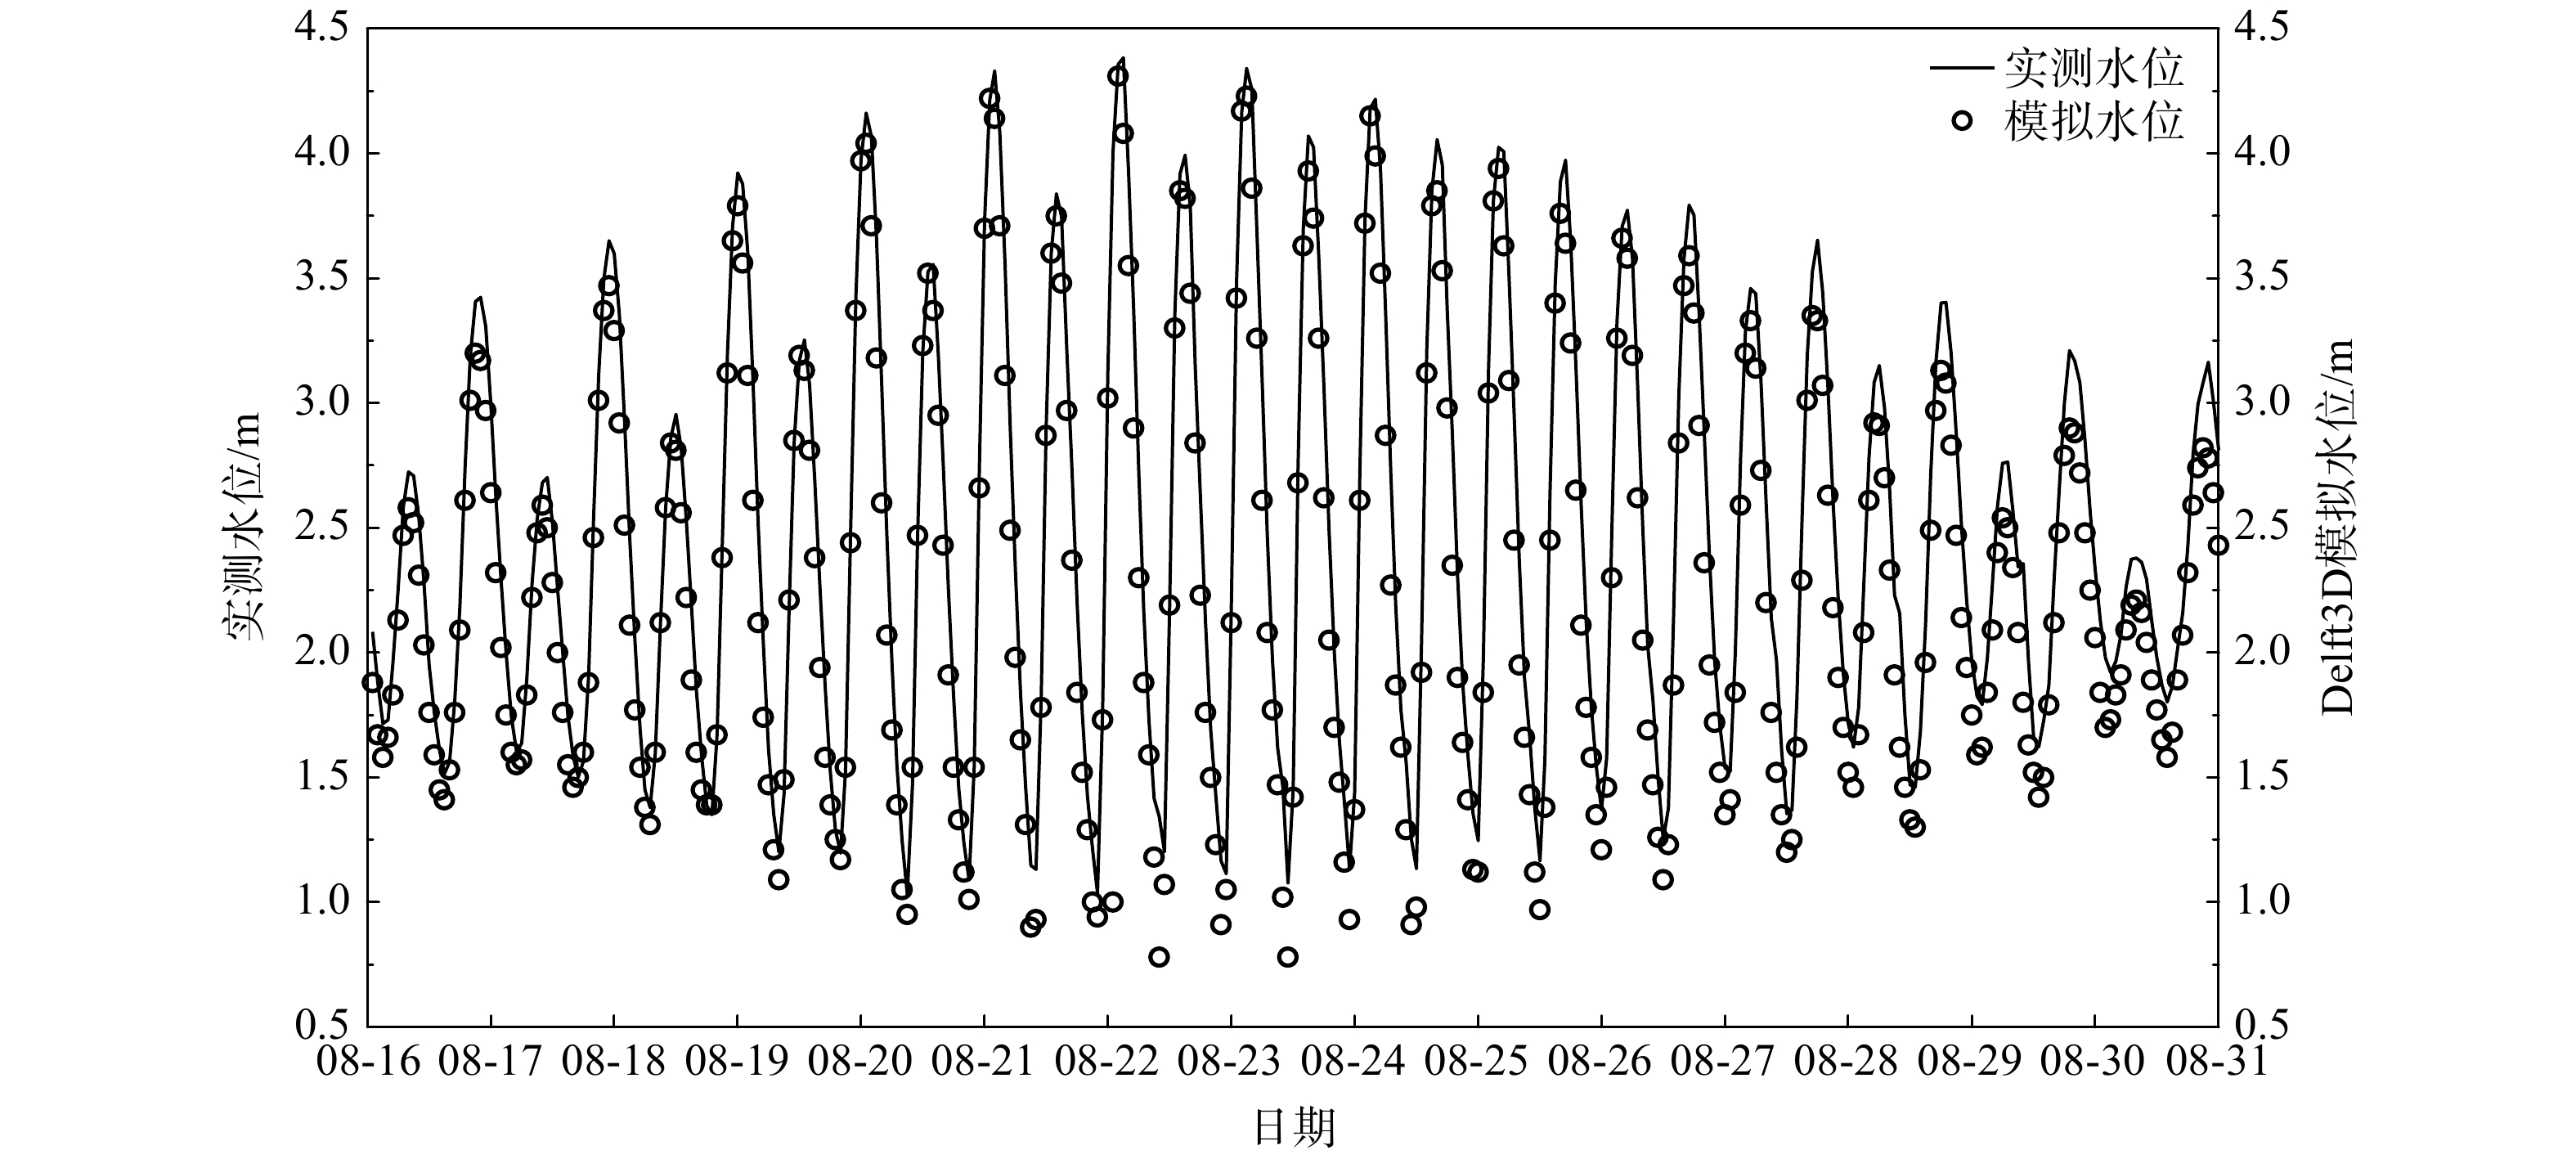
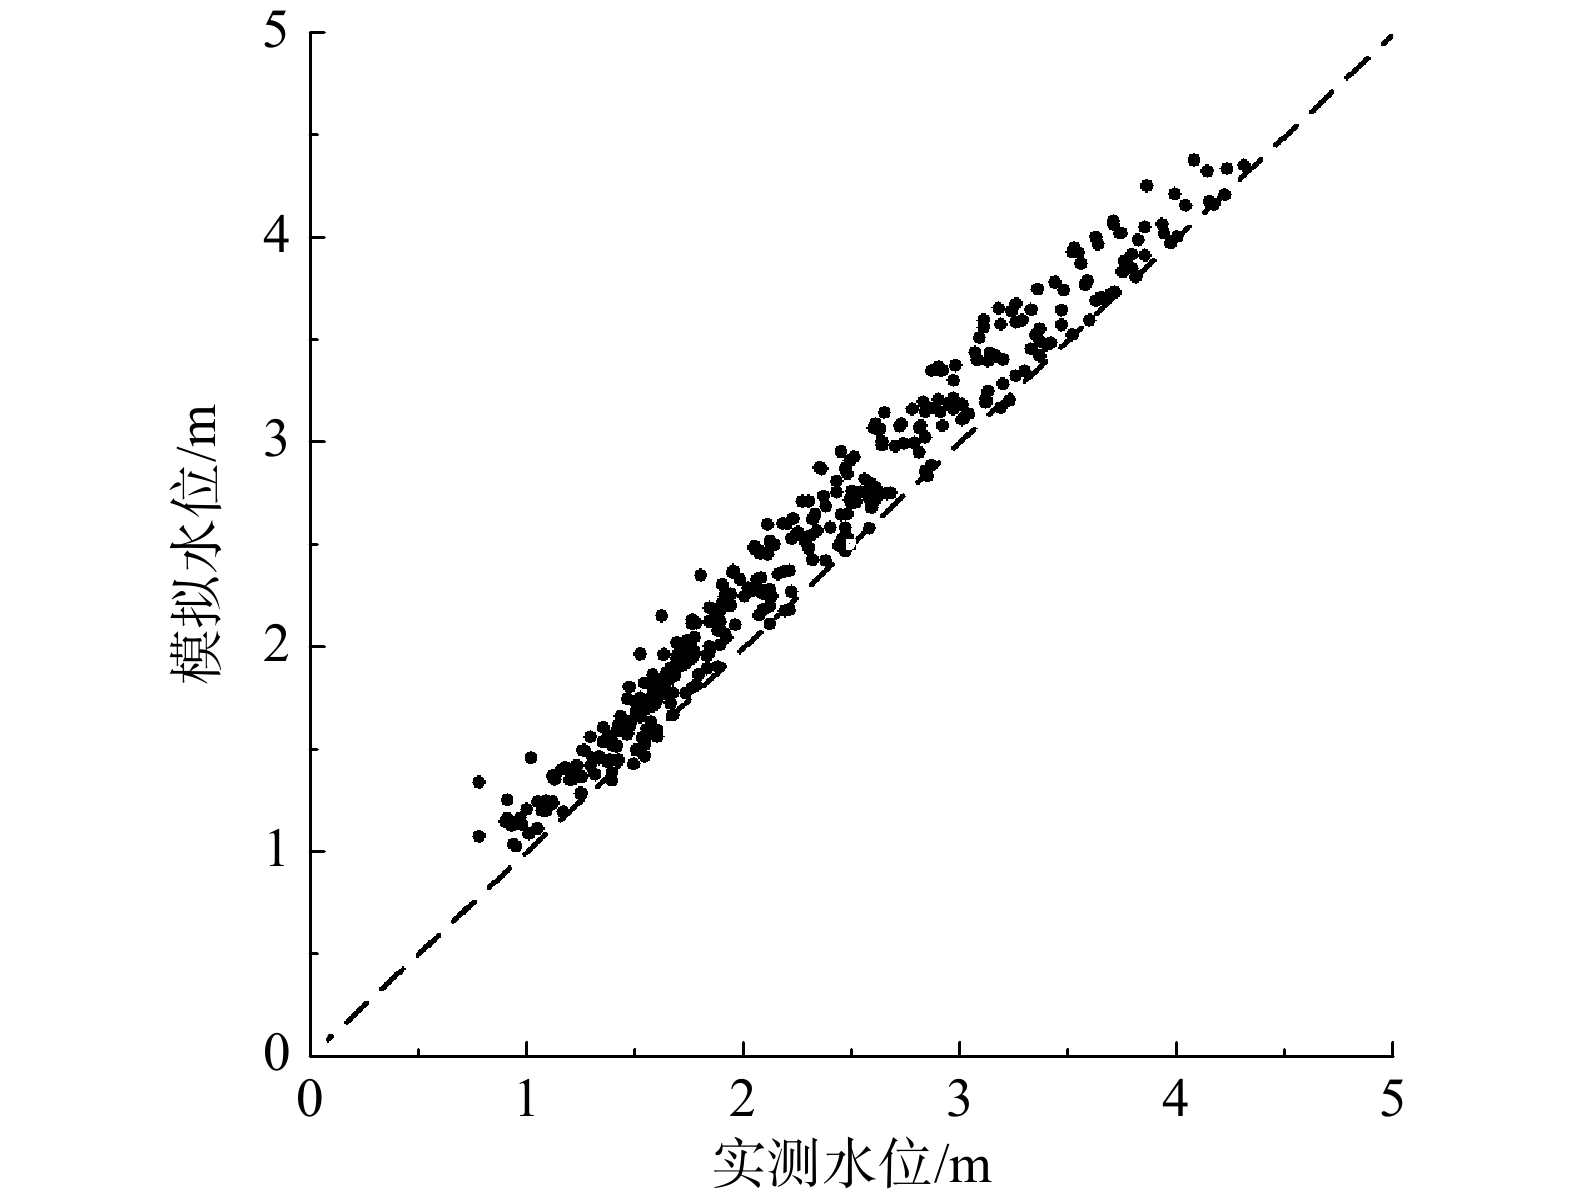
水动力模拟结束后,将模拟结果导出,模拟结果为逐时水位数据。模拟结果与实测结果的对比曲线见图4。对实测与模拟水位在Stata15中做Pearson相关性分析,其相关系数 0.973,在1%水平上显著。由图5中实测水位与模拟水位的散点图可知,模拟值较好地反映了实际情况,总体上模拟水位略小于实测水位,均方根误差为0.22 m。
-
水质模拟在Delft3D模型的WAQ模块中实现,使用二维水质模型[28]模拟黄浦江水质变化情况。据上海市水资源公报,2013—2014年黄浦江的主要污染项目为NH3-N和CODMn,而DO是水生态系统中最为重要的水质变量之一,故选取DO、NH3-N和CODMn为水质模块的变量参数。
将验证后的水动力模型与水质模型耦合,根据模块提供的追踪物质“Continuity”检查水体流动的质量守恒。若“Continuity”的质量浓度全程保持在−1~1 mg·L−1,则说明耦合结果合理[29]。给水体上游边界赋值松浦大桥水质监测点2013年8月至2014年7月的逐月DO、NH3-N和CODMn数据,下游边界则赋值吴淞口水质监测点同期的逐月数据。
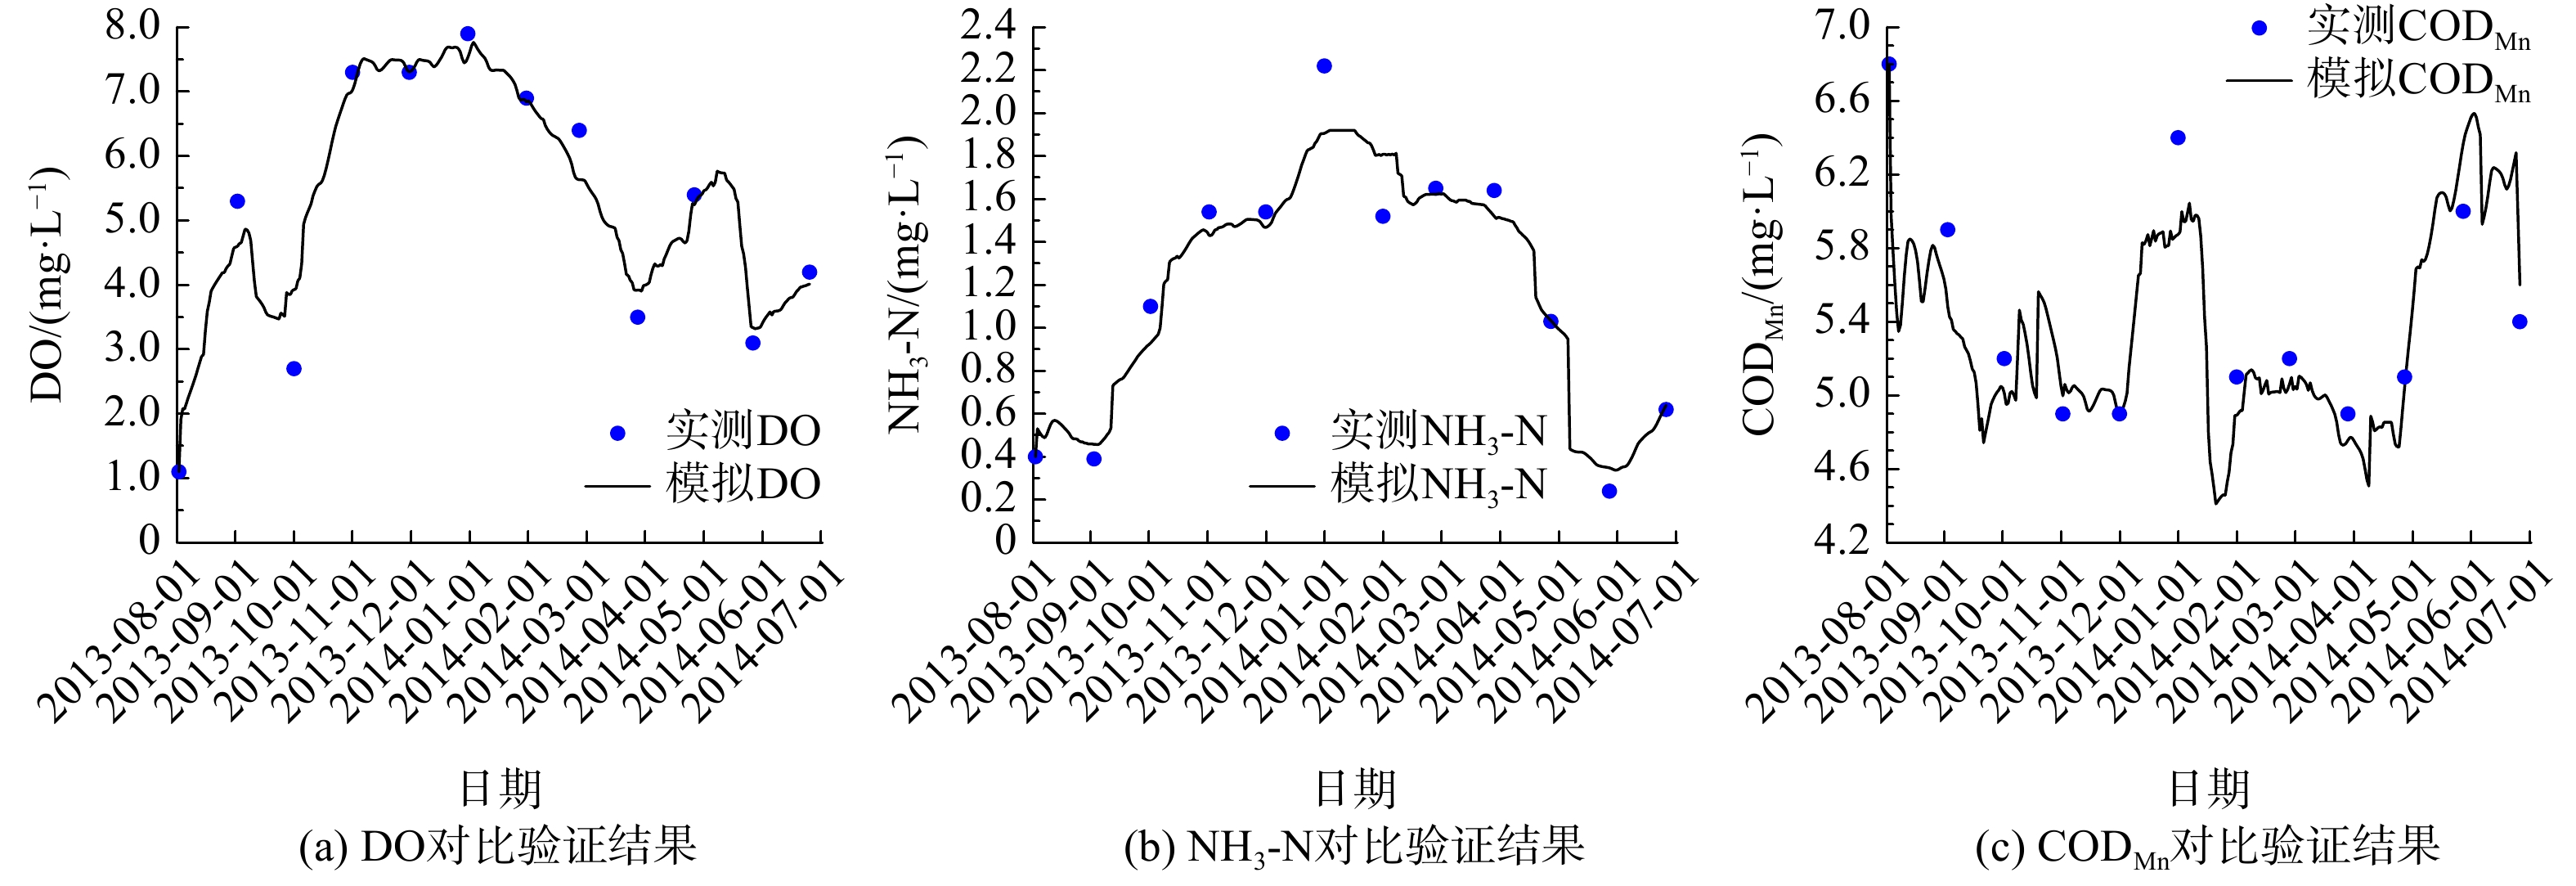
选择杨浦水厂水质监测点作为验证点,将模拟结果与杨浦水厂的实测水质参数进行对比验证,结果见图6。DO、NH3-N和CODMn的验证均方根误差分别为0.53、0.16和 0.27 mg·L−1,模拟值与实测值略有偏差,但模拟结果与实测结果的趋势保持一致,精度可靠。对实测与模拟值在Stata15中做Pearson相关性分析,DO、NH3-N与CODMn的相关系数分别为0.973、0.973与0.926,均在1%水平上显著。
3.1. Delft3D水动力模拟与验证
3.2. 水质动力模拟与验证
-
根据前文所建的水体叶绿素a遥感模型,从Landsat8/OLI影像中反演各期叶绿素a质量浓度,并与对应水质参数DO、NH3-N、CODMn进行回归分析。在Stata15中进行OLS(Ordinary Least Squares)回归,叶绿素a质量浓度与DO、NH3-N、CODMn的回归系数分别为0.483 8、0.427 1、0.278 9,均在1%水平显著。DO的区间为2~8 mg·L−1,均方根误差0.70 mg·L−1;NH3-N的区间为0.3~1.4 mg·L−1,均方根误差0.21 mg·L−1;CODMn的区间为3.7~6.1 mg·L−1,均方根误差0.38 mg·L−1。并且随着叶绿素a质量浓度的增大,DO与NH3-N也相应增大,CODMn则相应减小,结果见图7。
图7(a)所示的随着叶绿素a质量浓度的增大,DO相应增大的原因是,由于水中DO主要来源于大气中氧气的溶解与浮游植物光合作用的释放。叶绿素a含量越高,浮游植物数量越多,浮游植物光合作用产生的氧气也就越多。由于浮游植物能直接利用氨氮,所以在营养关系上,氨氮是浮游植物优先利用的氮源。而出现图7(b)所示随着叶绿素a质量浓度的增大,NH3-N也相应增大的原因可能是,由于NH3-N增加的情况下浮游植物可利用氮源增加,生物量增加,所以叶绿素a质量浓度增加。一般情况下,CODMn与水体有机物污染相关。出现图7(c)随着叶绿素a质量浓度的增大,CODMn相应减小的原因可能是,由于水体污染加剧,水体浮游植物死亡,叶绿素a质量浓度降低。
-
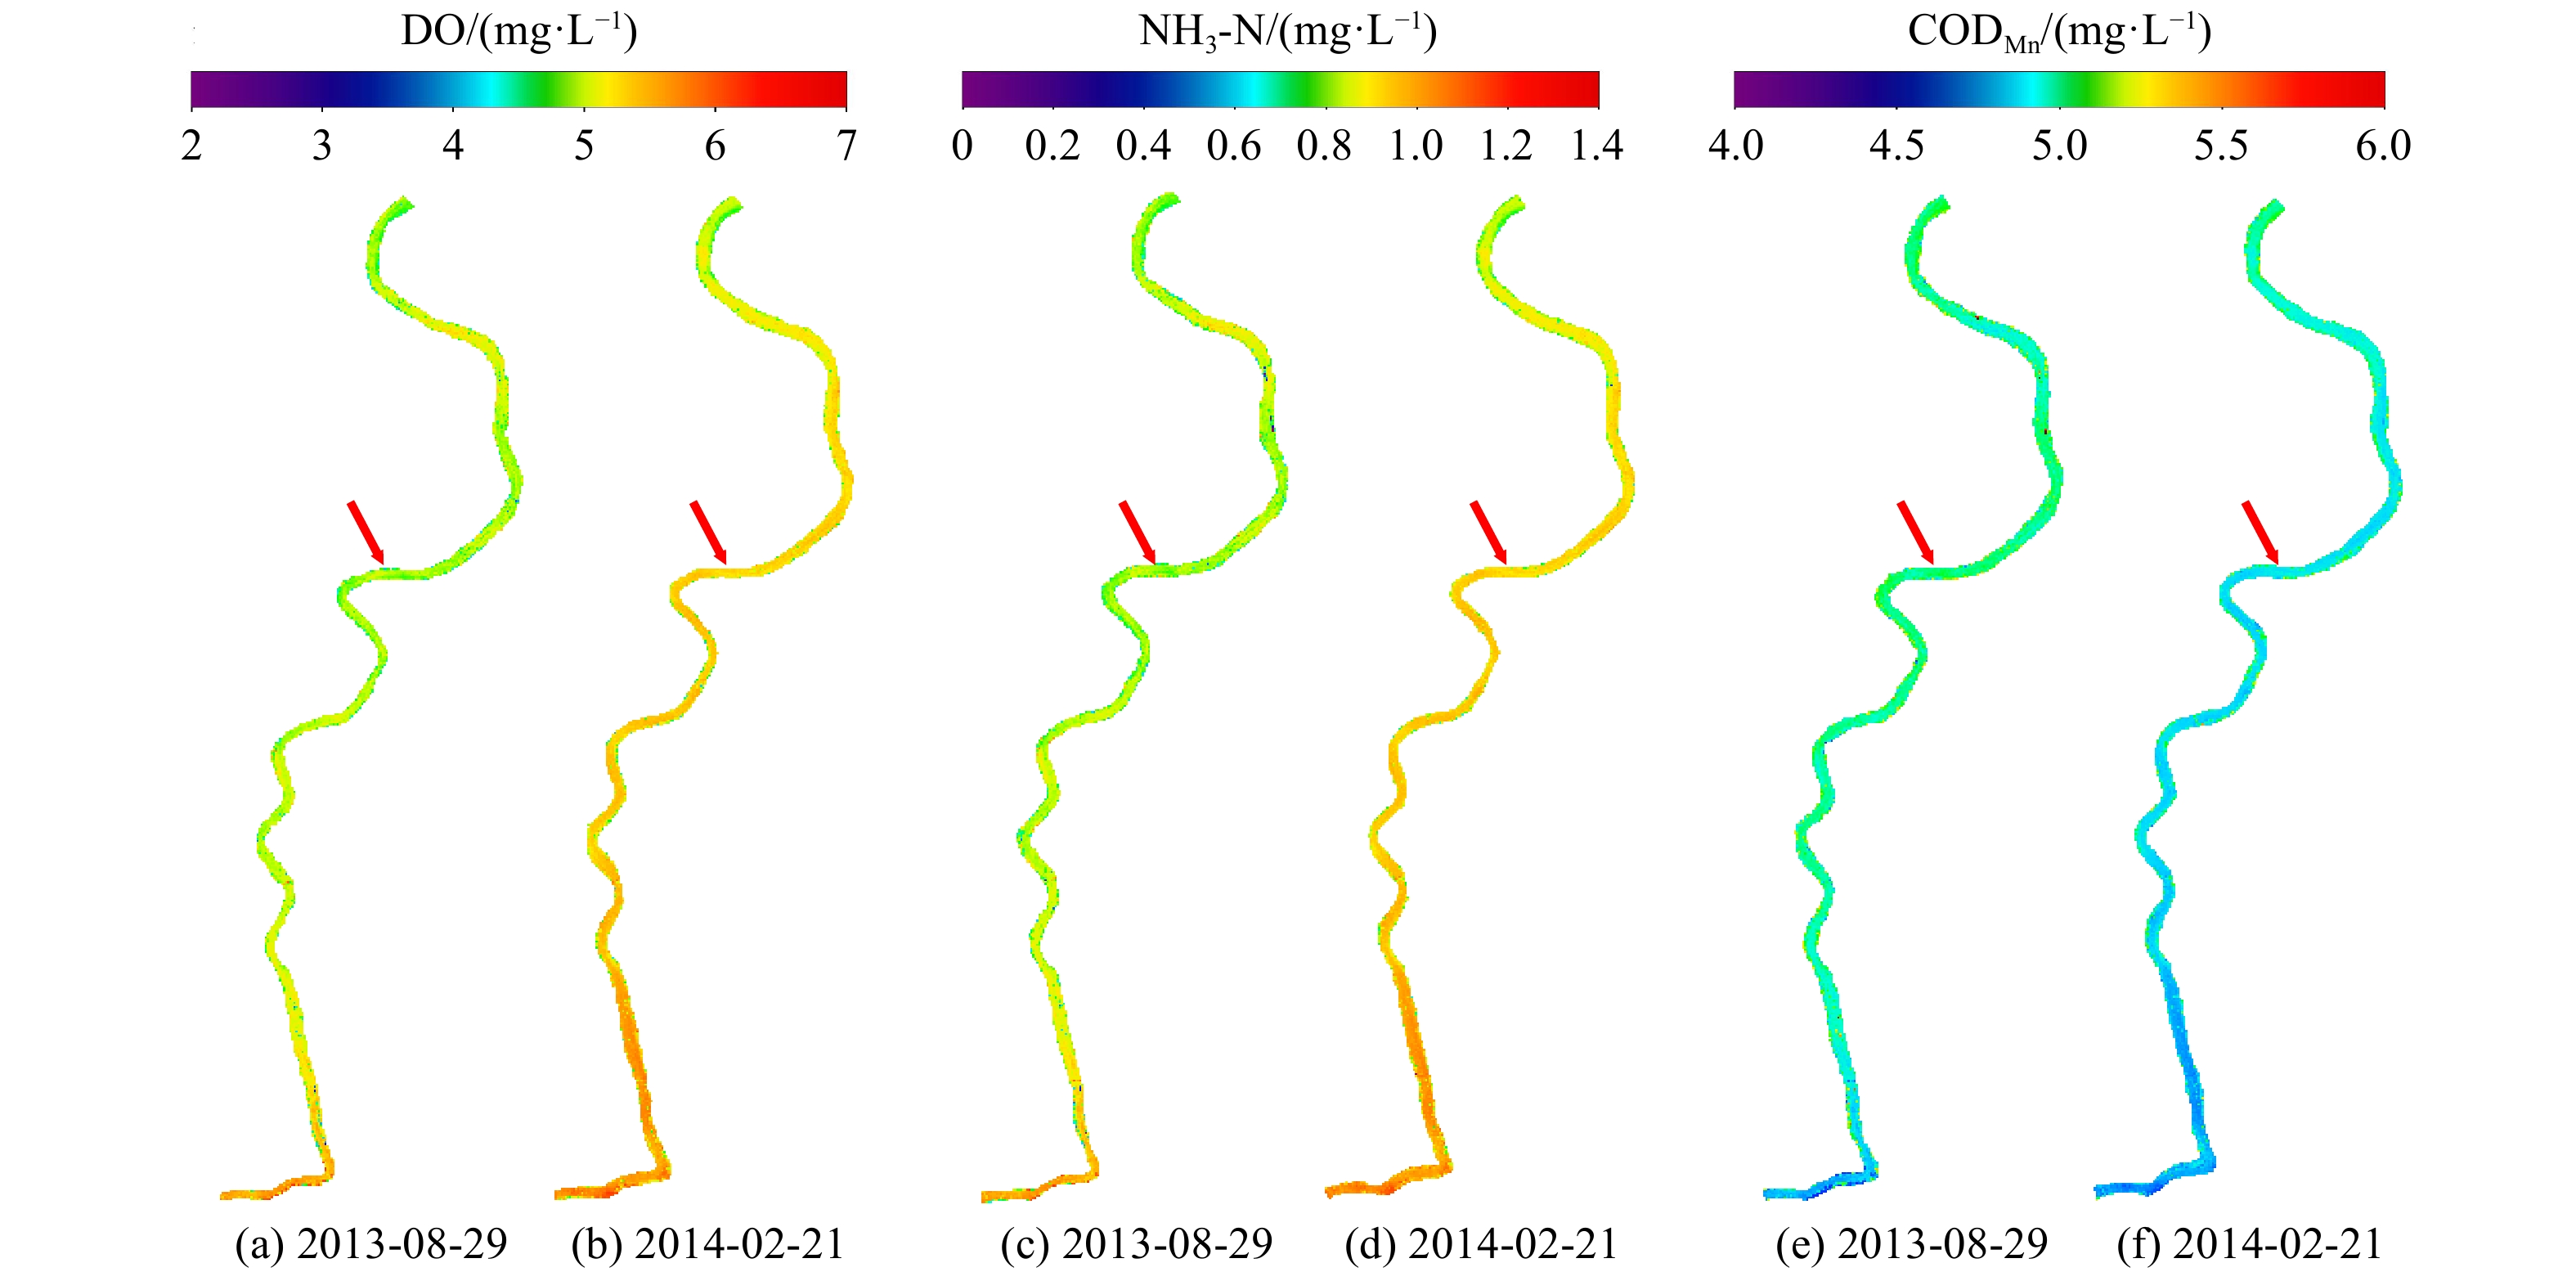
选择Delft3D模拟时间段内的二景Landsat8/OLI卫星影像(成像时间2013-08-29(洪季)和2014-02-21(旱季)),在叶绿素a质量浓度与水质参数DO、NH3-N、CODMn回归分析的基础上,利用遥感反演的叶绿素a质量浓度,进一步反演获得感潮河流DO、NH3-N、CODMn的时空分布(见图8)。图8(a)(c)(e)为2013-08-29的反演结果,(b)(d)(f)为2014-02-21的反演结果。对比可知,图7中杨浦水厂处(红色箭头指向位置)水质参数与图5中杨浦水厂实测数据相匹配,符合实测数据中DO与NH3-N旱季高洪季低,CODMn旱季低洪季高的基本规律。
由图8可知,除研究区两端的水质参数偏差较小以外,整体上DO在图8(a)低于图8(b),差值约为2.0 mg·L−1;NH3-N在图8(c)低于图8(d),差值约为0.3 mg·L−1;CODMn在图8(e)高于图8(f),差值约为0.3 mg·L−1。这可能由于8月处于洪季而2月为旱季,洪季的水量大导致叶绿素a质量浓度低,相反旱季叶绿素a质量浓度高。根据4.1节中的回归分析结果,8月份水中DO与NH3-N低,CODMn高;2月份DO与NH3-N高,CODMn低的结果得以验证。对于感潮河段,水质参数随季节变化较大。产生此结果的原因可能是:由于其他河流的汇入、废弃物的排放等人为因素,以及长江口涨落潮等影响,具体原因将在进一步研究中继续探究。
4.1. 叶绿素a质量浓度与水质参数回归分析
4.2. 基于卫星的感潮河水质分析
-
1)随着叶绿素a质量浓度的增大,DO、NH3-N也相应增大,CODMn则相应减小,为卫星反演非光敏性质的水质参数奠定了基础。与实测数据对比验证,Delft3D水质动力模型模拟的黄浦江水动力及水质参数DO、NH3-N、CODMn精度可靠,模拟与实测数据相关系数均大于0.9,且在1%水平上显著。
2)由Lansat8/OLI卫星影像观测2013-08-29和2014-02-21的黄浦江水质,分析得出,8月份相比于2月份,全河段DO与NH3-N整体偏低,但CODMn整体偏高,该结果与实测相符。这也说明将卫星数据与水质动力模型相结合监测水质时空动态变化是切实可行的,尤其适合于水质地面实测数据缺乏或难以获取时的水质监测工作。


 下载:
下载:


