-
挥发性有机物(volatile organic compounds,VOCs)是大气对流层中非常重要的痕量组分,以多种重要角色参与大气化学反应过程,是一些区域环境问题、尤其是光化学污染的关键前体物与驱动者。因此,VOCs亦是大气复合污染的重要成因之一,对臭氧污染起到至关重要的影响[1]。近几年,我国臭氧污染问题日渐突出[2-4],对VOCs的监测工作也越来越重视。有学者指出,中国应尽快建立国家层面的光化学监测网络,完善光化学监测的技术体系与质量管理体系,为重点地区光化学污染防治工作提供监测数据支持[5]。2018年,生态环境部在包括京津冀及周边、长三角、珠三角、成渝、关中地区、辽宁中南部、武汉及周边城市的部分地区开展环境空气VOCs监测工作。监测方式包括手工监测与自动监测,直辖市、省会城市及计划单列市必须开展VOCs在线监测。2019年,生态环境部进一步扩大监测范围,并鼓励有能力的城市开展在线监测。至此,VOCs在线监测已经成为环境空气中VOCs监测的重要手段。
随着国家和地方对VOCs在线监测的重视程度不断提高,市面上涌现出众多VOCs在线监测设备。国外VOCs在线监测设备品牌有Chromatotec、Synspec、Perkin Elmer、Baseline、Markers、Agilent、Thermo等;国内品牌有武汉天虹、广州禾信、北京博赛德、杭州谱育、上海磐合、河北先河、北京鹏宇昌亚等;设备用到的检测方法包括GC-FID、GC-FID/MS及GC-PID/FID等[6-7]。国内外多个监测机构对种类繁多的VOCs在线监测设备开展了一系列比对评估实验:美国环境保护署(United States Environmental Protection Agency,USEPA)针对VOCs在线监测设备开展了实验室测试与现场测试相结合的比对实验,较全面地分析了参比设备的各项性能指标[8-10];上海市环境监测中心则初步确定评价指标权重方法,并提出了系统建设、设备运行技术、设备维护方法和人员培训等相关要求[11];中国环境监测总站于2018年发布了《环境空气挥发性有机物气相色谱连续监测系统技术及检测方法》(HJ 1010-2018)用以规范VOCs在线监测设备的性能和质量[12]。
由于VOCs属于痕量组分,且物种复杂[13],其监测数据受预浓缩和检测方法等因素的影响,所以市面上绝大多数设备都需要在原始图谱上进行人工审核(重积分),才能获得准确浓度结果。然而,对人工审核工作的依赖,极大降低了在线监测数据产生的效率,导致VOCs在线监测的原始数据很难直接快速分析应用,难以支撑日新月异的精细化环境管理工作。USEPA[8-10]和上海市境监测中心[11]等近年来针对大气VOCs在线监测设备的评估工作也未对输出的原始数据质量进行考量。为快速、准确获得VOCs在线监测设备的原始数据,本研究基于8台VOCs在线监测设备的比对实验,分析比较VOCs原始监测数据与经过重积分的人工审核数据,提出VOCs在线监测设备数据识别能力的评估方法,并明确了“数据识别指数(data recognition index,DRI)”计算方法。该方法为今后VOCs在线监测设备,甚至其他大型复杂在线监测设备的评估工作提供了一种全新的考核指标,也可对其他在线监测设备的快速分析及应用能力进行科学评判。
全文HTML
-
实验地点在广州市环境监测中心站二楼(113.4055°E,23.0518°N),海拔高6 m,位于广州市番禺区大学城,实验地点见图1。该区域属于大学城综合发展区,周边无明显污染源。
实验时间为2019年6月1日—7月10日。
-
选择市面上常见的8种VOCs在线监测设备开展研究:天虹TH-300B、博赛德BCT-7800A、禾信AC-GCMS 1000、磐合CIA+GCMS、鹏宇昌亚ZF-PKU-VOC1007、谱育EXPEC 2000、Thermo 5800 GM、先河XHVOC 6000。这些设备的检测方法均为GC-FID/MS。由于本研究目的为确定VOCs在线监测设备数据识别能力评估方法,为维护品牌利益,下文中仅用字母A~H代表以上设备,排名不分先后。
为确保研究期间仪器输出数据的稳定性及连贯性,8台VOCs在线监测设备的定期校准和维护、维修工作均由各厂家技术人员负责。
-
由于研究点位网络为单位内部网络,不能通过外部网络进行远程访问。为将各仪器设备接入外网,提前用4G无线路由器的方式,将设备接入外网。为实现对所有在线监测设备原始数据的采集,本研究通过双网卡组网,以文件共享方式进行采集。其网络拓扑图详见图2,具体操作步骤如下。
1)给各台VOCs在线监测设备加装一个USB无线网卡,并且现场安装一台无线路由器,将所有拟联网设备接入此无线网络。同时,将数据采集系统也接入此网络,从而组成一个内部局域网。
2)将每台仪器设备产出的文件设置为共享状态,默认只分配读取权限,可保证每台设备文件数据的安全。
3)数据采集系统可通过访问每台设备的主机名,查看每台设备共享出来的文件,从而进行数据的采集,然后再通过4G路由器连接的网络,将数据报送到联网平台。
这种安装方式具有以下优点:部署简单,无需另行布线;局域网文件共享方式,不消耗带宽,不会对原来的网络传输造成影响;不改变原设备工控机的系统环境,不会对仪器的软件造成影响;各网络相互独立,出现故障时不会相互影响。
-
原始数据的采集由数据采集软件通过共享文件的方式获取,其采集指标主要包括USEPA光化学污染监控网络(photochemical assessment monitoring station,PAMS)原56种VOCs监测结果等[14-15],采集指标见表1,数据采集单位为nL·L−1,保留小数点后3位。
1.1. 实验地点与时间
1.2. 研究设备
1.3. 网络部署
1.4. 数据收集
-
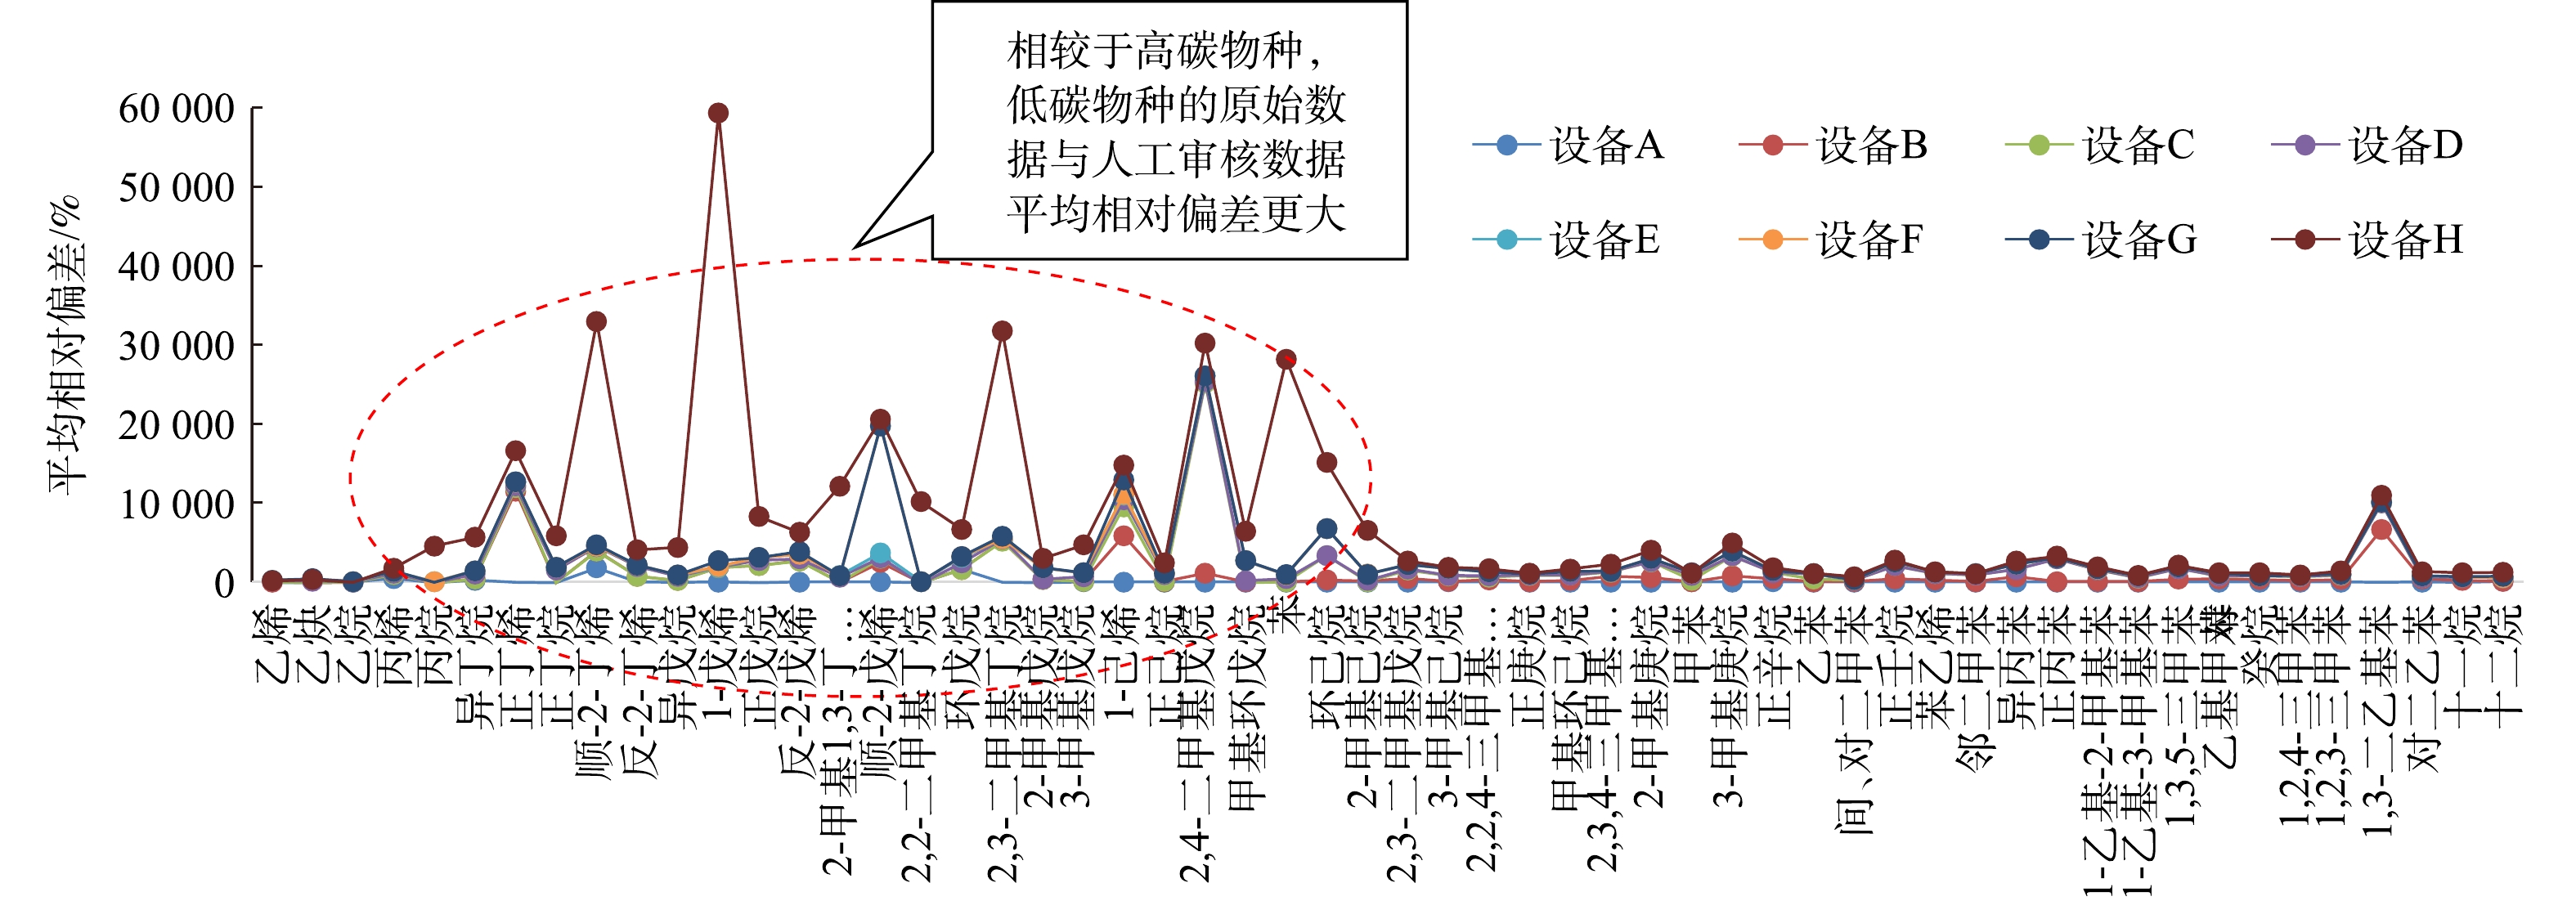
研究期间共收集8台设备原始监测数据与人工审核数据相匹配的有效数据组5 902组(见表2)。由于设备联网时间有前有后,所以有效数据组的数量也有所不同。将获取的每个物种每个原始监测数据与人工审核数据进行比较,求二者的相对标准偏差,即可得到每个物种每次监测的相对偏差。根据每个物种每次监测的相对偏差,可求出此台设备该物种原始监测数据与人工审核数据的平均相对偏差。再将每台设备的所有物种进行归类,则可得到该设备原始监测数据与人工审核数据的平均相对偏差。
根据图3数据,8种VOCs在线监测设备表现存在一定的差异,原始数据与人工审核数据的平均相对偏差为−100%~56 652%(1-戊烯,设备H)。其中,平均相对偏差为−100%,则说明该设备并未能从原始数据图谱直接析出该物种,导致该物种的原始监测数据一直为0。相较于高碳物种,低碳物种的原始数据与人工审核数据平均相对偏差更大。然而,这种方法只能大致说明不同设备之间的表现有所差异,并不能用来定量评估每台设备在数据识别能力方面的优劣性。为科学评估VOCs在线监测设备的数据识别能力,有效提高原始监测数据的分析应用效率,建立一种定量区分VOCs在线监测设备数据识别能力的评估方法显得尤为重要。
-
针对以上问题,提出一种具有可操作性的VOCs在线监测设备数据识别能力的评估方法。
1)为评判不同VOCs在线监测设备的数据识别能力,首先将某一时刻的原始监测数据与人工审核数据进行比较,计算相对偏差,详见式(1)。
式中:i为VOCs某一物种;j为某一VOCs在线监测设备;xi,j为j设备i物种的原始监测数据;yi,j为j设备i物种的人工审核数据;
σi,j 为某一时刻j设备i物种原始监测数据与人工审核数据的相对偏差。2)假定|
σi,j |≤某一特定值(如初始设定为10%,即原始监测数据与人工审核数据的相对偏差在±10%以内,该指标可根据实际需要进行自定义调整),则认为该时刻这一物种的原始监测数据满足分析应用要求。由于VOCs在线监测设备是连续运行的,根据以上内容,即可获得观测期间不同物种在相对偏差范围内的有效原始数据个数。根据式(2)得出连续运行时段内j设备i物种的有效数据获取率Υi,j 。式中:
Υi,j 为j设备i物种的有效数据获取率,ni,j是指j设备i物种的相对偏差在某一设定范围的有效原始数据个数;Ni,j为应有数据个数(扣除停电等不可抗力所造成的无效数据个数)。3)将连续运行时段内某物种有效数据获取率按a、b、c···进行分类,可计算得出该设备连续运行时段内在不同有效数据获取率的可识别物种数量Sj,详见式(3)。
式中:a、b、c等分别为拟定的有效数据获取率区间范围,如90%、80%、70%等,该区间范围可根据实际需要进行自定义调整;Sa,j为连续运行期间j设备在无人为干预的情况下有效获取率达到a的物种数量;Sb,j、Sc,j则为j设备在不同有效数据获取率区间可识别的物种数量;Sj为该总的可识别物种数量。
4)随后通过式(4)计算该设备的DRI值。
式中:ADRI为数据识别指数;a为小于1的数字;b为小于a的数字,以此类推。
根据DRI的大小,即可对不同设备原始监测数据的识别能力进行评判。DRI越接近1,则表明该台设备的原始监测结果越接近人工审核结果,其监测结果的准确性越好,更能支撑后续的快速分析应用,其分析结果也更真实;DRI越小,则表示此台设备的原始监测结果越需要人工进行干预,原始监测数据越难以快速分析应用。
-
以本次VOCs在线监测设备比对结果为例,假定原始监测数据与人工审核数据的相对偏差阈值为10%(|σi,j|≤10%),即认定该时刻这一物种原始监测数据满足分析应用要求。为了区分VOCs在线监测设备对56种VOCs(C2~C12)、低碳VOCs(C2~C5)和高碳VOCs(C6~C12)物种的数据识别能力,根据实验获得的有效原始监测数据量和式(2)可分别计算得出56种VOCs(C2~C12)、低碳VOCs(C2~C5)和高碳VOCs(C6~C12)物种的有效数据获取率
Υi,j 。然后,再根据有效数据获取率分别按80%以上、60%~80%、40%~60%、20%~40%、20%以下等5个区间进行分类,确定不同级别可识别的物种数量。最后,根据式(4)计算得出每台VOCs在线监测设备对不同评价物种的DRI(见表3)。由表3可知,针对56种VOCs(C2~C12),A设备原始监测数据与人工审核数据相对偏差在±10%以内,有效数据获取率达到80%以上可识别的物种数为14种,有效数据获取率为60%~80%的物种数为3种,有效数据获取率为40%~60%的物种数为4种,有效数据获取率为20%~40%的物种数为8种,有效数据获取率在20%以下的物种数为27种,A设备的DRI为0.49。根据指数的大小,可以很明显的发现设备F的DRI最高,其原始监测结果最接近人工审核数据,可快速分析应用。各设备的数据识别能力由高到低依次为F、G、C、A、D、E、B和H,这也证明了本方法可对各台VOCs在线监测设备的数据识别能力进行定量区分。
表3中数据还表明,对高碳VOCs物种的数据识别能力最强的前3名设备分别是F、G和C,与56种VOCs(C2~C12)物种的表现相同;而对低碳VOCs(C2~C5)物种的数据识别能力最强的前3名则分别是设备F、C和G,这表明C设备低碳VOCs(C2~C5)物种的原始数据比G设备更加可靠,相反G设备高碳VOCs(C6~C12)物种的原始数据比C设备更加可靠。另外,设备A、E、F、G和H对高碳VOCs(C6~C12)物种的DRI大于低碳VOCs(C2~C5)物种的DRI,而设备B、C和D则恰恰相反。这说明不同VOCs在线监测设备对低碳VOCs(C2~C5)、高碳VOCs(C6~C12)物种的数据识别能力也有所区别。
在相同实验条件下,各台VOCs在线监测设备的DRI不同,反映出这些设备在数据识别能力方面的表现有所差异。这种差异的产生除与设备本身的预浓缩和检测方法不同有关,还与设备的日常运行维护情况、分析单元搭载的数采软件自动积分配置情况等有紧密联系。因此,在实际应用中,应注意这些因素对VOCs在线监测设备原始数据质量的影响,以提升设备的快速应用分析能力。
综上所述,本研究提出的DRI可定量反映VOCs在线监测设备的数据识别能力,特别是对本地排放量较大、臭氧生成潜势较高的VOCs物种的数据识别能力表征,会更有意义。同样,DRI对于大气颗粒物水溶性离子监测设备、重金属监测设备、有机碳/元素碳分析仪等其他在线监测设备也具有参考价值。
2.1. 原始数据与人工审核数据的相对偏差
2.2. VOCs在线监测设备数据识别能力评估方法的建立
2.3. 应用案例分析
-
1) 8种VOCs在线监测设备在数据识别能力方面的表现存在一定的差异。原始数据与人工审核数据的平均相对偏差为−100%~56 652%。相较于高碳物种,低碳物种的原始监测数据与人工审核数据平均相对偏差更大。
2)为区分不同VOCs在线监测设备原始数据的准确性,评估每台设备的数据识别能力,本研究提出了DRI的计算方法。该指数的计算过程简单,结果显而易见,便于后期应用开发。
3)根据应用案例分析可知,DRI可对VOCs在线监测设备的数据识别能力进行定量区分。该评估方法不仅为VOCs在线监测设备的评估工作提供了一种全新的考核指标,而且对其他在线监测设备也具有一定的参考价值。


 DownLoad:
