溶解性有机质(dissolved organic matter, DOM)是芳香族和脂肪族碳氢化合物组成的复杂异质混合物,含有羟基、羰基、羧基、烯醇、硫醇和苯酚等含氧、氮和硫的官能团[1-2],广泛存在于不同水生态系统中。DOM可与持久性有机污染物相结合,作为其有机配体和迁移载体,显著影响其在生态系统中的环境行为和生态效应[3]。同时,DOM可与重金属络合,通过改变重金属的化学形态控制其在水环境中的生物可利用性[4-5],进而影响其在生物体中的生物累积和毒性效应。有色溶解性有机质(chromophoric dissolved organic matter, CDOM)是DOM中可以吸收紫外和可见光的光学活性组分,对海洋中DOM的贡献在河口海岸水域可以达到70%[6],在海洋碳元素的生物地球化学循环过程中具有重要意义。荧光溶解性有机质(fluorescent dissolved organic matter, FDOM)是CDOM中具有荧光特征的组分。近年来,随着三维荧光光谱(three-dimensional excitation-emission matrix spectroscopy, 3D-EEMs)技术的发展,3D-EEMs结合平行因子(parallel factor, PARAFAC)分析已成为表征FDOM的有力手段,极大推动了不同水环境中FDOM组成、来源及迁移转化行为的研究[7-10]。
长江口连接了欧亚大陆和西太平洋,是我国第一大河口。调查结果显示,2009年长江向东海输送溶解性有机碳(dissolved organic carbon, DOC)的输送量可达1.58×10¹² g,颗粒态有机碳(particle organic carbon, POC)的输送量可达1.52×10¹² g[11]。长江口及其邻近海域受长江冲淡水、台湾暖流、闽浙沿岸流和黄海沿岸流等水团的强烈影响[12],水动力条件复杂、物质循环活跃,生物地球化学过程复杂多变。在长江口剧烈的咸淡水混合影响下,水体理化因子与生物分布特征呈现出巨大变化[13],可改变长江入海DOM的输送、分布与组成特征。然而,目前关于长江口及其邻近海域DOM的研究主要集中在DOC和POC的空间分布及影响因素[14-18],基于光谱分析的研究多讨论局部水域DOM的分布和荧光特征[19-21],对于长江入海FDOM在河口水域剧烈的水环境因子变化下的分布特征和影响因素还缺乏研究。本文基于对2021年11月在长江口-东海内陆架典型断面采集的水体中DOC总量测定、FDOM的3D-EEMs特征和PARAFAC分析,结合盐度、浊度、叶绿素a(chlorophyll a, Chl-a)、营养盐等水环境因子,探究FDOM在长江口咸淡水混合过程中的空间分布、组成变化及其关键影响因素。
1 材料与方法(Materials and methods)
1.1 研究区域和采样方法
2021年11月24日至11月29日,搭载近海作业船只对长江口-东海内陆架典型断面(A1~A14,位于121°E~124°E,30°N~31°N海域,图1)共计14个点位进行了为期6 d的水样采集工作。研究区域西起长江口南支南港长兴岛(A1,121°34′10″E,31°24′7″N),东至中国东海内陆架(A14,123°59′53″E,30°17′29″N),受到强烈的咸淡水混合影响,且跨越长江口最大浑浊带区域(Turbidity Maximum Zone, TMZ)。每个点位均在现场使用多参数水质检测仪(YSI probe,6600V2, Sea-Bird,美国)和浊度仪(OBS-3A,D&A,美国)测定了温度、盐度、深度、浊度和pH等水体理化参数,并采集未过滤的水体基于碘量法现场测定了溶解氧(dissolved oxygen, DO)。
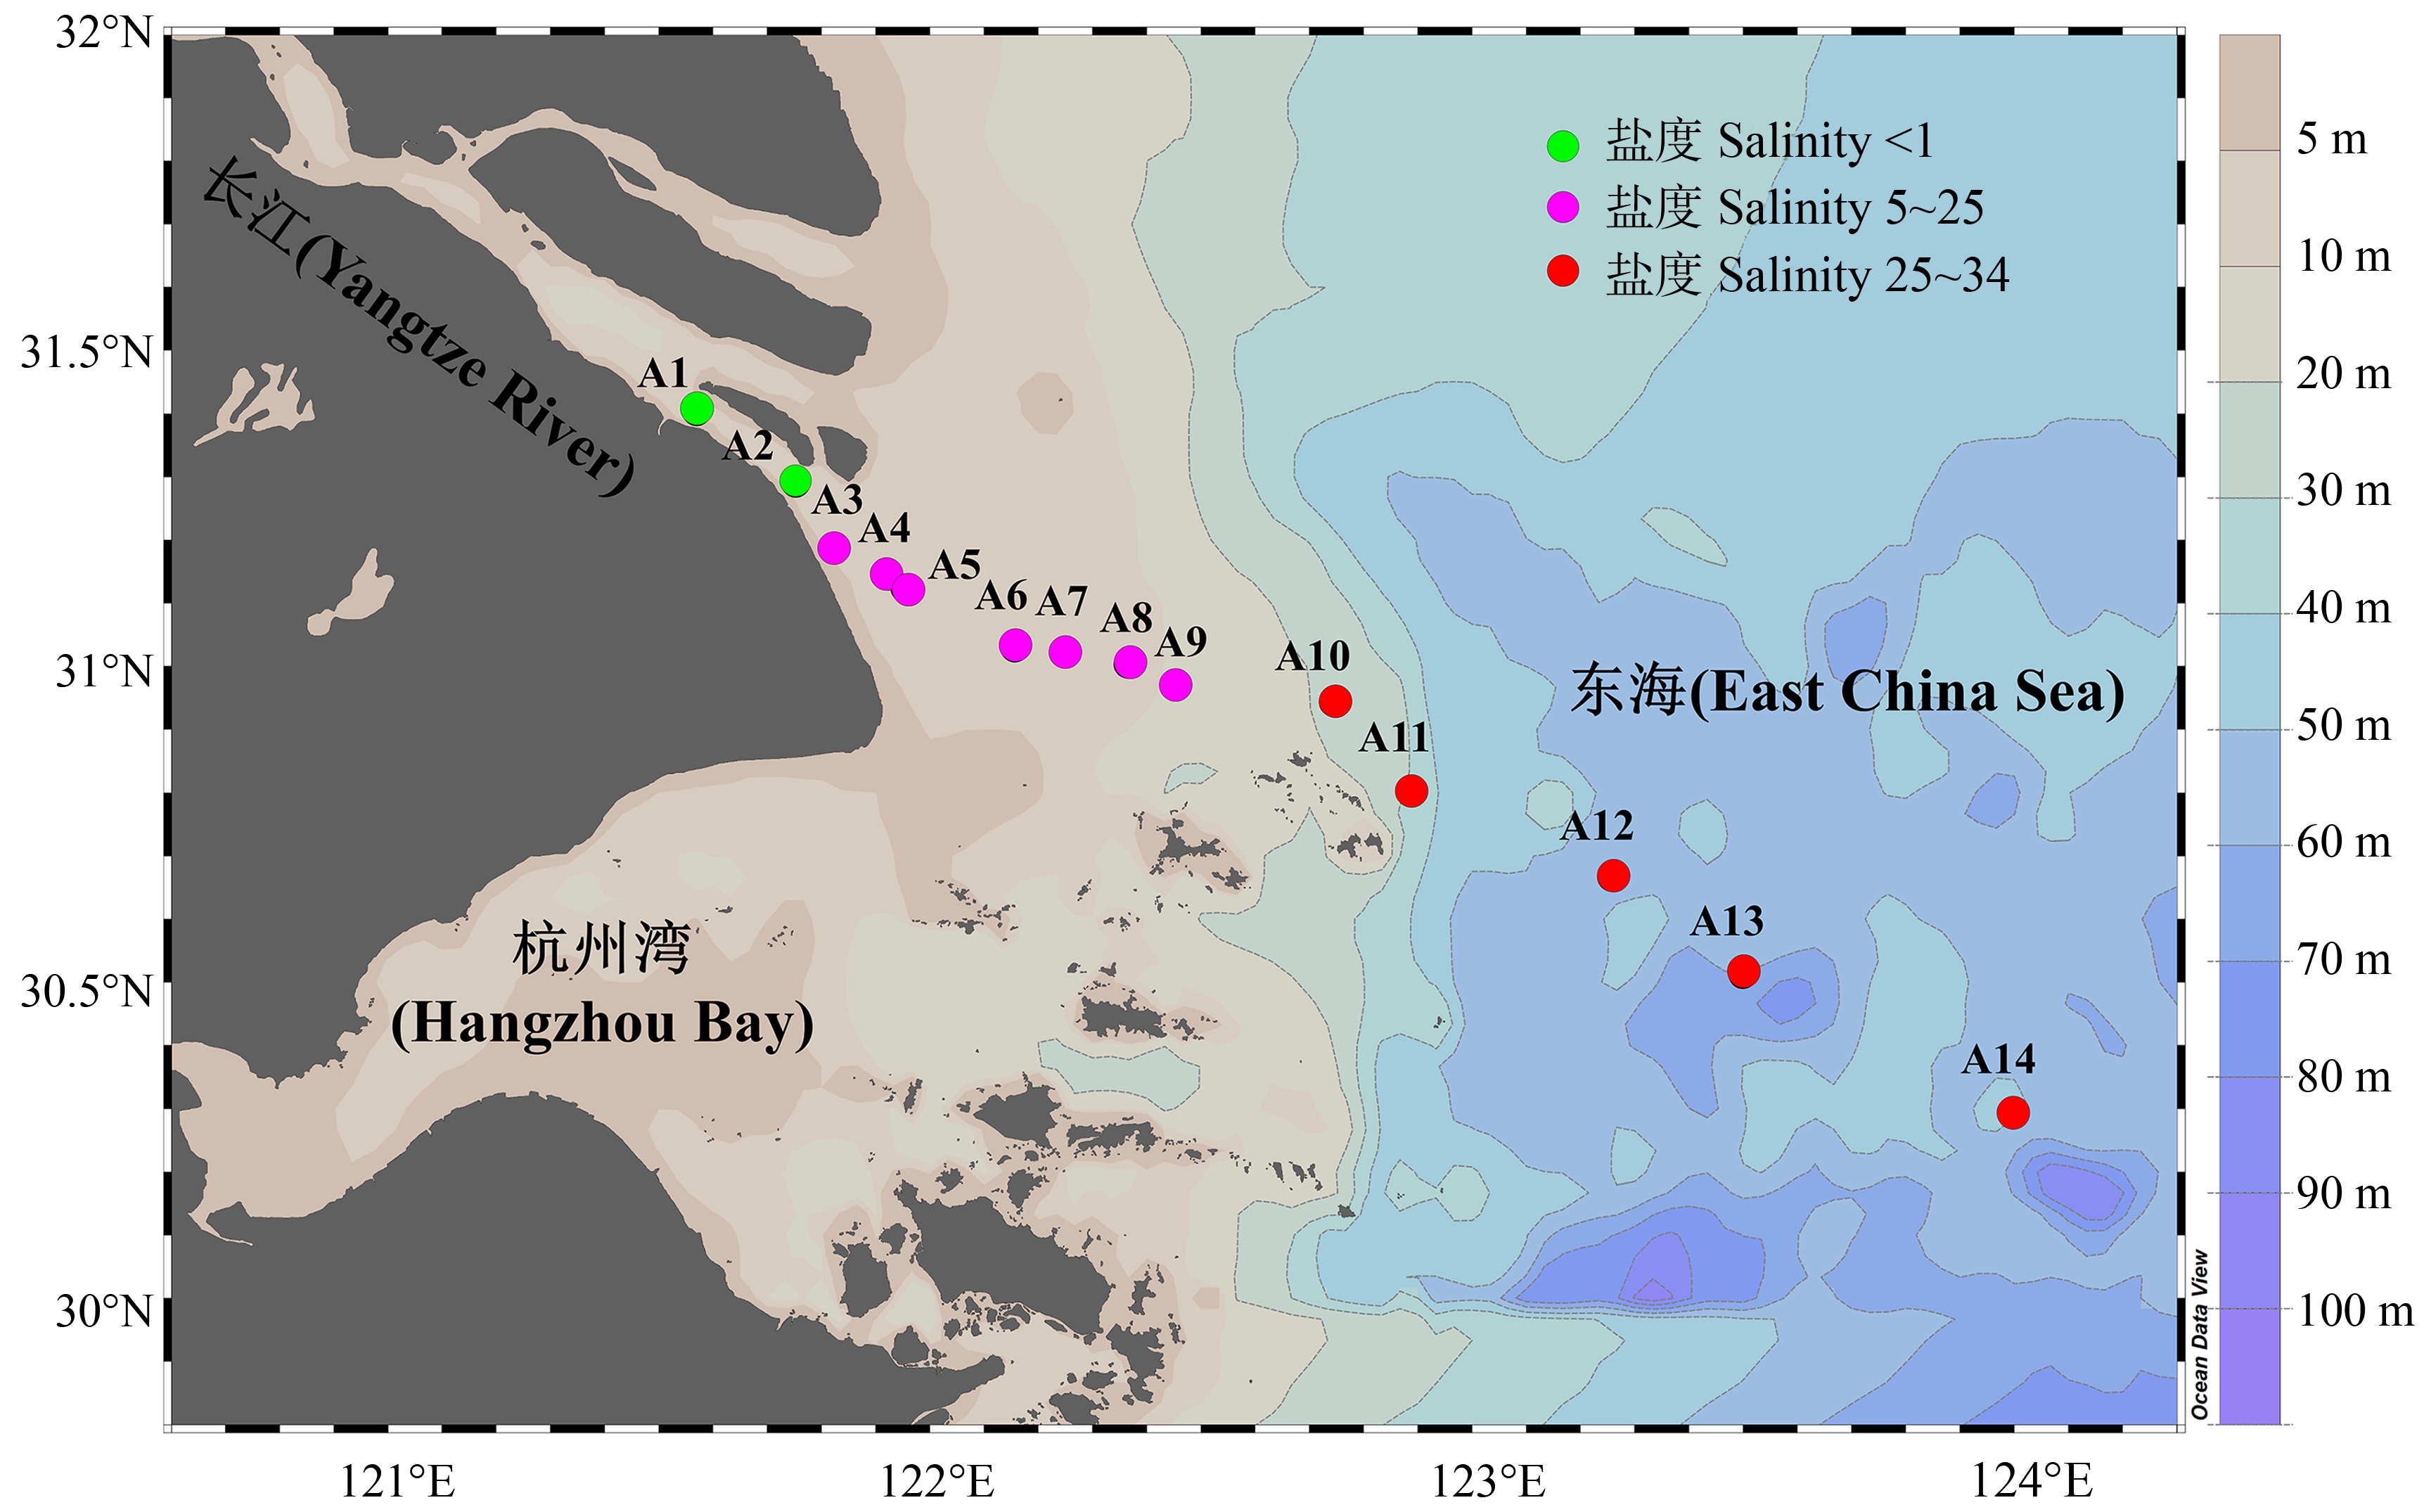
图1 长江口-东海内陆架典型断面14个采样点位分布图
Fig. 1 A map of the 14 sampling sites along the Yangtze River Estuary-East China Sea transect
每个点位用Niskin采水器采集分层水体,每层水样采集3份平行样品。在水深低于10 m的点位(A1、A3~A6),采集表层(近水面2 m处)和底层(近底部1 m处)水体样品。在水深超过10 m的点位(A2、A7~A14),分别采集表层、中层和底层3层水体样品。采样后立即使用圆盘叠片式过滤器通过预先在450 ℃下灼烧5 h的GF/F玻璃纤维滤膜(Whatman,美国)进行过滤。用于测定DOC和总溶解态氮(total dissolved nitrogen, TDN)的水样经过滤后保存在50 mL聚丙烯离心管中,-20 ℃冷冻保存直至检测。用于测定FDOM三维荧光光谱特征测定的水样经过滤后保存在40 mL棕色高硼硅玻璃瓶中,4 ℃冷藏保存至检测。用于测定营养盐的水样经过滤后保存在500 mL聚乙烯瓶中,-20 ℃冷冻保存至检测。此外,用于测定Chl-a的滤膜由表底2层的水体分别通过三联真空过滤器经GF/F玻璃纤维滤膜过滤后收集得到,随后放置于15 mL聚丙烯离心管中,-20 ℃冷冻保存至检测。
1.2 DOC、TDN、Chl-a及营养盐分析
水体中DOC和TDN浓度采用TOC-V/TN分析仪(Shimadzu,日本)基于催化燃烧方法进行测定,以邻苯二甲酸氢钾(KHP)为测定总有机碳的标准溶液绘制标准曲线,以硝酸钾(KNO3)为测定TDN的标准溶液绘制标准曲线。每10个样品进行一次重复测定,测量的重复样品间的相对标准偏差均在±3%以内。Chl-a的测定参考标准《水质叶绿素a的测定分光光度法》(HJ 897—2017),选择丙酮法进行浸泡提取,使用分光光度计于750、664、647和630 nm处测量吸光度,并根据公式计算Chl-a的浓度。溶解态无机磷(dissolved inorganic phosphate, DIP)、溶解态活性硅酸盐(dissolved inorganic silicate, DISi)和氨氮的测定参考《海洋监测规范 第4部分:海水分析》(GB 17378.4—2007)。其中,DIP的测定采用磷钼蓝分光光度法,DISi的测定采用硅钼蓝分光光度法,氨氮的测定采用次溴酸盐氧化法。硝酸盐氮的测定参考中国国家环境保护标准《水质硝酸盐氮的测定气相分子吸收光谱法》(HJ/T 198—2005)。亚硝酸盐氮的测定参考中国国家环境保护标准《水质亚硝酸盐氮的测定气相分子吸收光谱法》(HJ/T 197—2005)。溶解态无机氮(dissolved inorganic nitrogen, DIN)为氨氮、硝酸盐氮和亚硝酸盐氮之和。营养盐分析中每10个样品重复测量一次,测量的重复样品间的相对标准偏差均在±10%以内。
1.3 三维荧光光谱测定
水体中DOM的三维荧光光谱特征测定使用三维荧光光谱仪(AquaLogTM,HORIBA Jobin Yvon,法国)进行,测试条件为:采用1 cm的石英比色皿;仪器积分时间2 s;激发波长(Excitation)范围为240~500 nm,步长3 nm;发射波长(Emission)范围为210.42~619.66 nm,步长3.27 nm。每日测定样品前利用超纯水的三维荧光光谱作为空白参比。样品三维荧光光谱的扫描结果经空白扣除、内滤效应校正及拉曼散射校正后得到。
1.4 3D-EEMs的PARAFAC分析
以PARAFAC模型为理论基础,运用MATLAB R2018b软件(Mathworks,美国)使用drEEM工具箱(http://dreem.openfluor.org)对36个水样的三维荧光光谱数据进行解析,并运用非负性限制对模型进行约束,以得到合理的荧光光谱。经程序运行得到2~7个组分的模型,通过分别观察各组件光谱图初步判定其是否为荧光团或是模拟噪声,随后运行残差分析及拆半分析,最后结合MATLAB分析结果及文献数据确定得到其中4个组分模型为最终的PARAFAC分析结果。进一步对各点位各组分Fmax数据进行拉曼归一化(即Fmax除以Ex=350 nm处超纯水的拉曼峰面积,Ex=380~420 nm),处理后的Fmax单位为R.U.。
1.5 数据分析
运用Ocean Data View 5.5.2软件绘制研究区域采样点位分布图,运用Origin 2022b软件绘制DOC浓度柱状图、DOM荧光光谱等高线图、Fmax百分比堆积柱状图和参数间相关性热图等数据图。运用IBM SPSS Statistics 22软件进行DOC浓度、荧光参数与其他水体理化参数(盐度、浊度、温度、Chl-a和营养盐等)的Pearson相关系数分析。运用MATLAB R2018b软件计算荧光指数(FI)、生物源指数(BIX)和腐殖化指数(HIX),计算方法如下:
(1)FI:当Ex=370 nm时,Em在470 nm与520 nm荧光强度的比值[22];(2)BIX:当Ex=310 nm时,Em在380 nm与430 nm荧光强度的比值[23];(3)HIX:当Ex=254 nm时,Em在435~480 nm区域积分值与300~345 nm区域积分值的比值[24]。
2 结果与讨论(Results and discussion)
2.1 长江口-东海内陆架断面水环境因子变化特征
长江口-东海内陆架断面14个点位的水环境参数(包括温度、盐度、浊度、pH值、DO、Chl-a、DOC、TDN、DIP、DISi和DIN)平均值如表1所示。在长江输入的大量淡水和悬浮颗粒物的影响下,该断面呈现出巨大的盐度和浊度梯度。盐度从淡水点位到海洋点位逐渐增加,范围为0~33.7。浊度变化范围为0.22~464 NTU,且底层水的浊度(3.44~464 NTU)普遍高于表层水(0.22~108 NTU)。在长江口剧烈的咸淡水混合作用下,有3个点位(A6、A7和A8)的浊度(尤其是底层水,达到400 NTU以上)明显高于邻近的上游或下游点位,表明其位于长江口TMZ范围内[25-26]。各点位水体均呈中性至碱性,pH在7.96至8.45之间,与盐度呈显著负相关(r=-0.369,P<0.05,图2)。DO浓度范围5.54~7.59 mg·L-1,并随着盐度的增加而明显下降(r=-0.475, P<0.05,图2),且与pH呈显著正相关(r=0.480,P<0.01,图2)。底层水DO浓度(4.02~6.75 mg·L-1)普遍低于表层水(6.36~8.62 mg·L-1)。尽管我们的采样点位跨越了长江口外的夏季低氧核心区(123°E,31°N附近)[27-28],但在这次秋季调查中没有观察到低氧的点位(DO<2 mg·L-1)。该断面的TDN、DIP、DISi和DIN浓度范围分别为0.222~1.59、0.0110~0.0593、0.0067~0.142和0.113~2.64 mg·L-1,从淡水端到海洋端呈下降趋势,并与盐度均呈显著负相关(P<0.05,图2),表明长江输入是该水域营养盐的主要来源。该断面Chl-a的浓度范围为0.22~1.76 μg·L-1,与营养盐无显著关联(P>0.05,图2),但与浊度呈显著正相关(r=0.461, P<0.01, 图2),表明该断面的初级生产力不受营养盐控制,而是受到复杂的河口特征(如浊度影响下的水体透光性)影响。
表1 长江口-东海内陆架断面14个点位水环境参数(不同水层平均值)
Table 1 Water characteristics at 14 sites along the Yangtze River Estuary- East China Sea transect
(average value of different water layers)

点位Sites温度/℃Temperature/℃盐度Salinity浊度/NTUTurbidity/NTUpHDO/(mg·L-1)Chl-a/(μg·L-1)DOC/(mg·L-1)TDN/(mg·L-1)DIP/(mg·L-1)DISi/(mg·L-1)DIN/(mg·L-1)A117.00.034.58.197.590.191.761.350.05150.1421.48A216.50.081.98.077.081.151.691.320.04970.1381.67A315.46.61528.236.660.251.941.590.04700.1122.64A416.210.184.18.136.801.161.090.7730.03800.1061.75A516.612.598.38.035.680.351.290.9110.04400.1041.20A617.419.02868.067.121.761.370.7800.02900.08850.832A717.720.72188.156.570.931.360.8730.03500.1221.23A817.720.92348.105.601.021.210.6700.03230.08130.563A917.824.077.28.036.500.651.150.6320.03200.05870.556 A1018.327.928.18.085.990.220.9530.4320.03600.04100.422A1118.830.112.78.015.540.460.9440.3500.02330.03100.267A1219.832.98.088.065.880.410.8450.2220.05930.01870.153A1320.333.72.658.085.680.770.8390.2360.01130.00670.129A1420.033.71.538.085.580.341.070.2430.01100.00830.113
注:DO表示溶解氧,Chl-a表示叶绿素a,DOC表示溶解性有机碳,TDN表示总溶解态氮,DIP表示溶解态无机磷,DISi表示溶解态活性硅酸盐,DIN表示溶解态无机氮;下同。
Note: DO means dissolved oxygen, Chl-a means chlorophyll a, DOC means dissolved organic carbon, TDN means total dissolved nitrogen, DIP means dissolved inorganic phosphate, DISi means dissolved inorganic silicate and DIN means dissolved inorganic nitrogen; the same below.

图2 水环境参数间的皮尔逊相关性系数
注:*表示P<0.05;**表示P<0.01。
Fig. 2 Pearson correlation coefficients among tested water characteristics
Note: *represents P<0.05; **represents P<0.01.
2.2 长江口-东海内陆架断面DOC浓度变化特征
在长江口-东海内陆架断面14个点位水体中,DOC浓度范围为0.839~1.94 mg·L-1。其中,表层水DOC含量范围为0.682~1.94 mg·L-1,底层水DOC含量范围为0.884~1.94 mg·L-1。底层水中DOC平均含量(1.27±0.35) mg·L-1与表层水(1.26±0.34) mg·L-1无显著性差异(独立样本t检验,P=0.899)。这与2015年秋季长江口区域表底层水DOC分布趋势类似[17],而2013年夏冬季的调查结果显示,夏季表层水DOC浓度显著高于底层水,而冬季则无显著差异[18],这可能是由于秋冬季强烈的水团混合影响下水体无显著分层。总体而言,DOC浓度呈现出淡水端含量高、海水端含量低的趋势,这与之前在长江口及其邻近海域观察到的现象具有一致性[14, 17, 29]。DOC浓度在TMZ区域(尤其是在底层水中)有所上升(图3(b)),可能是由于受到TMZ区域剧烈的水团混合影响。一方面,强烈的沉积物再悬浮过程促进了孔隙水中的DOC向底层水释放;另一方面,TMZ区域悬浮颗粒往往具有更长的悬浮时间,在强烈的水动力作用下,有利于悬浮颗粒上的有机质通过解吸过程释放到水体中[30]。DOC浓度与盐度呈显著的负相关关系(r=-0.827,P<0.01,图3(c)),表明长江输送的大量溶解性有机质是该断面中DOC的主要来源,且在咸淡水混合的过程中DOC呈现出良好的保守行为,以物理混合(稀释)为主。

图3 长江口-东海内陆架断面14个点位表层水(a)及底层水(b)中DOC浓度与盐度的变化特征及其相关性(c)
Fig. 3 Spatial variations of DOC and salinity in surface water (a) and bottom water (b) at 14 sites along the
Yangtze River Estuary-East China Sea transect and their correlation (c)
2.3 长江口-东海内陆架断面DOM的荧光组分特征
在长江口-东海内陆架断面14个点位共计36个表(中)底层水样中,DOM的三维荧光光谱数据经PARAFAC解析以及残差分析和拆半分析,最终解析出4种荧光组分,包括1个类蛋白组分C1和3个类腐殖质组分(C2、C3和C4),各组分的荧光光谱如图4所示。将各荧光组分的光谱数据通过开源的光谱数据库OpenFluor[31](https://openfluor.lablicate.com)进行在线比对,各荧光组分的Ex/Em、峰类型、其他研究区域的相似组分和来源及性质等信息如表2所示。
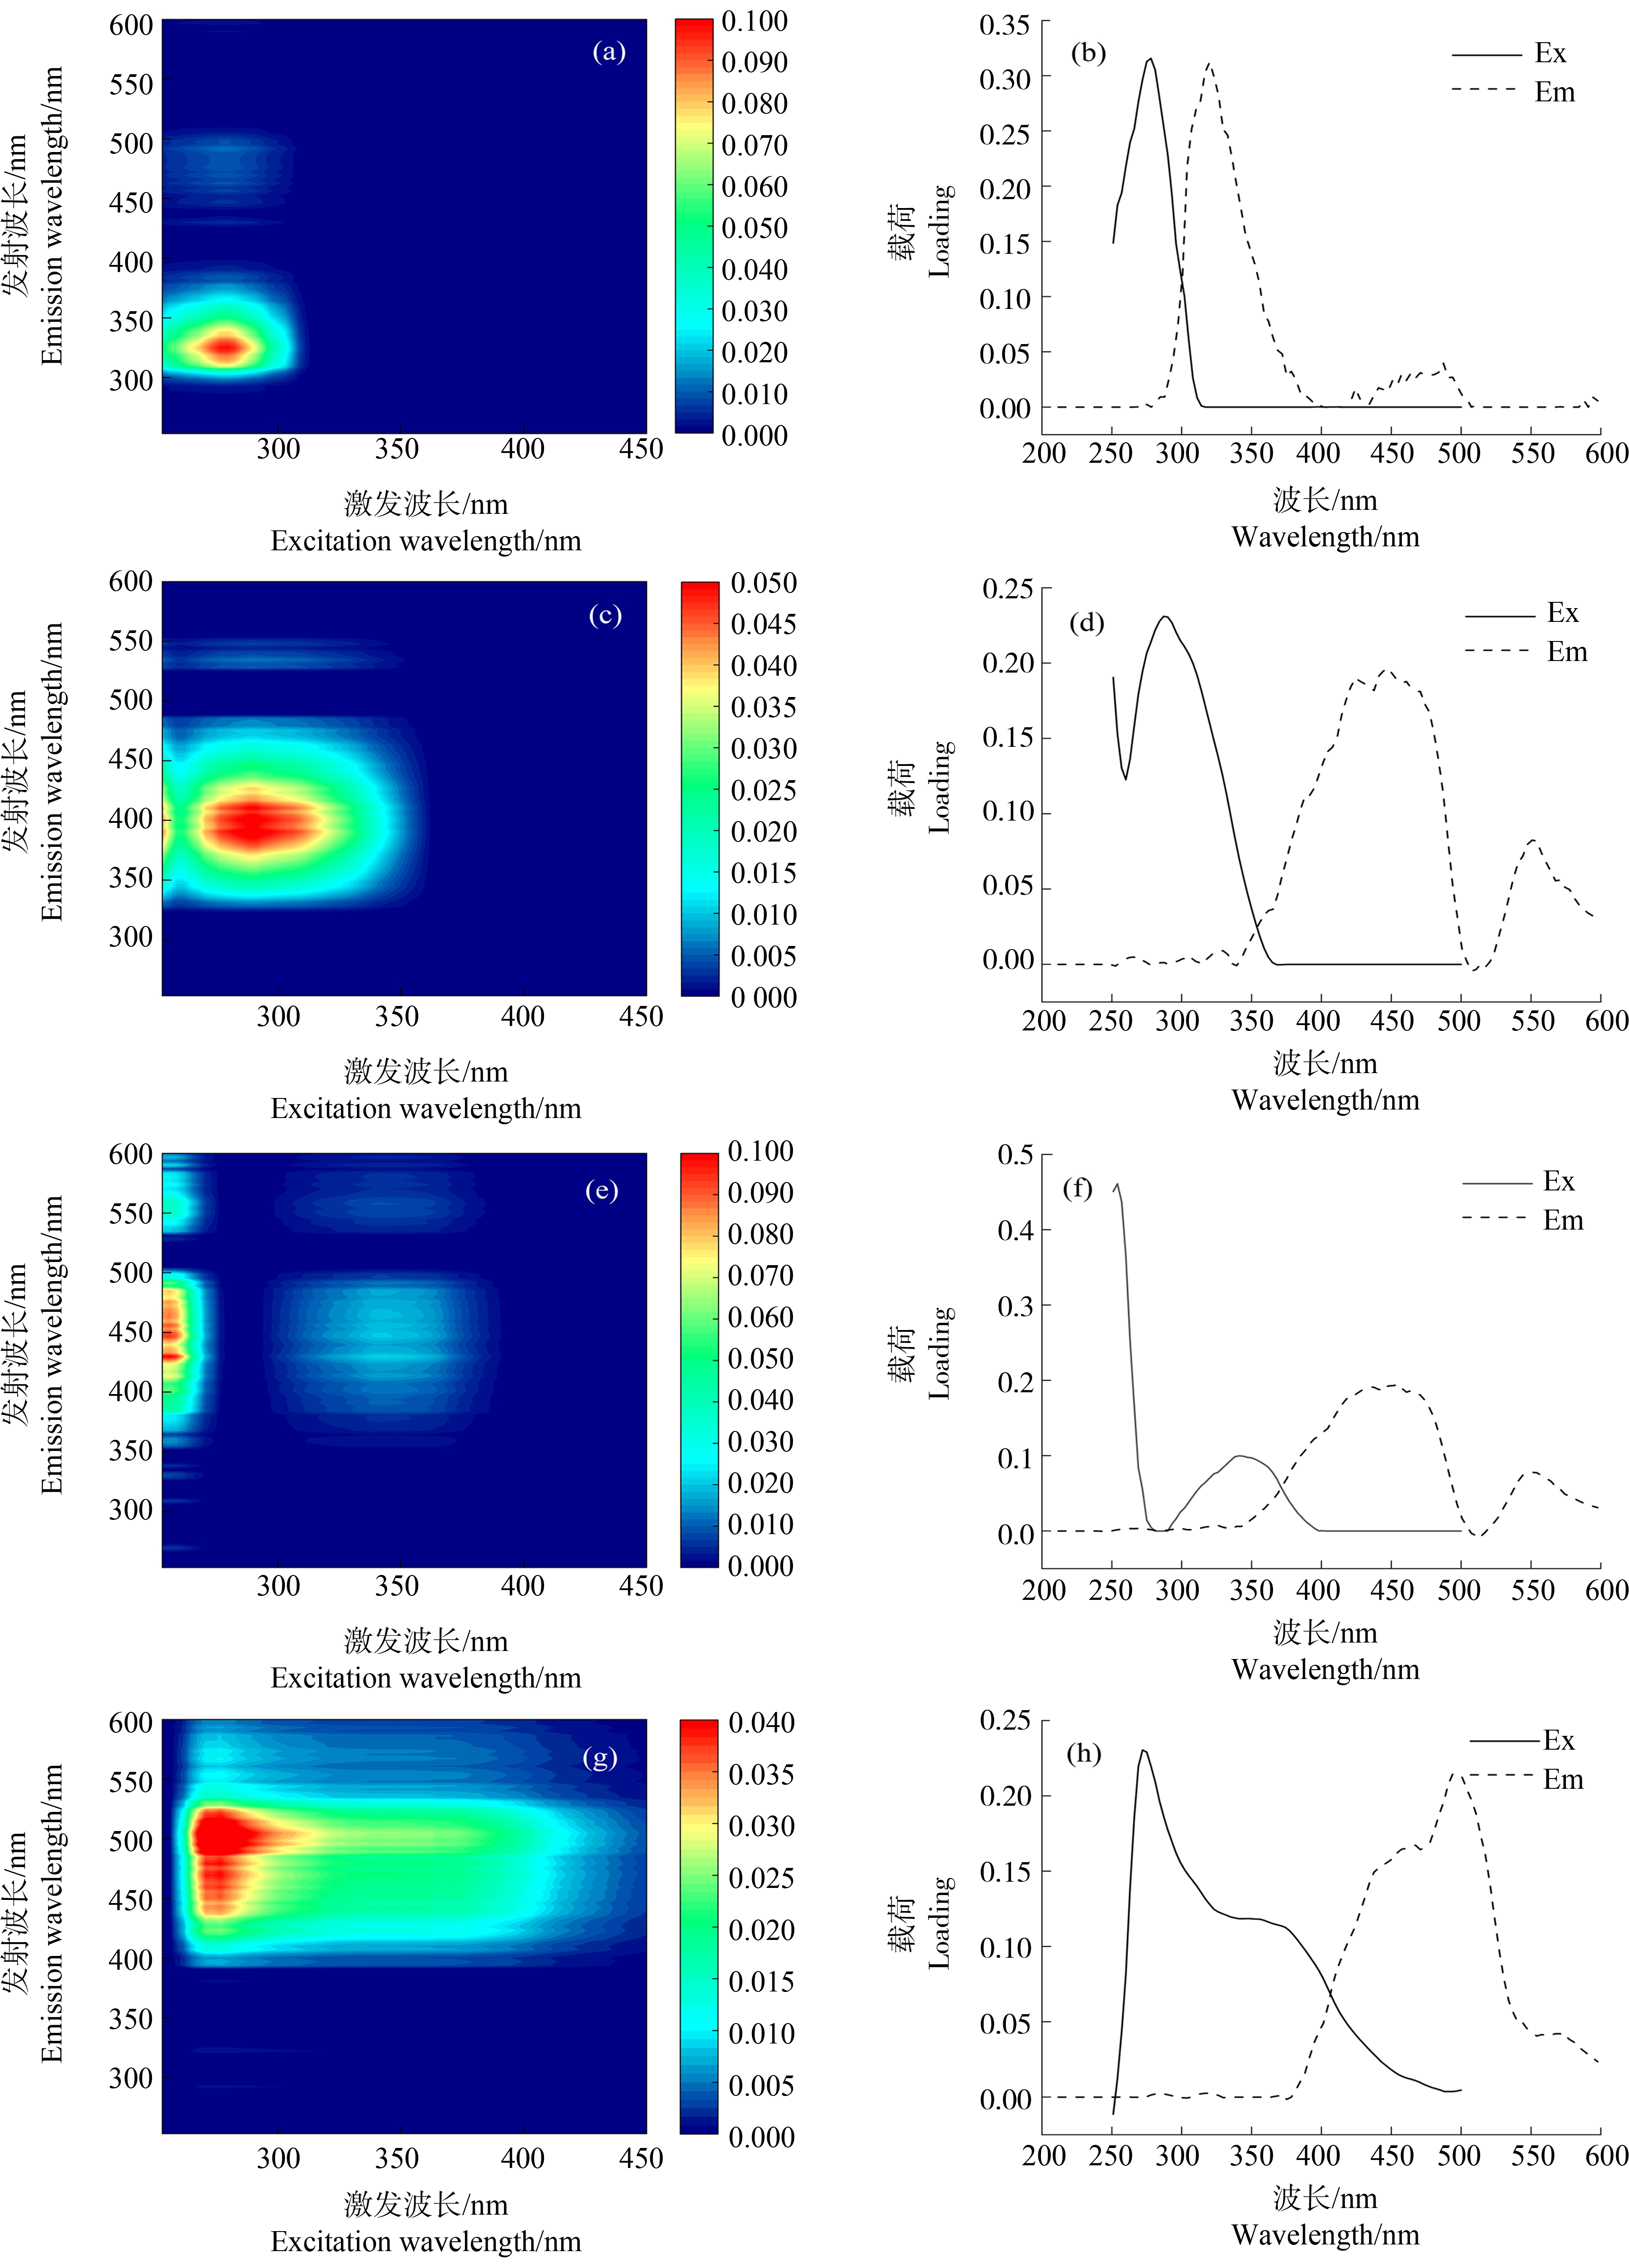
图4 长江口-东海内陆架水体DOM的4种荧光组分的荧光光谱图
注:(a)、(b)对应C1组分;(c)、(d)对应C2组分;(e)、(f)对应C3组分;(g)、(h)对应C4组分。
Fig. 4 Fluorescence spectra of four fluorescence components of DOM along the Yangtze River Estuary-East China Sea transect
Note: (a) & (b) refer to C1 component; (c) & (d) refer to C2 component; (e) & (f) refer to C3 component; (g) & (h) refer to C4 component.
表2 长江口-东海内陆架水体溶解性有机质(DOM)的4种荧光组分特征
Table 2 Characteristics of four fluorescence components of dissolved organic matter (DOM) along
Yangtze River Estuary-East China Sea transect

组分ComponentEx/Em/nm峰[6]Peak[6]相似组分Similar components性质及来源[6, 38]Characteristics and sources[6, 38]C1278/320BC1[33],C4[10],C4[34],C5[35]UVB类蛋白,类络氨酸,自生源UVB protein-like substances, tyrosine-like substances, autogenous sourcesC2290/385MC4[39],C1[42],C5[43],C1[44],C2[10]UVA类腐殖质,海洋源或微生物源,农业或废水来源UVA humic-like substances, derived from marine or microbial sources, or from agricultural or wastewater sourcesC3254(341)/424A+CC2[35],C4[40],C1[10]UVC类腐殖质,陆源UVC humic-like substances, terrestrial sourcesC4275/501C2[33],C1[41],C3[10]UVA类腐殖质,富里酸,陆源UVA humic-like, fulvic acid, terrestrial sources
注:Ex表示激发波长;Em表示发射波长;UVA表示紫外线辐射A;UVB表示紫外线辐射B;UVC表示紫外线辐射C。
Note: Ex means excitation; Em means emission; UVA means ultraviolet radiation A; UVB means ultraviolet radiation B; UVC means ultraviolet radiation C.
目前自然水体中已鉴定出8种不同类型的有机质荧光组分[6, 32]。C1(Ex/Em:278/320)的荧光峰普遍被认为是B峰(Ex/Em:275/305)所在位置,一般被识别为类蛋白或类络氨酸物质,由浮游植物或微生物原位产生,易被微生物利用而降解。在我国长江口及其邻近海域[33]、闽江下游及闽江河口[10]、鄱阳湖流域[34],以及加拿大北冰洋海岸[35]等河流湖泊、河口海岸及海洋中广泛分布。C2(Ex/Em:290/385)的荧光峰位置在M峰(Ex/Em:(290~310)/(370~410))范围内,属于UVA类腐殖质,相较于UVC类腐殖质更易被光降解[36-37]。M峰通常被认为是海洋源类腐殖质[32],也被认为是农业或废水来源的人为源类腐殖酸[38],或是微生物来源类腐殖酸[39]。C3(Ex/Em:254(341)/424)的荧光峰类似于A峰(Ex/Em:260/(400~460))和C峰(Ex/Em:(320~360)/(420~460))的组合,均属于陆源的UVC类腐殖质。在长江口及其邻近海域曾报道过相似的组分(C2,Ex/Em:271(355)/474)[33],但可能由于季节差异,与本次调查测定中C3组分的荧光光谱相比稍有红移。此外,我国闽江下游及河口区域[10]、加拿大北冰洋海岸[35]和科楚奇海域[40]都有相似组分的发现。C4(Ex/Em:275/501)的荧光峰位置被识别为UVA类腐殖酸(类富里酸),主要为外来源(陆源)。在长江口及其邻近海域[33]、闽江下游及闽江河口[10]乃至东北太平洋区域均有发现[41]。
2.4 长江口-东海内陆架咸淡水混合对DOM荧光特征的影响
长江口-东海内陆架断面水体种4种荧光组分的荧光强度均呈现出淡水端高、海水端低的分布趋势(除A1外,图5),且荧光组分C1(r=-0.790,P<0.01)、C2(r=-0.956,P<0.01)、C3(r=-0.962,P<0.01)、C4(r=-0.959,P<0.01)的荧光强度最大值(Fmax)均与盐度呈显著负相关关系(表3),表明该区域的DOM主要源于长江输入。然而,类蛋白组分C1和类腐殖质组分(C2、C3和C4)与盐度的相关性存在一定差异。类腐殖质组分的Fmax均随盐度梯度呈线性下降趋势(r>0.95,P<0.01,图5(b)~(d)),表明主要受长江源输入的类腐殖质在咸淡水混合过程中的稀释效应影响。在中低盐度区域(0~20),类蛋白组分的荧光强度随盐度上升而急剧下降,表明主要受到长江源C1组分的稀释效应控制。在高盐度区域(20~34),类蛋白组分荧光强度则几乎保持不变(图5(a)),表明长江口外水域存在较为稳定的海洋自生源类蛋白贡献,这可能是因为长江口外水域较高的初级生产力促进了浮游植物及微生物的生命活动,进而产生大量类蛋白物质[45-46]。
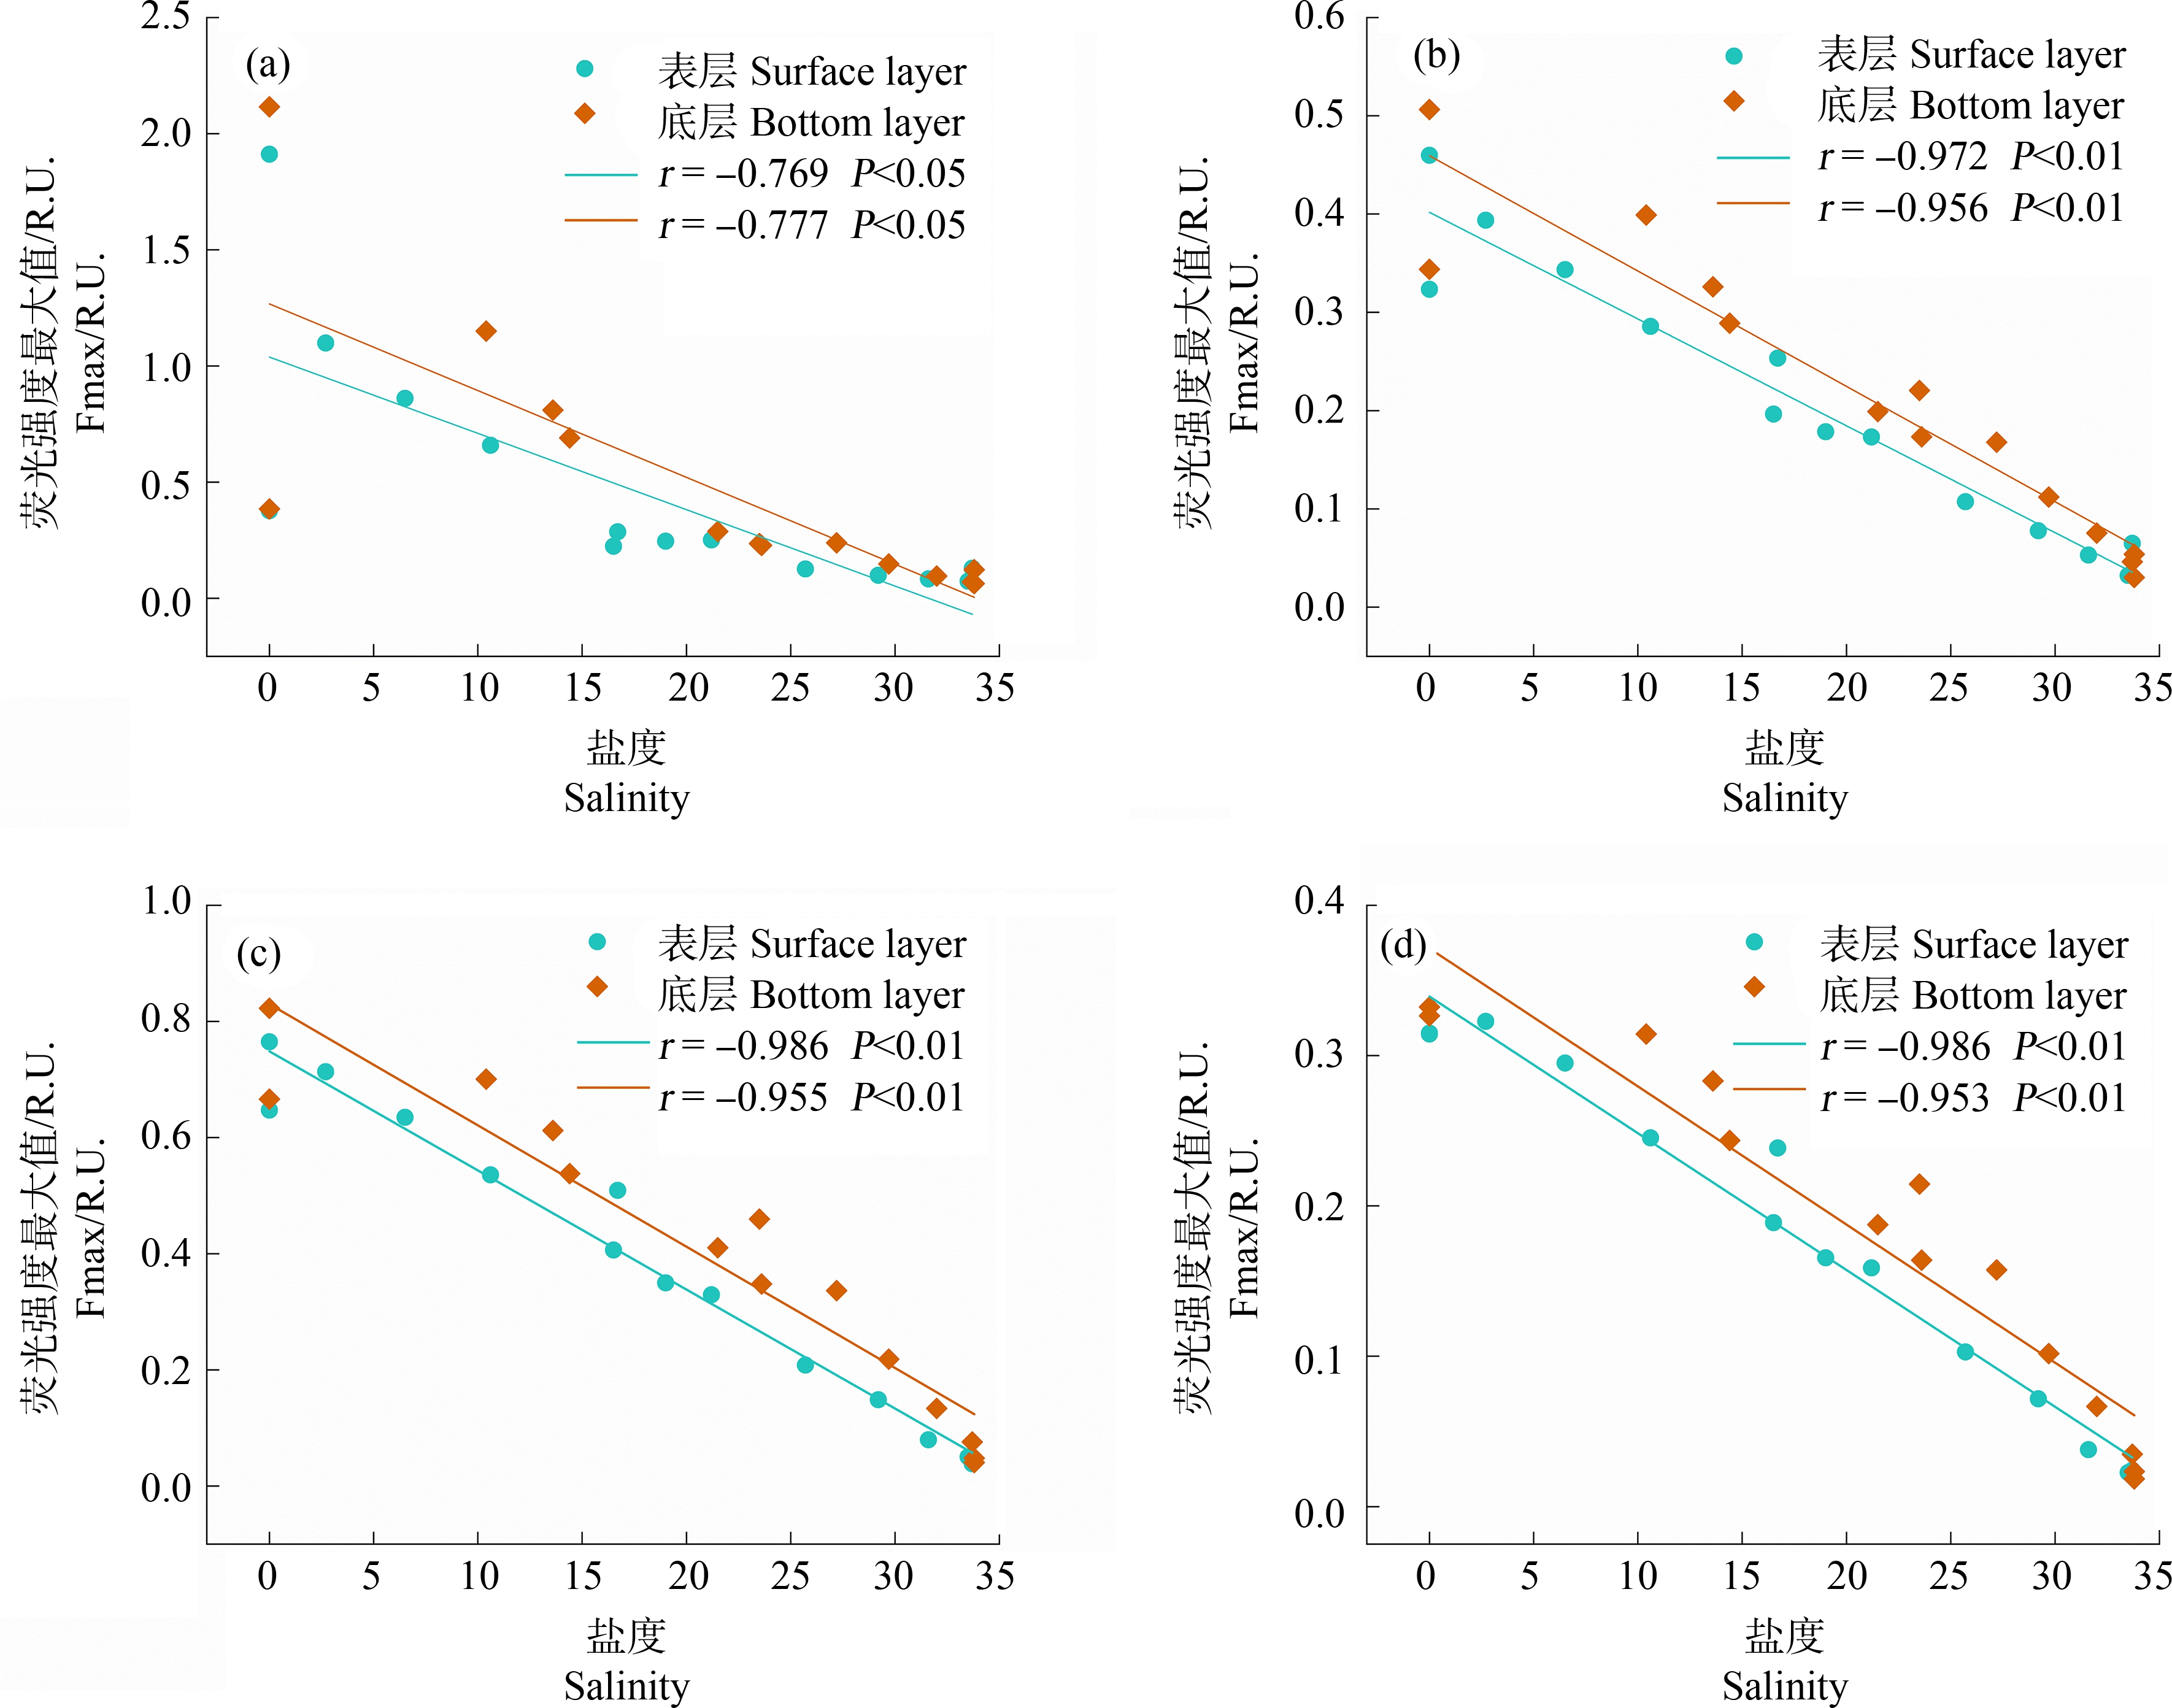
图5 盐度对C1(a)、C2(b)、C3(c)和C4(d)4个组分Fmax的影响
Fig. 5 Impact of salinity on Fmax of C1(a), C2(b), C3(c), and C4(d) components
表3 4种组分荧光参数与水体理化参数的相关性系数
Table 3 Correlation coefficients between fluorescence parameters of four components
and physicochemical parameters of water
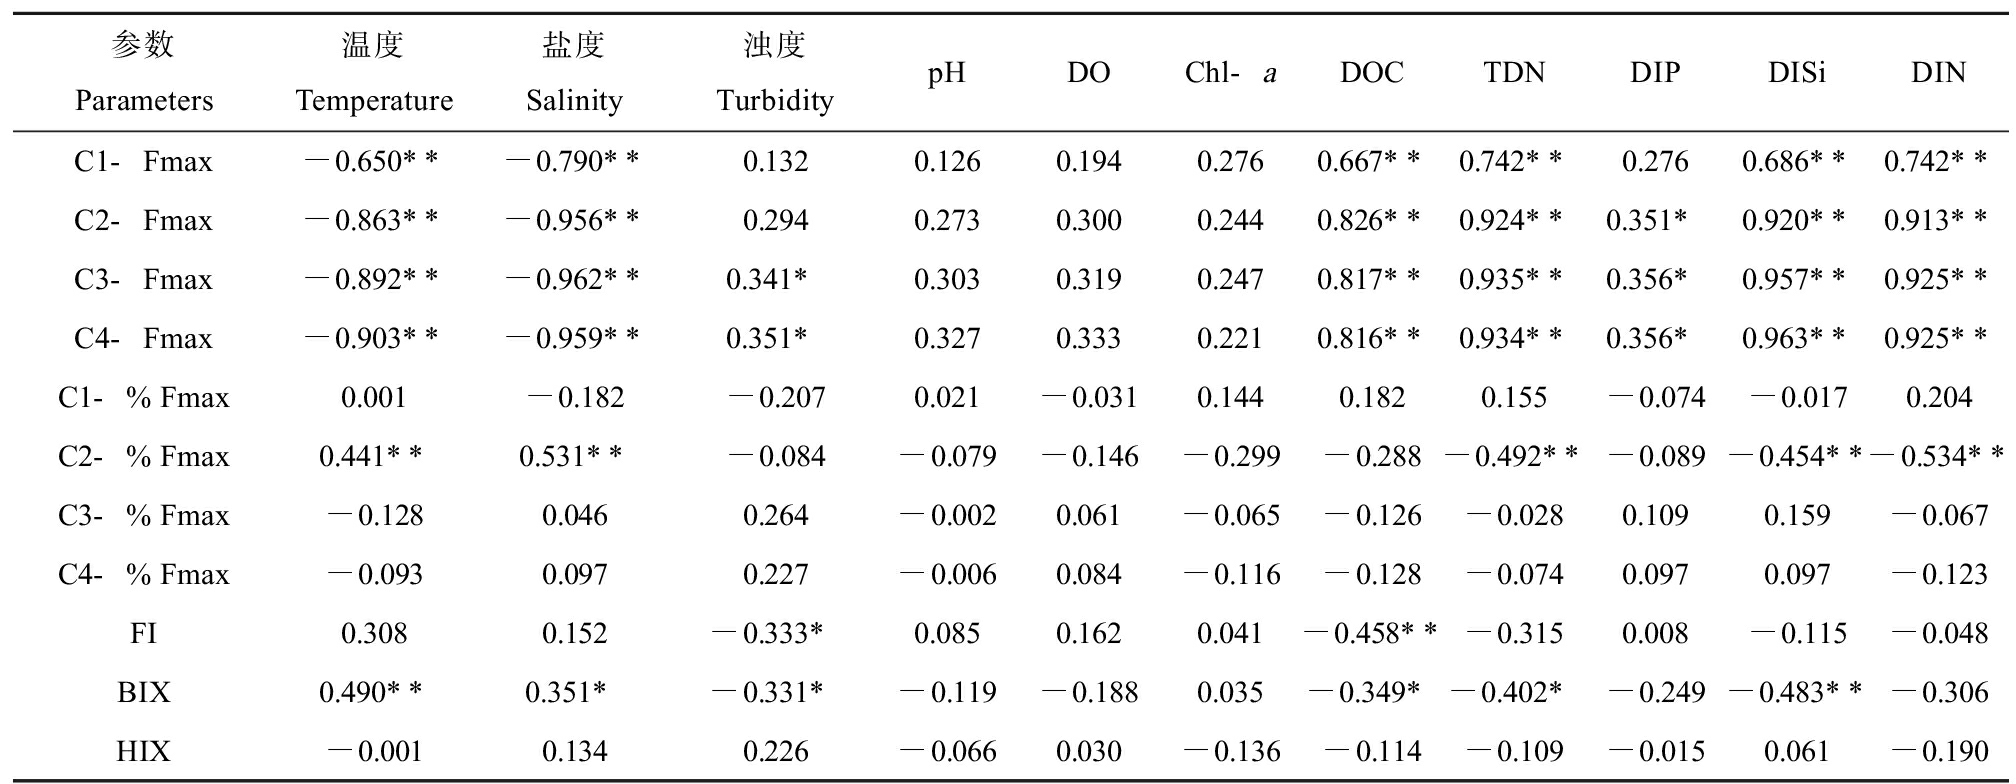
参数Parameters温度Temperature盐度Salinity浊度TurbiditypHDOChl-aDOCTDNDIPDISiDINC1-Fmax-0.650**-0.790**0.1320.1260.1940.2760.667**0.742**0.2760.686**0.742**C2-Fmax-0.863**-0.956**0.2940.2730.3000.2440.826**0.924**0.351*0.920**0.913**C3-Fmax-0.892**-0.962**0.341*0.3030.3190.2470.817**0.935**0.356*0.957**0.925**C4-Fmax-0.903**-0.959**0.351*0.3270.3330.2210.816**0.934**0.356*0.963**0.925**C1-%Fmax0.001-0.182-0.2070.021-0.0310.1440.1820.155-0.074-0.0170.204C2-%Fmax0.441**0.531**-0.084-0.079-0.146-0.299-0.288-0.492**-0.089-0.454**-0.534**C3-%Fmax-0.1280.0460.264-0.0020.061-0.065-0.126-0.0280.1090.159-0.067C4-%Fmax-0.0930.0970.227-0.0060.084-0.116-0.128-0.0740.0970.097-0.123FI0.3080.152-0.333*0.0850.1620.041-0.458**-0.3150.008-0.115-0.048BIX0.490**0.351*-0.331*-0.119-0.1880.035-0.349*-0.402*-0.249-0.483**-0.306HIX-0.0010.1340.226-0.0660.030-0.136-0.114-0.109-0.0150.061-0.190
注:Fmax表示荧光强度最大值,%Fmax表示各组分Fmax占总Fmax的比例,FI表示荧光指数,BIX表示生物源指数,HIX表示腐殖化指数;**P<0.01、*P<0.05。
Note: Fmax means fluorescence intensity maximum, %Fmax means the ratio of Fmax of each component to the total Fmax, FI means fluorescence index, BIX means biological index, and HIX means humification index; *represents P<0.05, and **represents P<0.01.
将长江口-东海内陆架断面的14个点位根据离岸距离、盐度和浊度等参数划分为低盐度区域(A1~A5)、最大浑浊带区域(A6~A9)和高盐度区域(A10~A14)。4种荧光组分均在低盐度区域具有较高的荧光强度(图6(a)~(b)),尤其是类蛋白组分C1在A2点位观测到比邻近点位高出2倍~5倍的荧光强度。这一现象可能是因为该点位(121.75°E,31.29°N)紧邻上海市大型综合污水厂白龙港污水处理厂排污口,而城市污水中类蛋白质(类络氨酸)含量较高且T峰峰形较宽并发生明显红移现象[47],导致位于其附近的A2点位具有相对较高浓度和比例的类络氨酸物质C1[48]。由于类蛋白质相比类腐殖质易被微生物降解[49-50],随着距排污口的距离增加,C1组分在低盐度区域(A2~A5)的相对浓度和占比不断降低(图6)。从最大浑浊带淡水端到海洋端,类腐殖质组分(C2、C3和C4)的相对占比之和总体呈现下降趋势(图6(c)~(d)),而类蛋白组分的占比有所提升,这表明陆源贡献逐渐降低而海洋贡献逐渐增强。具体而言,表层水中类腐殖质组分从A6点位的78%降低到A14点位的50%,底层水中类腐殖质从A6点位的73%降低到A14点位的60%,这可能与浊度的降低增强了类腐殖质的光降解有关[51]。
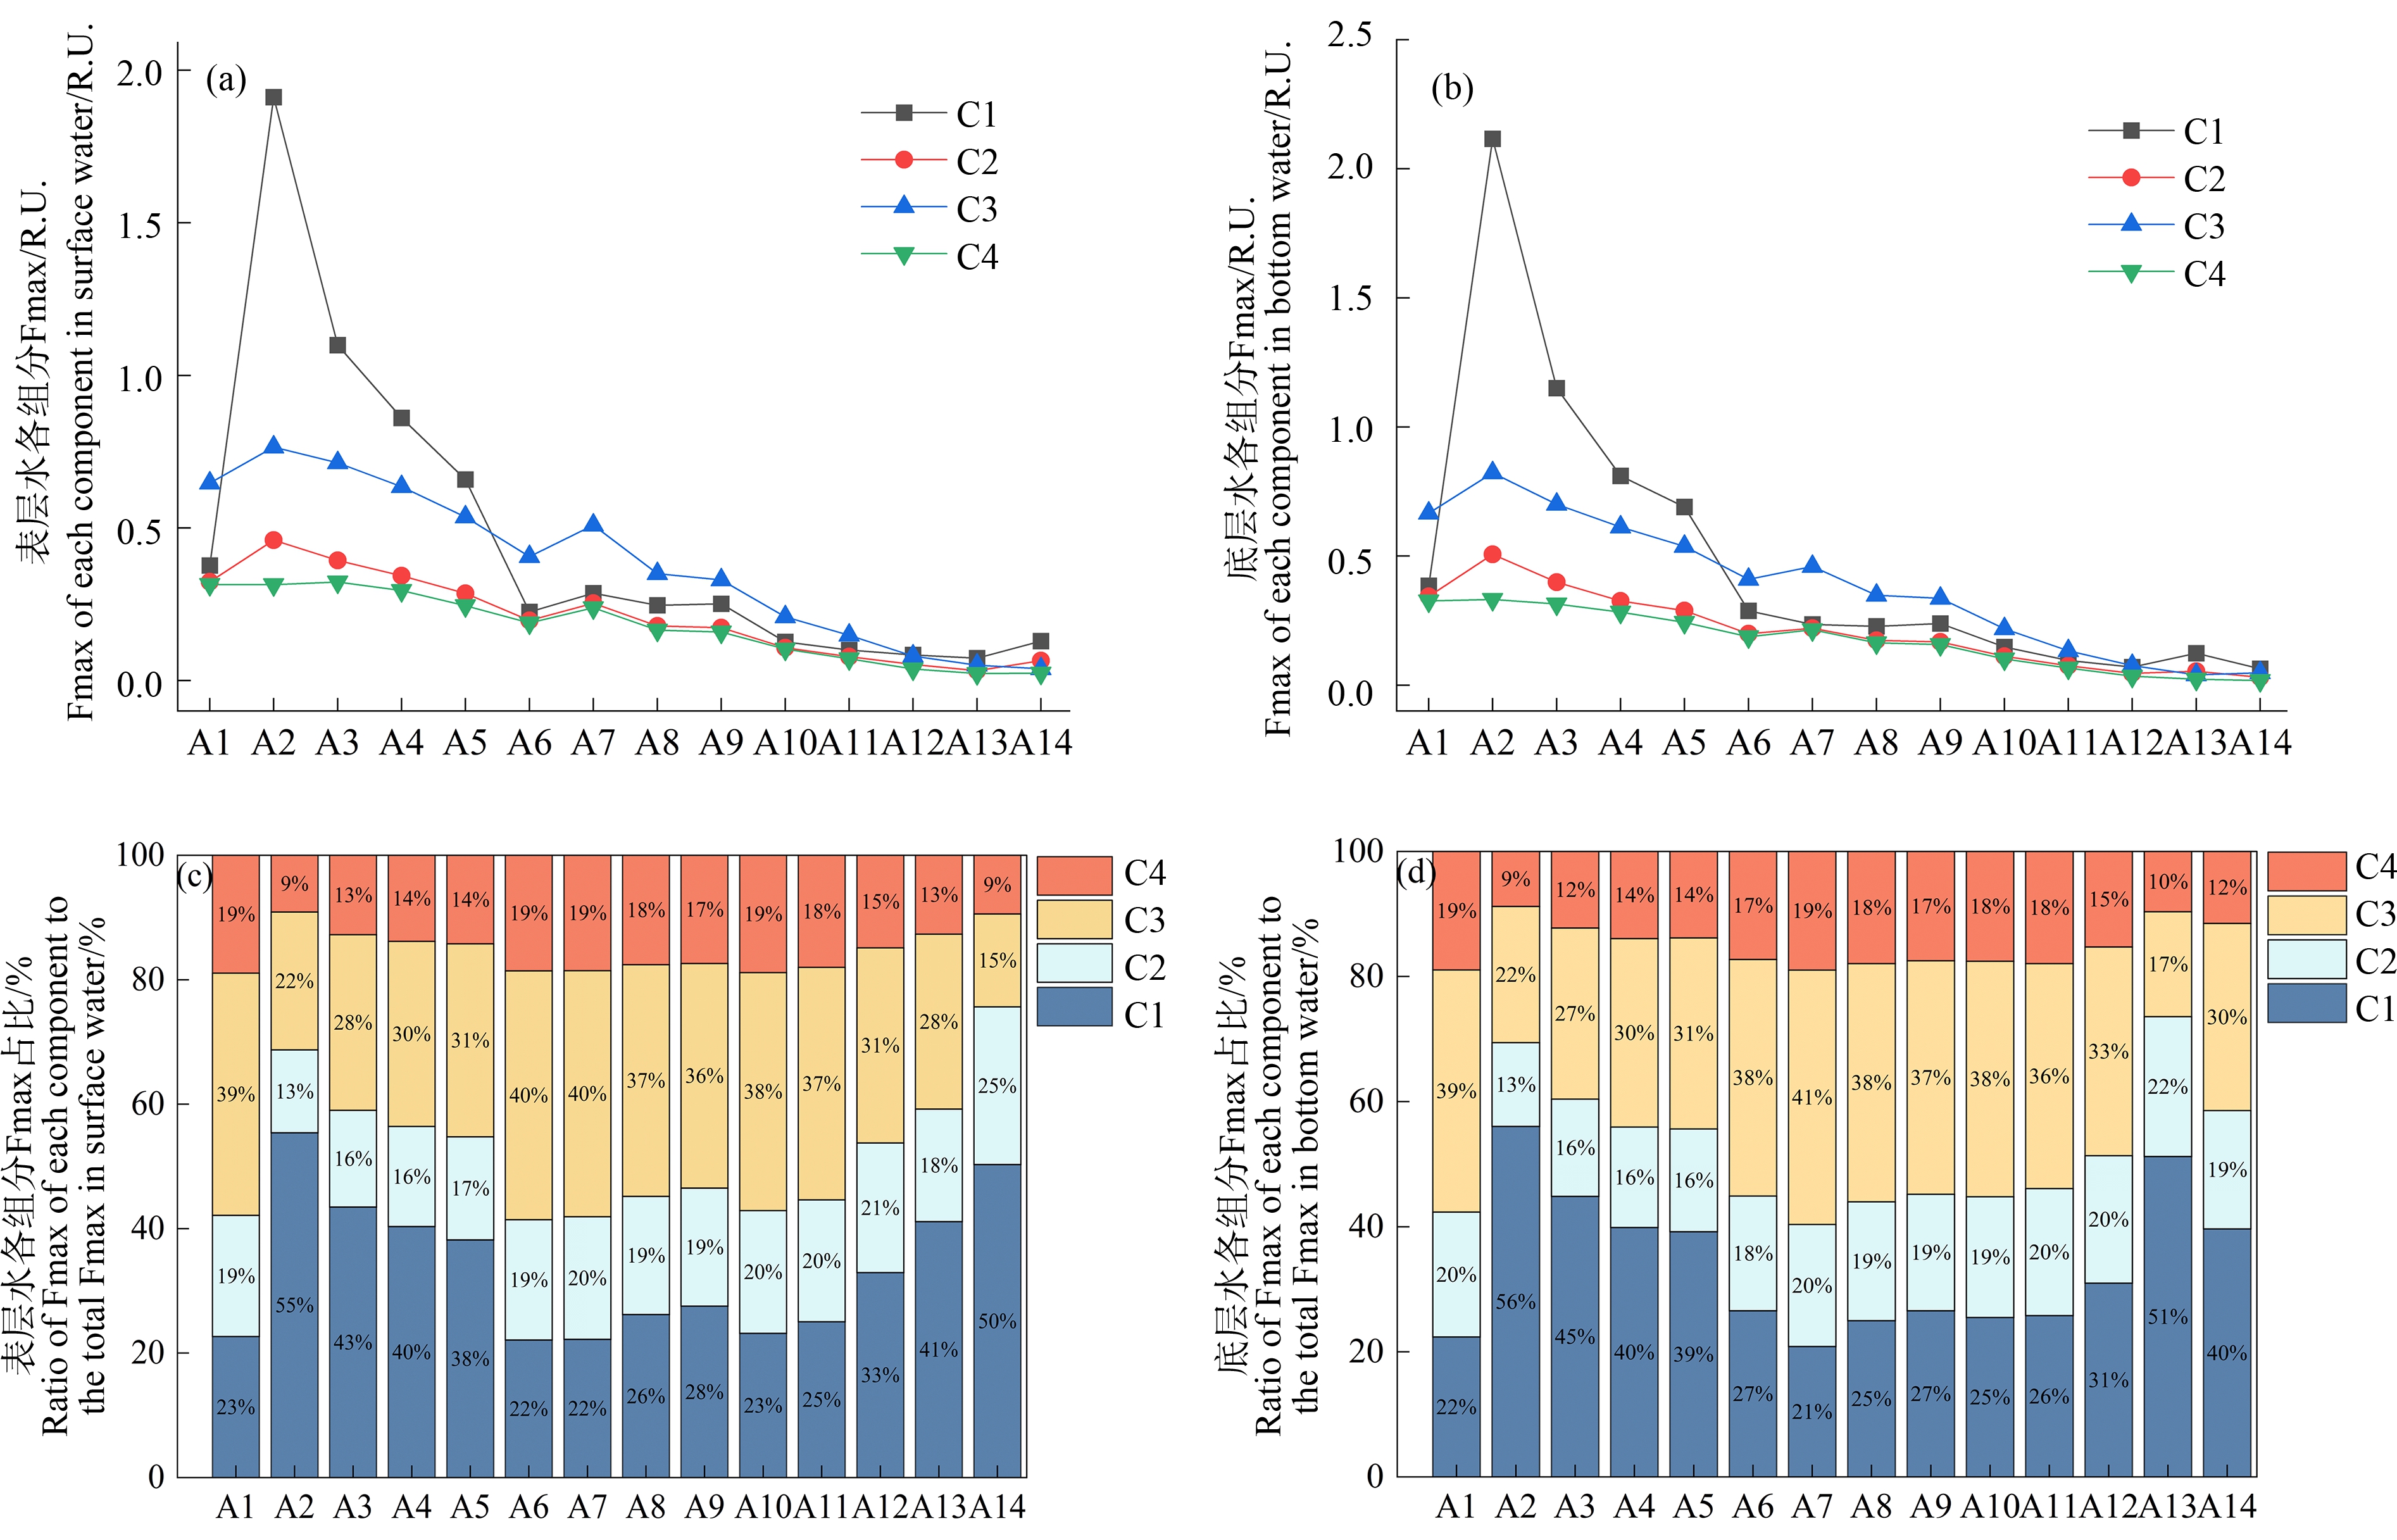
图6 长江口-东海内陆架水体DOM中4种荧光组分的荧光强度及占比的变化
Fig. 6 Fluorescence intensity and proportion in four fluorescence components of DOM along
the Yangtze River Estuary-East China Sea transect
荧光指数(FI)可以表征FDOM中腐殖质的来源,FI>1.9表明微生物代谢为主要来源,FI<1.4则表明陆源为主要来源[52]。在长江口-东海内陆架断面14个点位中,表层水FDOM的FI均介于1.4~1.9之间,且不同点位差异不大(图7(a)),表明微生物源和陆源均对腐殖质有所贡献。大多数点位底层水FDOM的FI也介于1.4~1.9之间,但A3点位FI<1.4(图7(b)),表明该区域腐殖质主要来源于微生物代谢。生物源指数(BIX)可以表征FDOM自生来源的相对贡献,BIX>1表示生物活动产生的内源性FDOM占主要贡献,BIX为0.6~0.7说明以外源输入为主[23]。腐殖化指数(HIX)表征DOM的腐殖化程度,HIX>10说明有显著的腐殖质特征,HIX<4说明DOM的腐殖质特征较弱。长江口-东海内陆架断面表层水体BIX范围为0.8~1.3,其中A2、A12、A13和A14点位BIX>1,表明这些点位的FDOM主要来自微生物等生物活动相关的内源性贡献,而其他点位主要以外源输入为主(图7(a))。底层水BIX值变化特征和表层水基本一致。虽然该断面水体HIX值在不同点位差异较大,但均处于4以下,表明长江口水域DOM的腐殖化程度总体较低(图7(b))。

图7 长江口-东海内陆架断面表层(a)、底层(b)水体DOM荧光特征参数的空间变化
注:FI表示荧光指数;BIX表示生物源指数;HIX表示腐殖化指数。
Fig. 7 Spatial variations of DOM fluorescence characteristic parameters in surface (a) and bottom (b) water along
the Yangtze River Estuary-East China Sea transect
Note: FI means fluorescence index; BIX means biological index; HIX means humification index.
[1] Leenheer J A, Croué J P. Characterizing aquatic dissolved organic matter [J]. Environmental Science & Technology, 2003, 37(1): 18A-26A
[2] Chen W, Westerhoff P, Leenheer J A, et al. Fluorescence excitation-emission matrix regional integration to quantify spectra for dissolved organic matter [J]. Environmental Science & Technology, 2003, 37(24): 5701-5710
[3] 谢冰心, 王姝, 孙辉, 等. 溶解性有机质对持久性有机污染物环境行为的影响研究进展[J]. 环境污染与防治, 2020, 42(12): 1563-1568
Xie B X, Wang S, Sun H, et al. Impacts of dissolved organic matter on the environmental behavior of persistent organic pollutants: A review [J]. Environmental Pollution & Control, 2020, 42(12): 1563-1568 (in Chinese)
[4] Ravichandran M. Interactions between mercury and dissolved organic matter—A review [J]. Chemosphere, 2004, 55(3): 319-331
[5] 胡释尹, 李非里, 方小满. 溶解性有机质对自然水体中重金属生物有效性评价的影响[J]. 环境科学与技术, 2016, 39(1): 27-31, 120
Hu S Y, Li F L, Fang X M. Effect of dissolved organic matter in evaluating heavy metals bioavailability in natural water [J]. Environmental Science & Technology, 2016, 39(1): 27-31, 120 (in Chinese)
[6] Coble P G. Marine optical biogeochemistry: The chemistry of ocean color [J]. Chemical Reviews, 2007, 107(2): 402-418
[7] 孙语嫣, 白莹, 苏荣国, 等. 长江口及邻近海域春夏季有色溶解有机物时空分布特征及主要影响因素[J]. 环境科学, 2017, 38(5): 1863-1872
Sun Y Y, Bai Y, Su R G, et al. Assessment of the spatial-temporal distribution characteristics and main affecting factors of chromophoric dissolved organic matter in spring and summer at the Changjiang Estuary and adjacent areas [J]. Environmental Science, 2017, 38(5): 1863-1872 (in Chinese)
[8] 范诗雨, 秦纪洪, 刘堰杨, 等. 岷江上游水体中DOM光谱特征的季节变化[J]. 环境科学, 2018, 39(10): 4530-4538
Fan S Y, Qin J H, Liu Y Y, et al. Seasonal variations of DOM spectral characteristics in the surface water of the upstream Minjiang River [J]. Environmental Science, 2018, 39(10): 4530-4538 (in Chinese)
[9] 倪茂飞, 周慧, 马永梅, 等. 典型喀斯特城市湖库溶解性有机质成分特征及来源解析[J]. 环境科学, 2022, 43(7): 3552-3561
Ni M F, Zhou H, Ma Y M, et al. Dissolved organic matter component and source characteristics of the metropolitan lakes and reservoirs in a typical Karst region [J]. Environmental Science, 2022, 43(7): 3552-3561 (in Chinese)
[10] Yang L Y, Cheng Q, Zhuang W E, et al. Seasonal changes in the chemical composition and reactivity of dissolved organic matter at the land-ocean interface of a subtropical river [J]. Environmental Science and Pollution Research International, 2019, 26(24): 24595-24608
[11] Wang X C, Ma H Q, Li R H, et al. Seasonal fluxes and source variation of organic carbon transported by two major Chinese Rivers: The Yellow River and Changjiang (Yangtze) River [J]. Global Biogeochemical Cycles, 2012, 26(2): GB2025
[12] Ning X, Lin C, Su J, et al. Long-term changes of dissolved oxygen, hypoxia, and the responses of the ecosystems in the East China Sea from 1975 to 1995 [J]. Journal of Oceanography, 2011, 67(1): 59-75
[13] 刘承莹, 王锐, 高航, 等. 夏季长江口—东海陆架大中型浮游生物分布特征及影响因素[J]. 同济大学学报(自然科学版), 2021, 49(10): 1363-1373, 1350
Liu C Y, Wang R, Gao H, et al. Distribution and factors influencing macro- and meso-plankton in the Yangtze River Estuary-East China Sea continental shelf in summer [J]. Journal of Tongji University (Natural Science), 2021, 49(10): 1363-1373, 1350 (in Chinese)
[14] 张淑坤, 明玥, 高磊. 2020年夏季长江流域特大洪水期间长江口POC和DOC的分布特征[J]. 海洋环境科学, 2022, 41(5): 653-659
Zhang S K, Ming Y, Gao L. Distributions of POC and DOC in the Changjiang (Yangtze) River Estuary in response to the extreme flood occurring in the river basin in summer of 2020 [J]. Marine Environmental Science, 2022, 41(5): 653-659 (in Chinese)
[15] 马琳, 明玥, 高磊. 长江口及其邻近海域溶解无机碳的分布与转化[J]. 海洋科学进展, 2021, 39(4): 557-569
Ma L, Ming Y, Gao L. Distributions and transformations of dissolved inorganic carbon in the Changjiang (Yangtze River) Estuary and its adjacent sea area [J]. Advances in Marine Science, 2021, 39(4): 557-569 (in Chinese)
[16] 叶君, 姚鹏, 徐亚宏, 等. 长江口盐度梯度下不同形态碳的分布、来源与混合行为[J]. 海洋学报, 2019, 41(4): 15-26
Ye J, Yao P, Xu Y H, et al. Distribution, sources and mixing behavior of different carbon species along a salinity gradient in the Changjiang Estuary [J]. Haiyang Xuebao, 2019, 41(4): 15-26 (in Chinese)
[17] 张珊珊, 线薇微, 梁翠. 2015年秋季长江口有机碳的分布特征及其影响因素[J]. 海洋环境科学, 2018, 37(1): 55-61
Zhang S S, Xian W W, Liang C. Distribution characteristics of total organic carbon and influence factors in the Yangtze River Estuary in autumn 2015 [J]. Marine Environmental Science, 2018, 37(1): 55-61 (in Chinese)
[18] 王腾, 刘广鹏, 朱礼鑫, 等. 长江口邻近海域冬、夏季溶解有机碳分布特征及影响因子研究[J]. 海洋通报, 2014, 33(5): 533-540
Wang T, Liu G P, Zhu L X, et al. Distribution and controlling factors of the dissolved organic carbon in the adjacent sea area of the Yangtze Estuary in winter and summer [J]. Marine Science Bulletin, 2014, 33(5): 533-540 (in Chinese)
[19] 闫丽红, 陈学君, 苏荣国, 等. 2010年秋季长江口口外海域CDOM的三维荧光光谱-平行因子分析[J]. 环境科学, 2013, 34(1): 51-60
Yan L H, Chen X J, Su R G, et al. Resolving characteristic of CDOM by excitation-emission matrix spectroscopy combined with parallel factor analysis in the seawater of outer Yangtze Estuary in autumn in 2010 [J]. Environmental Science, 2013, 34(1): 51-60 (in Chinese)
[20] 吕丽莎, 赵卫红, 苗辉. 三维荧光结合平行因子分析在东海溶解有机物研究中的应用[J]. 光谱学与光谱分析, 2013, 33(3): 653-658
Lv L S, Zhao W H, Miao H. Application of excitation-emission matrix spectrum combined with parallel factor analysis in dissolved organic matter in East China Sea [J]. Spectroscopy and Spectral Analysis, 2013, 33(3): 653-658 (in Chinese)
[21] 顾丽军, 杨毅, 刘敏, 等. 长江口滨岸及近海水体中胶体的分布和理化性质研究[J]. 环境科学, 2013, 34(11): 4195-4203
Gu L J, Yang Y, Liu M, et al. Distribution and physicochemical properties of aquatic colloids in the Yangtze estuarine and coastal ecosystem [J]. Environmental Science, 2013, 34(11): 4195-4203 (in Chinese)
[22] Maie N, Parish K J, Watanabe A, et al. Chemical characteristics of dissolved organic nitrogen in an oligotrophic subtropical coastal ecosystem [J]. Geochimica et Cosmochimica Acta, 2006, 70(17): 4491-4506
[23] Huguet A, Vacher L, Relexans S, et al. Properties of fluorescent dissolved organic matter in the Gironde Estuary [J]. Organic Geochemistry, 2009, 40(6): 706-719
[24] Zsolnay A, Baigar E, Jimenez M, et al. Differentiating with fluorescence spectroscopy the sources of dissolved organic matter in soils subjected to drying [J]. Chemosphere, 1999, 38(1): 45-50
[25] Jiang X Z, Lu B, He Y H. Response of the turbidity maximum zone to fluctuations in sediment discharge from river to estuary in the Changjiang Estuary (China) [J]. Estuarine, Coastal and Shelf Science, 2013, 131: 24-30
[26] Wu J X, Liu J T, Wang X. Sediment trapping of turbidity maxima in the Changjiang Estuary [J]. Marine Geology, 2012, 303-306: 14-25
[27] Chen C C, Gong G C, Shiah F K. Hypoxia in the East China Sea: One of the largest coastal low-oxygen areas in the world [J]. Marine Environmental Research, 2007, 64(4): 399-408
[28] Chi L B, Song X X, Yuan Y Q, et al. Distribution and key influential factors of dissolved oxygen off the Changjiang River Estuary (CRE) and its adjacent waters in China [J]. Marine Pollution Bulletin, 2017, 125(1-2): 440-450
[29] 高源, 明玥, 高磊. 2019年长江口及其邻近海域溶解有机物的分布和季节变化特征[J]. 海洋环境科学, 2022, 41(1): 40-47
Gao Y, Ming Y, Gao L. Distributions and seasonal variations of dissolved organic matter (DOM) in the Changjiang (Yangtze River) Estuary and its adjacent area in 2019 [J]. Marine Environmental Science, 2022, 41(1): 40-47 (in Chinese)
[30] 张龙军, 宫萍, 张向上. 河口有机碳研究综述[J]. 中国海洋大学学报(自然科学版), 2005, 35(5): 737-744, 842
Zhang L J, Gong P, Zhang X S. A review of the study of estuarine organic carbon [J]. Journal of Ocean University of Qingdao, 2005, 35(5): 737-744, 842 (in Chinese)
[31] Murphy K R, Stedmon C A, Wenig P, et al. OpenFluor—An online spectral library of auto-fluorescence by organic compounds in the environment [J]. Analytical Methods, 2014, 6(3): 658-661
[32] Coble P G, Del Castillo C E, Avril B. Distribution and optical properties of CDOM in the Arabian Sea during the 1995 Southwest Monsoon [J]. Deep Sea Research Part Ⅱ: Topical Studies in Oceanography, 1998, 45(10-11): 2195-2223
[33] Li P H, Chen L, Zhang W, et al. Spatiotemporal distribution, sources, and photobleaching imprint of dissolved organic matter in the Yangtze Estuary and its adjacent sea using fluorescence and parallel factor analysis [J]. PLoS One, 2015, 10(6): e0130852
[34] Huang X, Yan C X, Nie M H, et al. Effect of colloidal fluorescence properties on the complexation of chloramphenicol and carbamazepine to the natural aquatic colloids [J]. Chemosphere, 2022, 286(Pt 1): 131604
[35] Guéguen C, Itoh M, Kikuchi T, et al. Variability in dissolved organic matter optical properties in surface waters in the Amerasian Basin [J]. Frontiers in Marine Science, 2015, 2: 78
[36] 陈子健, 黄国城, 孟凡刚. 不同分子尺寸溶解性有机物的光解行为研究[J]. 化学通报, 2018, 81(3): 236-240
Chen Z J, Huang G C, Meng F G. Photochemical degradation of the size-fractionated dissolved organic matter [J]. Chemistry, 2018, 81(3): 236-240 (in Chinese)
[37] 孙欣, 宋贵生, Xie Huixiang. 长江口溶解有机物光漂白和光矿化表观量子产率[J]. 海洋学报, 2016, 38(4): 120-129
Sun X, Song G S, Xie H X. The apparent quantum yields of dissolved organic matter photobleaching and photomineralization in the Changjiang River Estuary [J]. Haiyang Xuebao, 2016, 38(4): 120-129 (in Chinese)
[38] Stedmon C A, Markager S. Resolving the variability in dissolved organic matter fluorescence in a temperate estuary and its catchment using PARAFAC analysis [J]. Limnology and Oceanography, 2005, 50(2): 686-697
[39] Wauthy M, Rautio M, Christoffersen K S, et al. Increasing dominance of terrigenous organic matter in circumpolar freshwaters due to permafrost thaw [J]. Limnology and Oceanography Letters, 2018, 3(3): 186-198
[40] Chen M L, Jung J, Lee Y K, et al. Surface accumulation of low molecular weight dissolved organic matter in surface waters and horizontal off-shelf spreading of nutrients and humic-like fluorescence in the Chukchi Sea of the Arctic Ocean [J]. The Science of the Total Environment, 2018, 639: 624-632
[41] Catalá T S, Reche I, Fuentes-Lema A, et al. Turnover time of fluorescent dissolved organic matter in the dark global ocean [J]. Nature Communications, 2015, 6: 5986
[42] Dainard P G, Guéguen C, Yamamoto-Kawai M, et al. Interannual variability in the absorption and fluorescence characteristics of dissolved organic matter in the Canada Basin polar mixed waters [J]. Journal of Geophysical Research: Oceans, 2019, 124(7): 5258-5269
[43] Lapierre J F, del Giorgio P A. Partial coupling and differential regulation of biologically and photochemically labile dissolved organic carbon across boreal aquatic networks [J]. Biogeosciences, 2014, 11(20): 5969-5985
[44] Chen Y L, Sun K, Sun H R, et al. Photodegradation of pyrogenic dissolved organic matter increases bioavailability: Novel insight into bioalteration, microbial community succession, and C and N dynamics [J]. Chemical Geology, 2022, 605: 120964
[45] Zhang Y L, van Dijk M A, Liu M L, et al. The contribution of phytoplankton degradation to chromophoric dissolved organic matter (CDOM) in eutrophic shallow lakes: Field and experimental evidence [J]. Water Research, 2009, 43(18): 4685-4697
[46] 解李娜, 周斌, 刘梦, 等. 长江口及邻近海域有色溶解有机物的分布及河口混合行为的季节变化研究[J]. 海洋学报, 2021, 43(4): 27-45
Xie L N, Zhou B, Liu M, et al. Seasonal variability of distribution and mixing behavior of chromophoric dissolved organic matter in the Changjiang River Estuary and adjacent areas [J]. Haiyang Xuebao, 2021, 43(4): 27-45 (in Chinese)
[47] 祁延明, 程艳, 李琳, 等. 西北内陆城市污水DOM特征及尾水对河流影响[J]. 环境科学与技术, 2022, 45(7): 87-95
Qi Y M, Cheng Y, Li L, et al. The DOM spectral characteristics of different types of sewage in and out of the inland urban section of northwest China and the influence of tail water on discharge rivers [J]. Environmental Science & Technology, 2022, 45(7): 87-95 (in Chinese)
[48] Sun X N, Li P H, Zhou Y P, et al. Linkages between optical and molecular signatures of dissolved organic matter along the Yangtze River Estuary-to-East China Sea Continuum [J]. Frontiers in Marine Science, 2022, 9: 933561
[49] Fellman J B, D’Amore D V, Hood E, et al. Fluorescence characteristics and biodegradability of dissolved organic matter in forest and wetland soils from coastal temperate watersheds in southeast Alaska [J]. Biogeochemistry, 2008, 88(2): 169-184
[50] Stedmon C A, Markager S. Tracing the production and degradation of autochthonous fractions of dissolved organic matter by fluorescence analysis [J]. Limnology and Oceanography, 2005, 50(5): 1415-1426
[51] Zhou Y P, Zhao C, He C, et al. Characterization of dissolved organic matter processing between surface sediment porewater and overlying bottom water in the Yangtze River Estuary [J]. Water Research, 2022, 215: 118260
[52] Cory R M, McKnight D M. Fluorescence spectroscopy reveals ubiquitous presence of oxidized and reduced quinones in dissolved organic matter [J]. Environmental Science & Technology, 2005, 39(21): 8142-8149