-

图 1 研究范围
Figure 1. Research scope
-
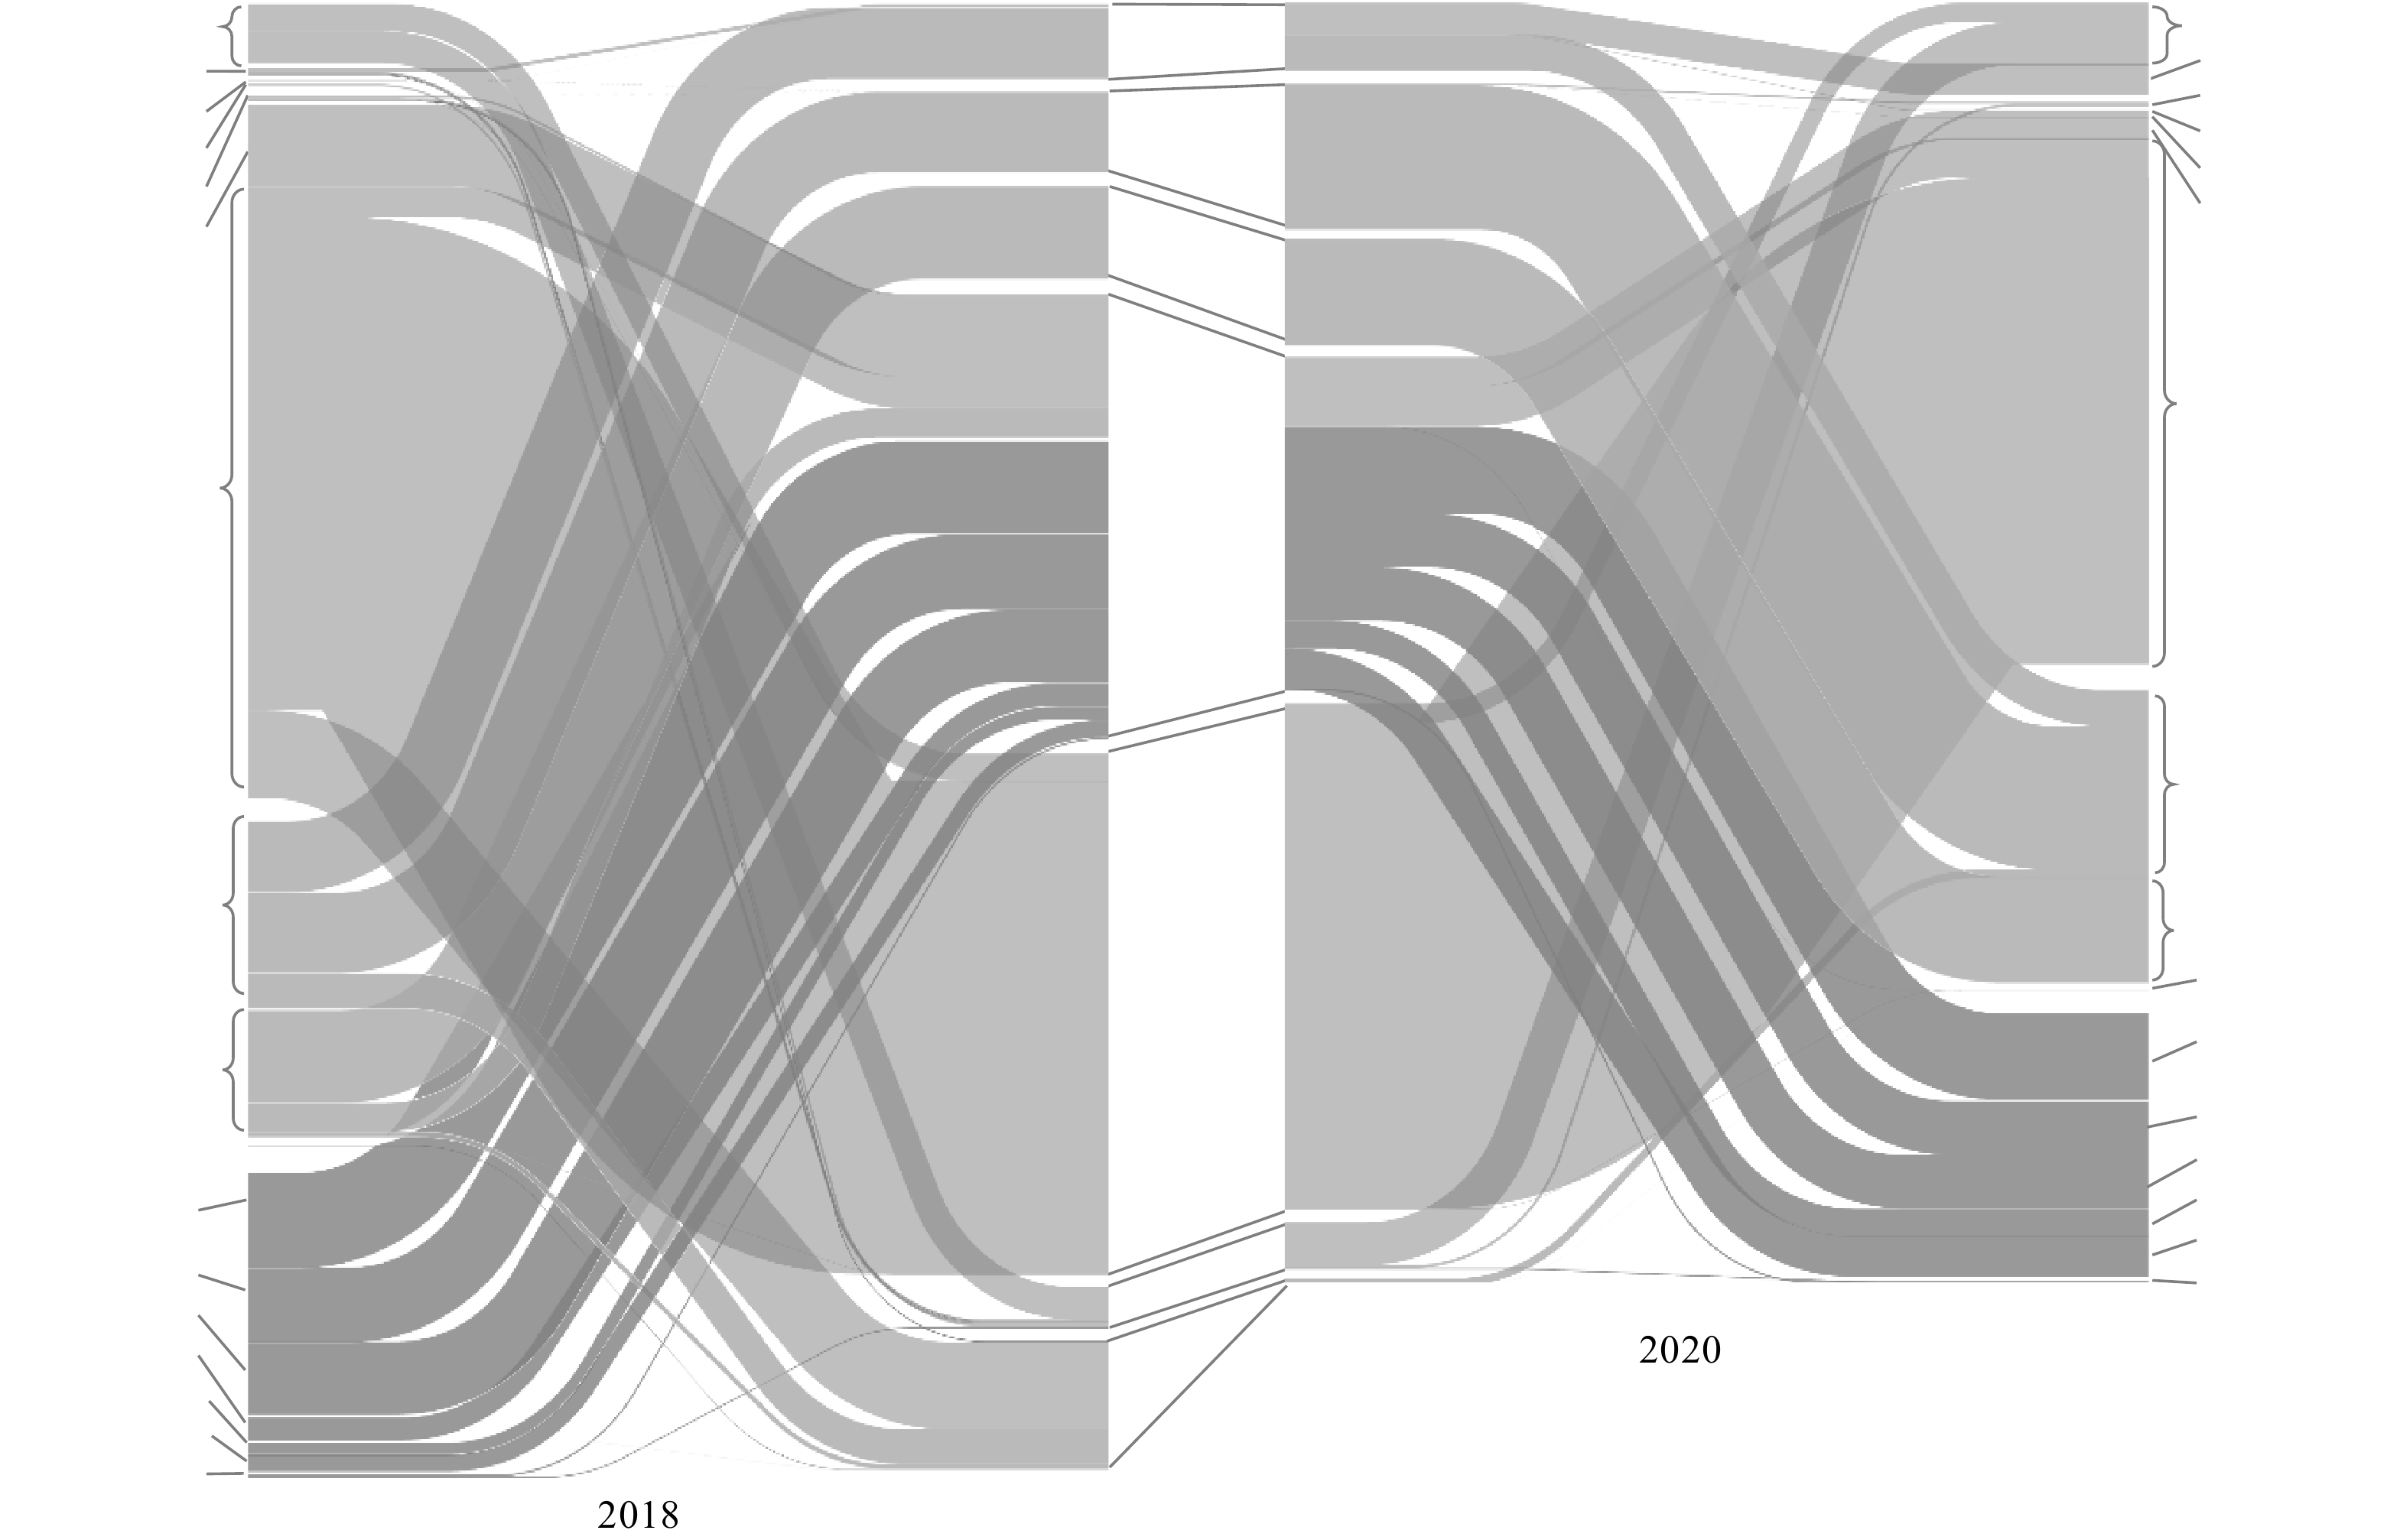
图 2 2018年和2020年固体废物产生及处置量对比
Figure 2. Comparison of solid waste discharge and disposal amounts in 2018 and 2020
-

图 3 源头减量环节的碳排放情况
Figure 3. Carbon emission of source reduction
-

图 4 城乡生活领域固体废物中端与末端处置环节碳排放
Figure 4. Carbon emission during the disposal and resource utilization of the solids from the urban and rural life
-
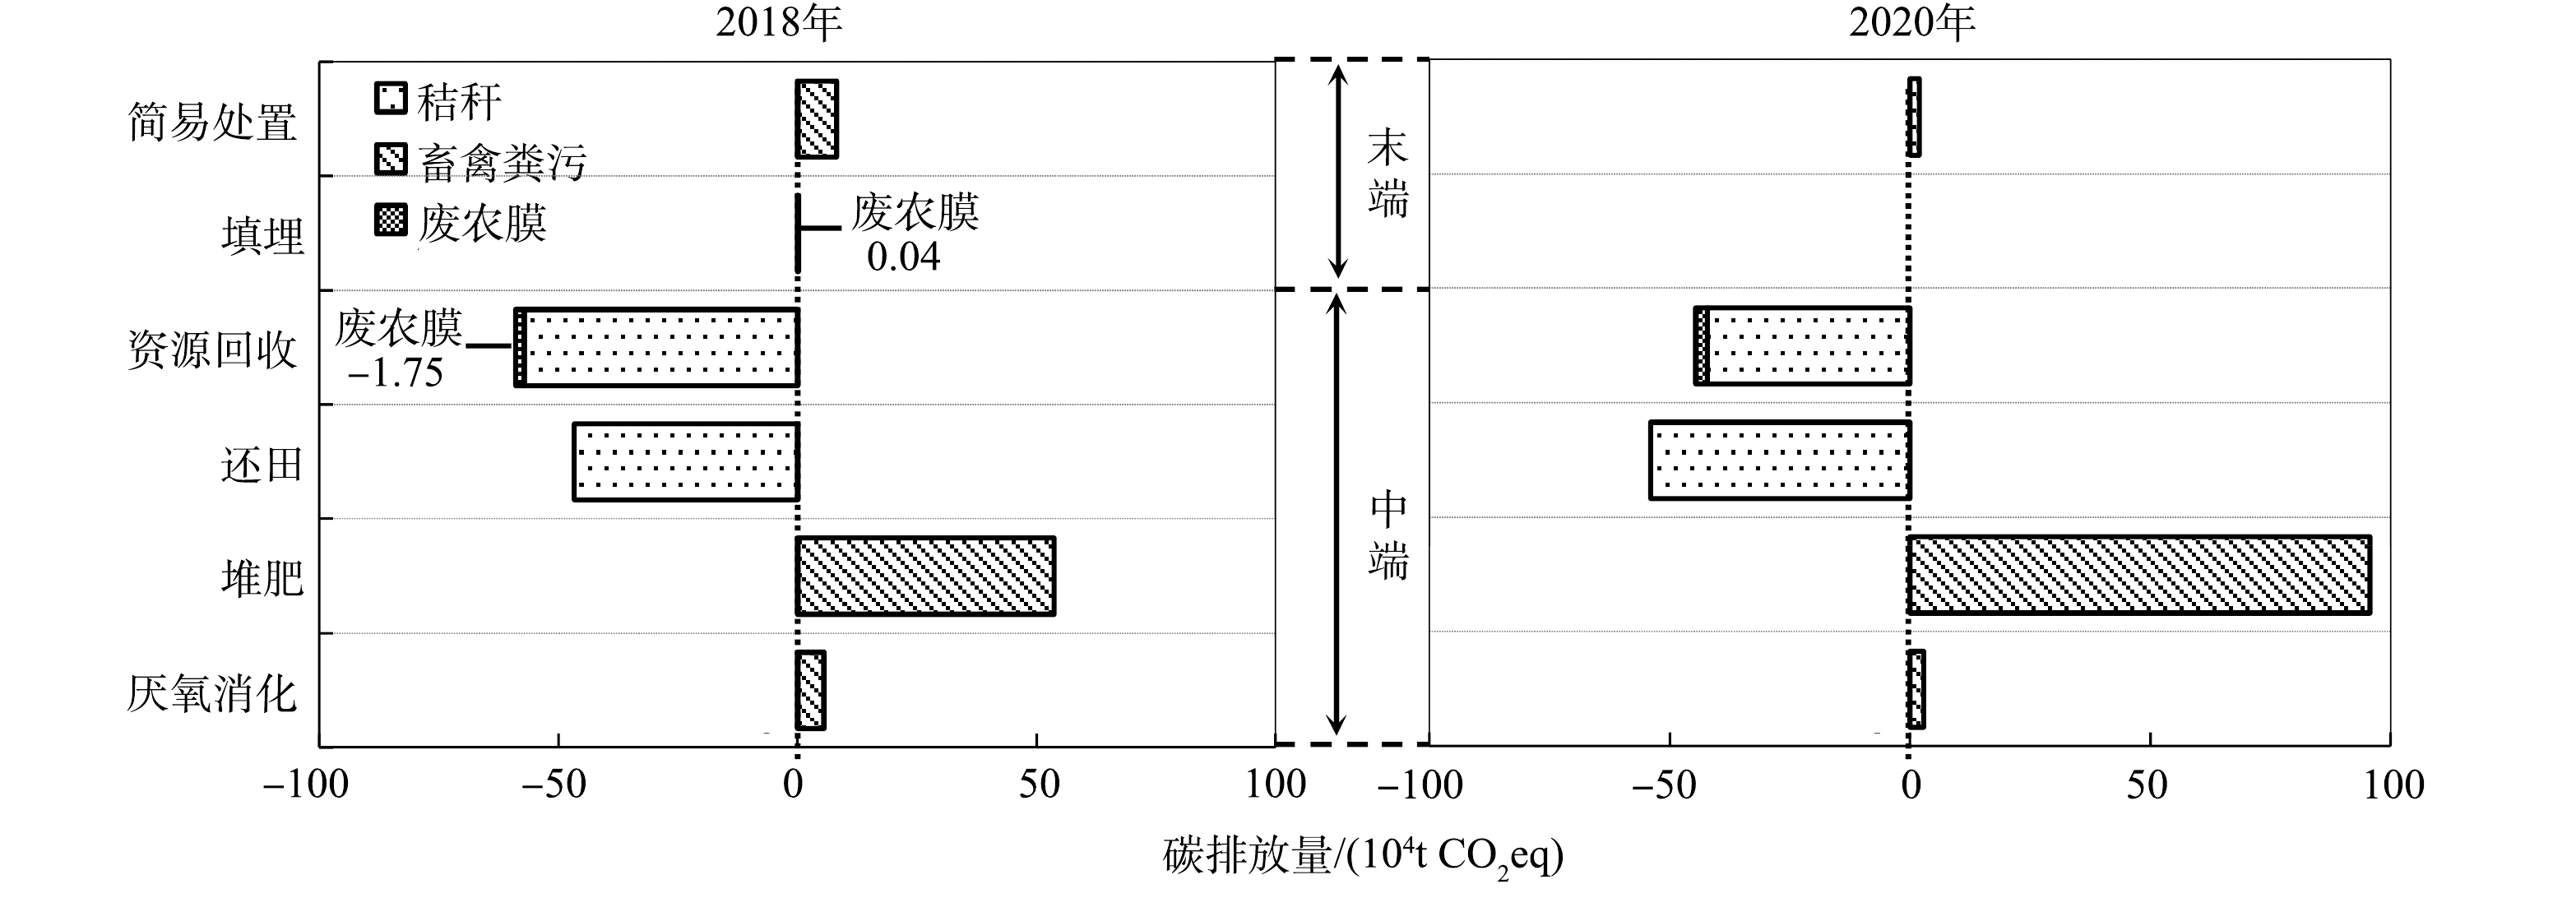
图 5 农业领域固体废物中端与末端处置环节碳排放
Figure 5. Carbon emission of disposal and resource utilization in the agricultural waste
-

图 6 工业领域中端与末端处理处置环节碳排放
Figure 6. Carbon emission of disposal and resource utilization in the industrial solid waste
-
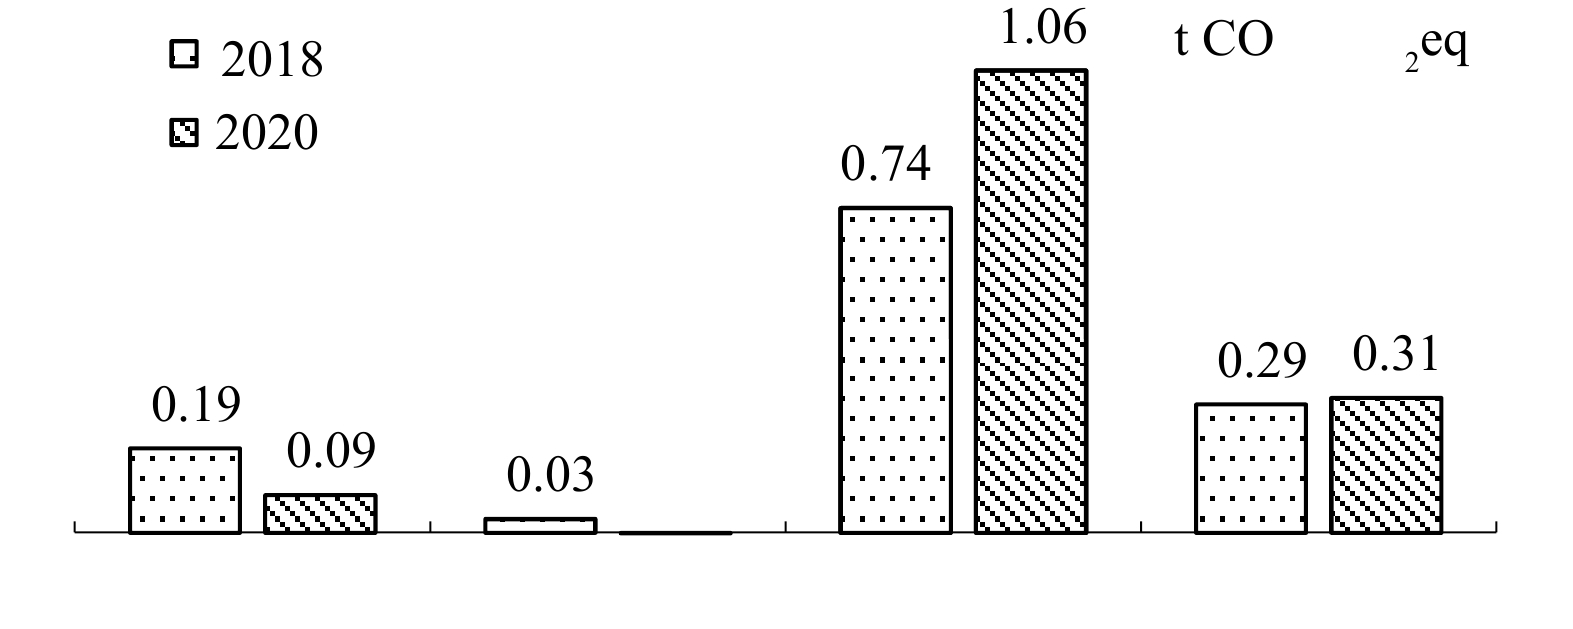
图 7 2018年和2020年徐州市处理吨固体废物的碳减排量比较
Figure 7. Comparison of carbon reduction per ton of solid waste treatment in Xuzhou City in 2018 and 2020
Figure
7 ,Table
2 个