-

图 1 研究区域城市分布
Figure 1. Overview of cities in the study area
-

图 2 城市水生态环境系统
Figure 2. Urban water ecological environment
-
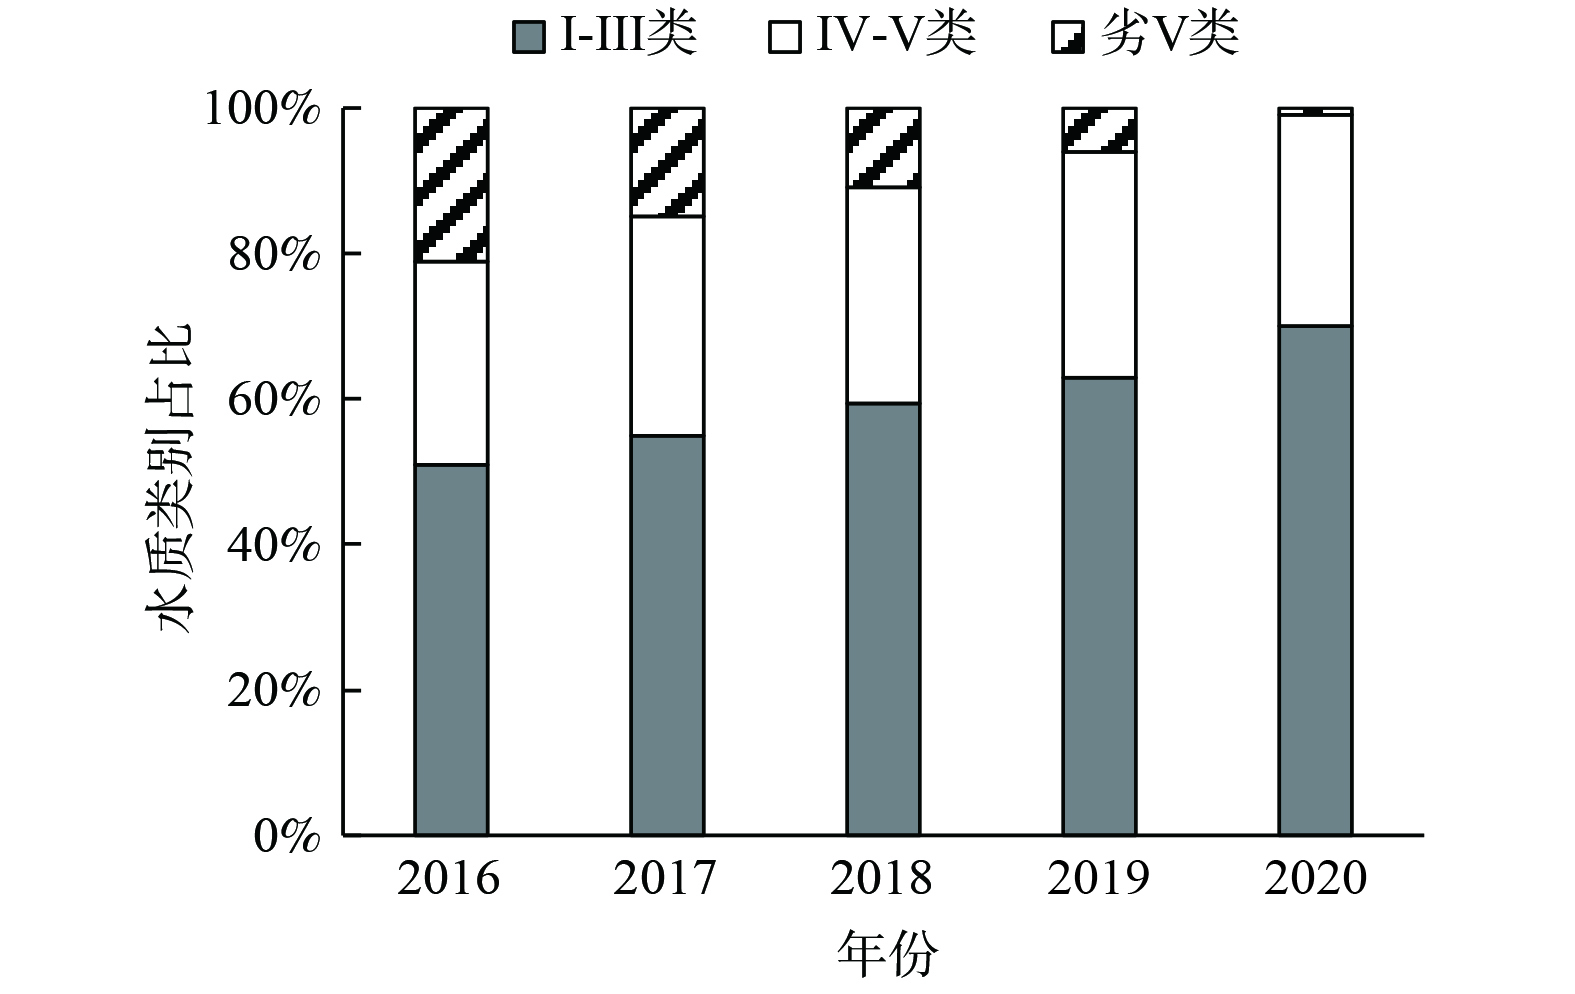
图 3 研究区域省控以上断面水质年际变化
Figure 3. Yearly changing in water quality of national and provincial control sections of regional cities from
-
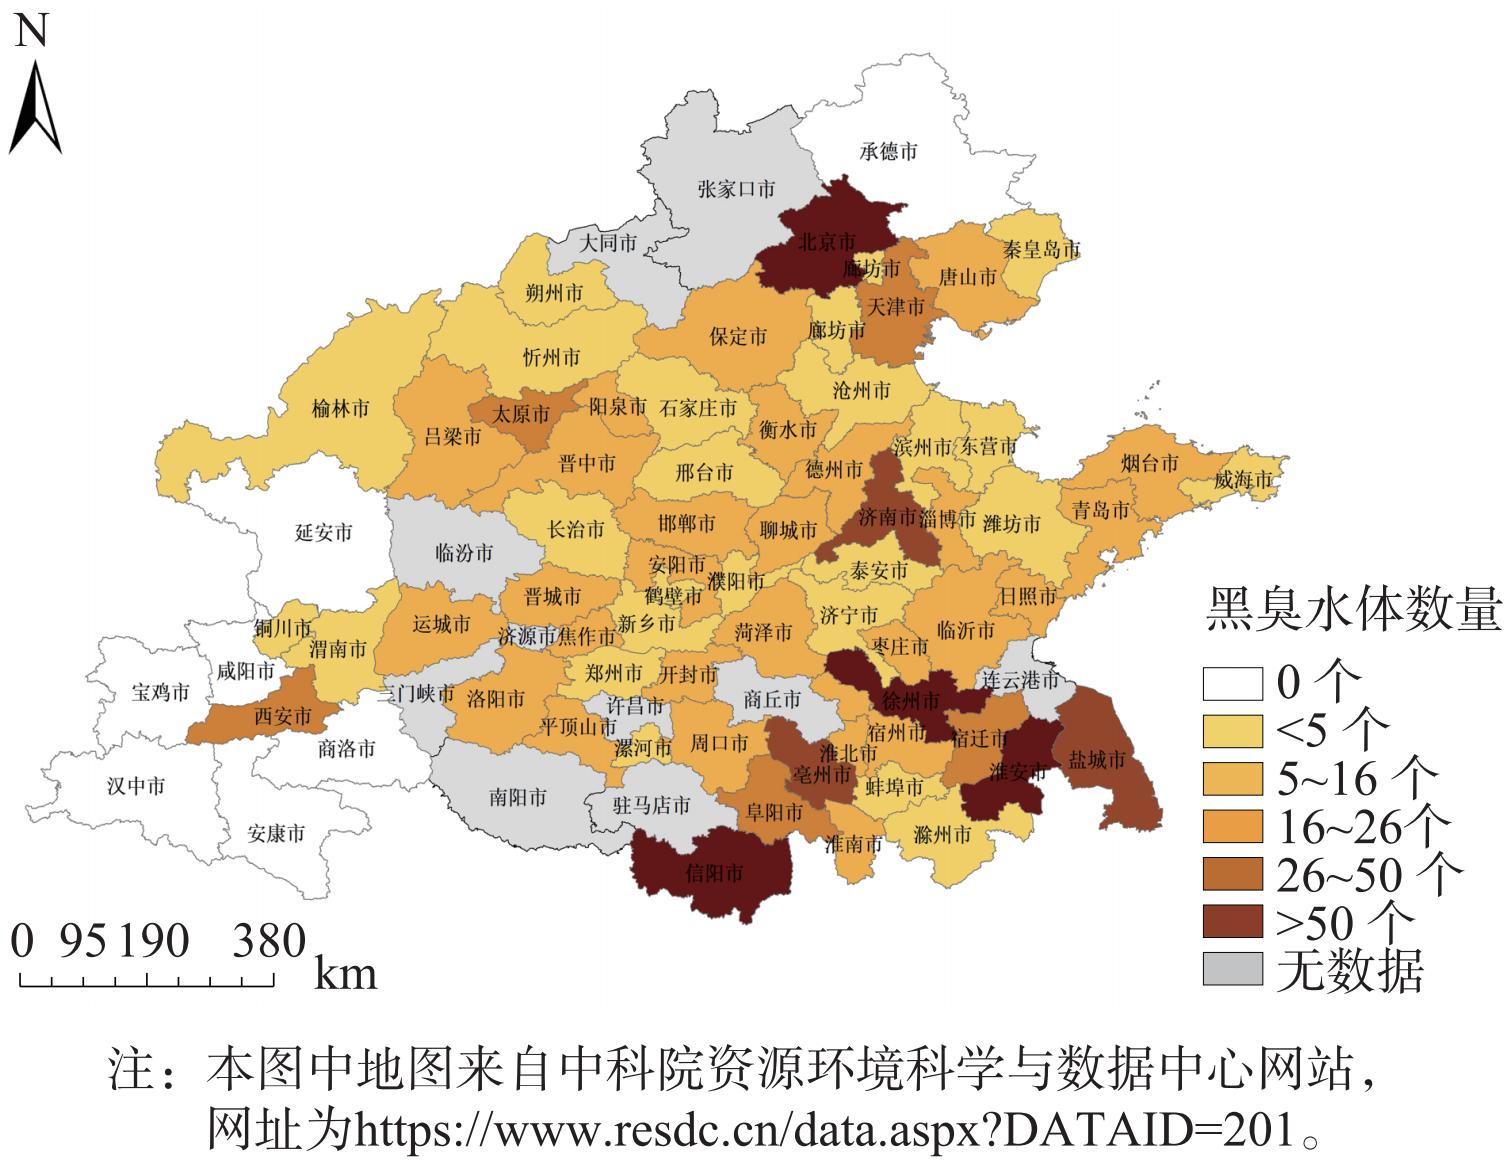
图 4 研究区域城市黑臭水体分布
Figure 4. Distribution of black & smelly water bodies in the study area
-
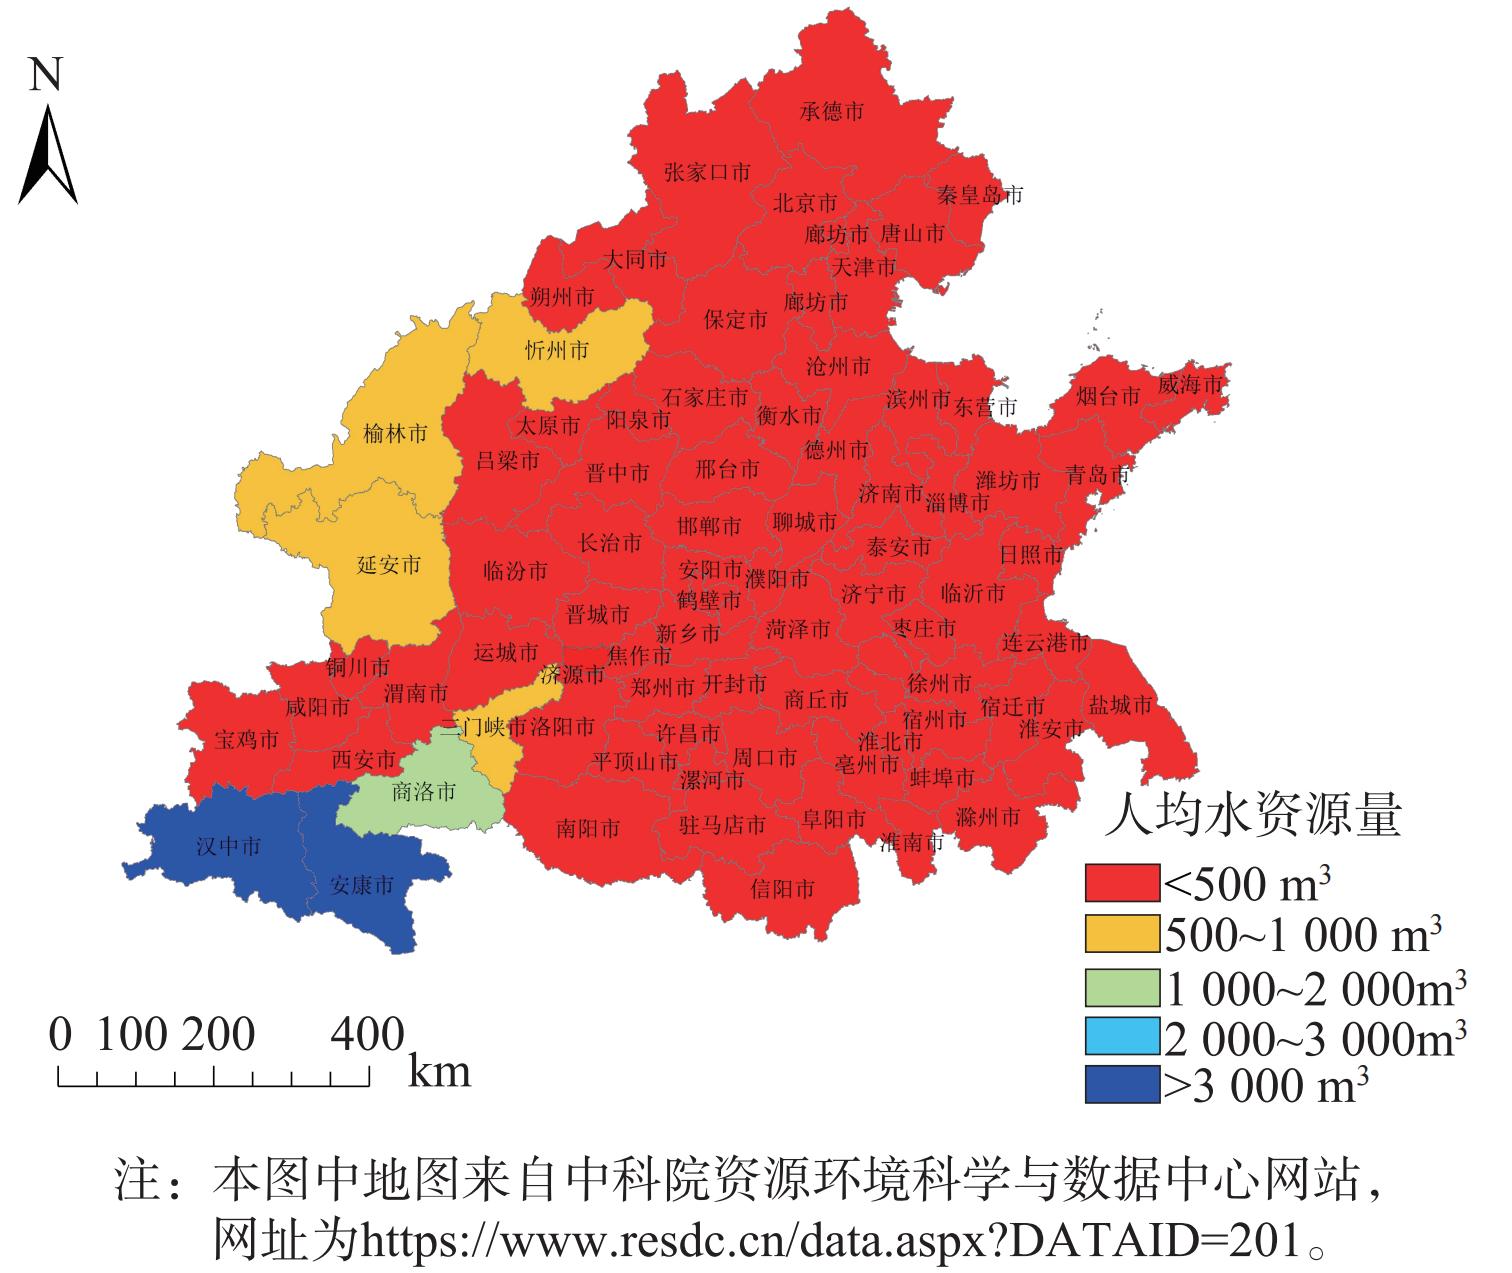
图 5 研究区域2020年各城市人均水资源量
Figure 5. Per capita water resources in prefectural cities in the study area in 2020
-

图 6 研究区域主要城市生活污水排放量与城镇人口数量
Figure 6. Domestic wastewater discharge and urban population of major cities in the study area
-

图 7 研究区域内2020年各城市建成区排水管道密度
Figure 7. Density of drainage pipes in the built-up area of each city in the study area in 2020
-

图 8 研究区域2020年城市污水处理厂运行负荷率
Figure 8. Operational load rate of wastewater treatment plants in the study area in 2020
-
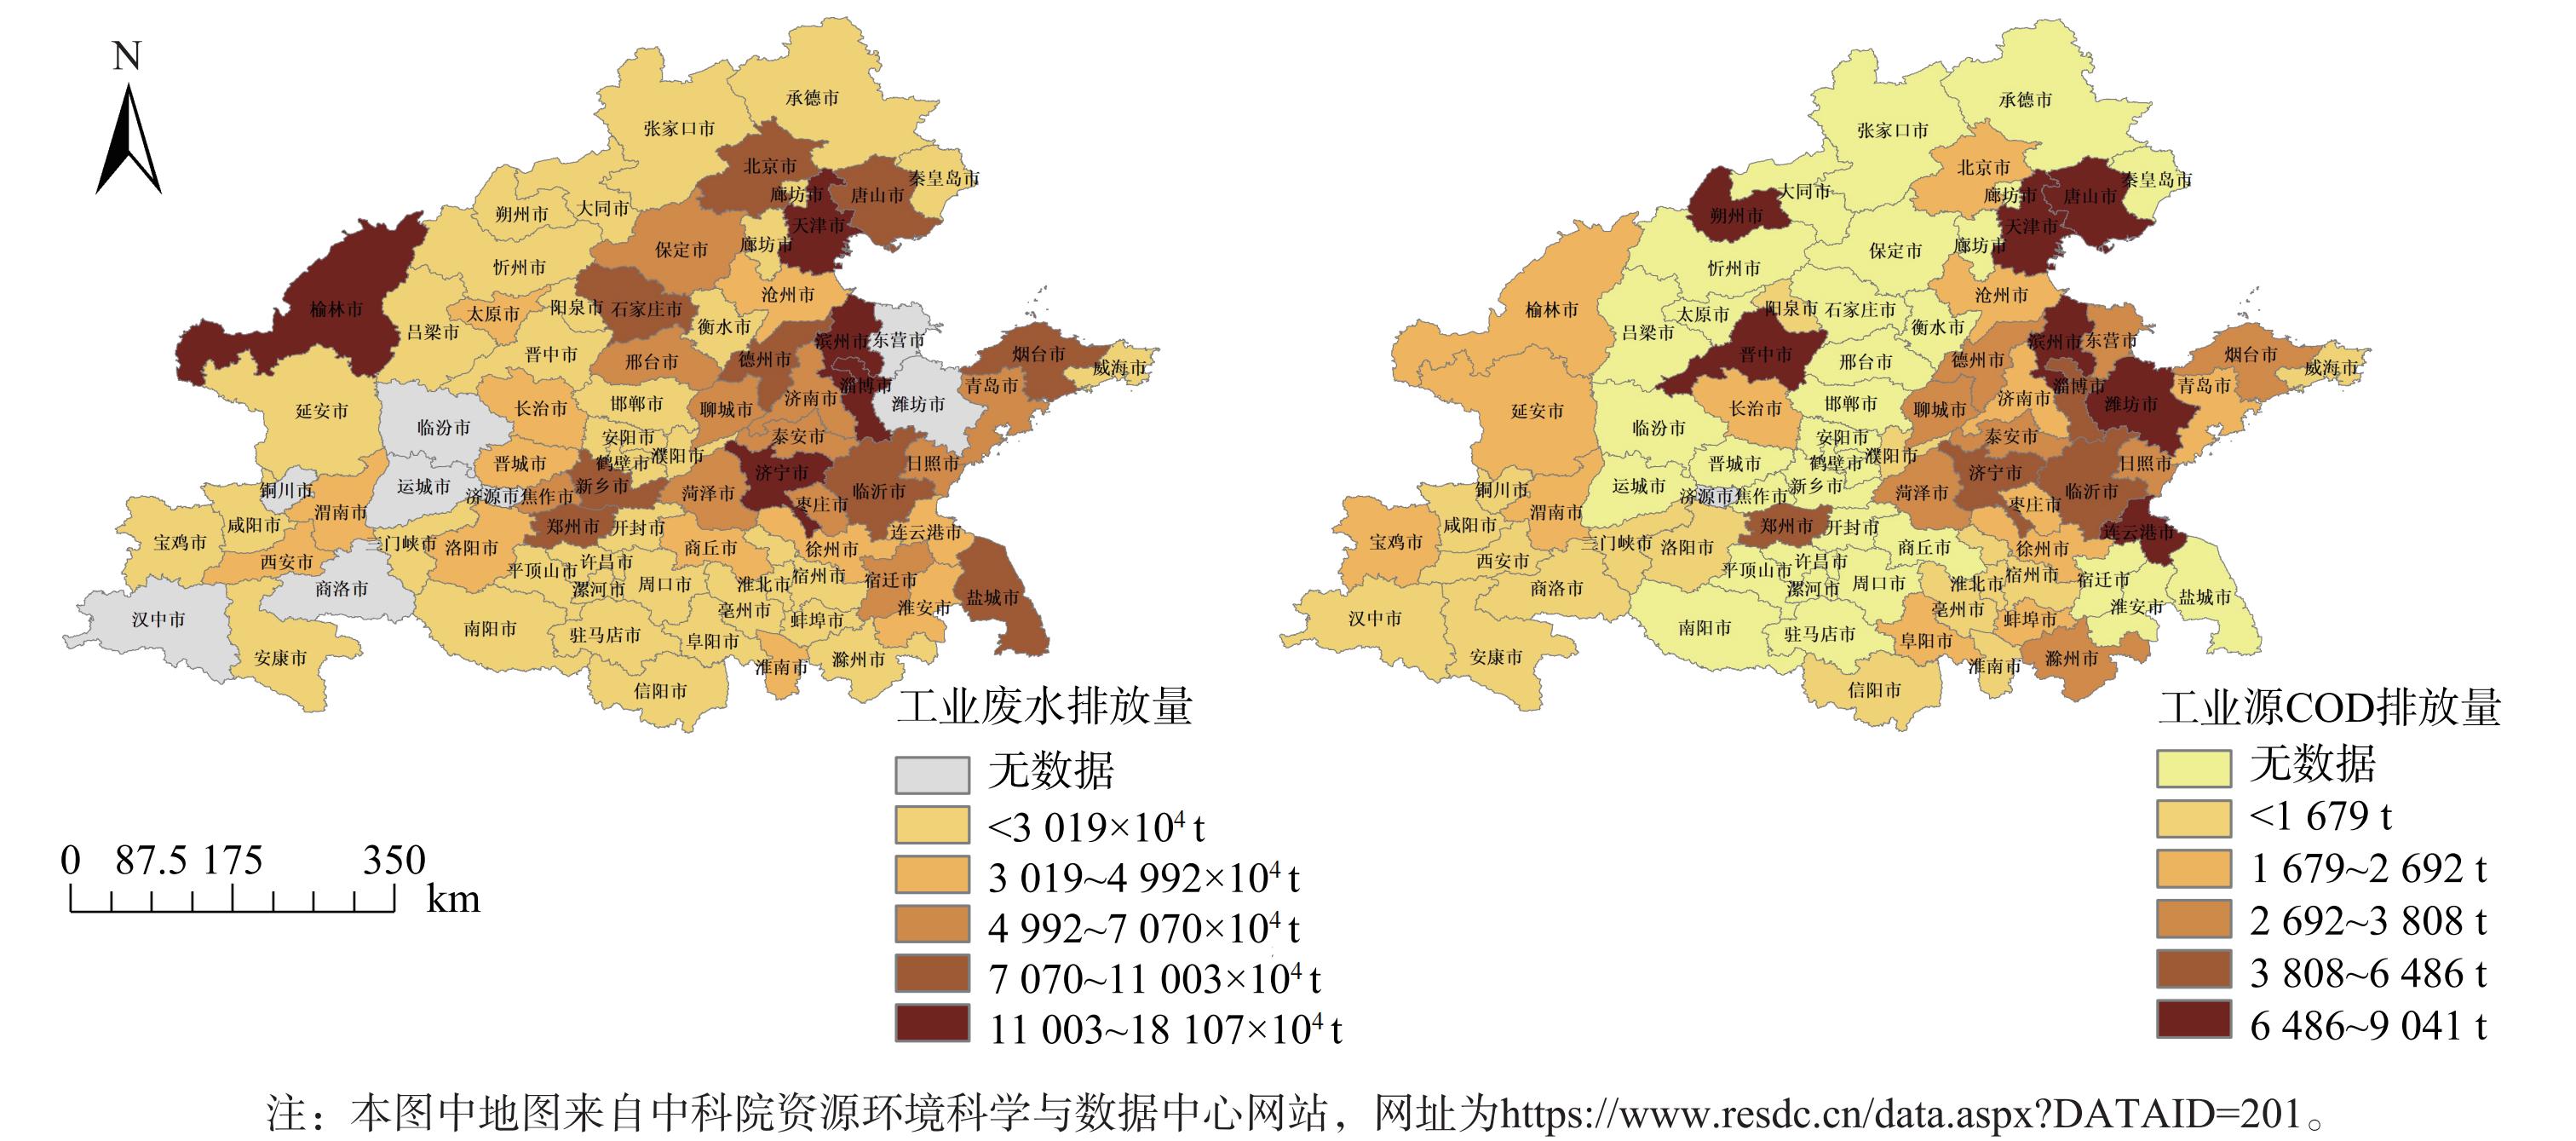
图 9 研究区域2017年部分城市工业废水和COD排放量
Figure 9. Industrial wastewater and COD emissions from selected municipalities in the study area in 2017
-

图 10 研究区域2019年逐月降雨量及京津冀区域I-III类水质占比变化
Figure 10. Month-by-month rainfall in the study area in 2019 and changes in the proportion of Class I-III water quality in the Beijing-Tianjin-Hebei region
-

图 11 区域各城市2020年水资源总量和开发利用强度
Figure 11. Total water resources and development and utilization intensity by cities in the study area in 2020
-
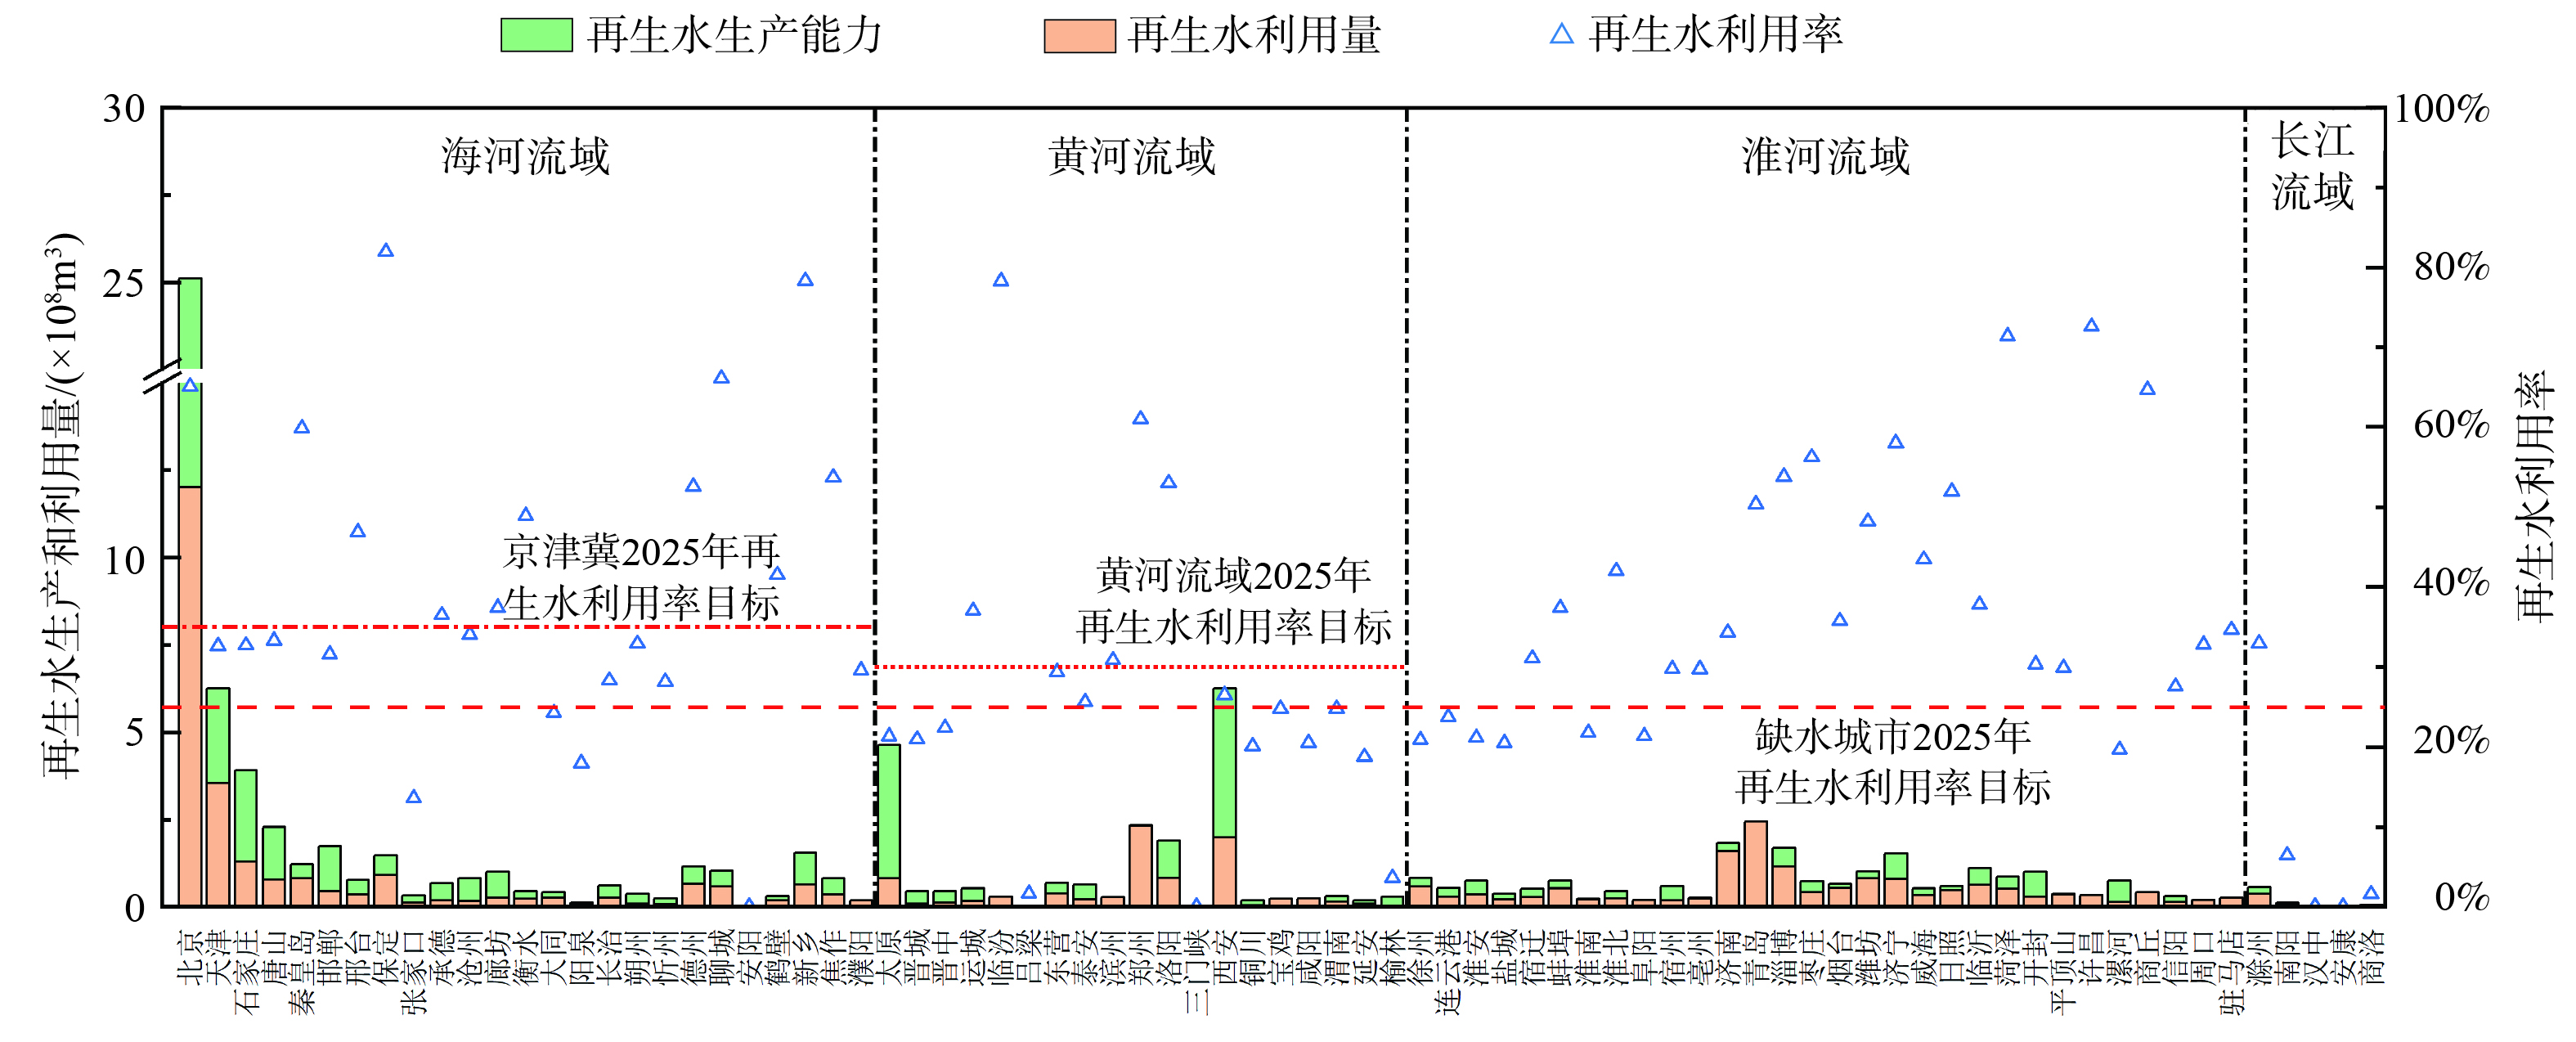
图 12 2020年华北片区城市再生水利用情况
Figure 12. Urban recycled water use in North China Region in 2020
Figure
12 ,Table
2 个