-

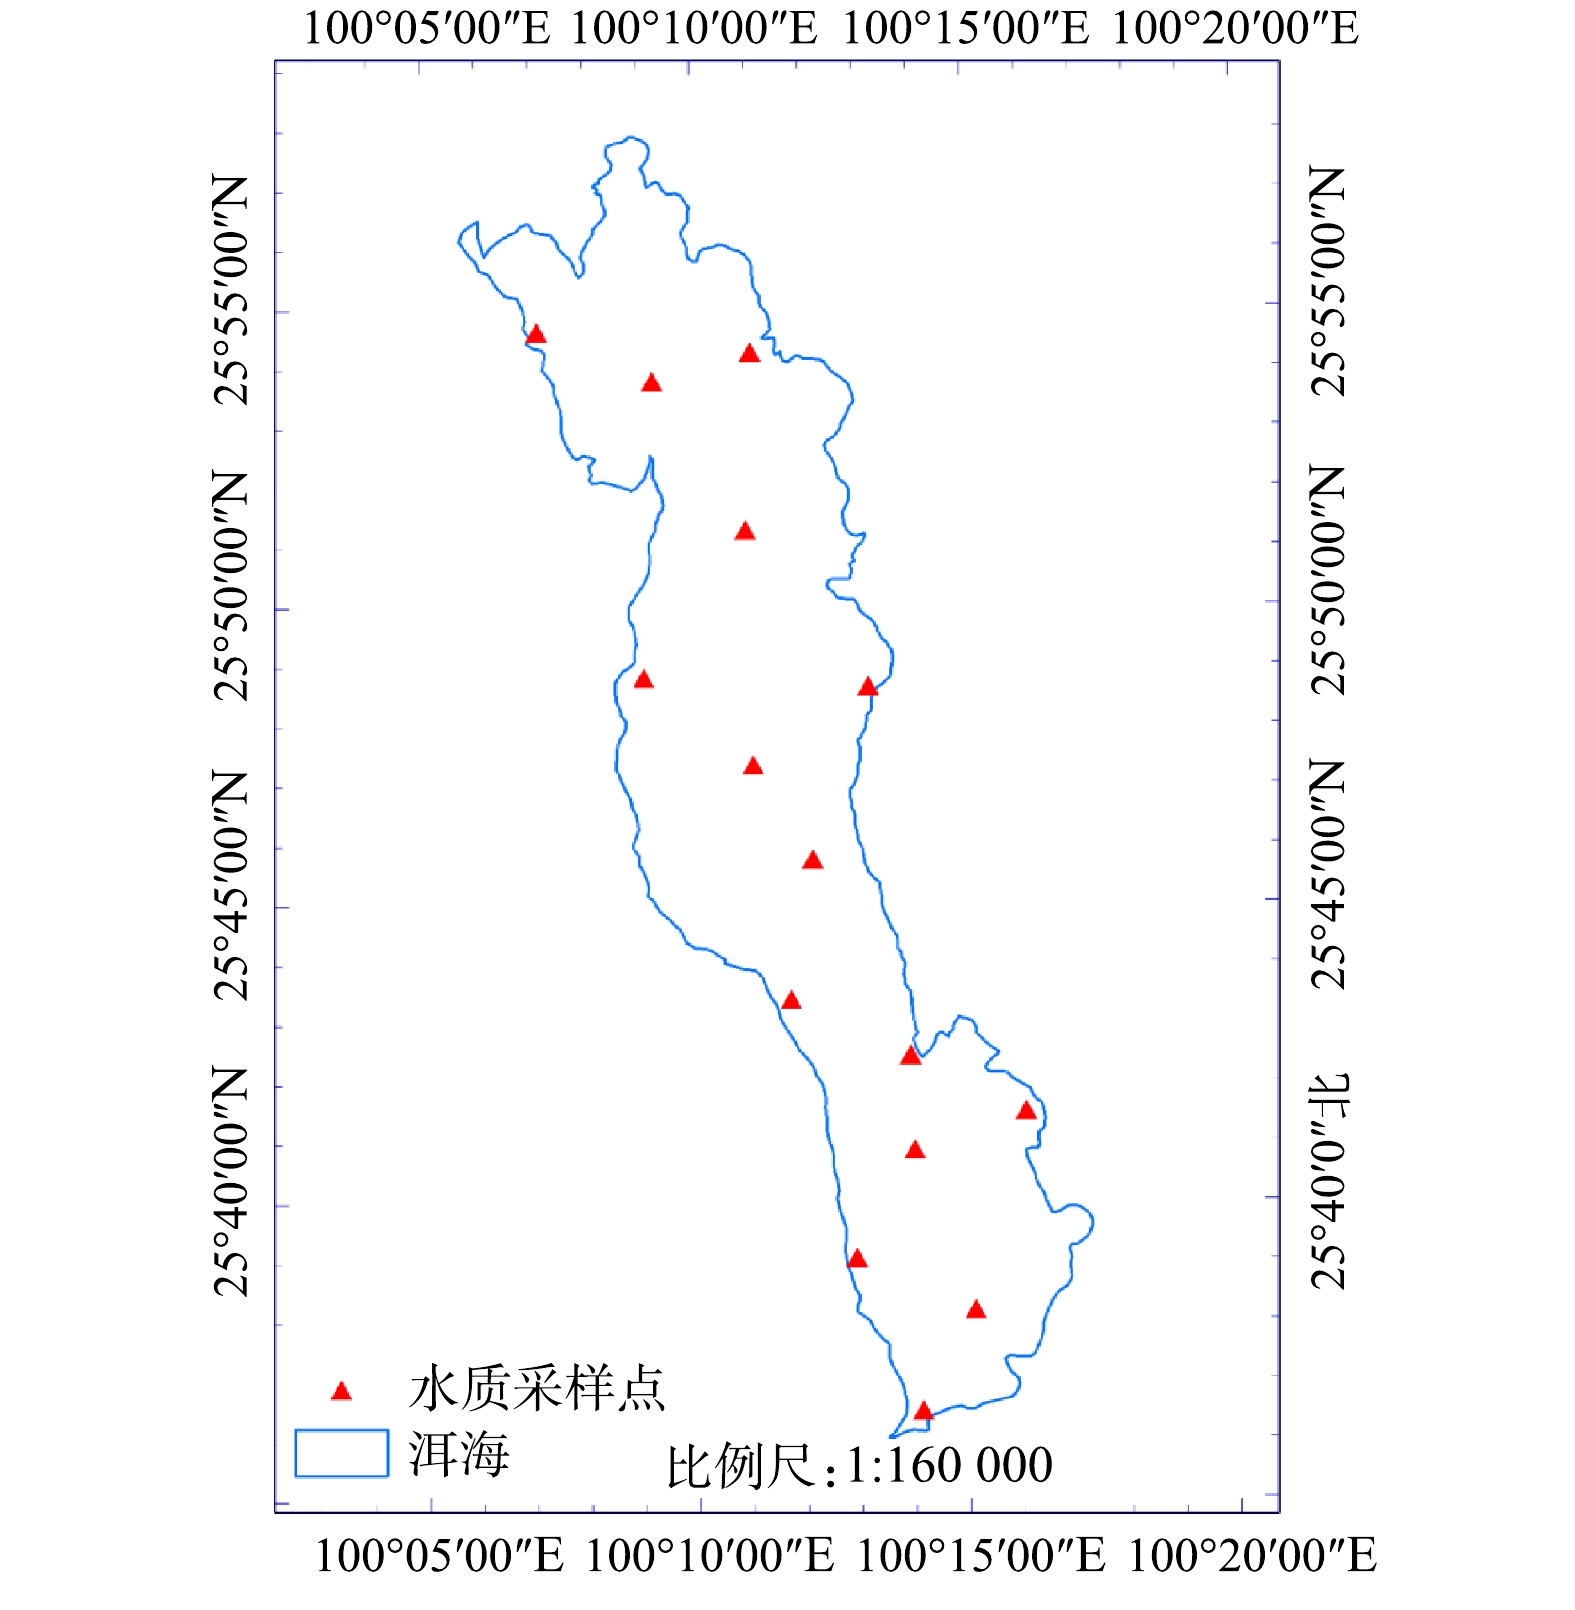
图 1 水质采样点分布图
Figure 1. Distribution map of water quality sampling
-

图 2 BP 神经网络结构示意图
Figure 2. Schematic diagram of BP neural network structure
-

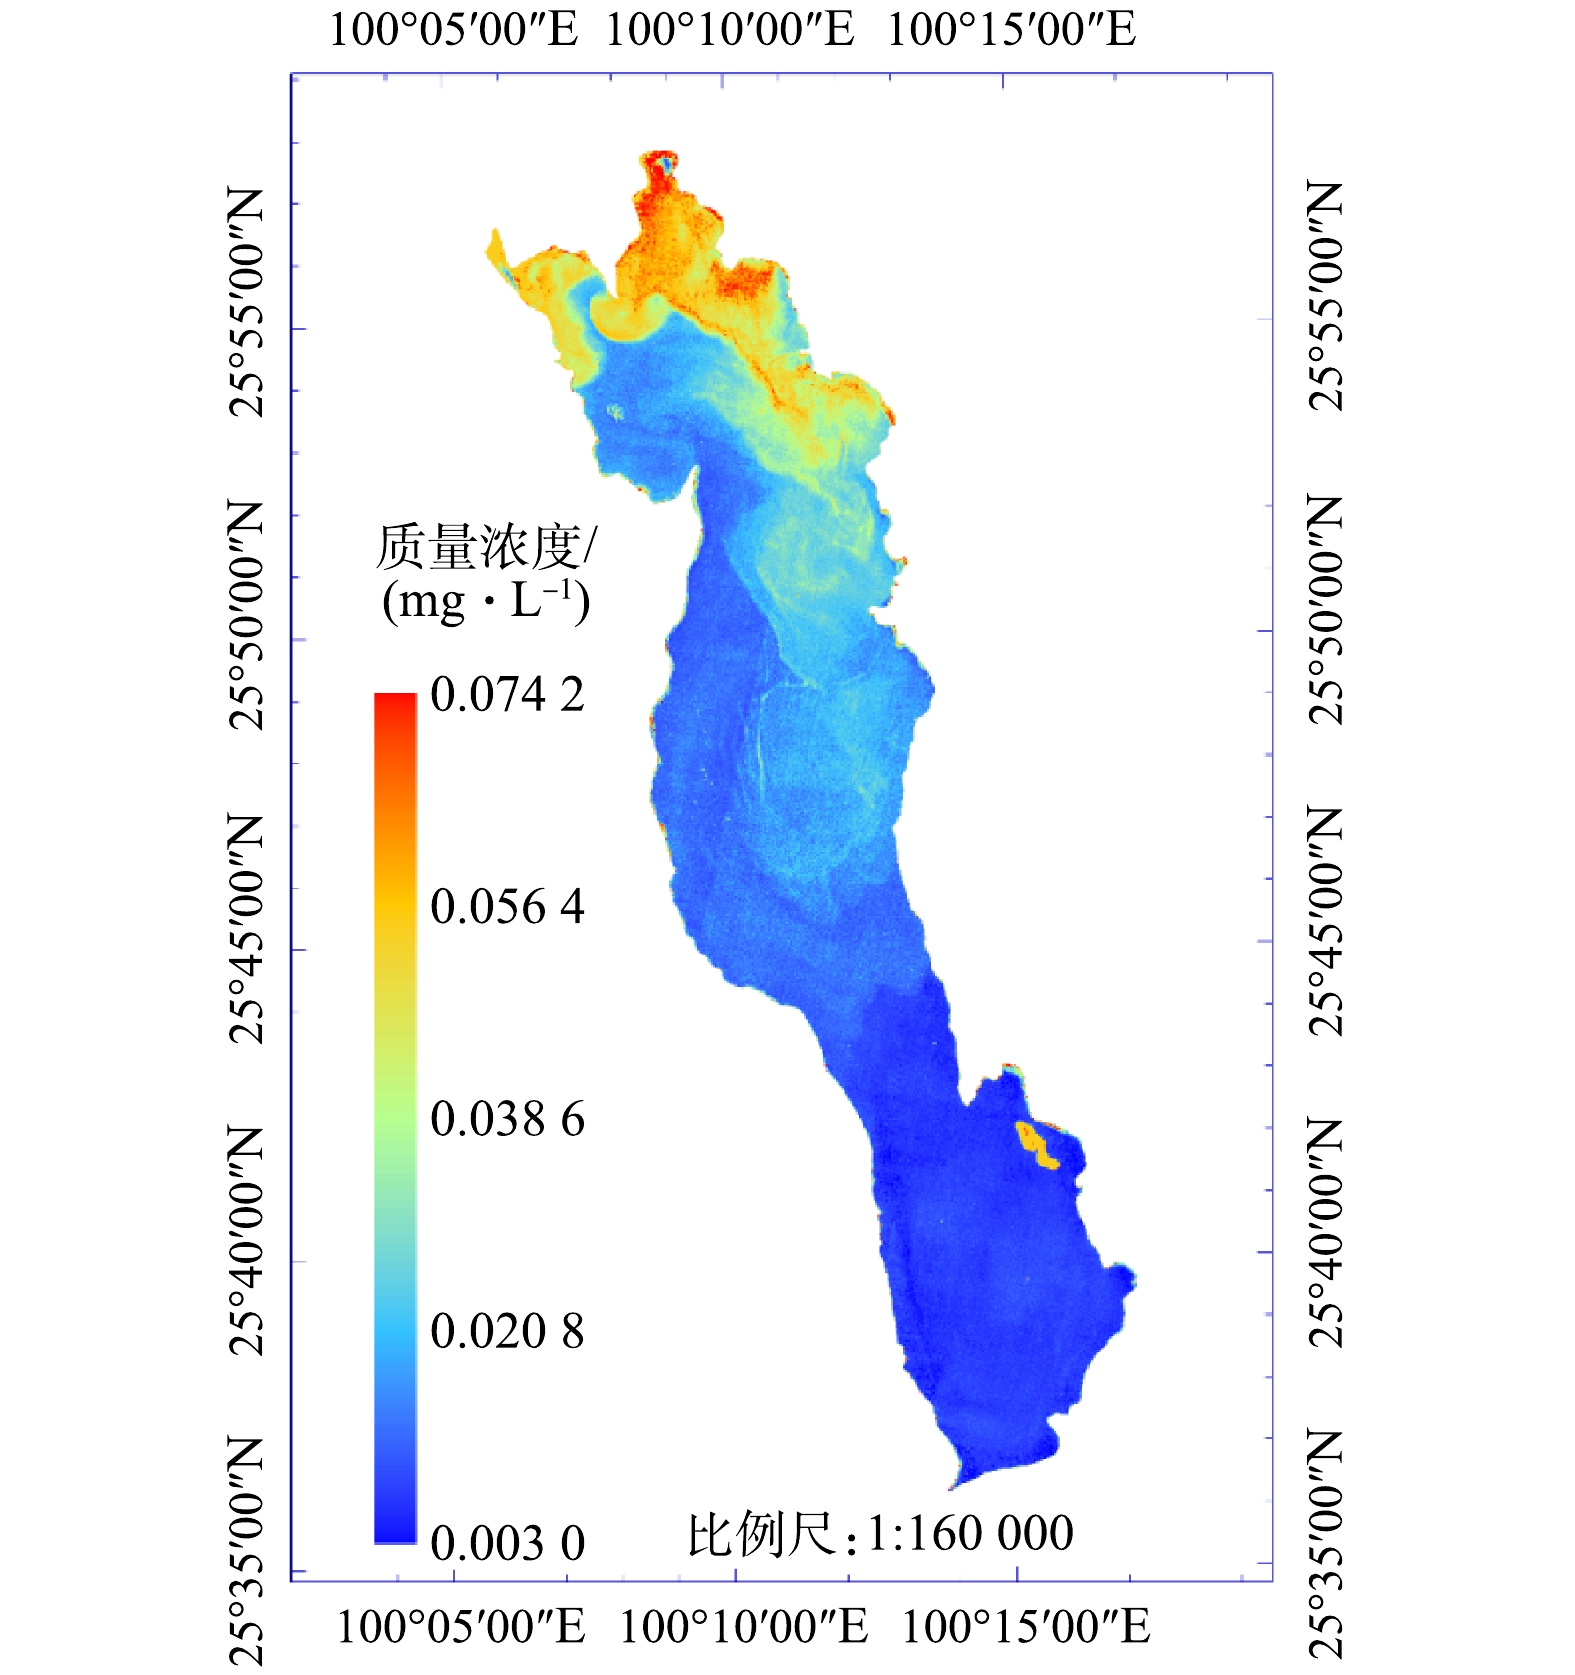
图 3 洱海 2019 年 10 月 12 日叶绿素 a 质量浓度分布图
Figure 3. Distribution of chlorophyll a mass concentration in Erhai lake on October 12th, 2019
-

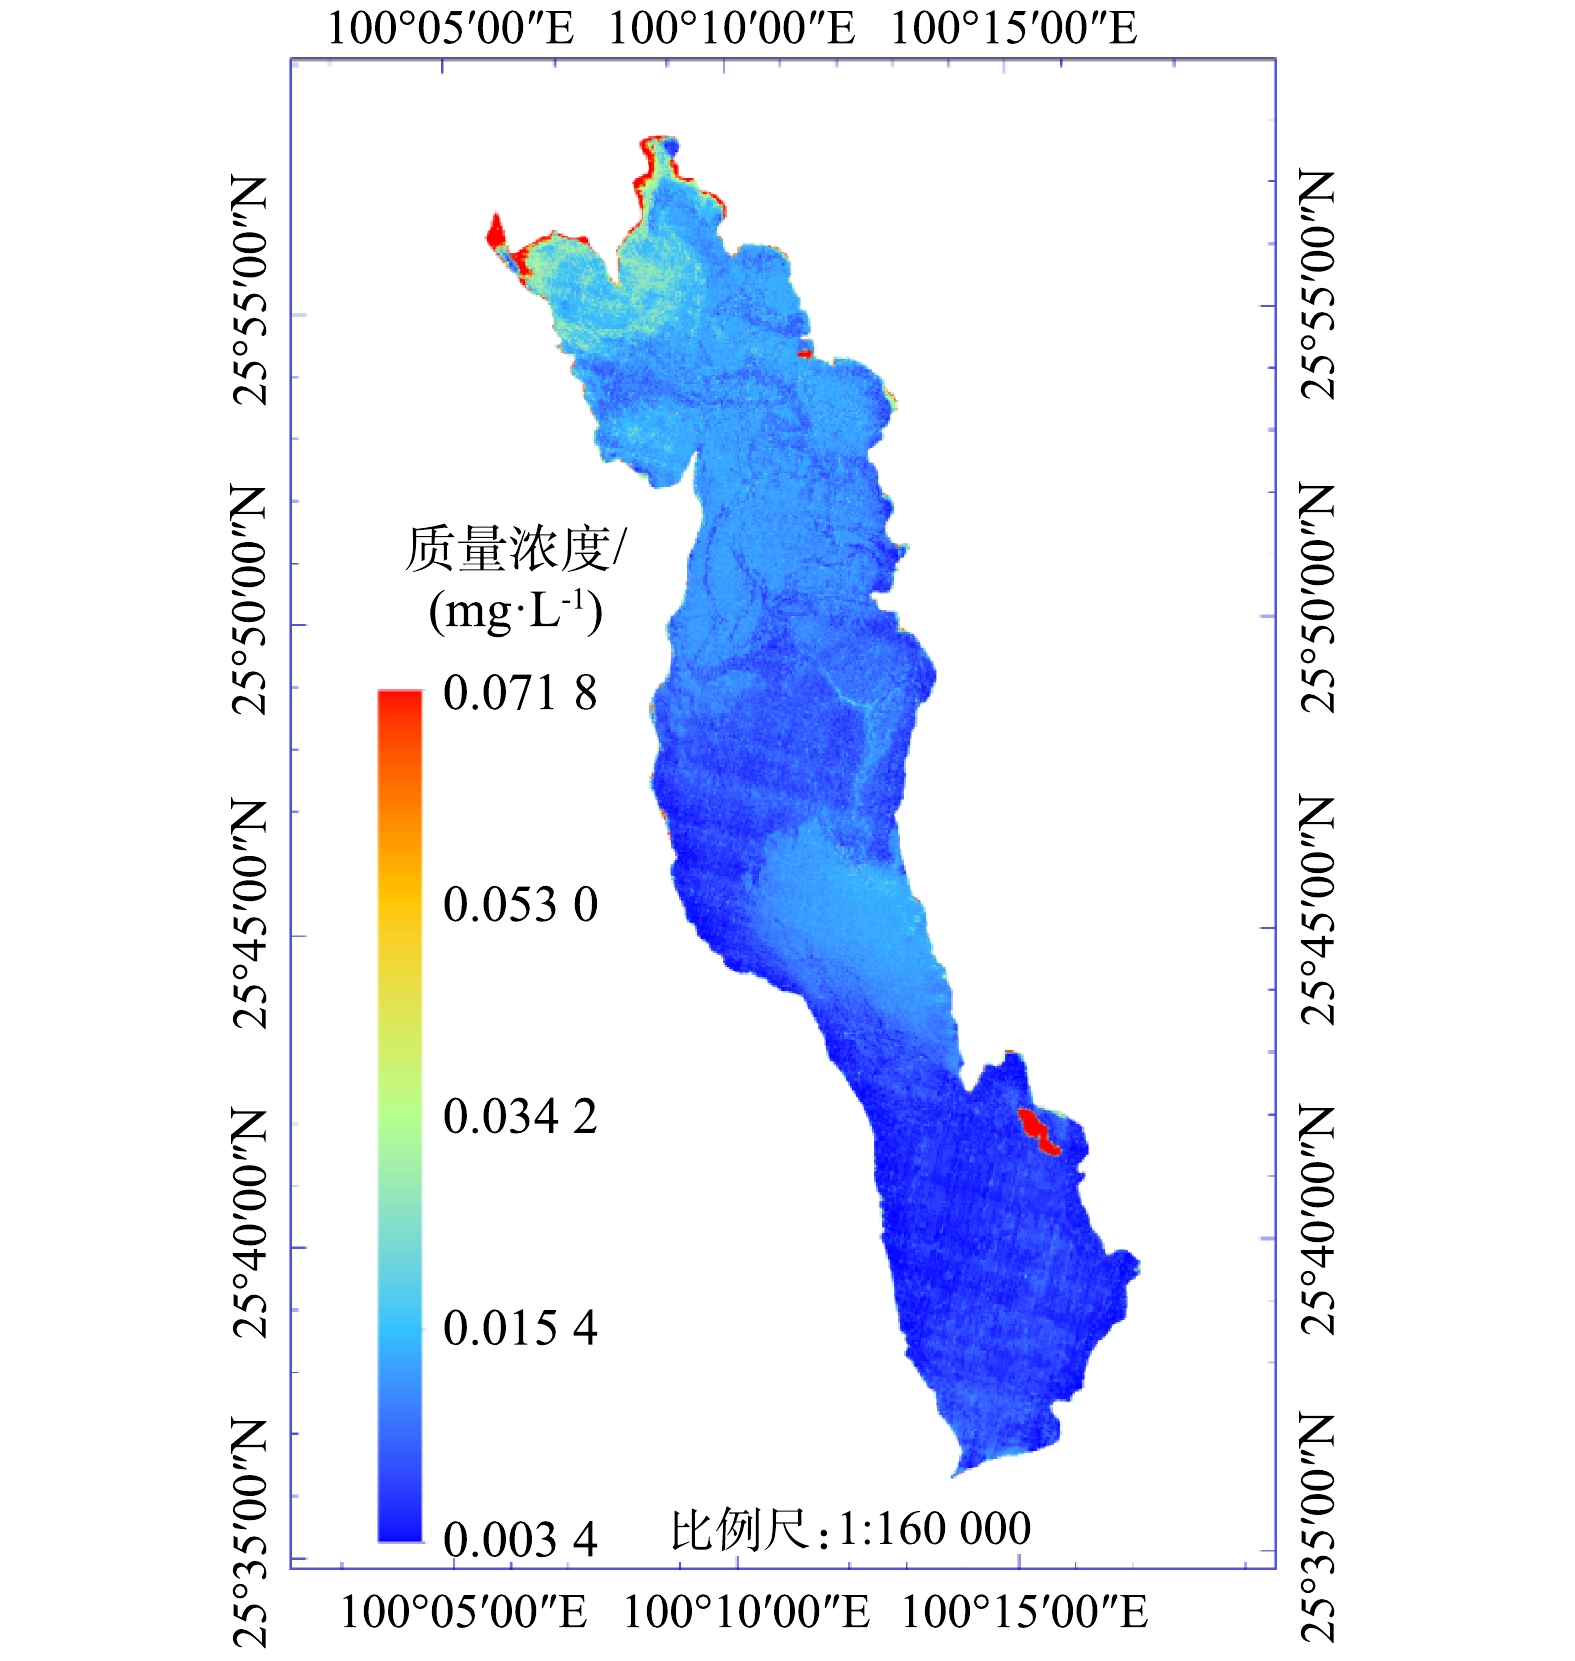
图 4 洱海 2019 年 11 月 9 日叶绿素 a 质量浓度分布图
Figure 4. Distribution of chlorophyll a mass concentration in Erhai lake on November 9th, 2019
-

图 5 洱海 2019 年 11 月 9 日 Sentinel-2A真彩色合成图
Figure 5. Sentinel-2A true-color composite image of Erhai lake on November 9, 2019
Figure
5 ,Table
5 个