-
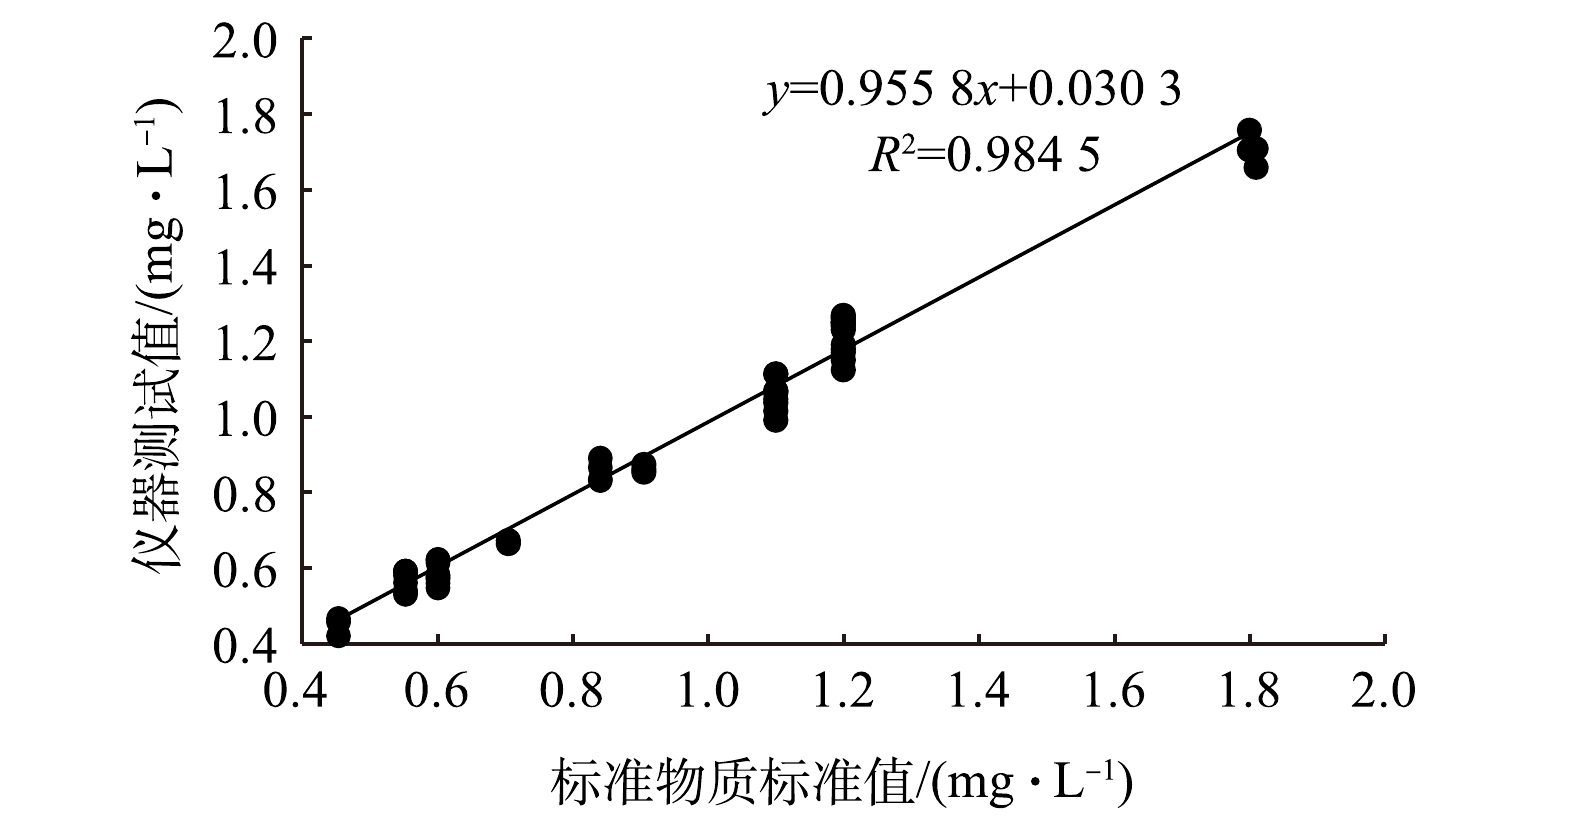
图 1 标准物质标准值与仪器测试值线性回归分析图
Figure 1. Linear regression analysis between standard values of reference materials and instrument test values
-
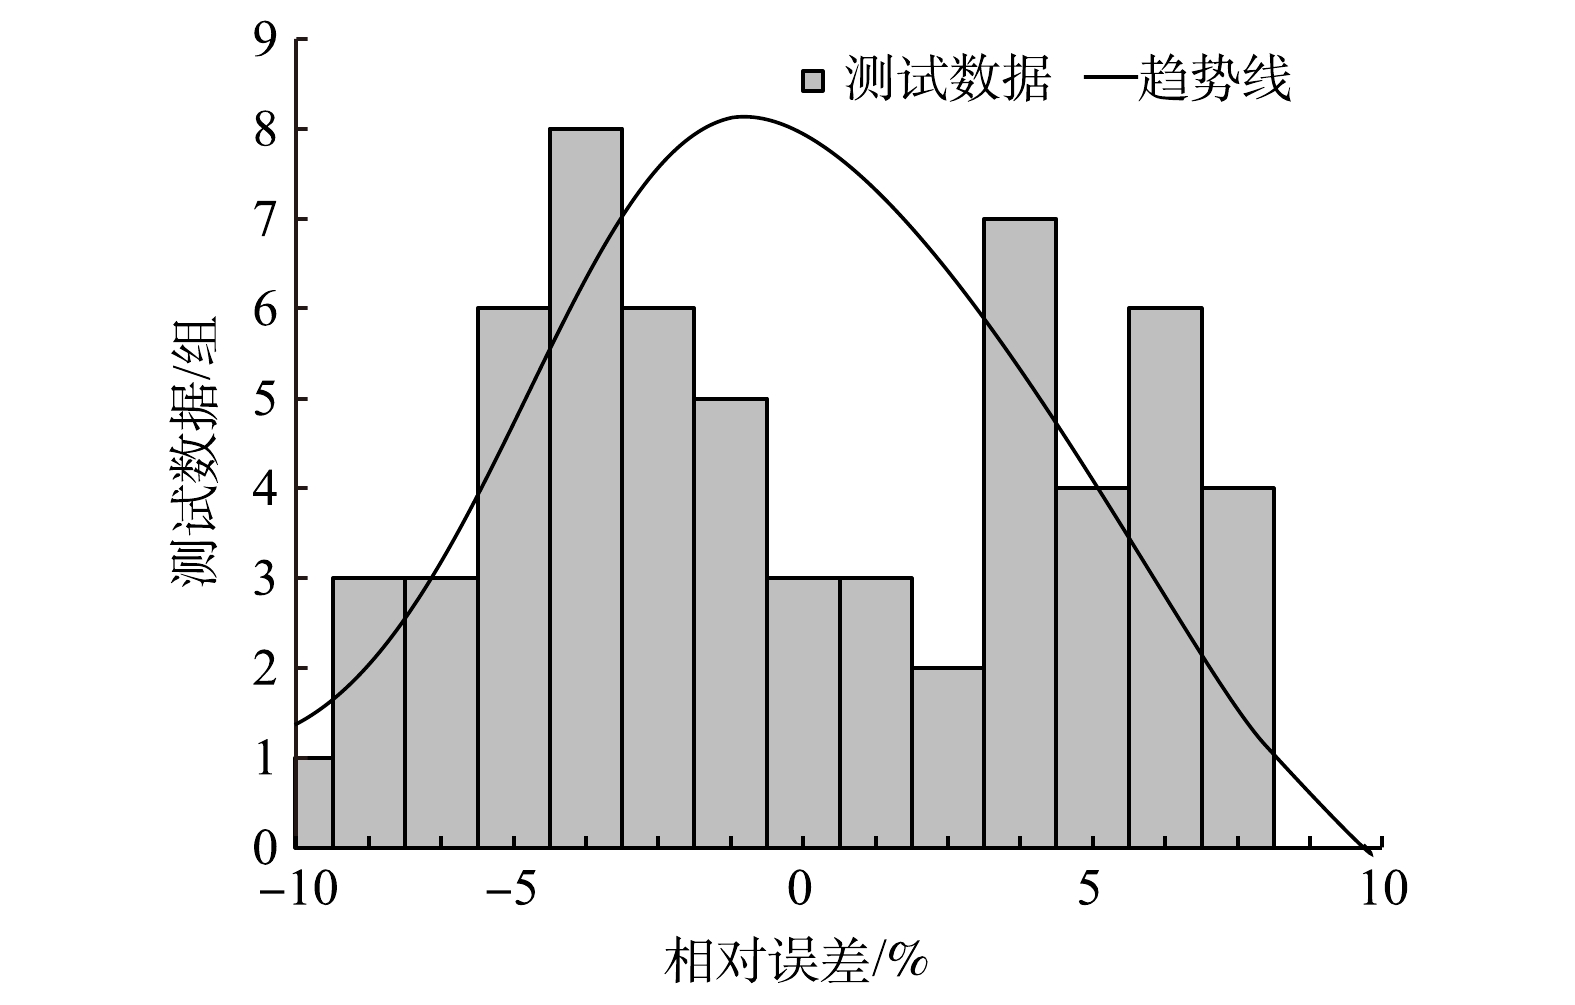
图 2 标准物质核查结果相对误差分布直方图
Figure 2. Histogram of the relative error distribution of reference material verification results
-
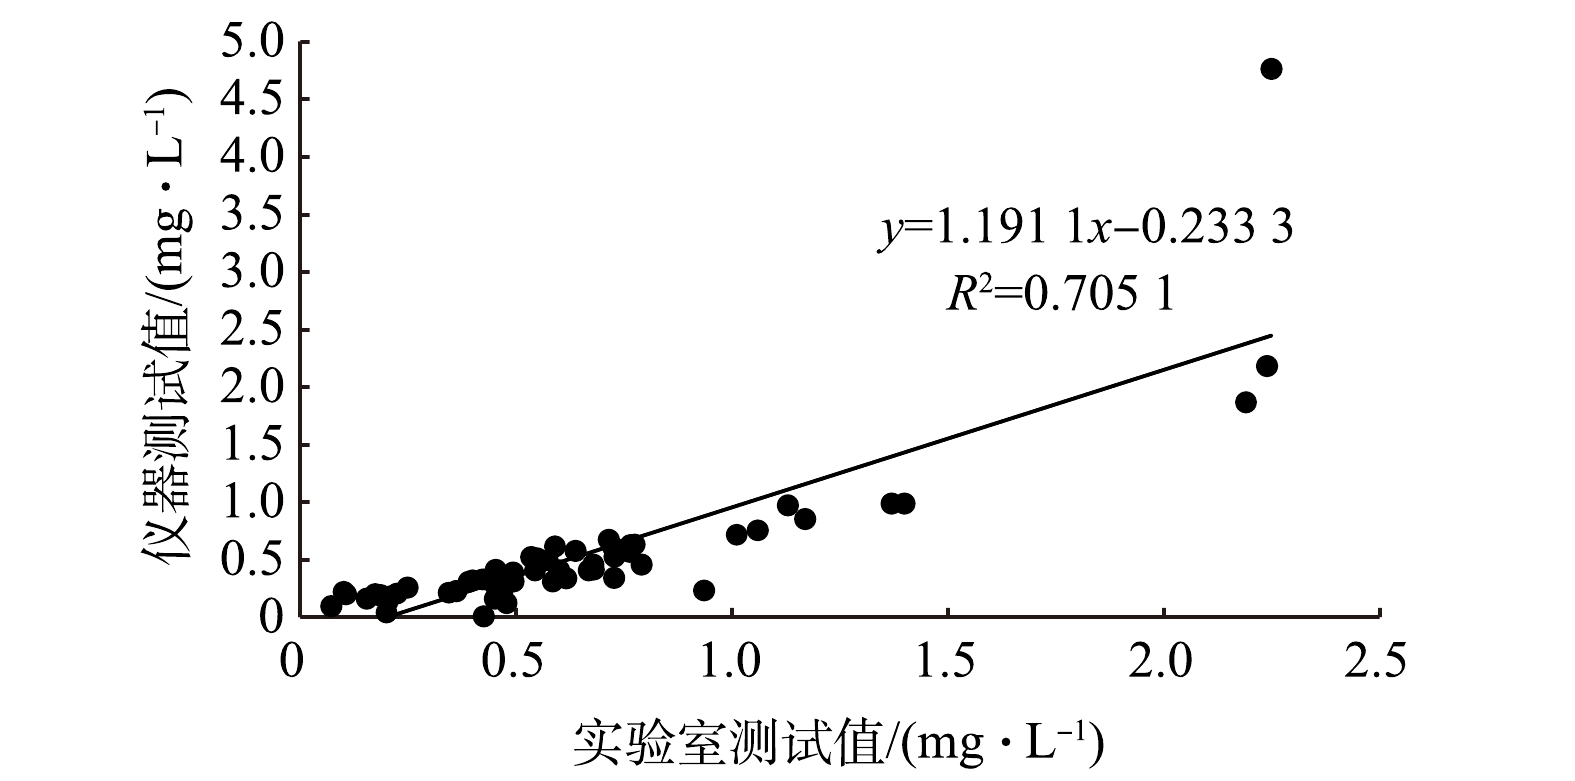
图 3 实验室比对测试结果与仪器测试值线性回归分析图
Figure 3. Linear regression analysis between laboratory comparison test results and instrument test values
-
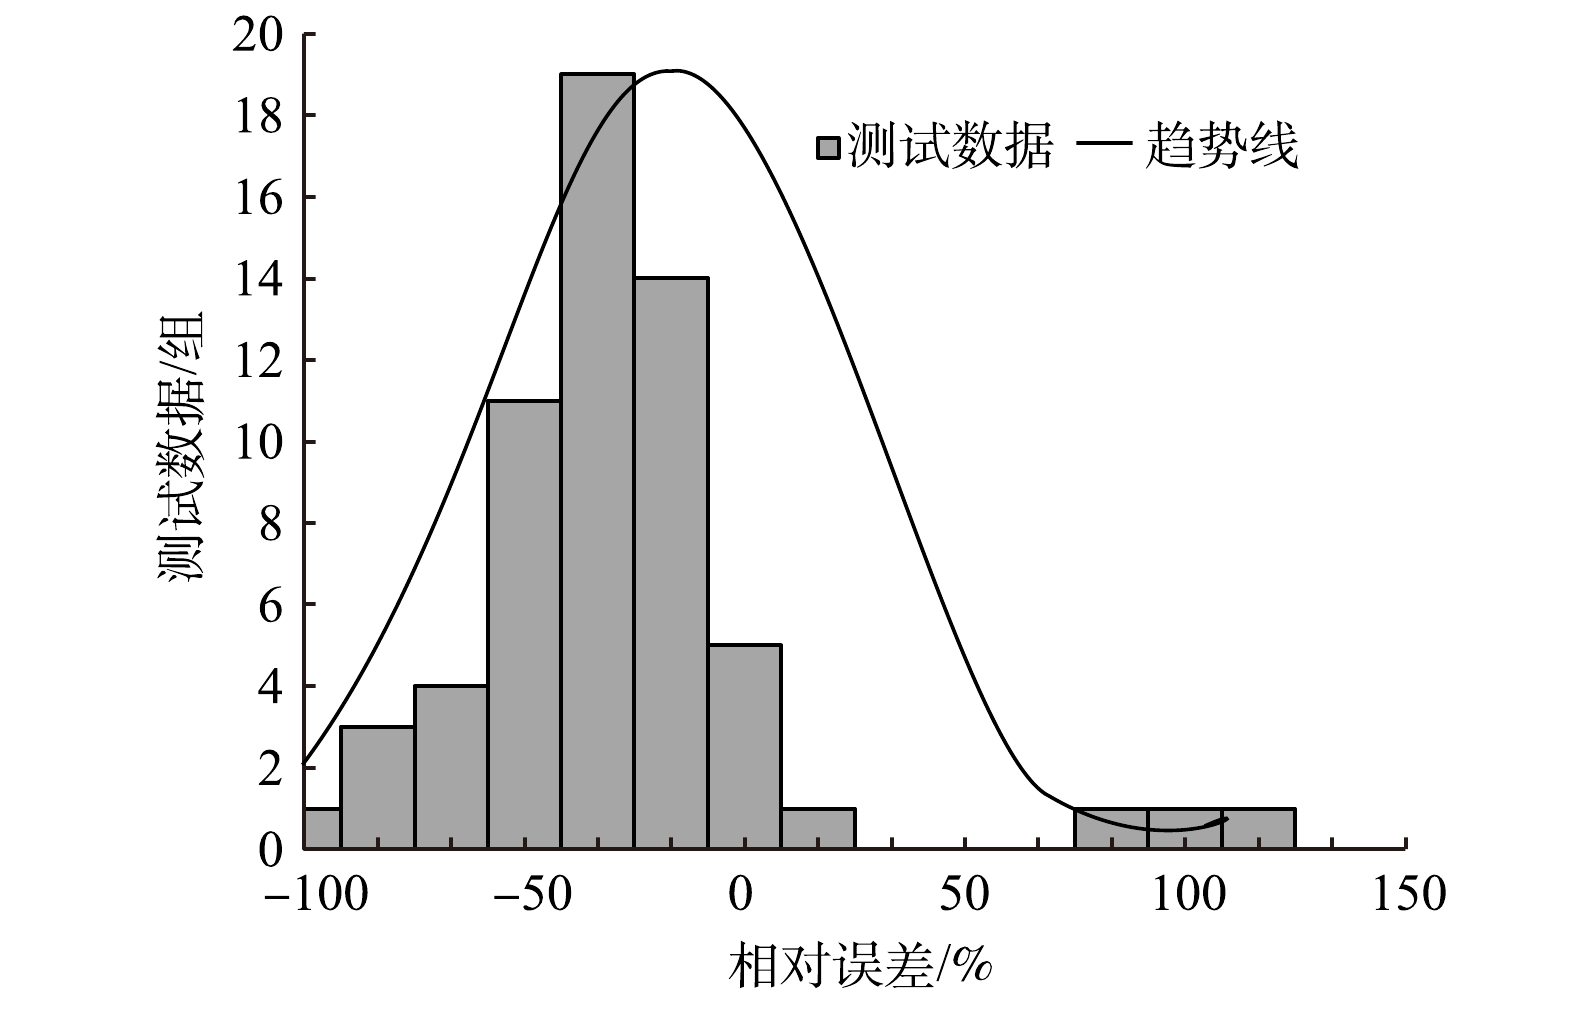
图 4 实际水体样品比对测试结果相对误差分布直方图
Figure 4. Histogram of the relative error distribution of actual water sample comparison test results
Figure
4 ,Table
5 个