-
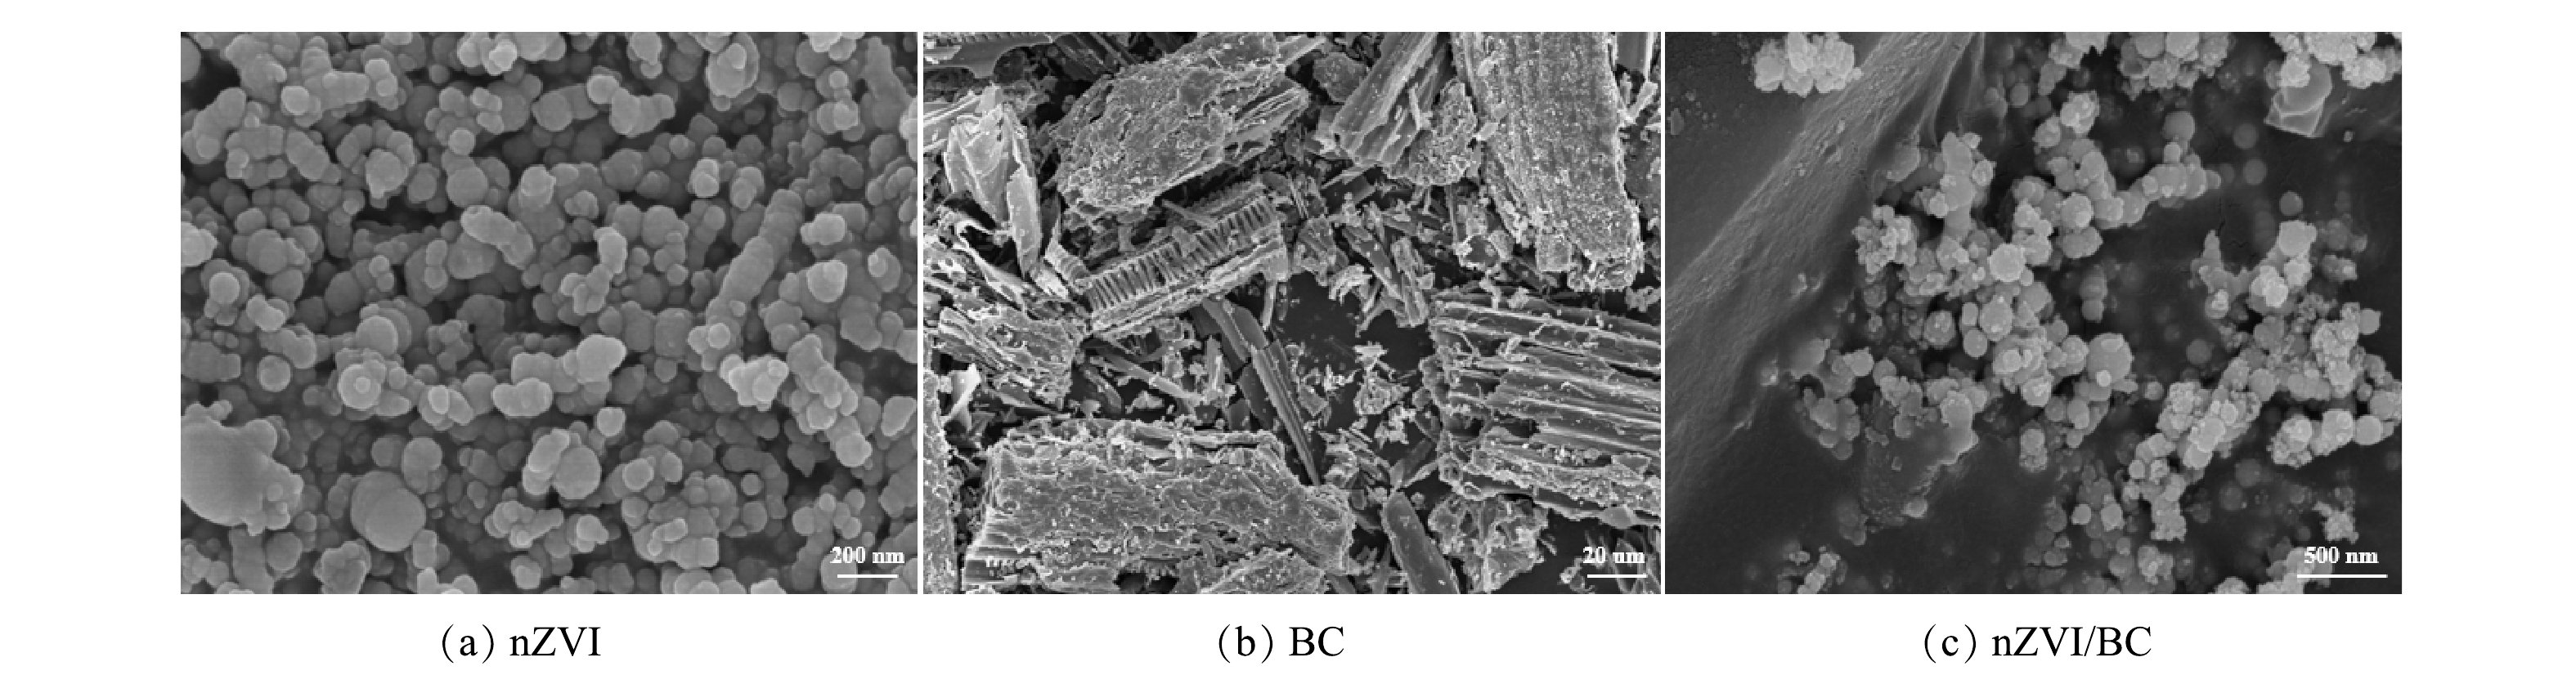
图 1 nZVI、BC和nZVI/BC的SEM图
Figure 1. SEM images of nZVI, BC and nZVI/BC
-
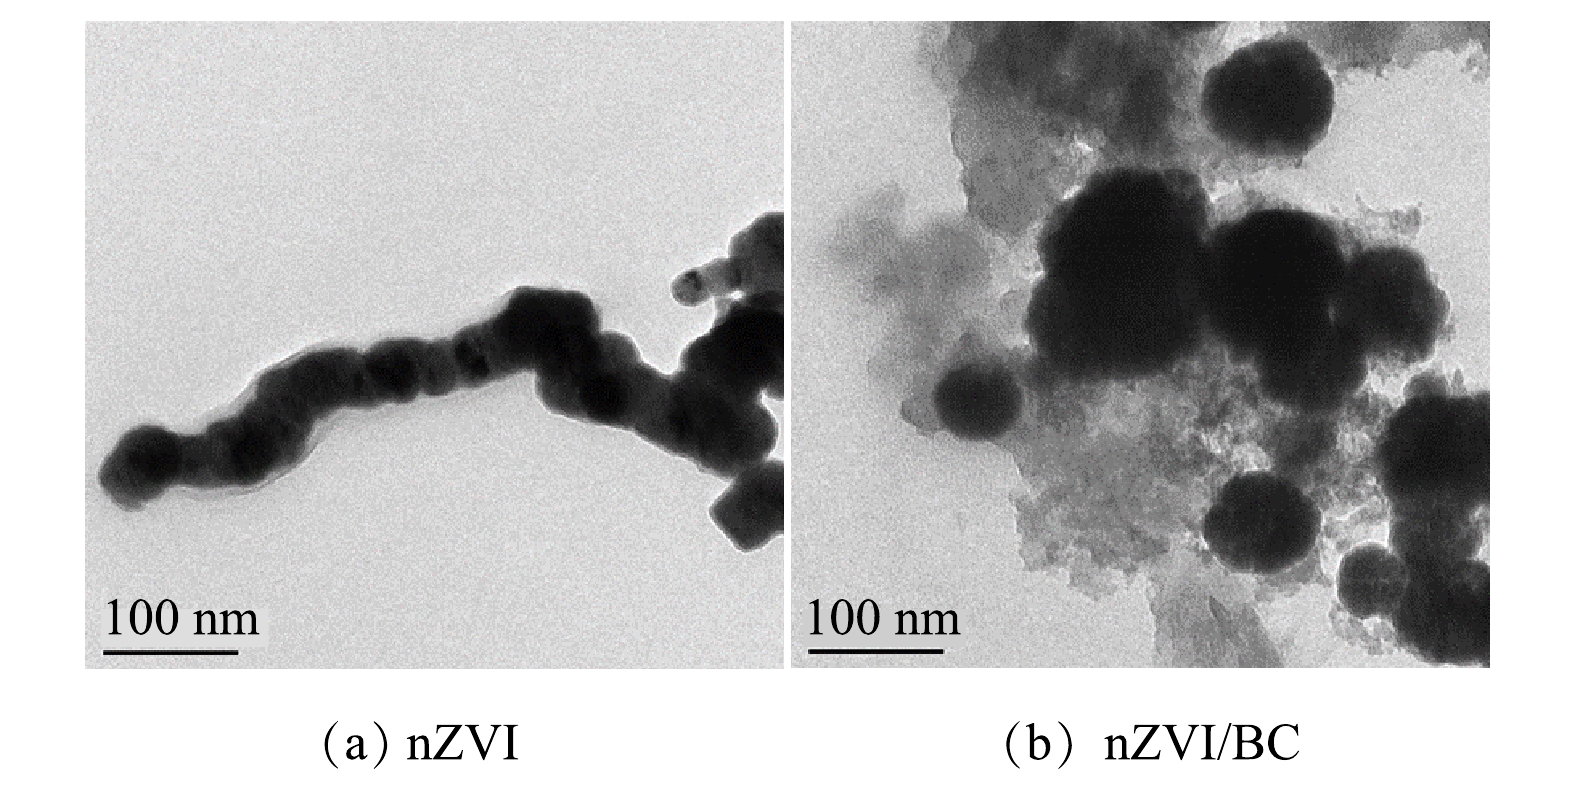
图 2 nZVI和nZVI/BC的TEM图
Figure 2. TEM images of nZVI and nZVI/BC
-
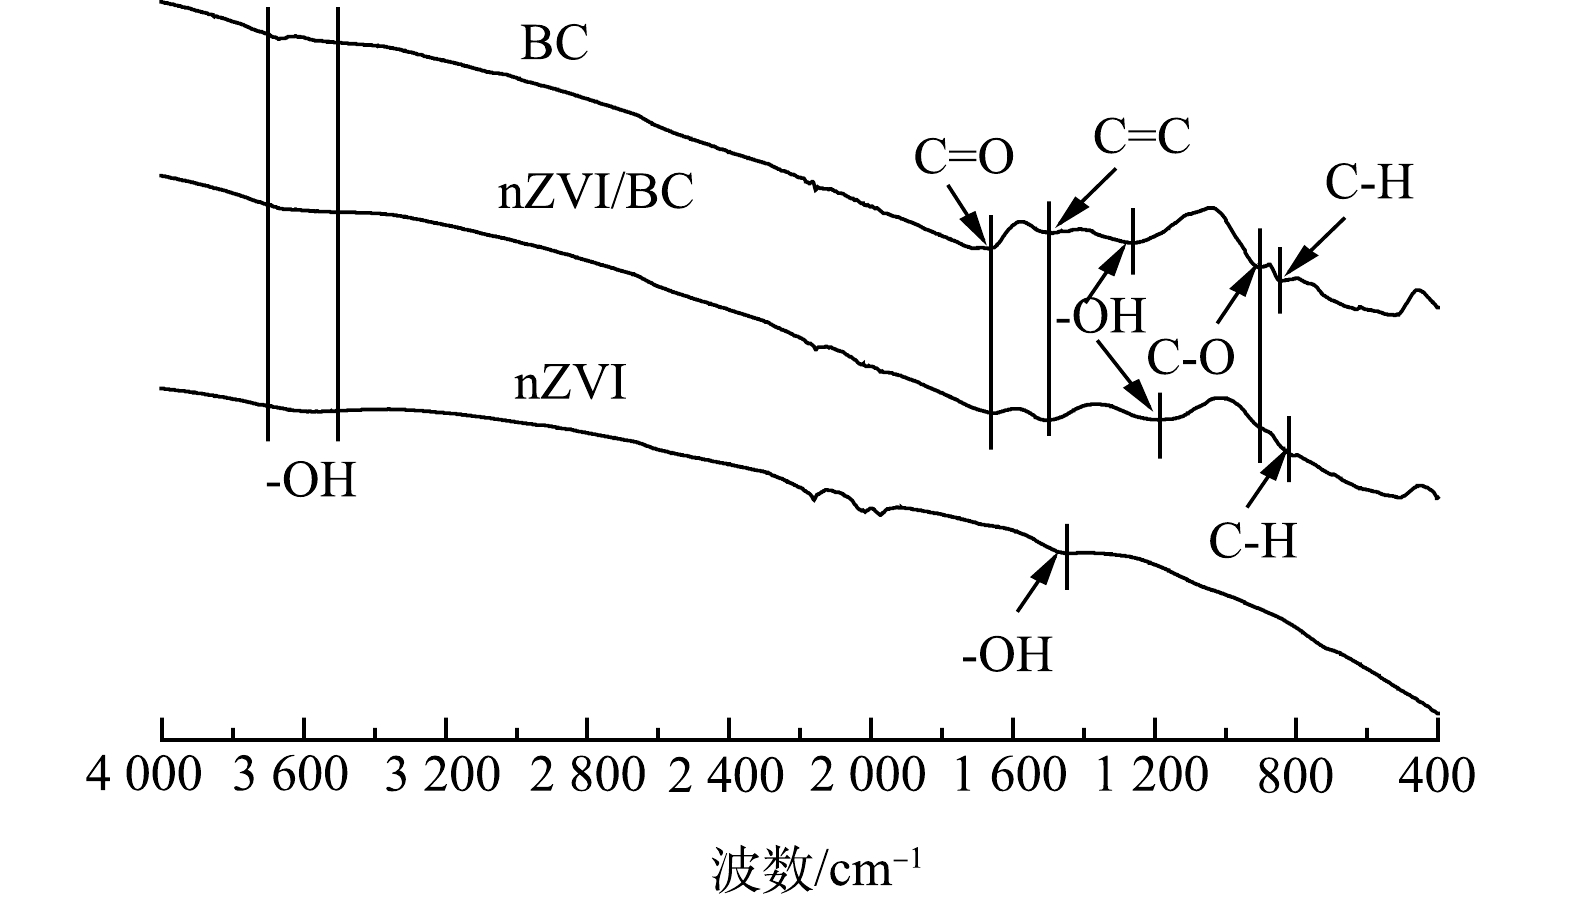
图 3 nZVI、BC和nZVI/BC的FTIR图
Figure 3. FTIR spectra of nZVI, BC and nZVI/BC
-
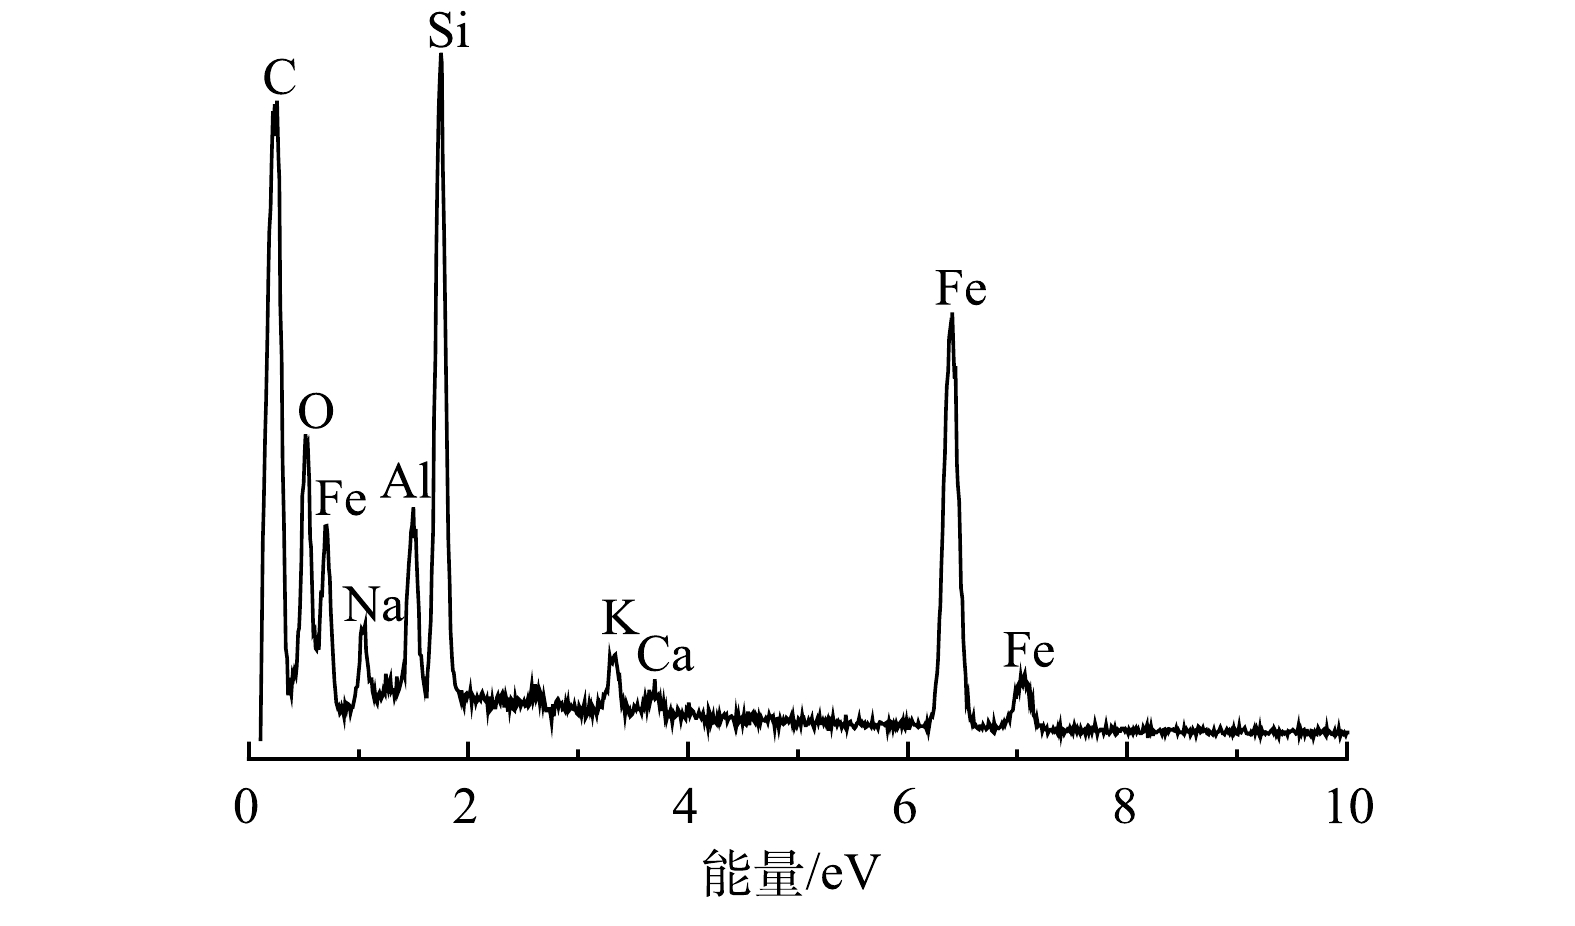
图 4 nZVI/BC的EDS图
Figure 4. EDS spectra of nZVI/BC
-
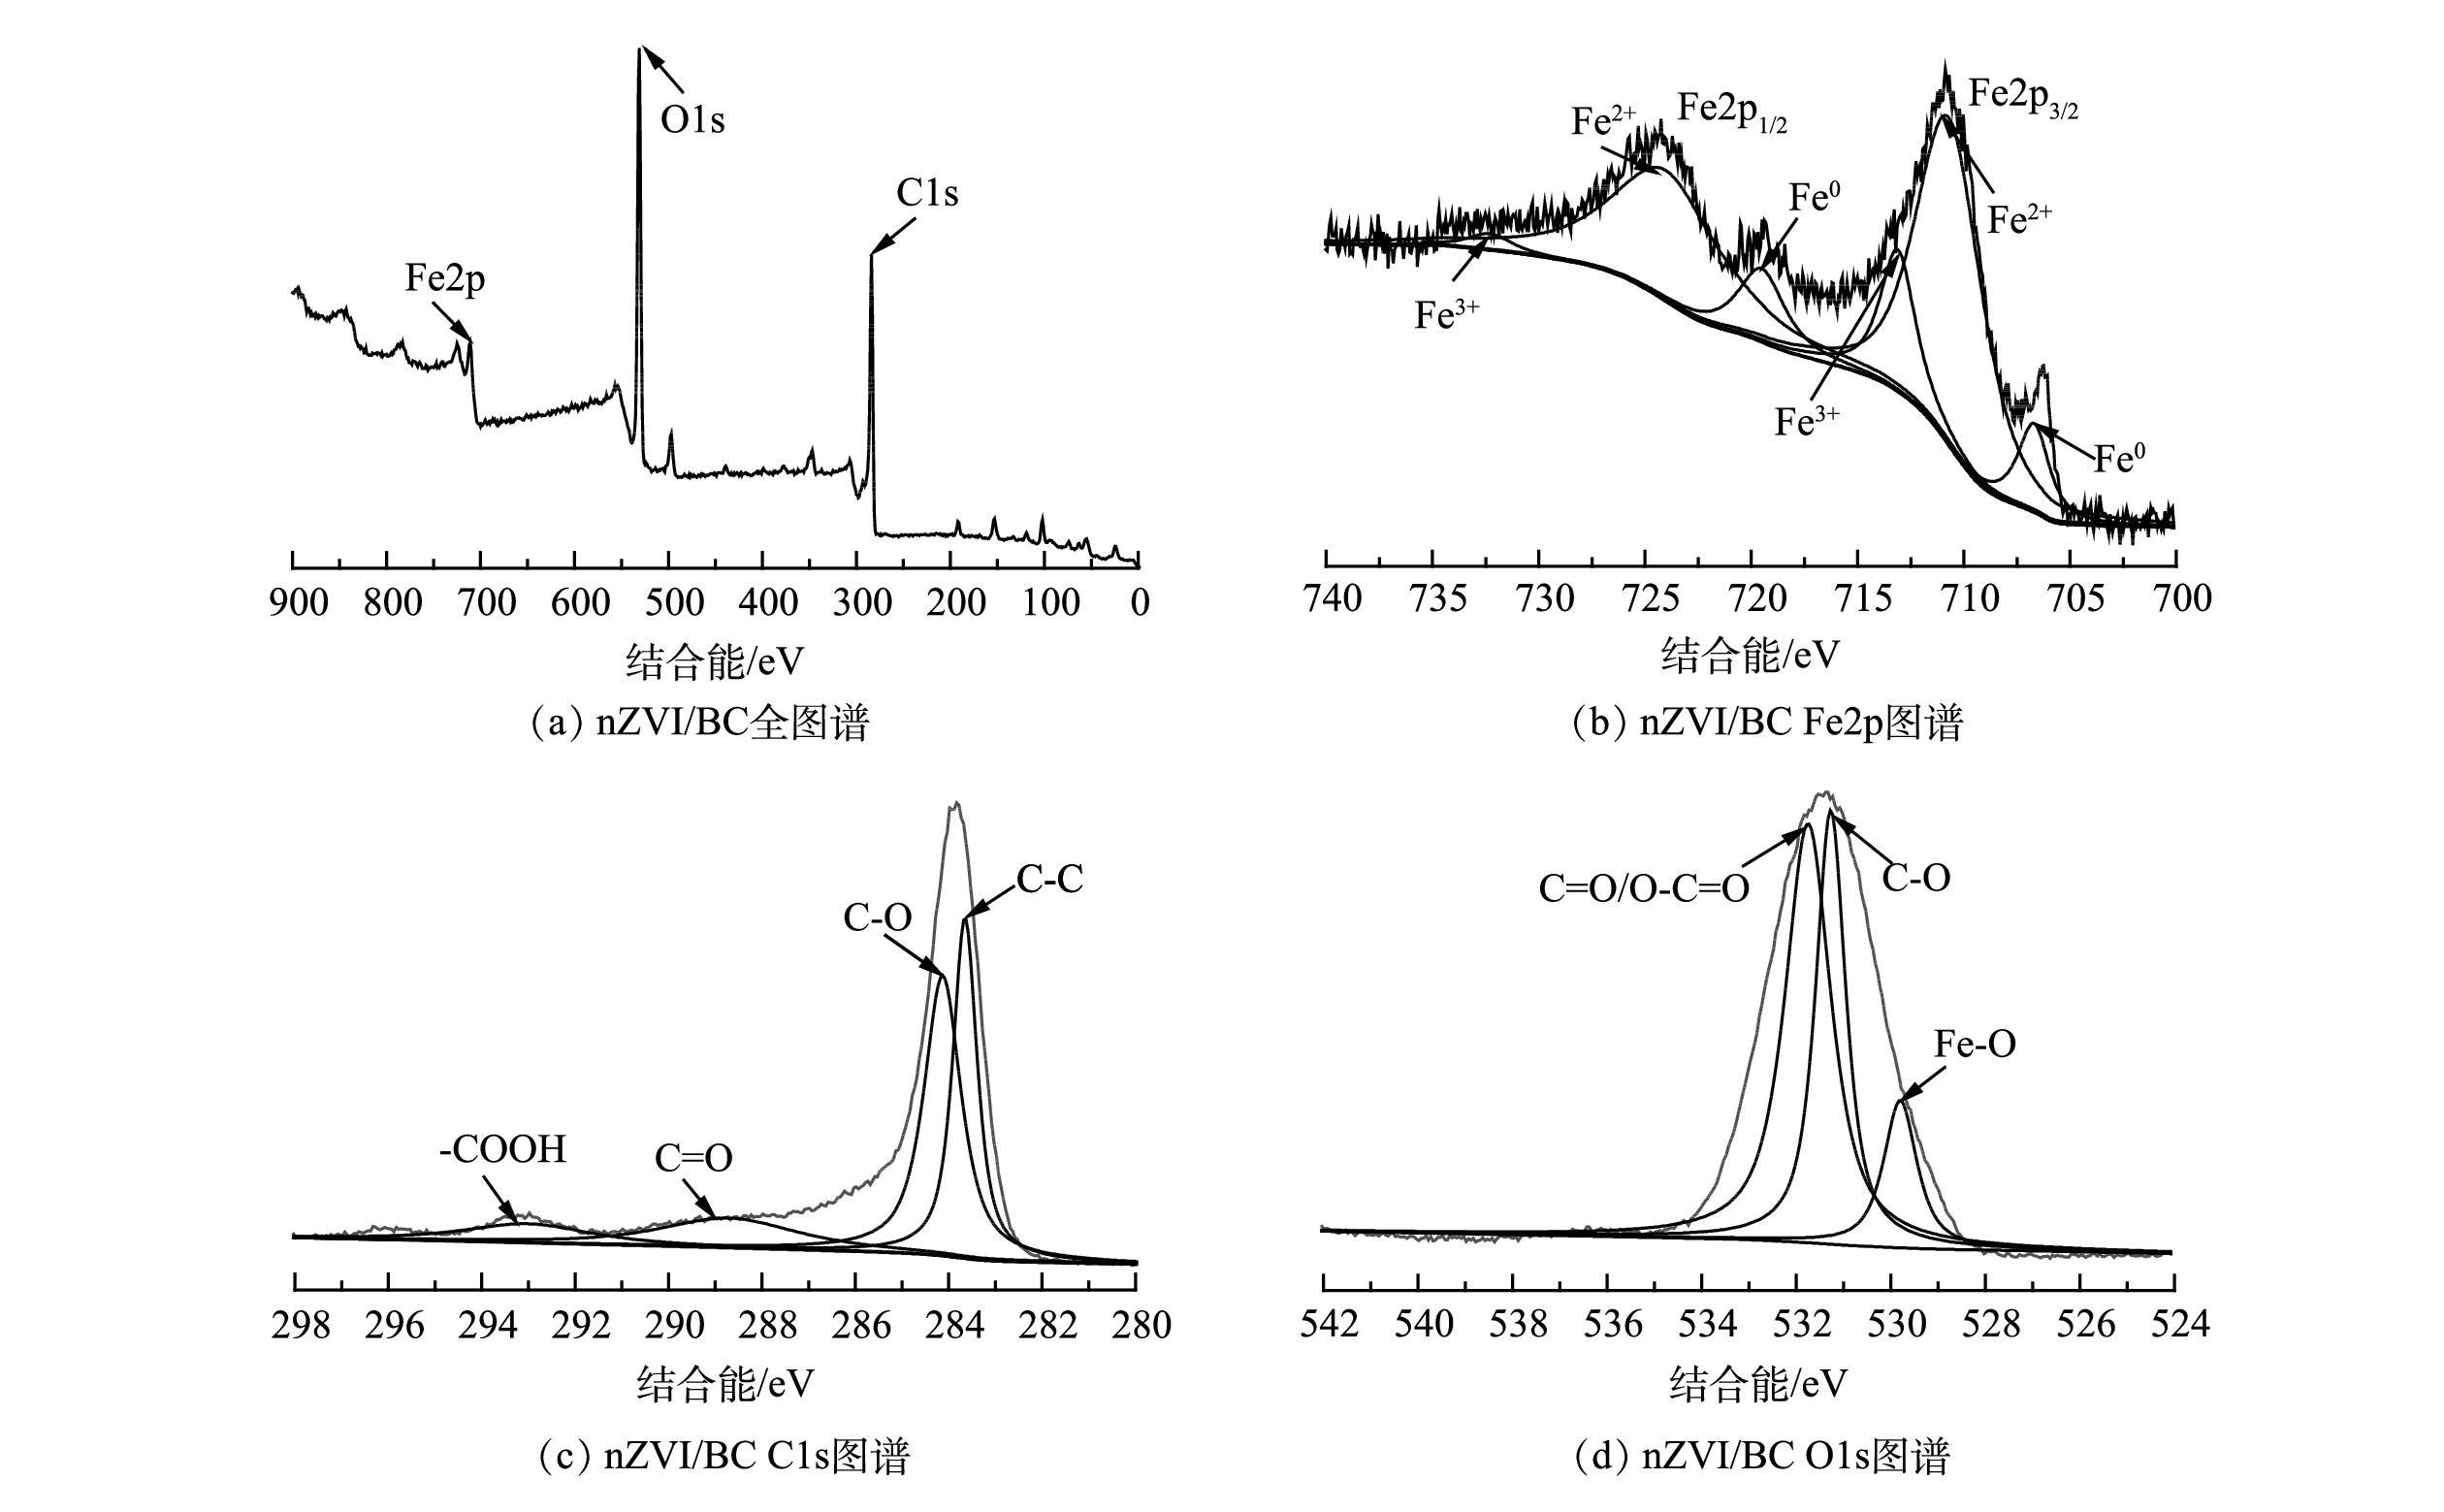
图 5 nZVI/BC的XPS图谱
Figure 5. XPS spectra of nZVI/BC
-
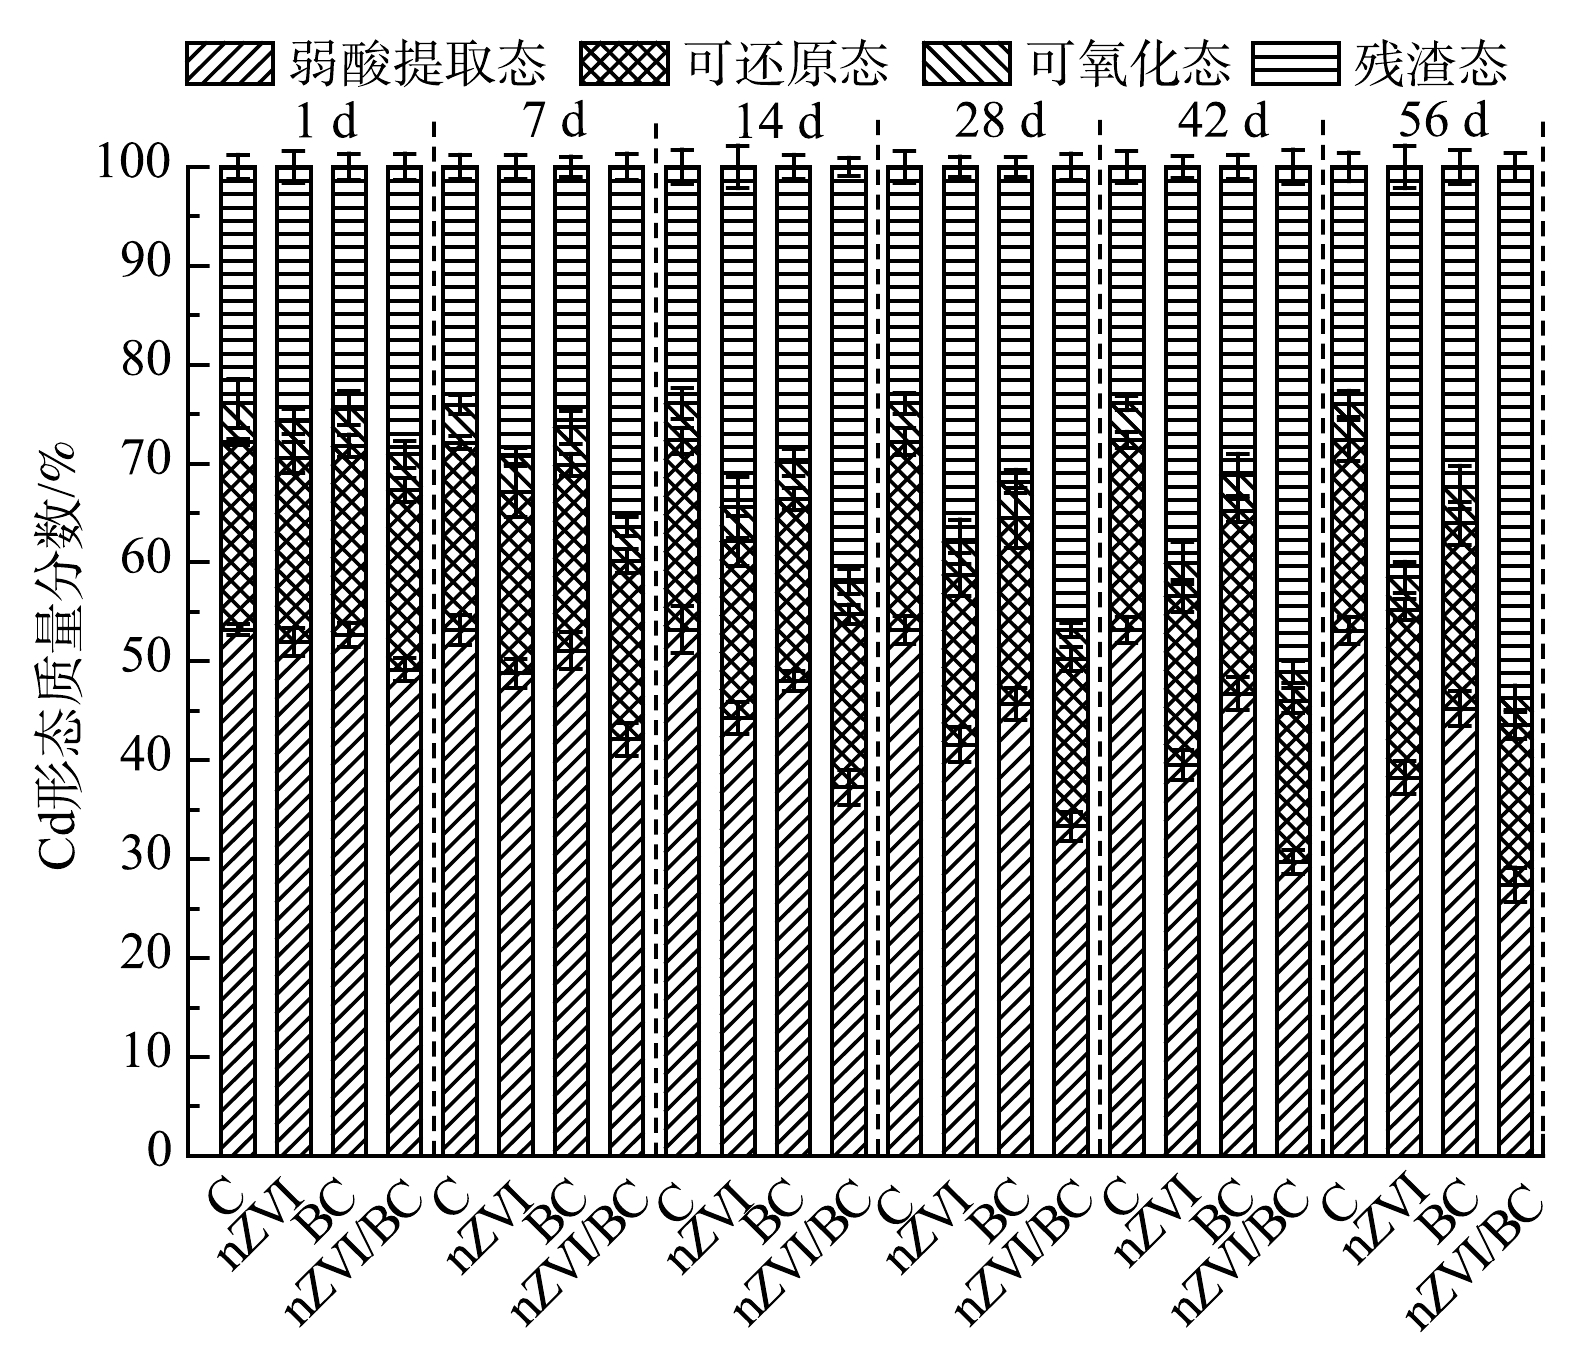
图 6 修复过程中底泥Cd形态的变化
Figure 6. Changes of Cd speciation in sediment during remediation
-
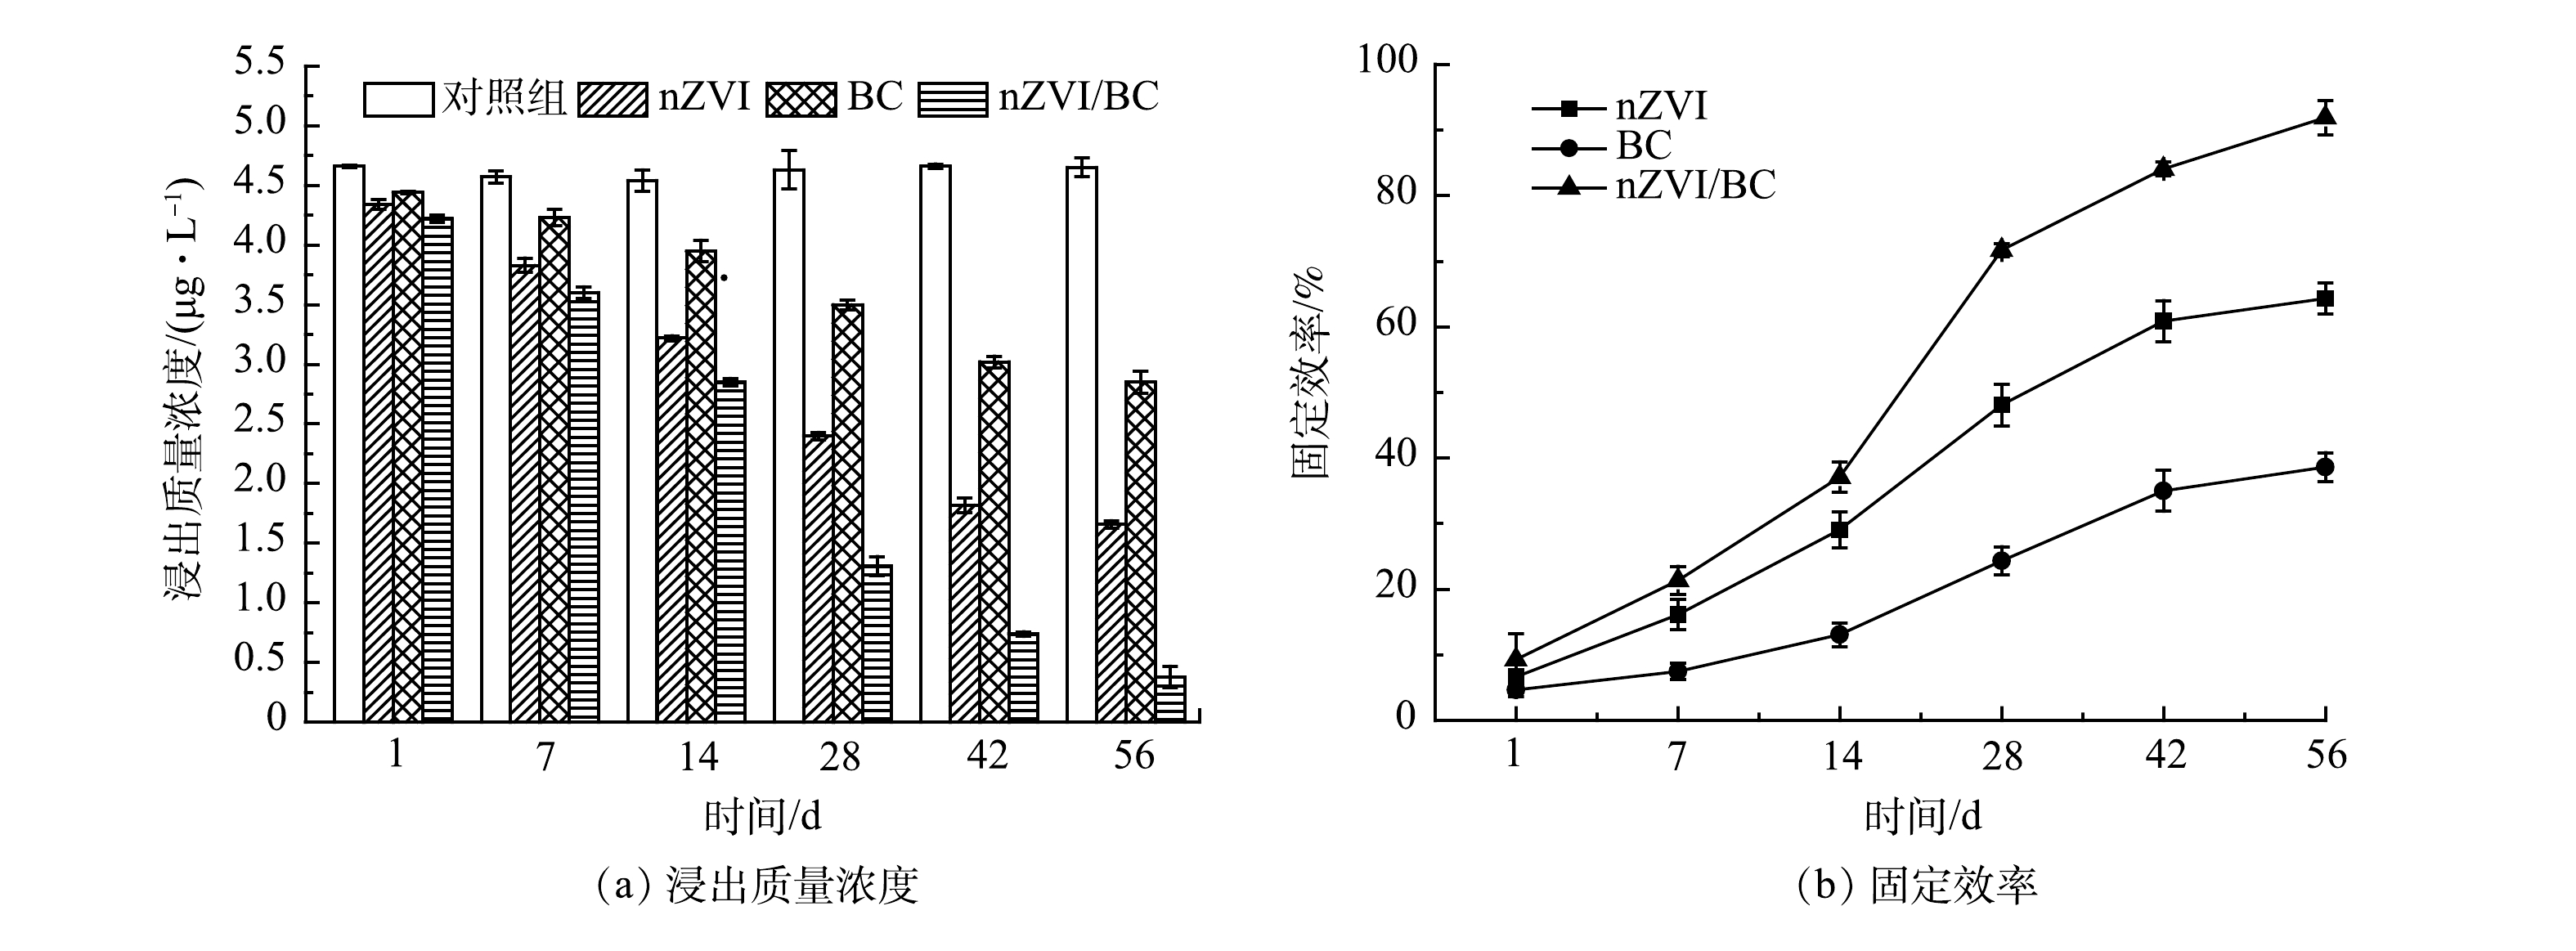
图 7 修复过程中底泥Cd浸出质量浓度和固定效率
Figure 7. Leaching mass concentration and immobilization efficiency of Cd in sediment during remediation
-
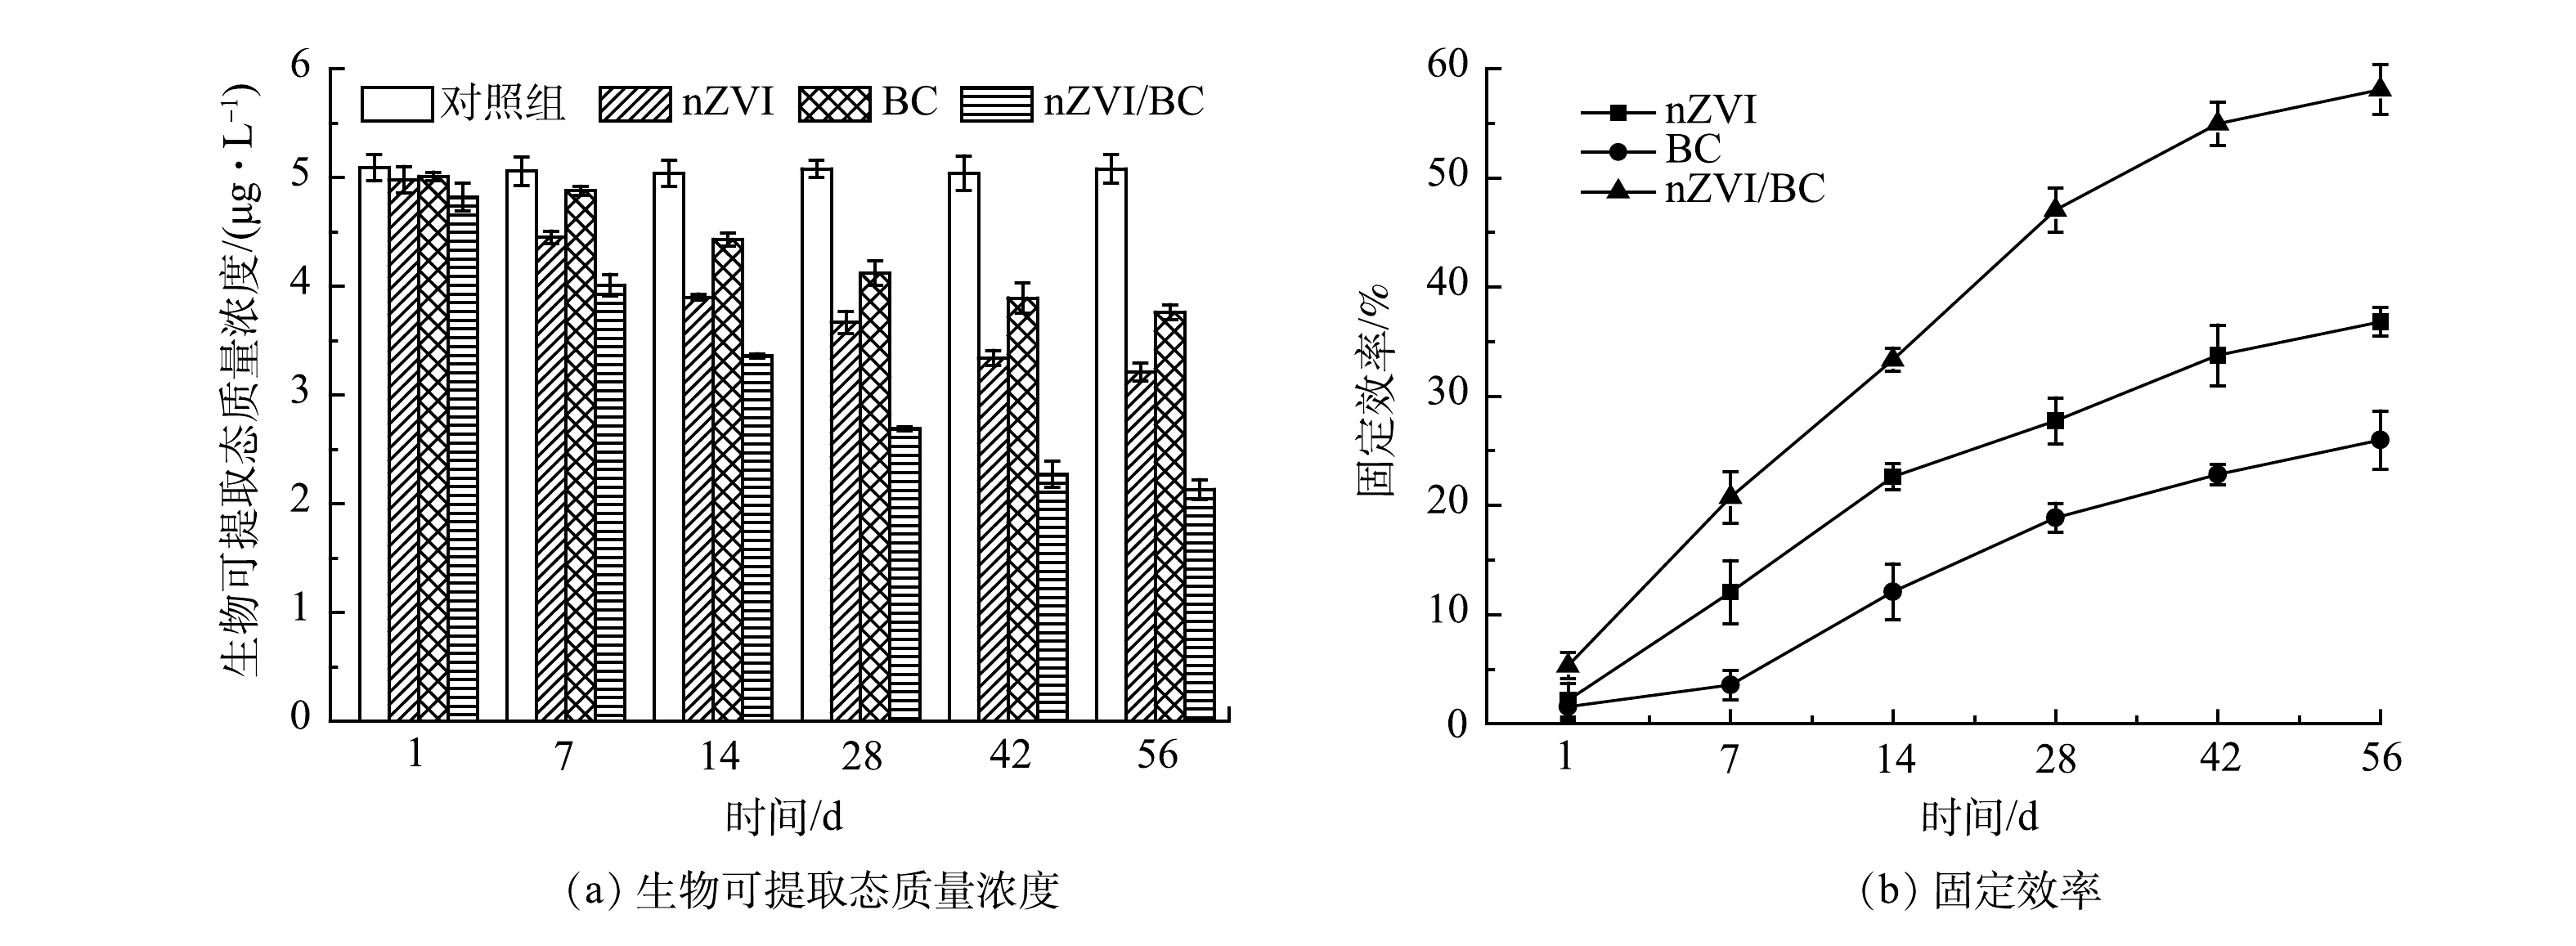
图 8 修复过程中底泥Cd生物可提取态质量浓度和固定效率
Figure 8. Bioavailable mass concentration and immobilization efficiency of Cd in sediment during remediation
-
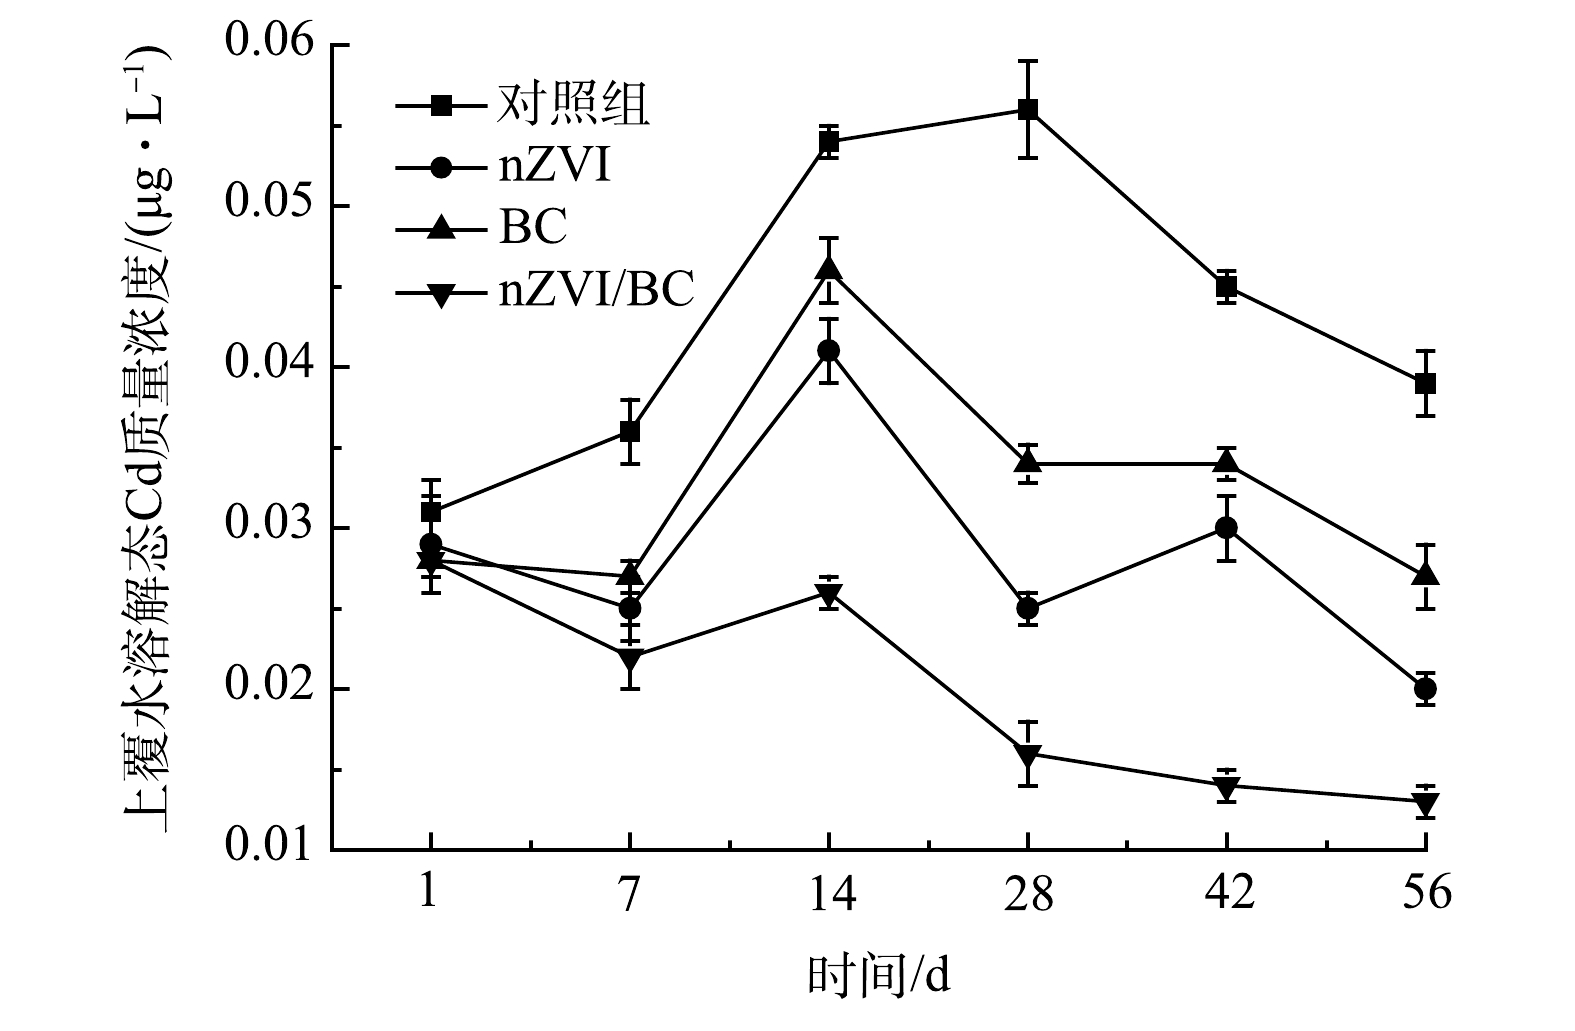
图 9 修复过程中上覆水溶解态Cd质量浓度的变化
Figure 9. Changes of dissolved Cd mass concentration in overlying water during remediation
-
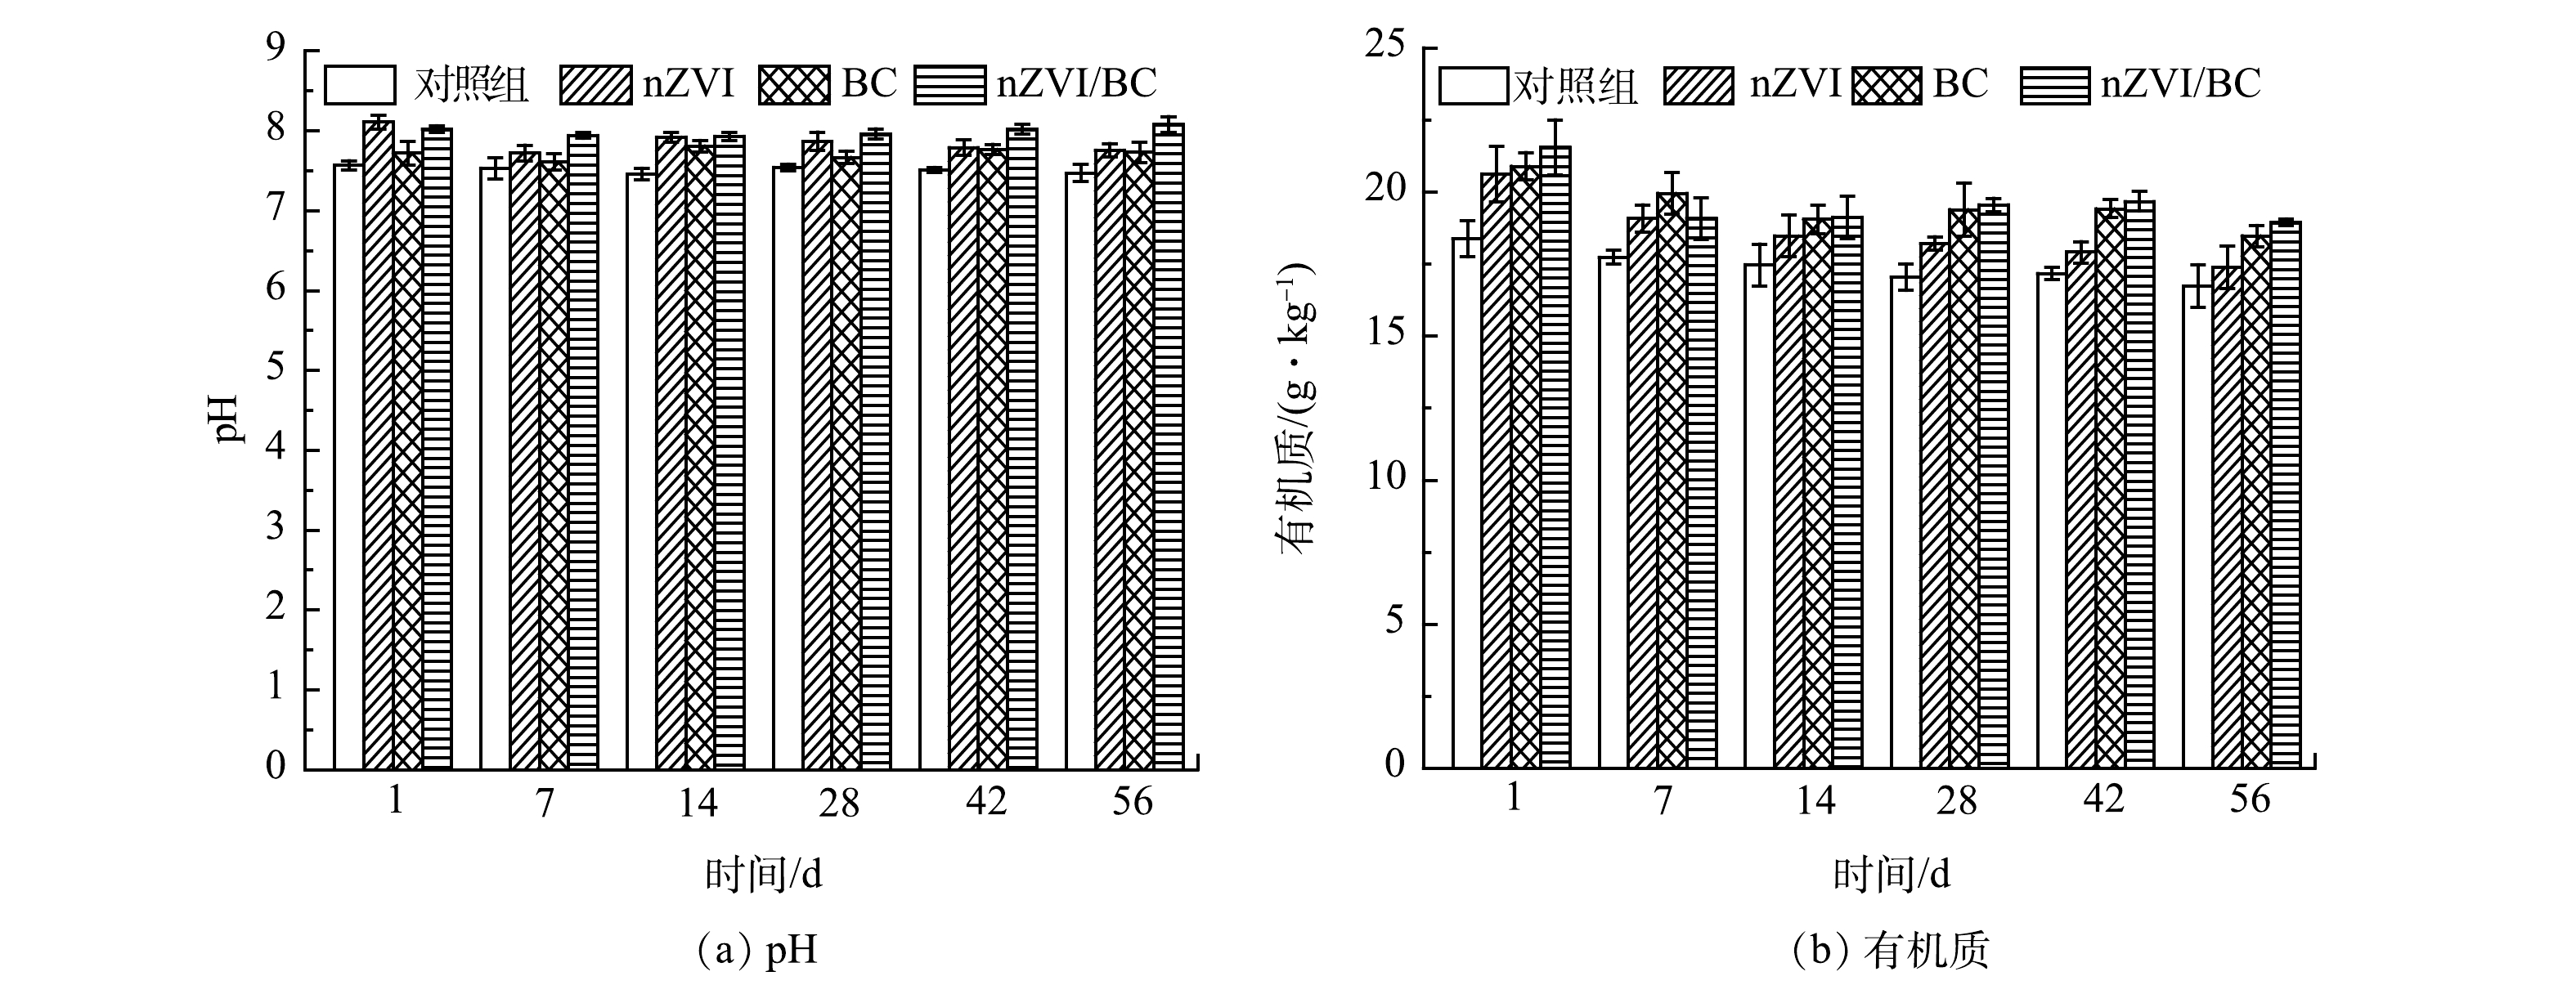
图 10 修复过程中底泥pH和有机质的变化
Figure 10. Changes of pH and organic matter in sediment during remediation
Figure
10 ,Table
0 个