-

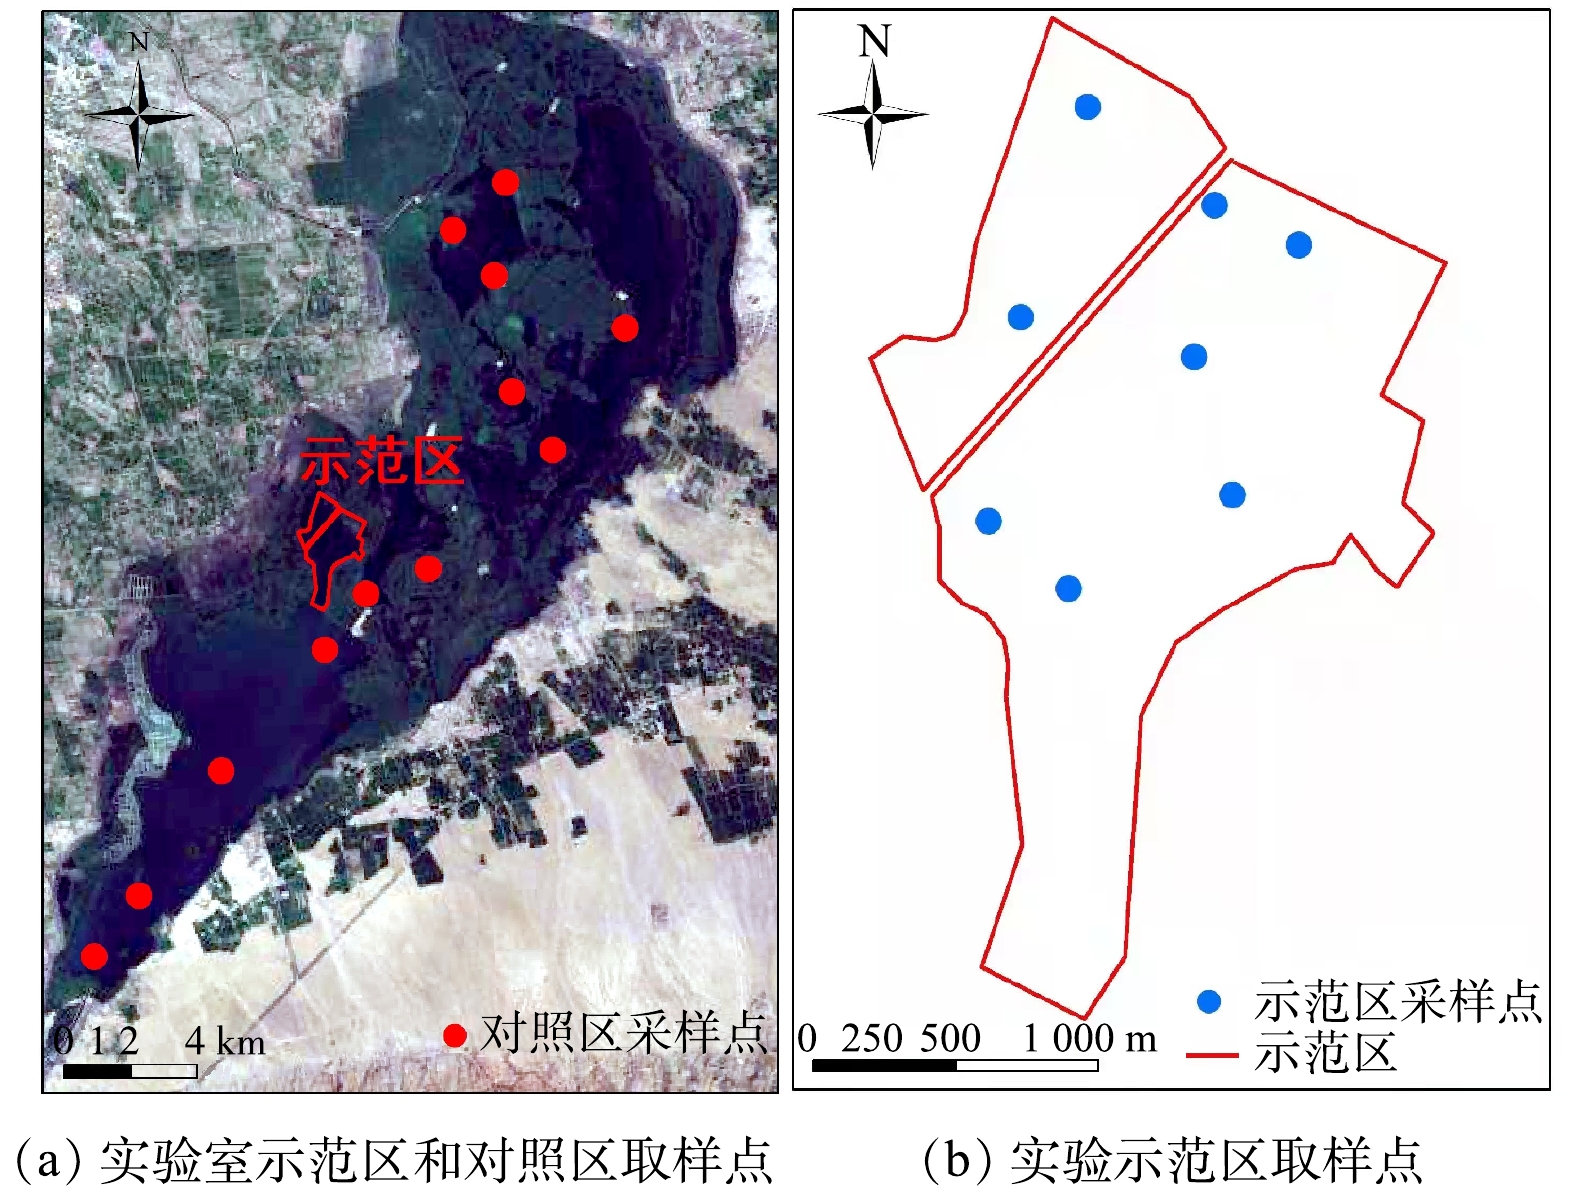
图 1 实验区地理位置及采样点示意图
Figure 1. Geographic location and sketch map of sampling points in the experimental area
-

图 2 实验示范研究的总体思路、野外实验现场、太阳能曝气设施
Figure 2. General idea frame diagram of the experimental demonstration research, field experiment scene and schematic diagram of solar aeration facility
-

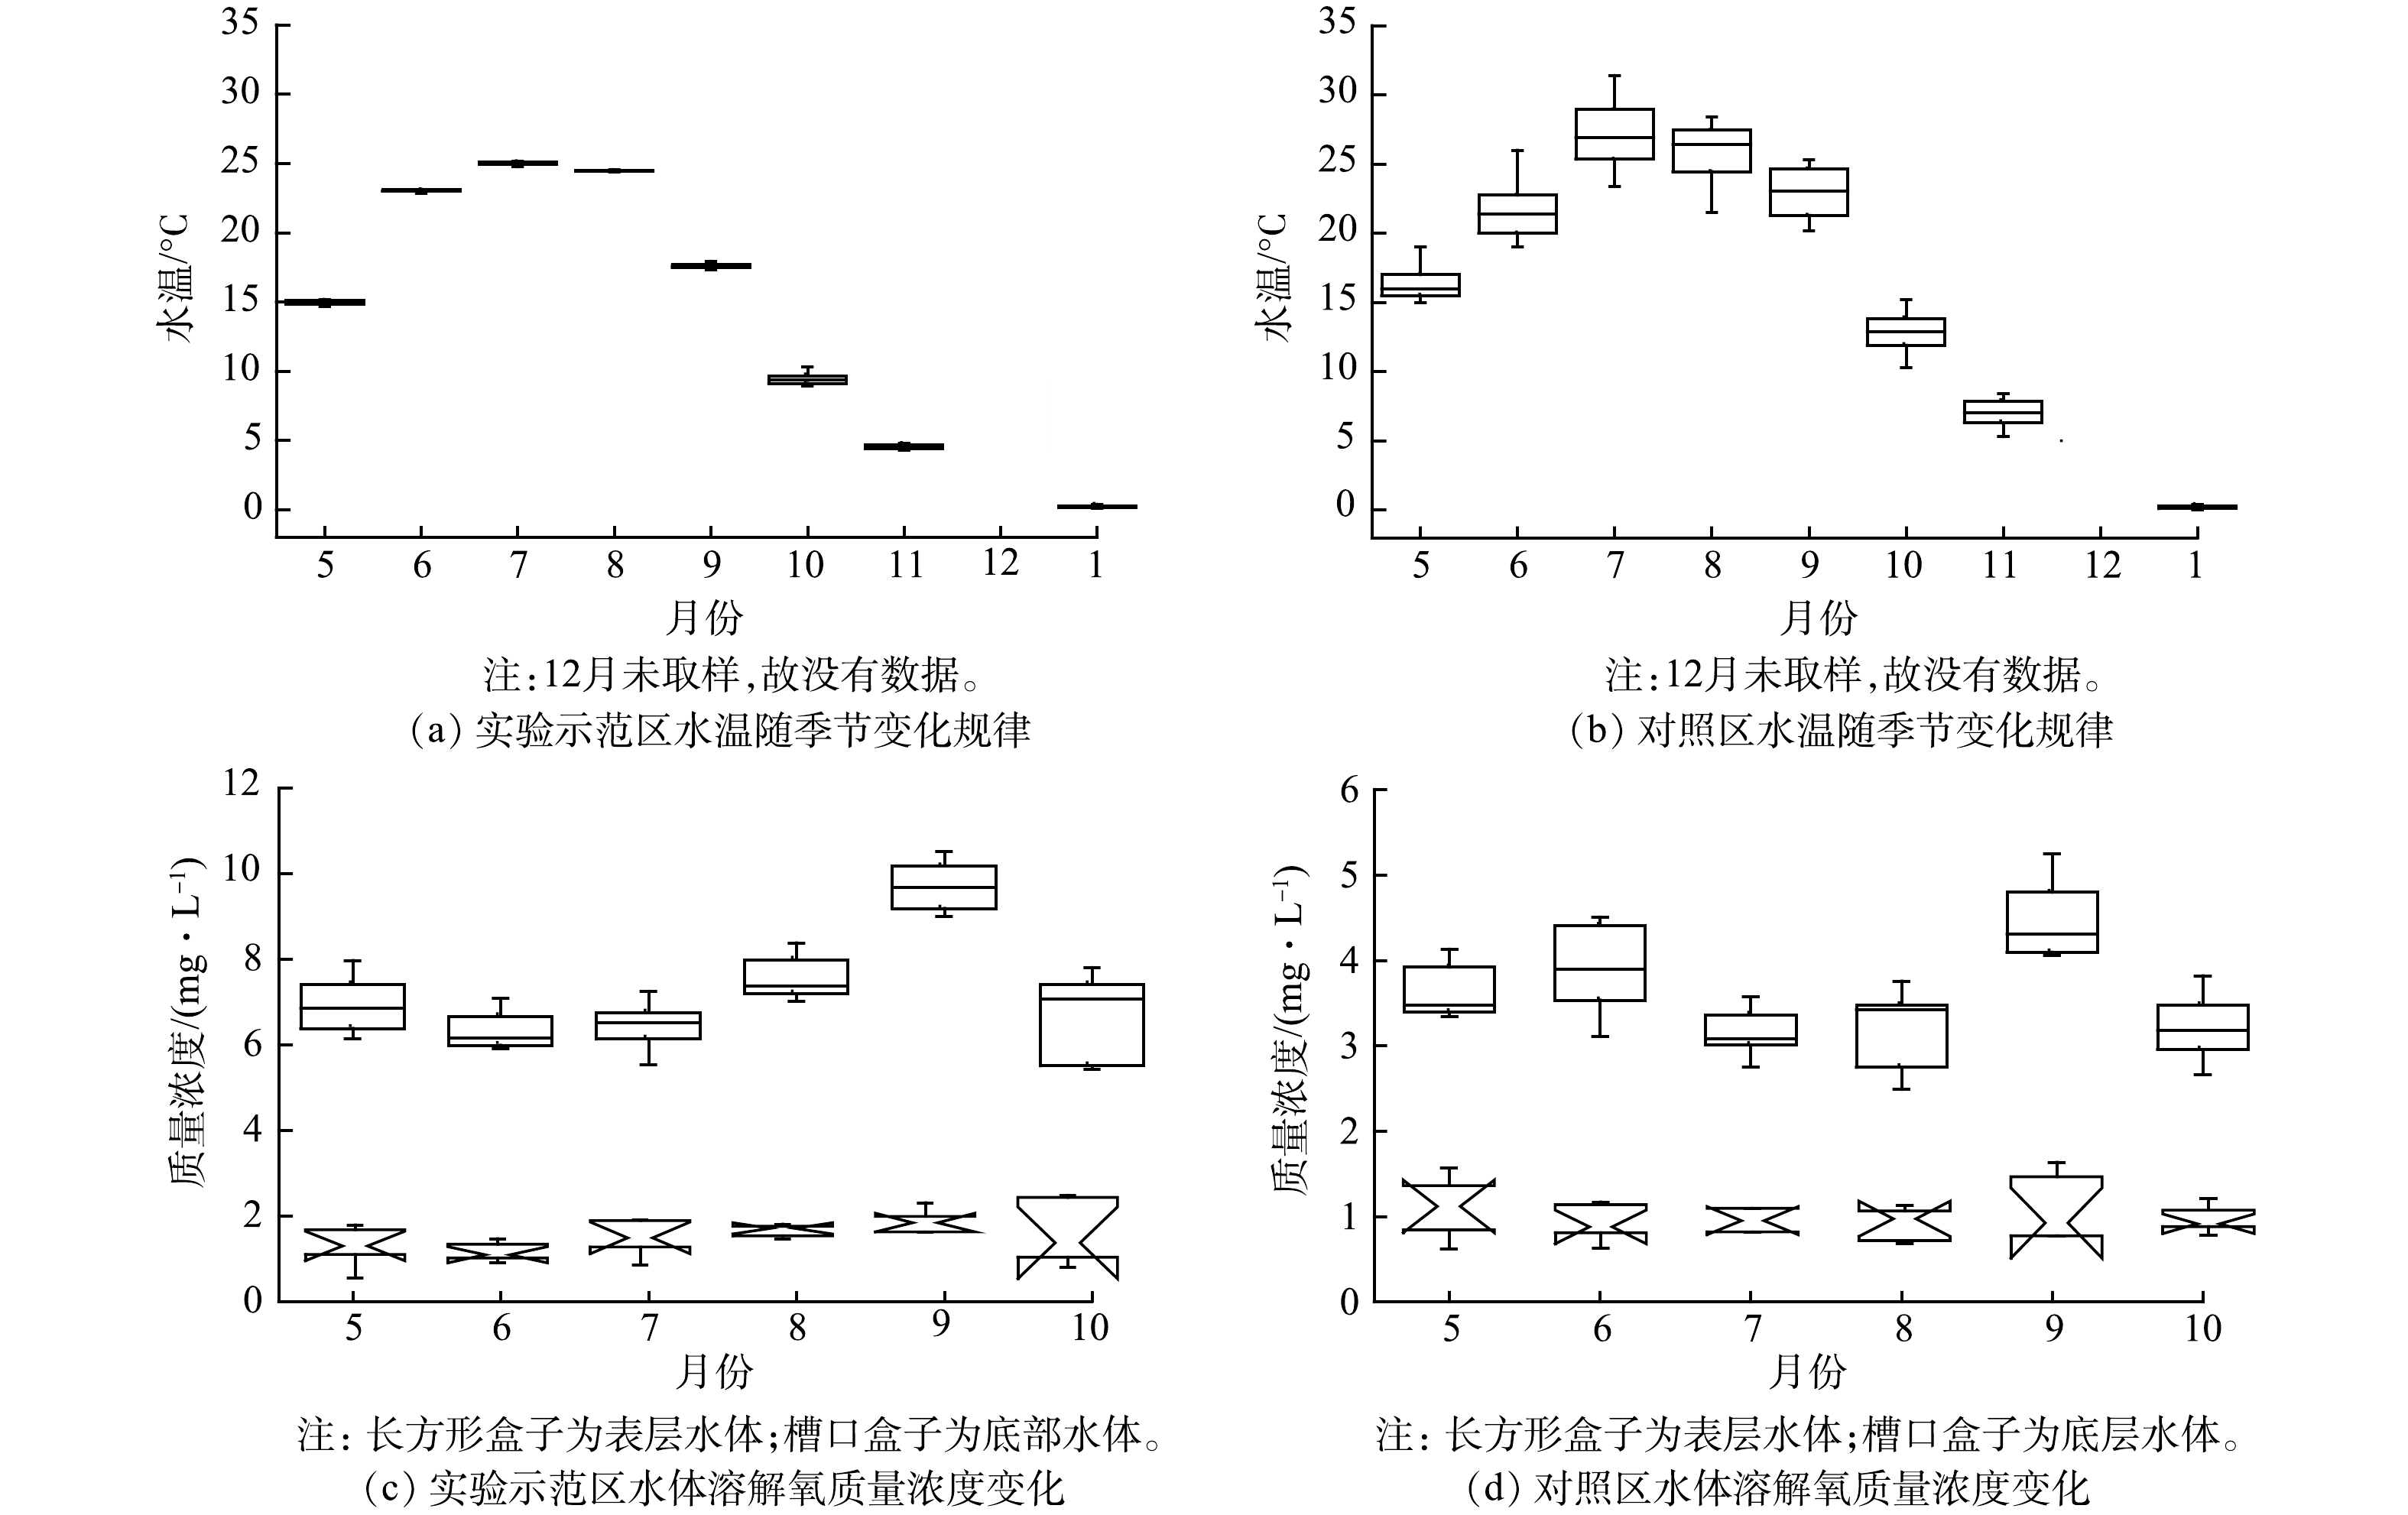
图 3 乌梁素海实验示范区和对照区水温随季节变化的规律及水体表层和底部溶解氧质量浓度变化
Figure 3. Seasonal variation of temperature, dissolved oxygen mass concentration at surface and bottom of water body at experimental demonstration area and the control area of Wuliangsu Lake
-

图 4 乌梁素海实验示范区和对照区水体电导率和pH值随季节变化的规律
Figure 4. Seasonal variation of water conductivity and pH value in experimental demonstration area and the control area of Wuliangsu Lake
-

图 5 乌梁素海实验示范区和对照区水体总氮、总磷质量浓度随季节变化规律
Figure 5. Seasonal variation of total nitrogen and total phosphorus mass concentrations in water at experimental demonstration area and the control area of Wuliangsu Lake
-

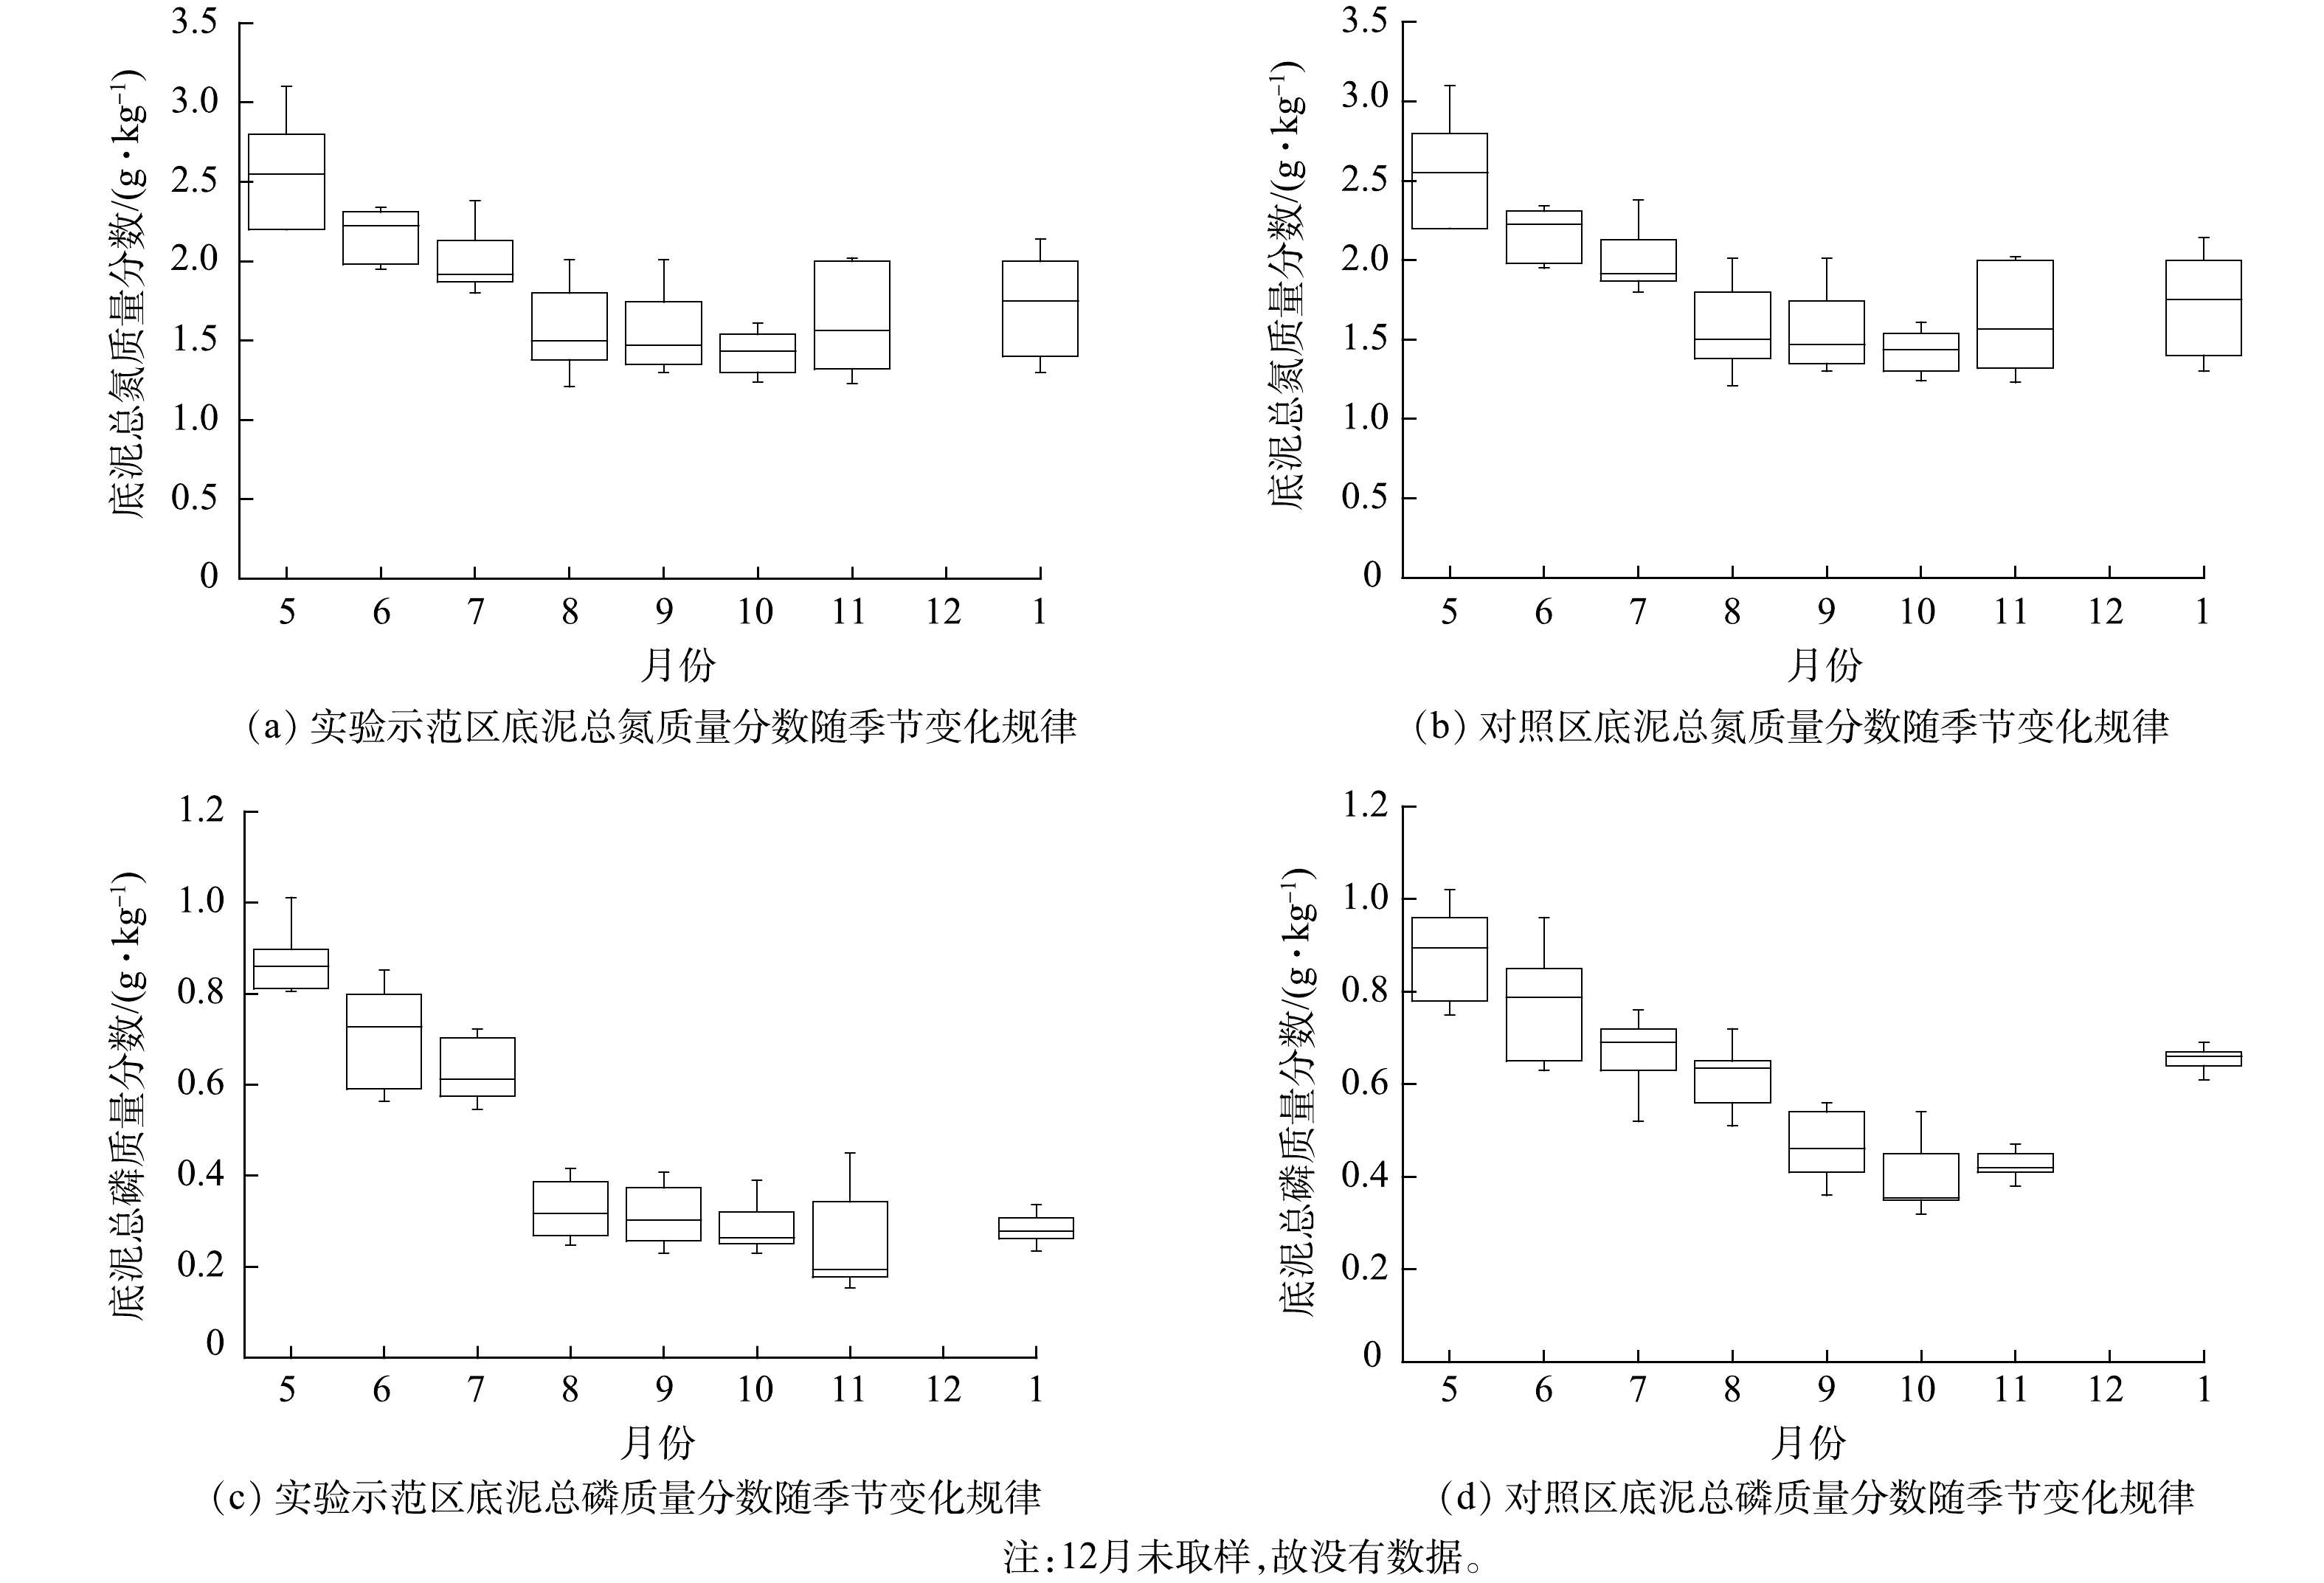
图 6 乌梁素海实验示范区和对照湖区底泥(0~10 cm)总氮、总磷质量分数随季节变化规律
Figure 6. Seasonal variation of total nitrogen and phosphorus mass fraction in sediment (0~10 cm) of the experimental demonstration area and the control area of Wuliangsu Lake
-

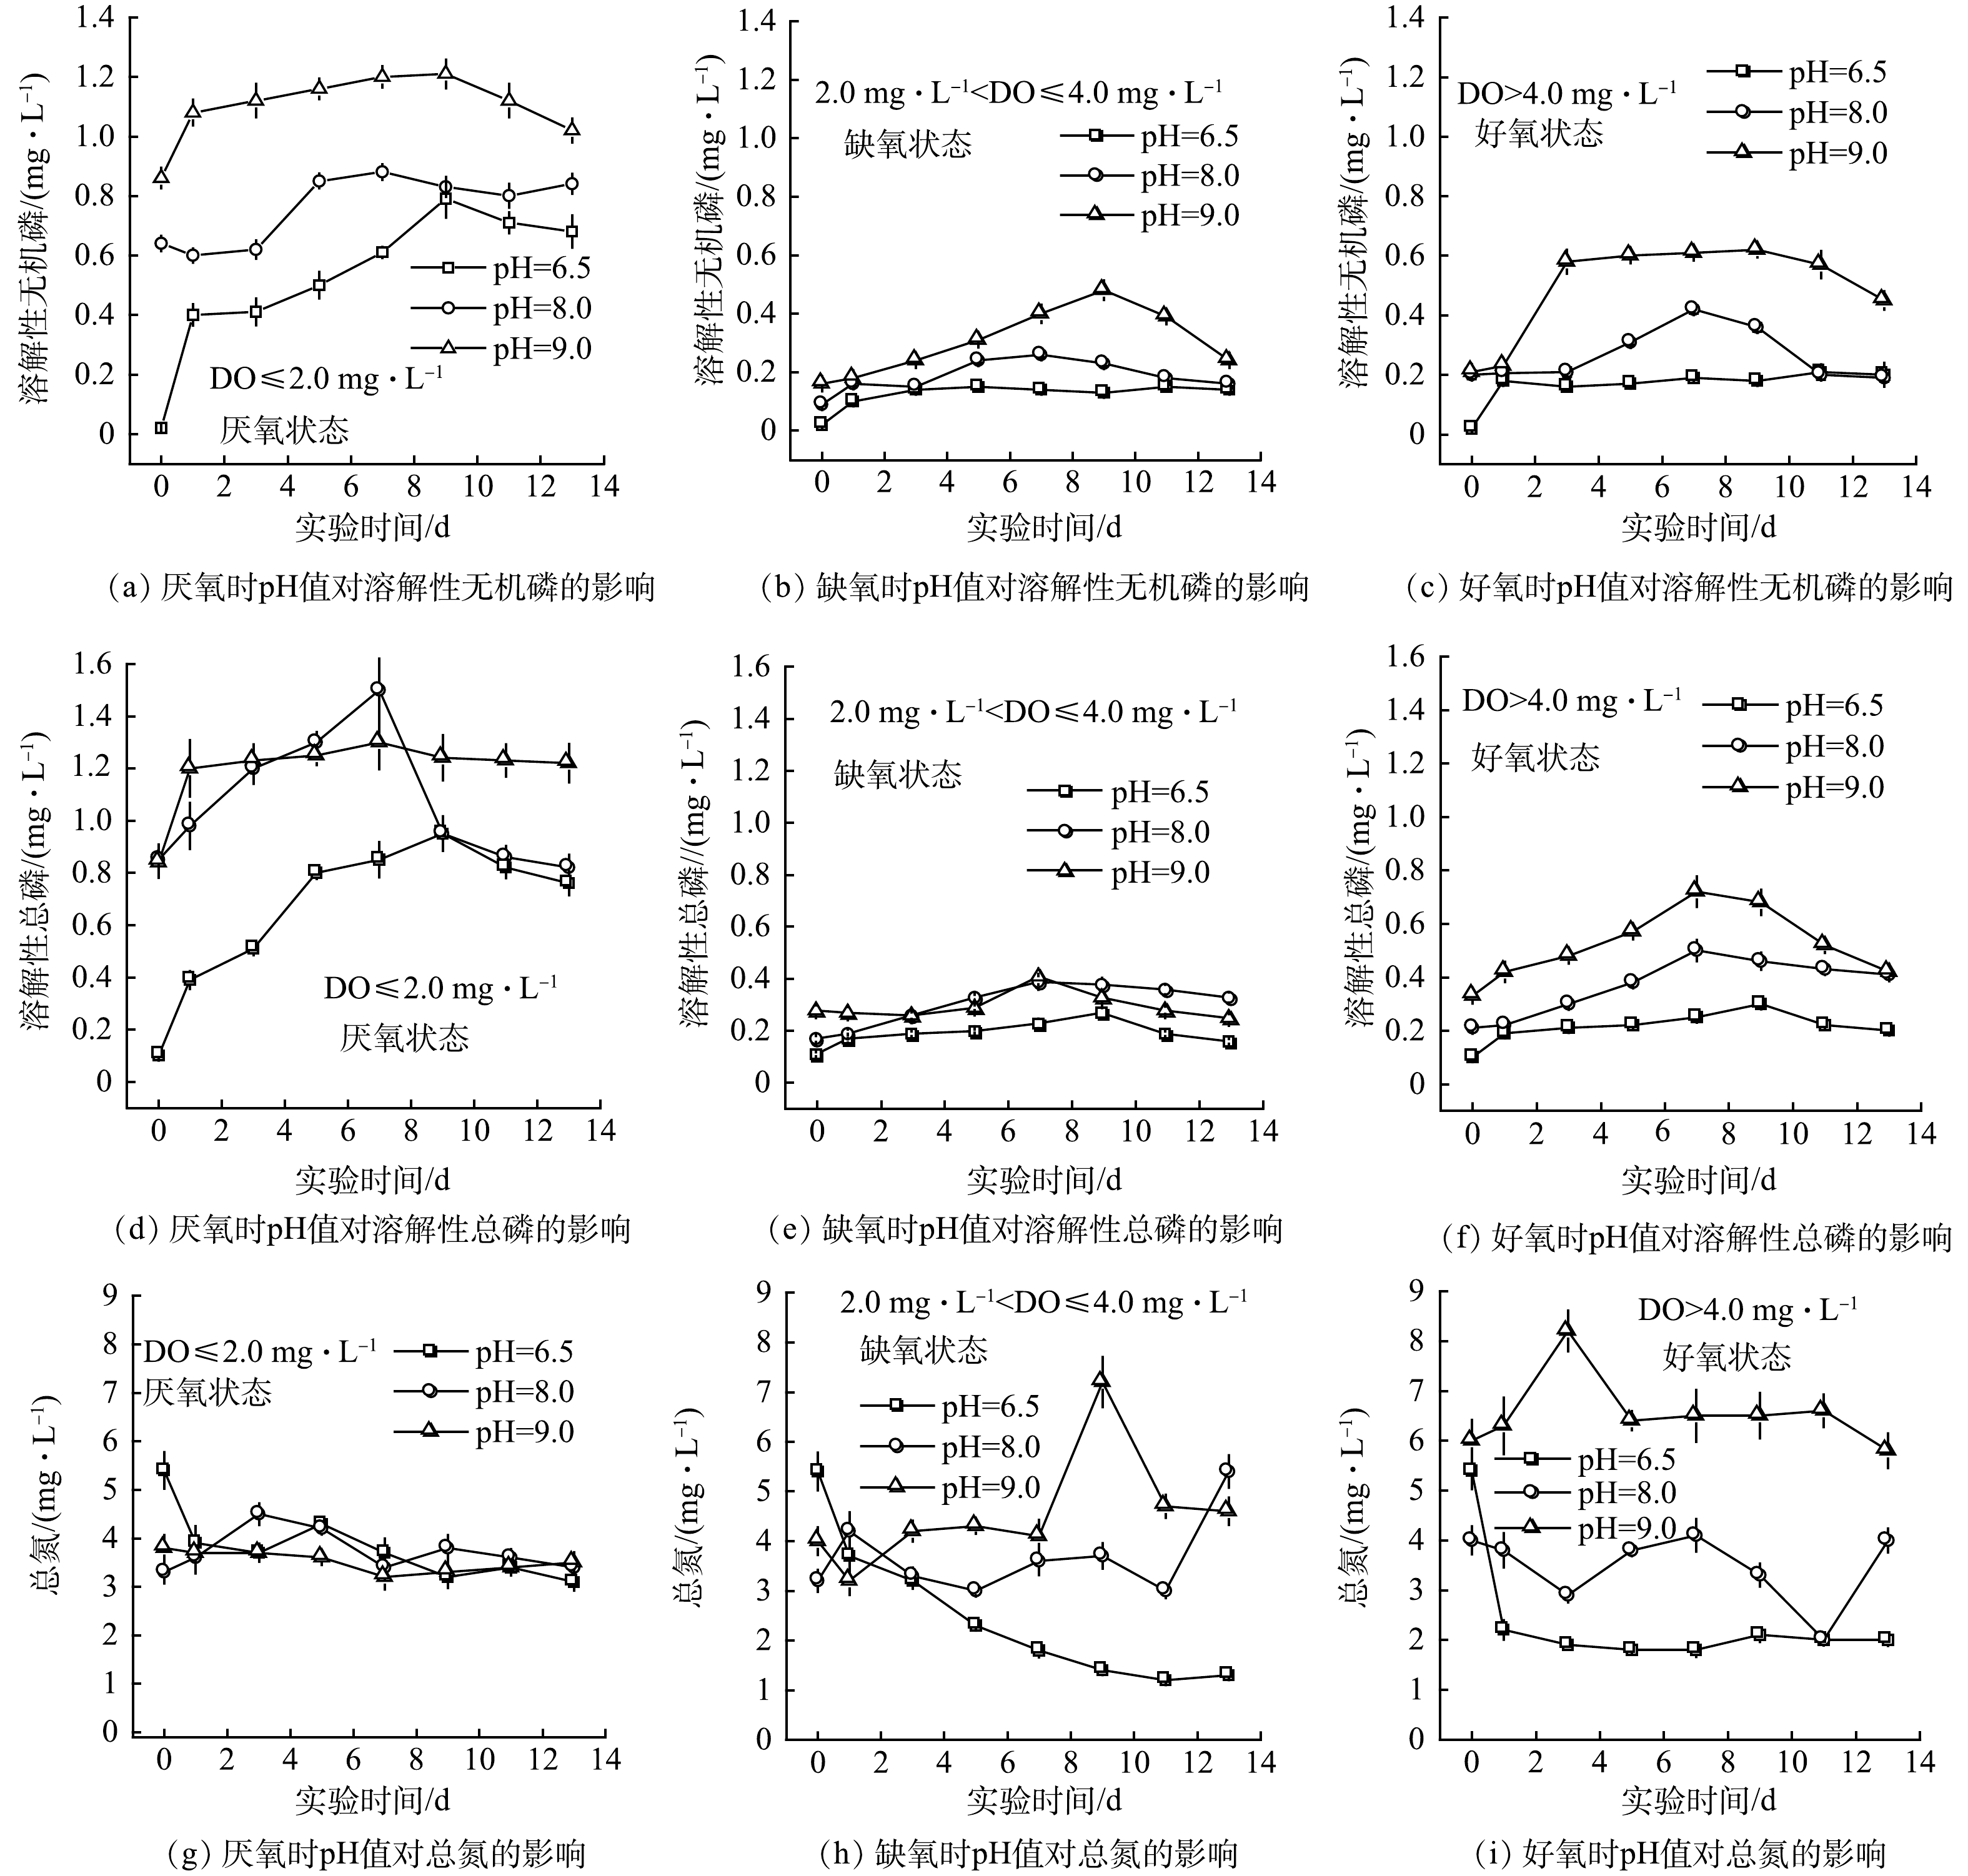
图 7 在室内模拟实验中溶解氧和pH值对原状底泥溶解性无机磷、溶解性总磷和总氮释放的影响
Figure 7. Effects of dissolved oxygen and pH value on the release of dissolved inorganic phosphorus, dissolved total phosphorus and total nitrogen from undisturbed sediment in laboratory simulation experiment.
Figure
7 ,Table
0 个