-
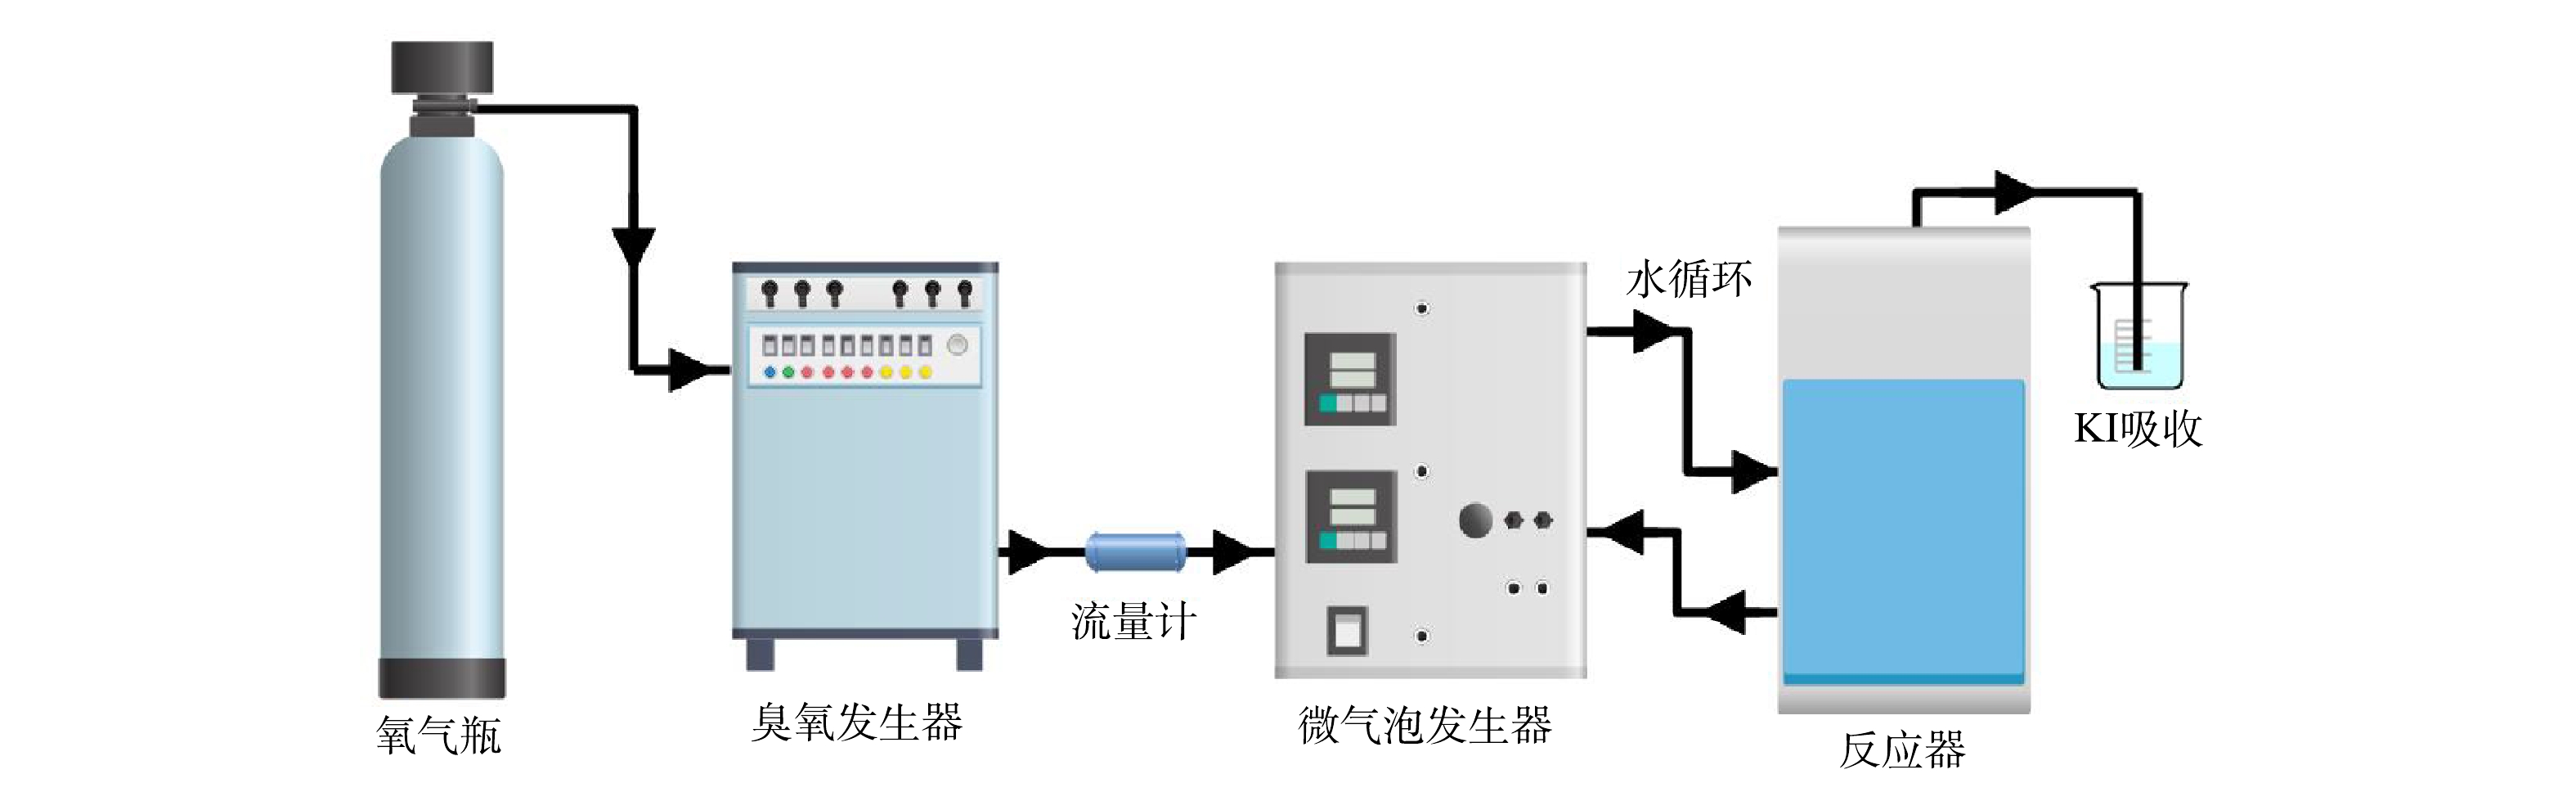
图 1 实验装置示意
Figure 1. Experimental apparatus
-
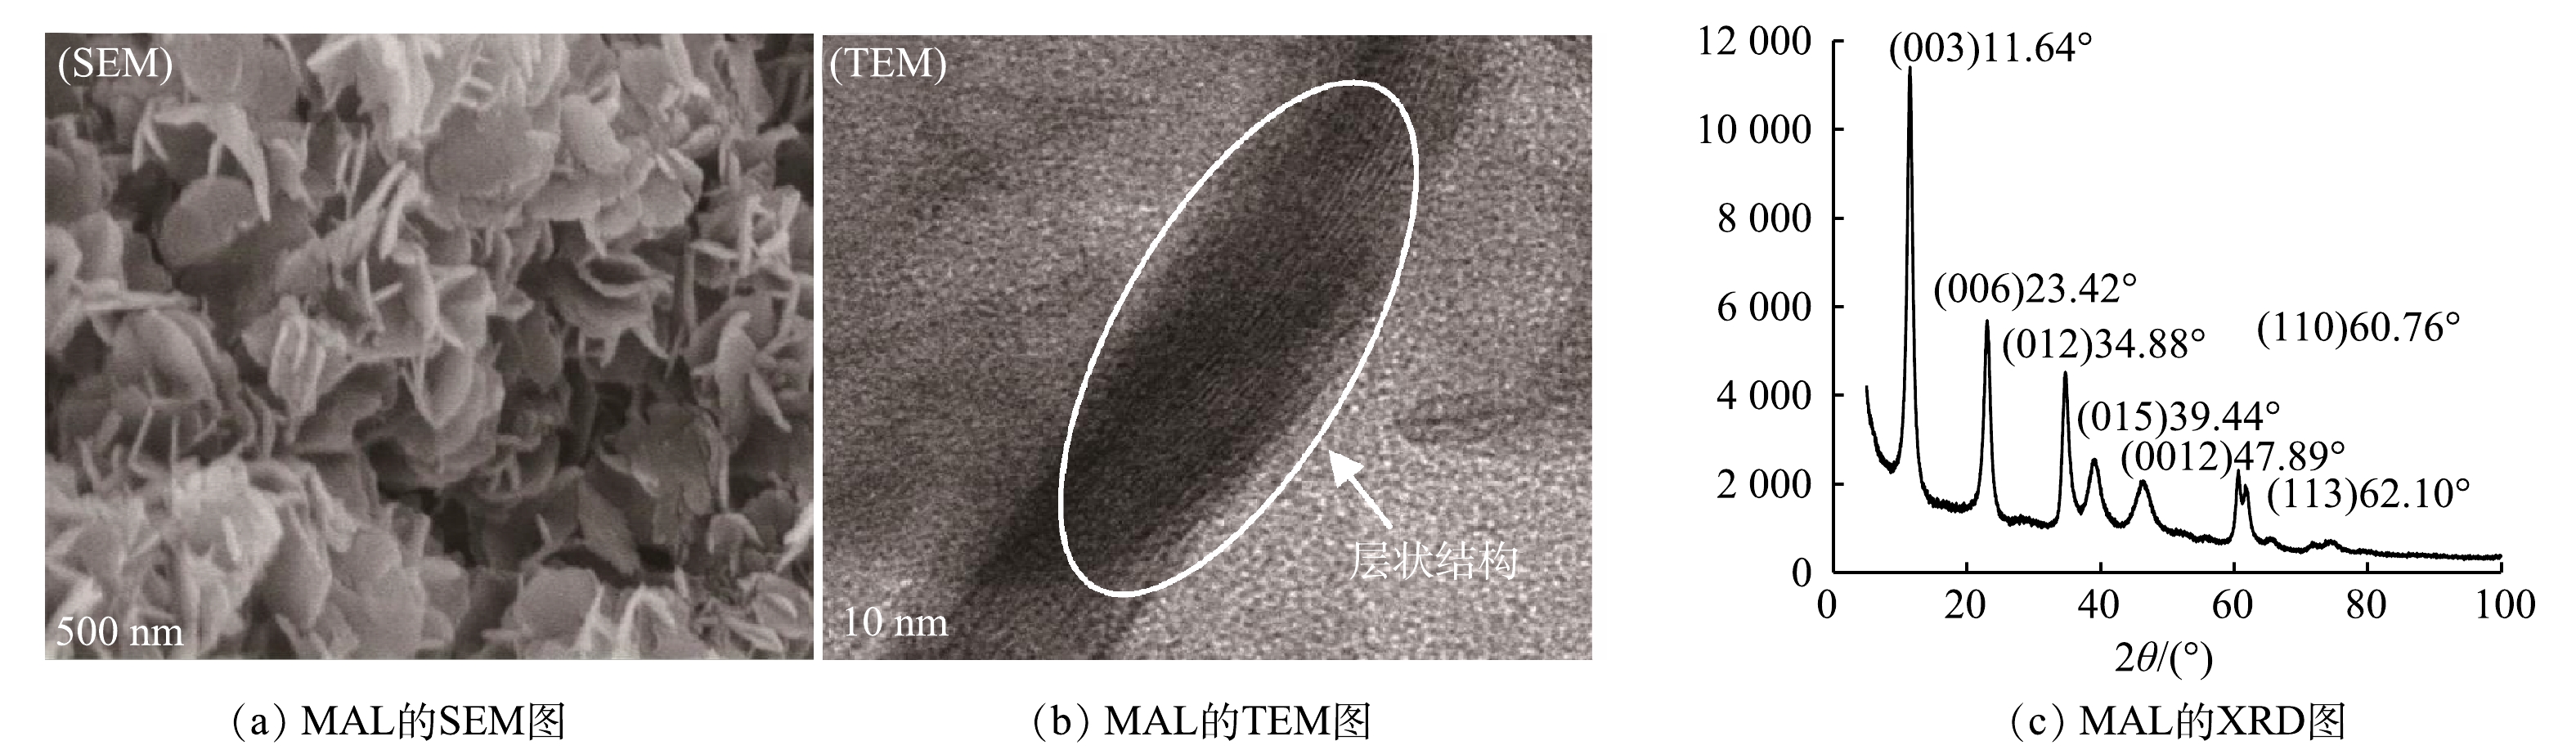
图 2 MAL形貌和结构观察
Figure 2. Observation of morphology and structure of MAL
-
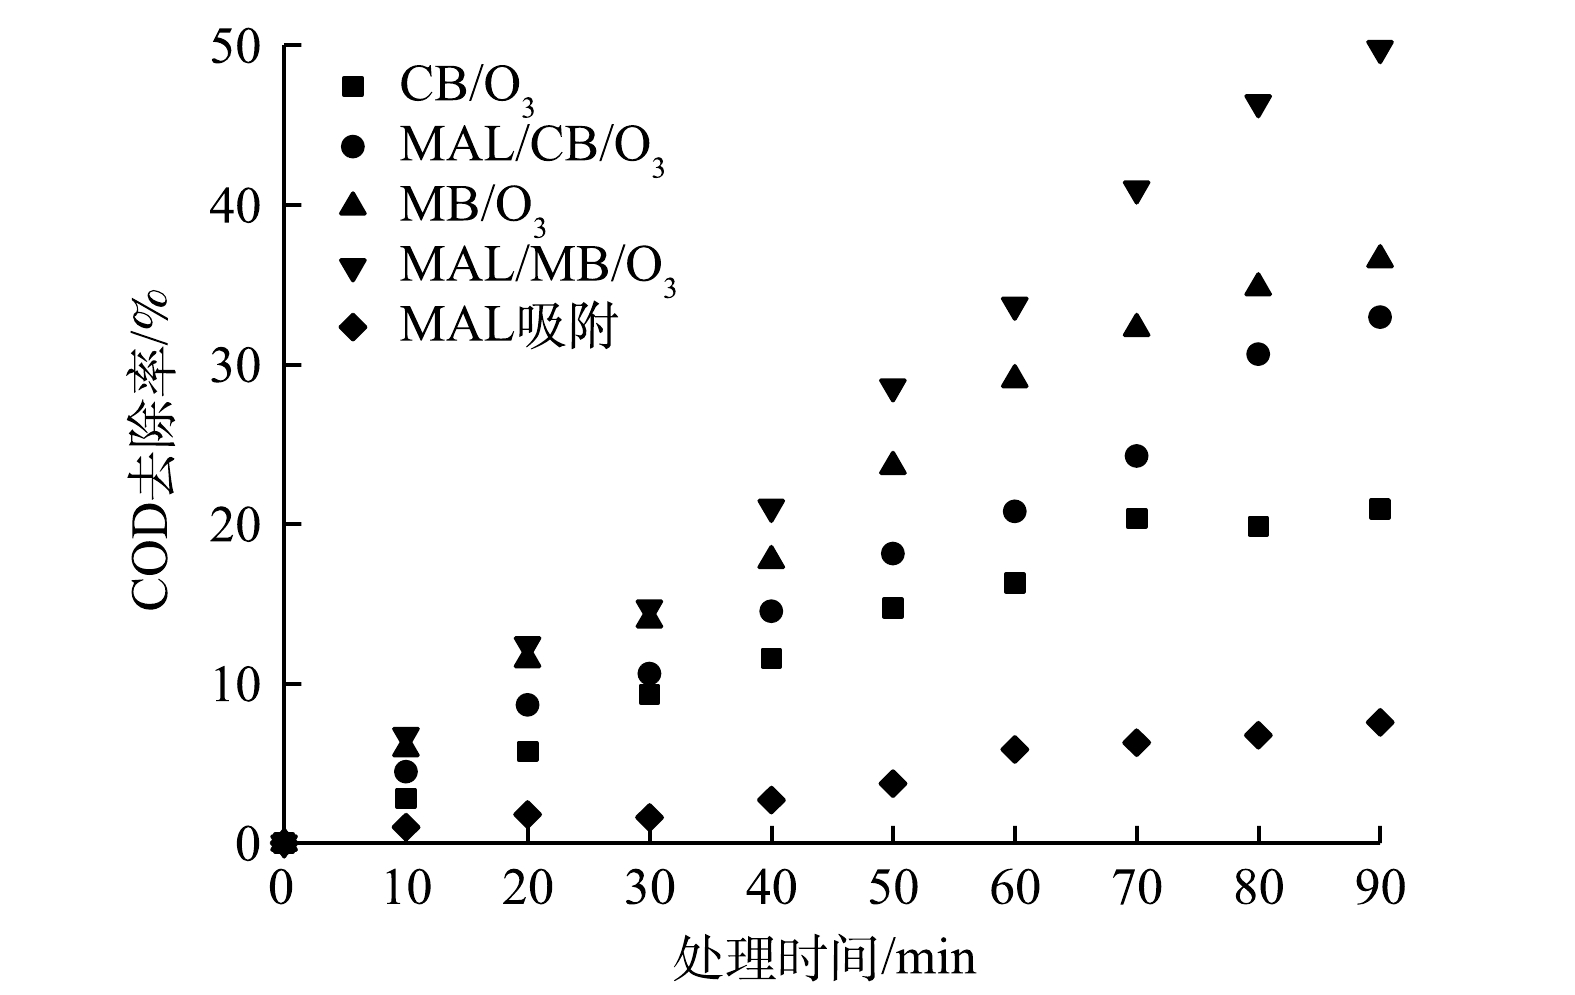
图 3 不同体系深度处理制药废水COD去除率
Figure 3. COD removal efficiencies of pharmaceutical wastewater by different advanced treatment systems
-
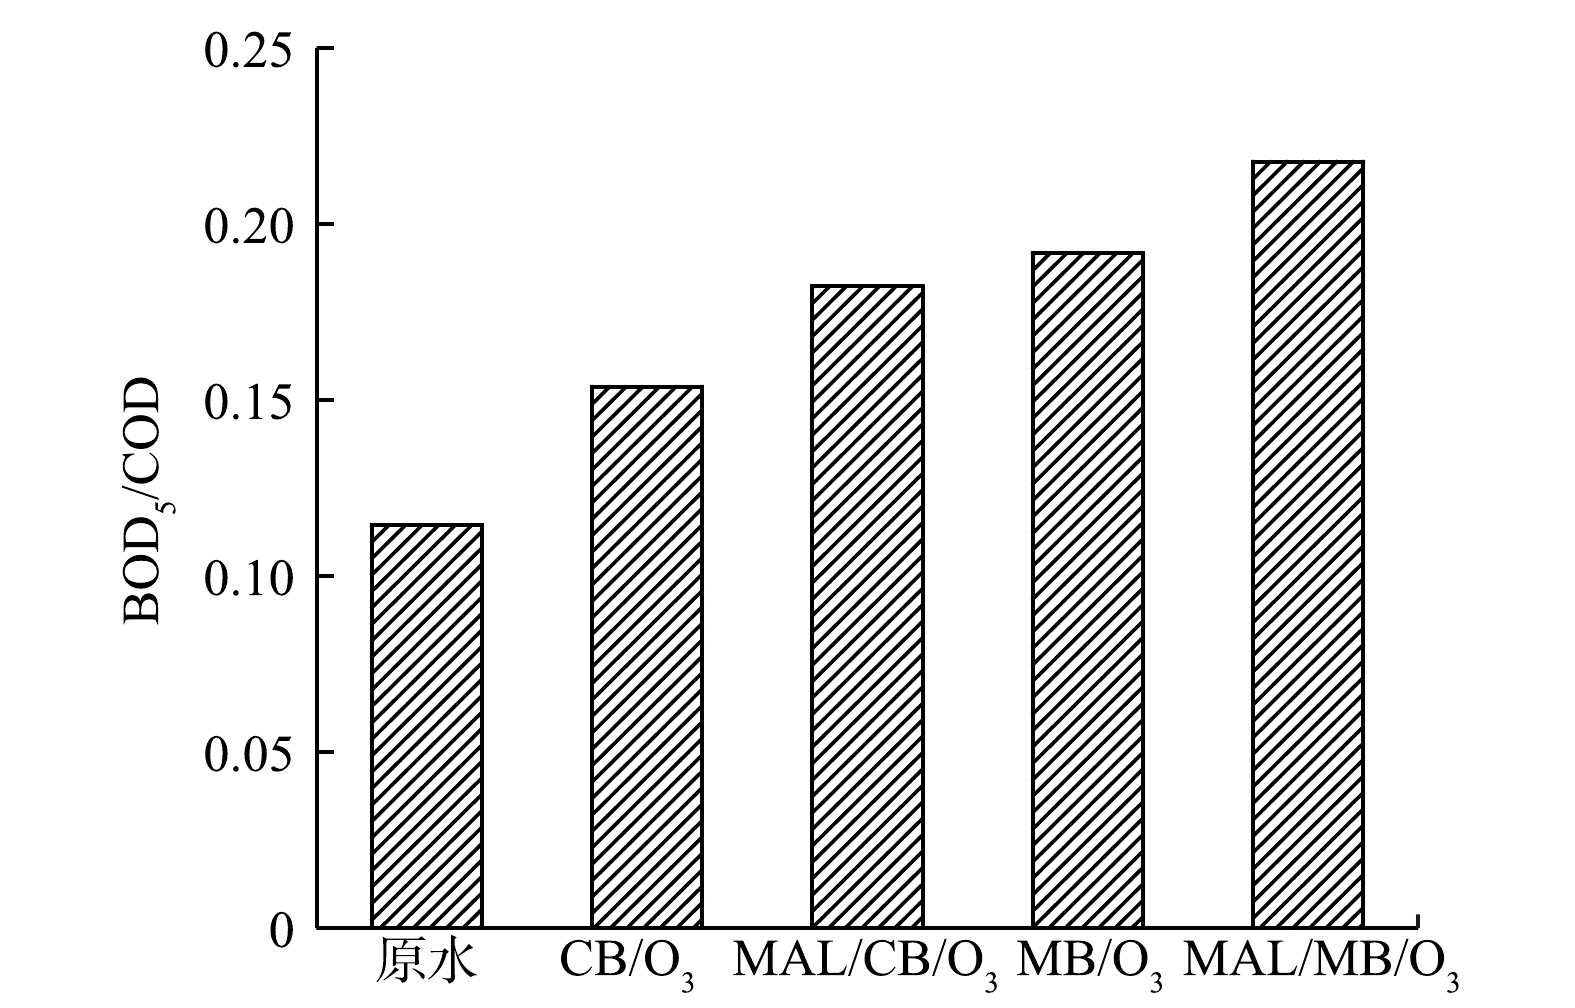
图 4 不同体系处理制药废水前后BOD5/COD值
Figure 4. BOD5/COD value of pharmaceutical wastewater before and after treatment by the different systems
-
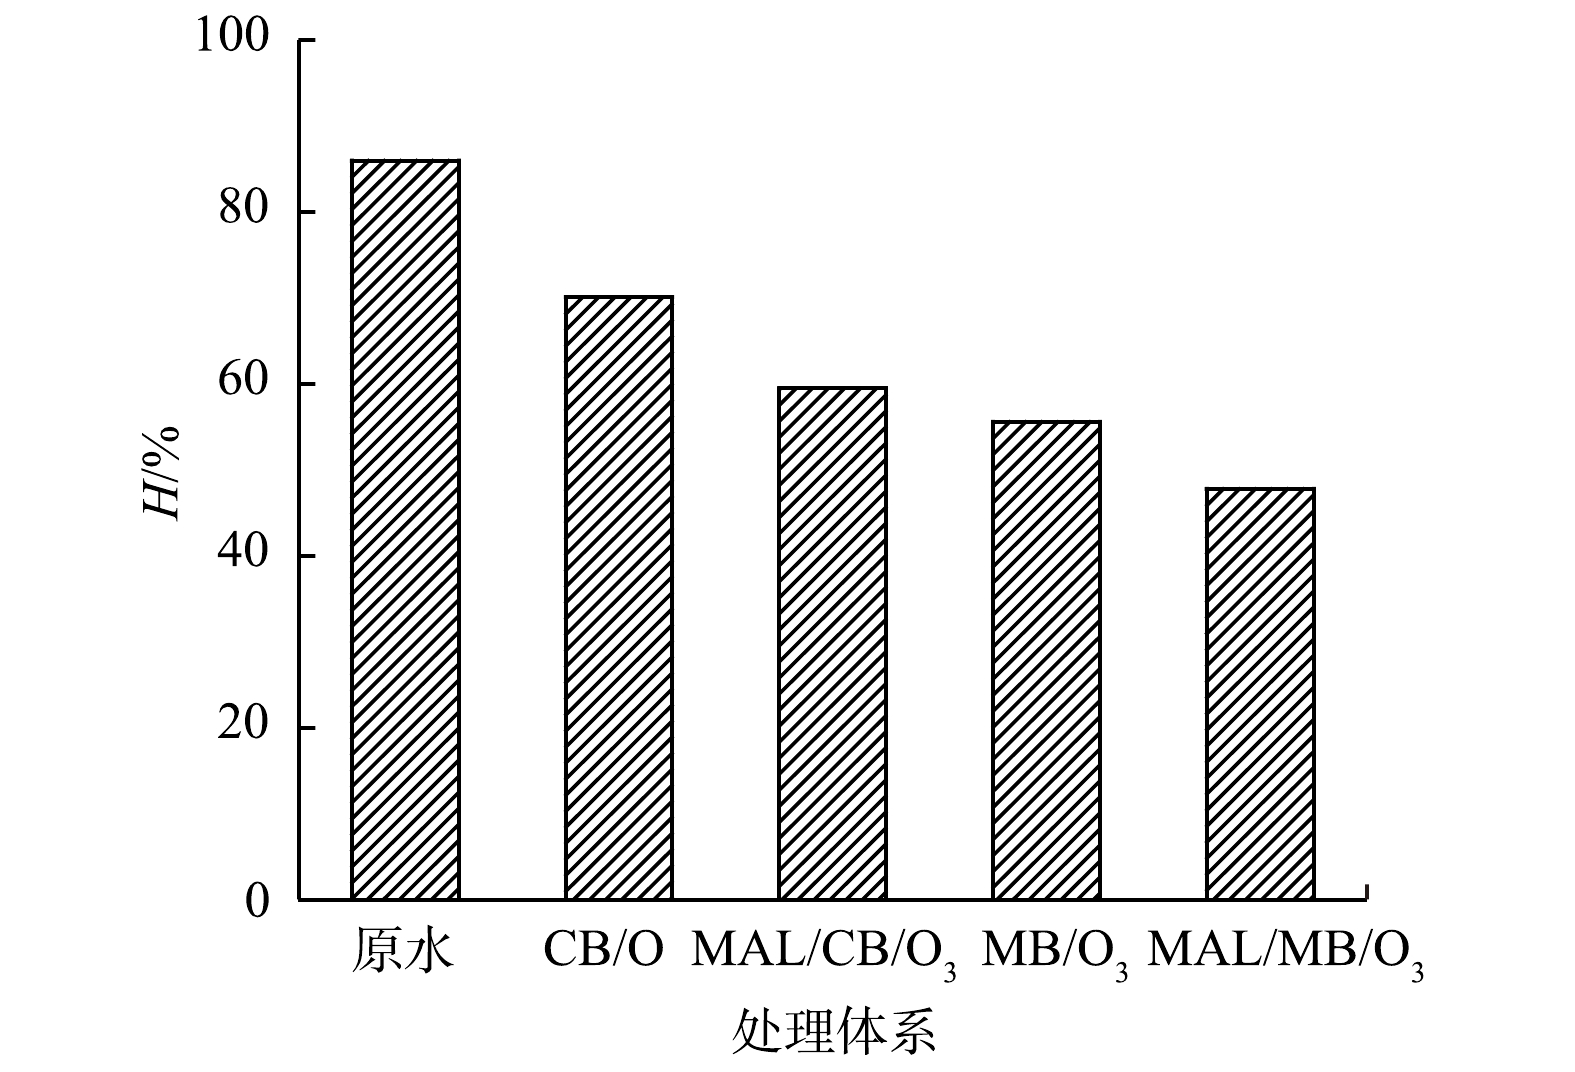
图 5 不同体系处理制药废水前后发光细菌抑制率
Figure 5. Inhibition rate of luminescent bacteria of pharmaceutical wastewater before and after treatment by the different systems
-

图 6 不同体系处理制药废水前后DOM组分变化情况
Figure 6. Changes in DOM components of pharmaceutical wastewater before and after treatment by the different systems
-
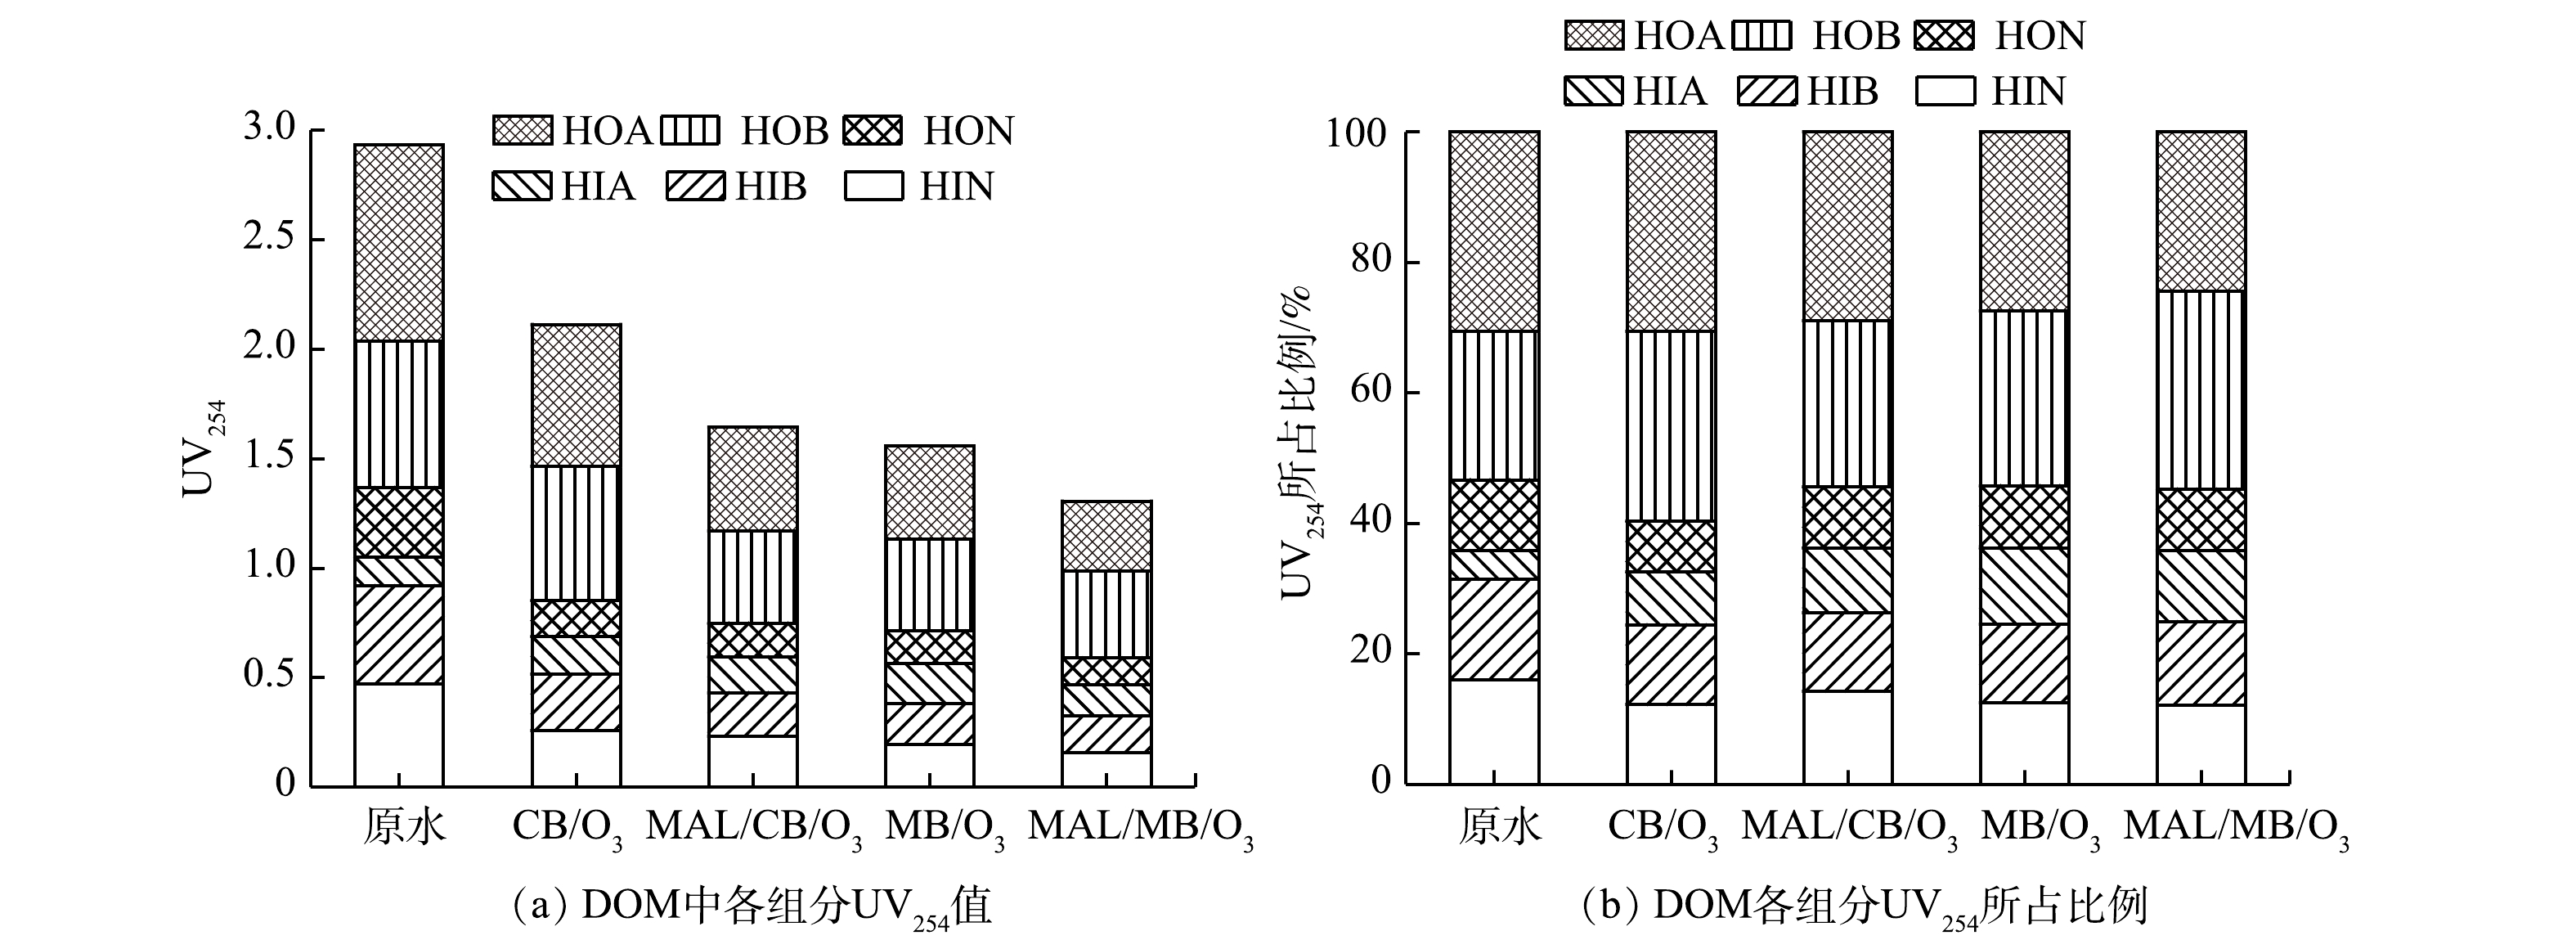
图 7 不同体系处理制药废水前后DOM组分UV254变化
Figure 7. UV254 values of DOM components of pharmaceutical wastewater before and after treatment by the different systems
-
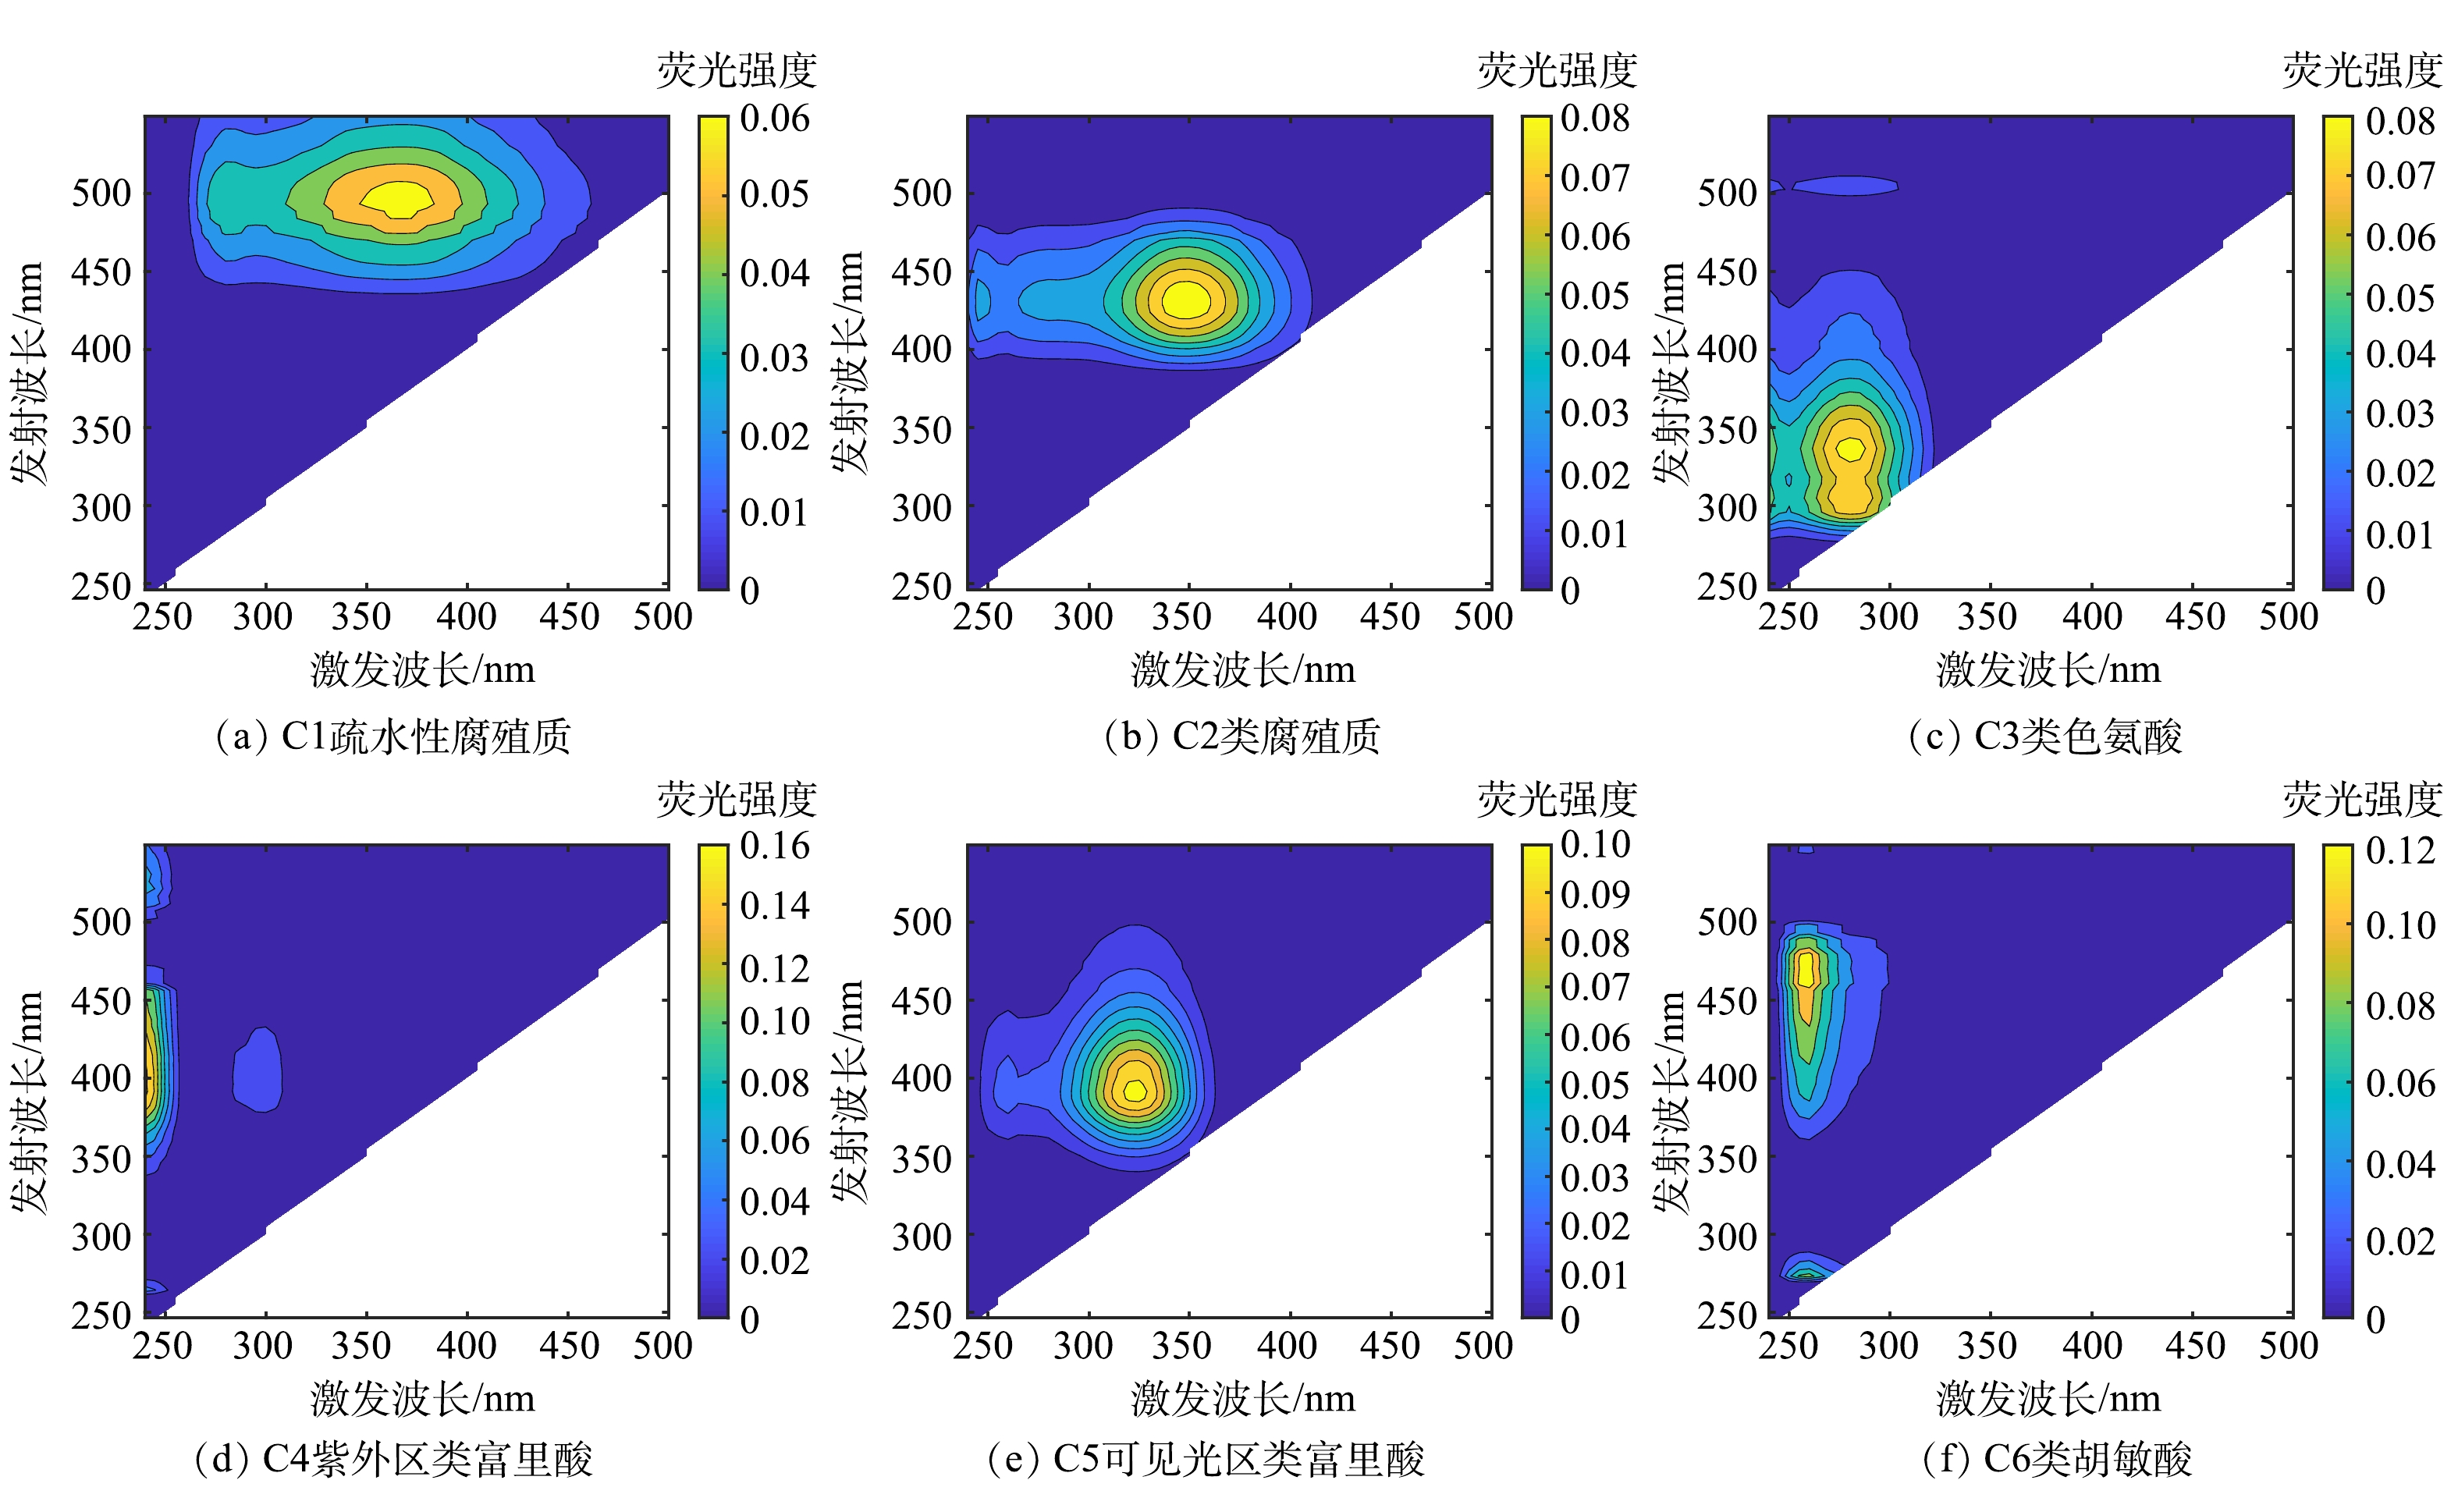
图 8 平行因子分析得出的6组分荧光光谱图
Figure 8. Fluorescence spectra of the six components based on PARAFAC analysis
-

图 9 不同体系中DOM组分荧光物质荧光强度变化率
Figure 9. Variation efficiency of fluorescence intensity of fluorescent substances in DOM components in different treatment systems
-
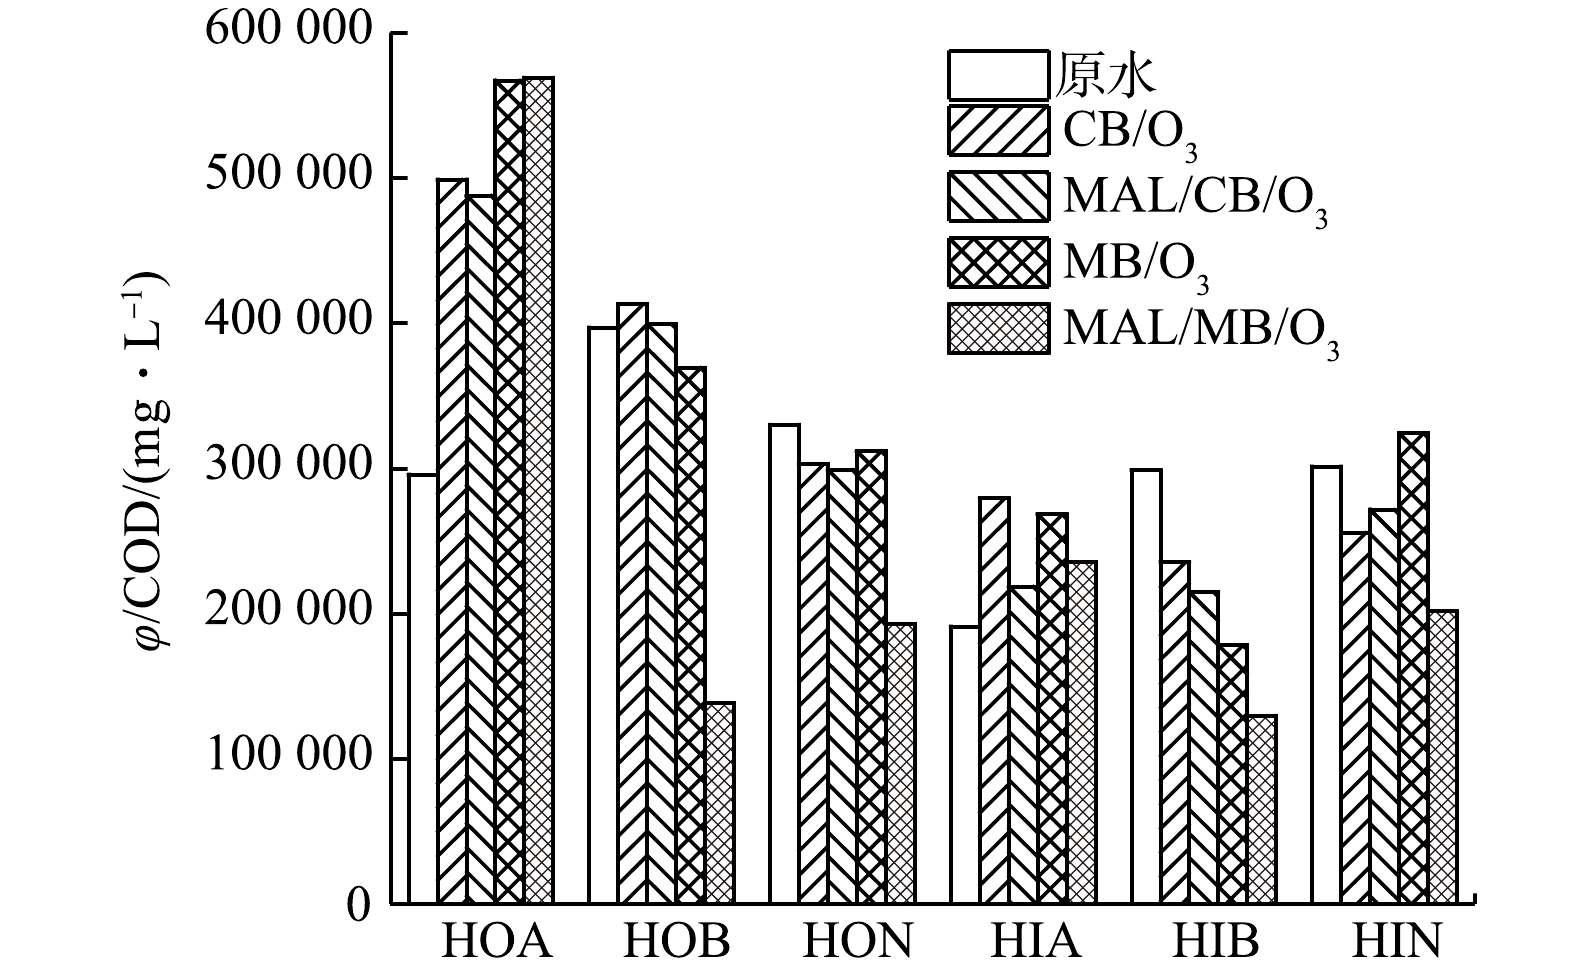
图 10 不同体系处理制药废水前后DOM组分荧光区域积分面积(φ值)与COD浓度比值
Figure 10. Ratios of integral area of fluorescence region (φ value) to COD concentration of DOM components of pharmaceutical wastewater before and after treatment by the different systems
Figure
10 ,Table
0 个