-

图 1 珠三角地区各城市的地理位置示意图
Figure 1. Geographical location of cities in the Pearl River Delta region
-
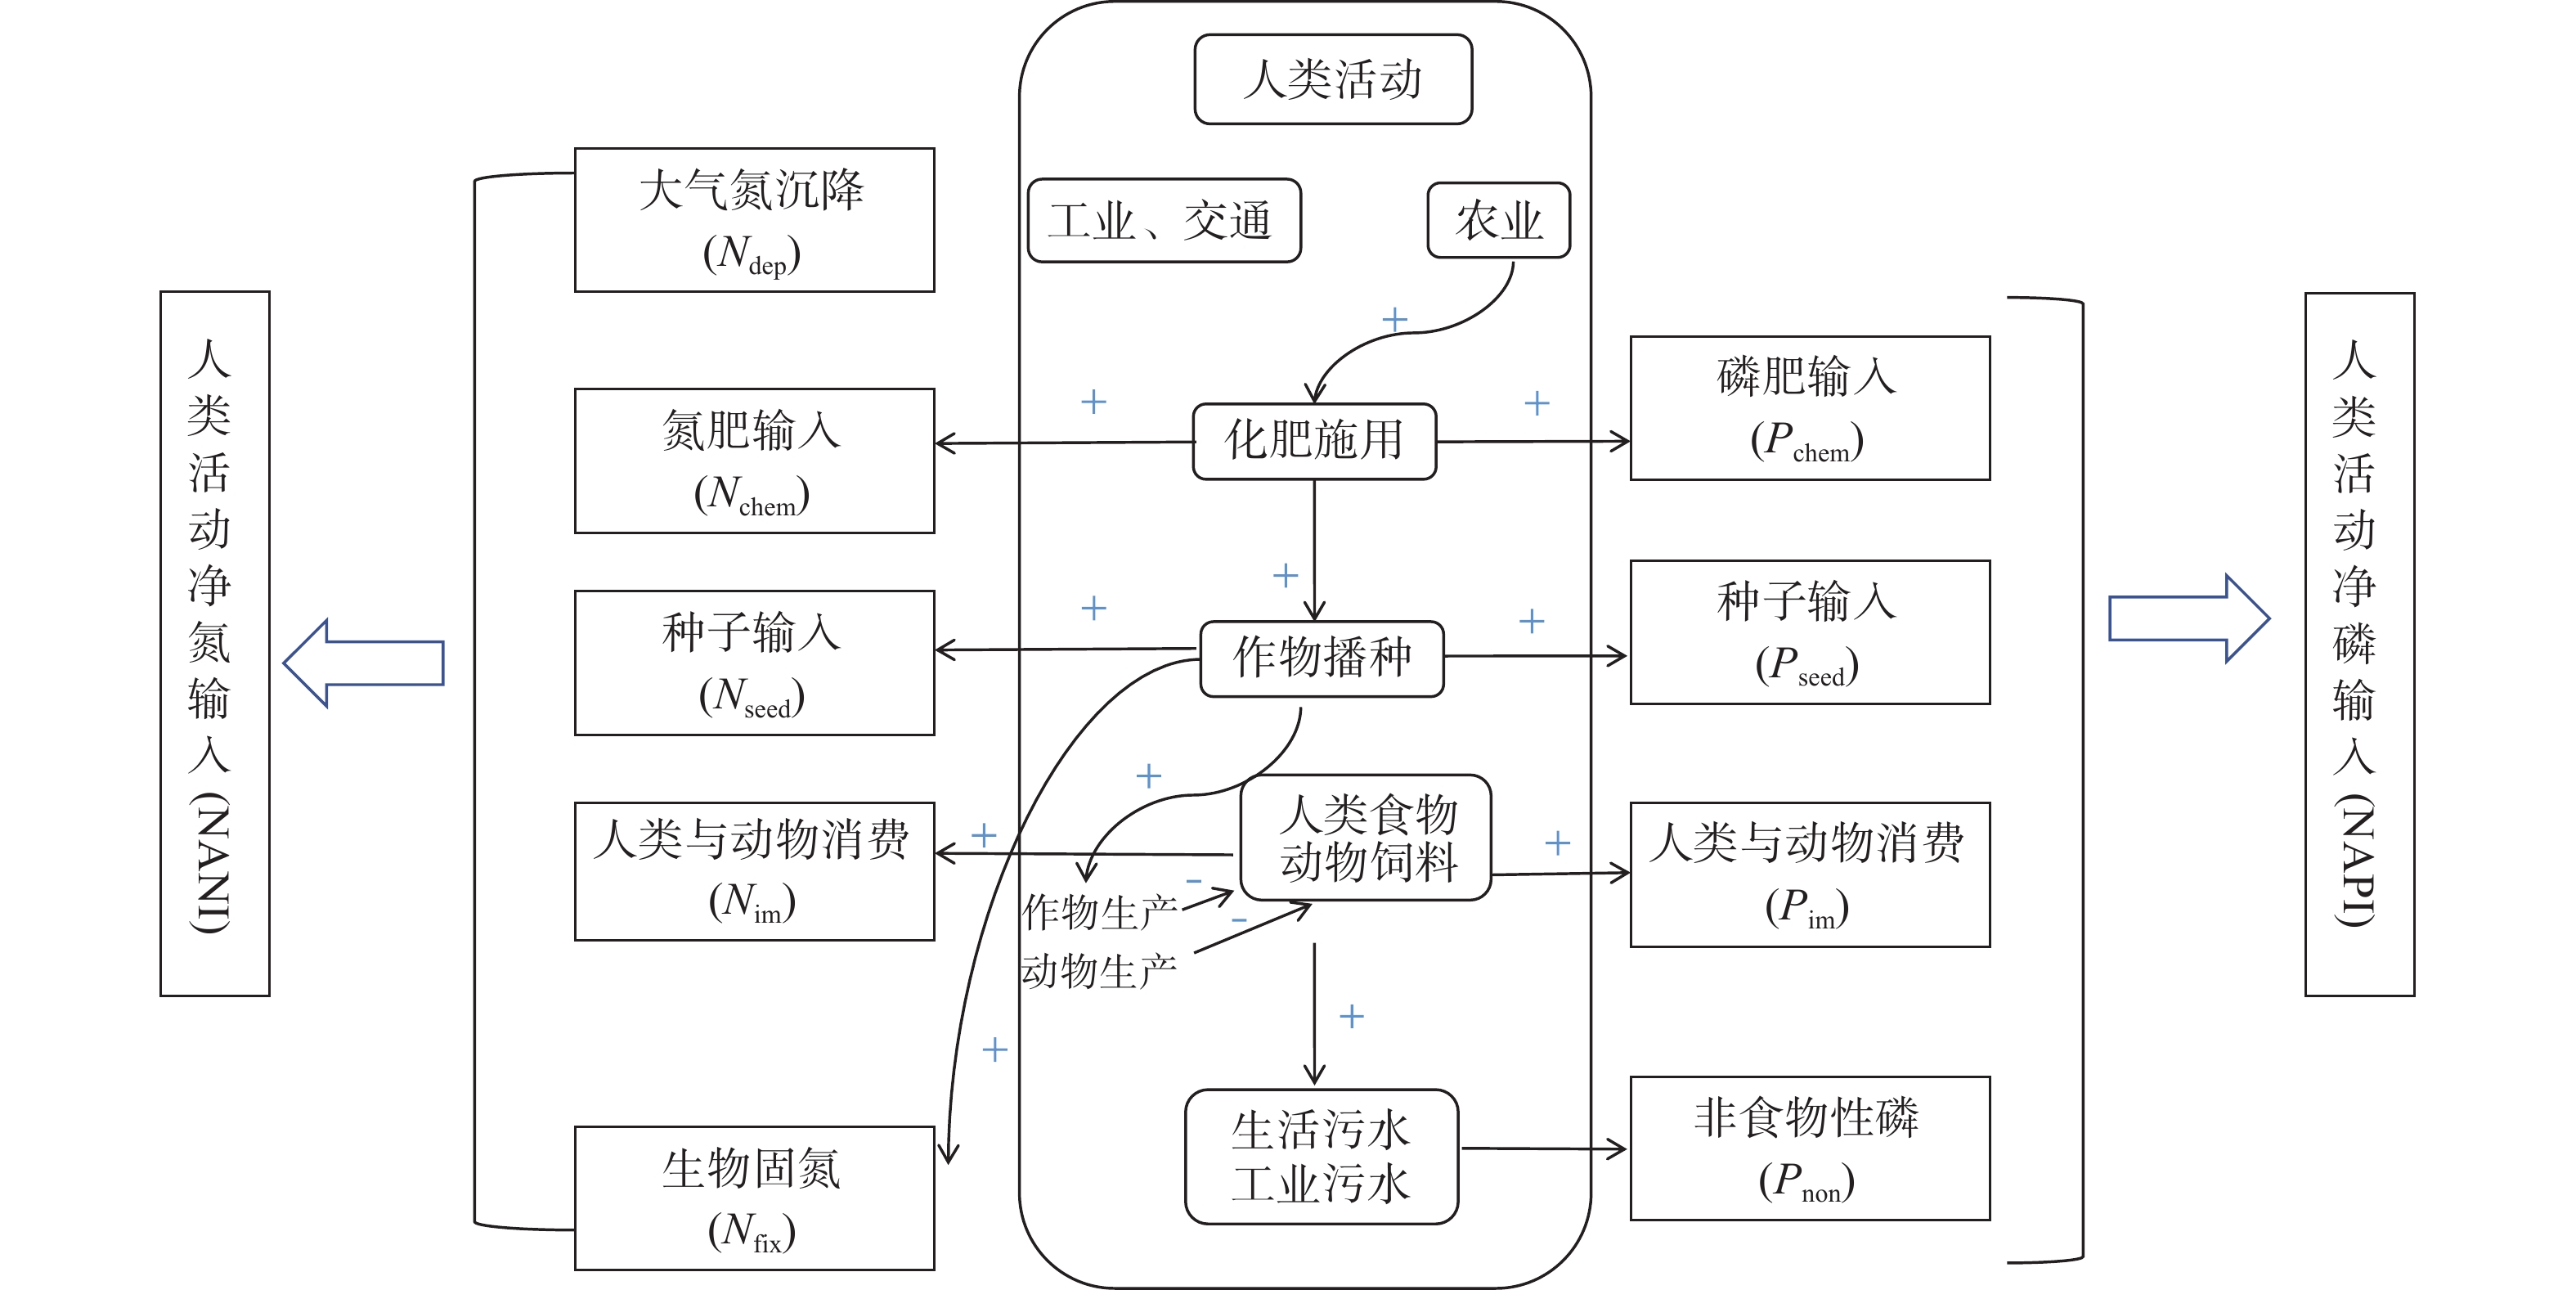
图 2 NANI、NAPI模型计算路径
Figure 2. Calculation path of NANI and NAPI models
-
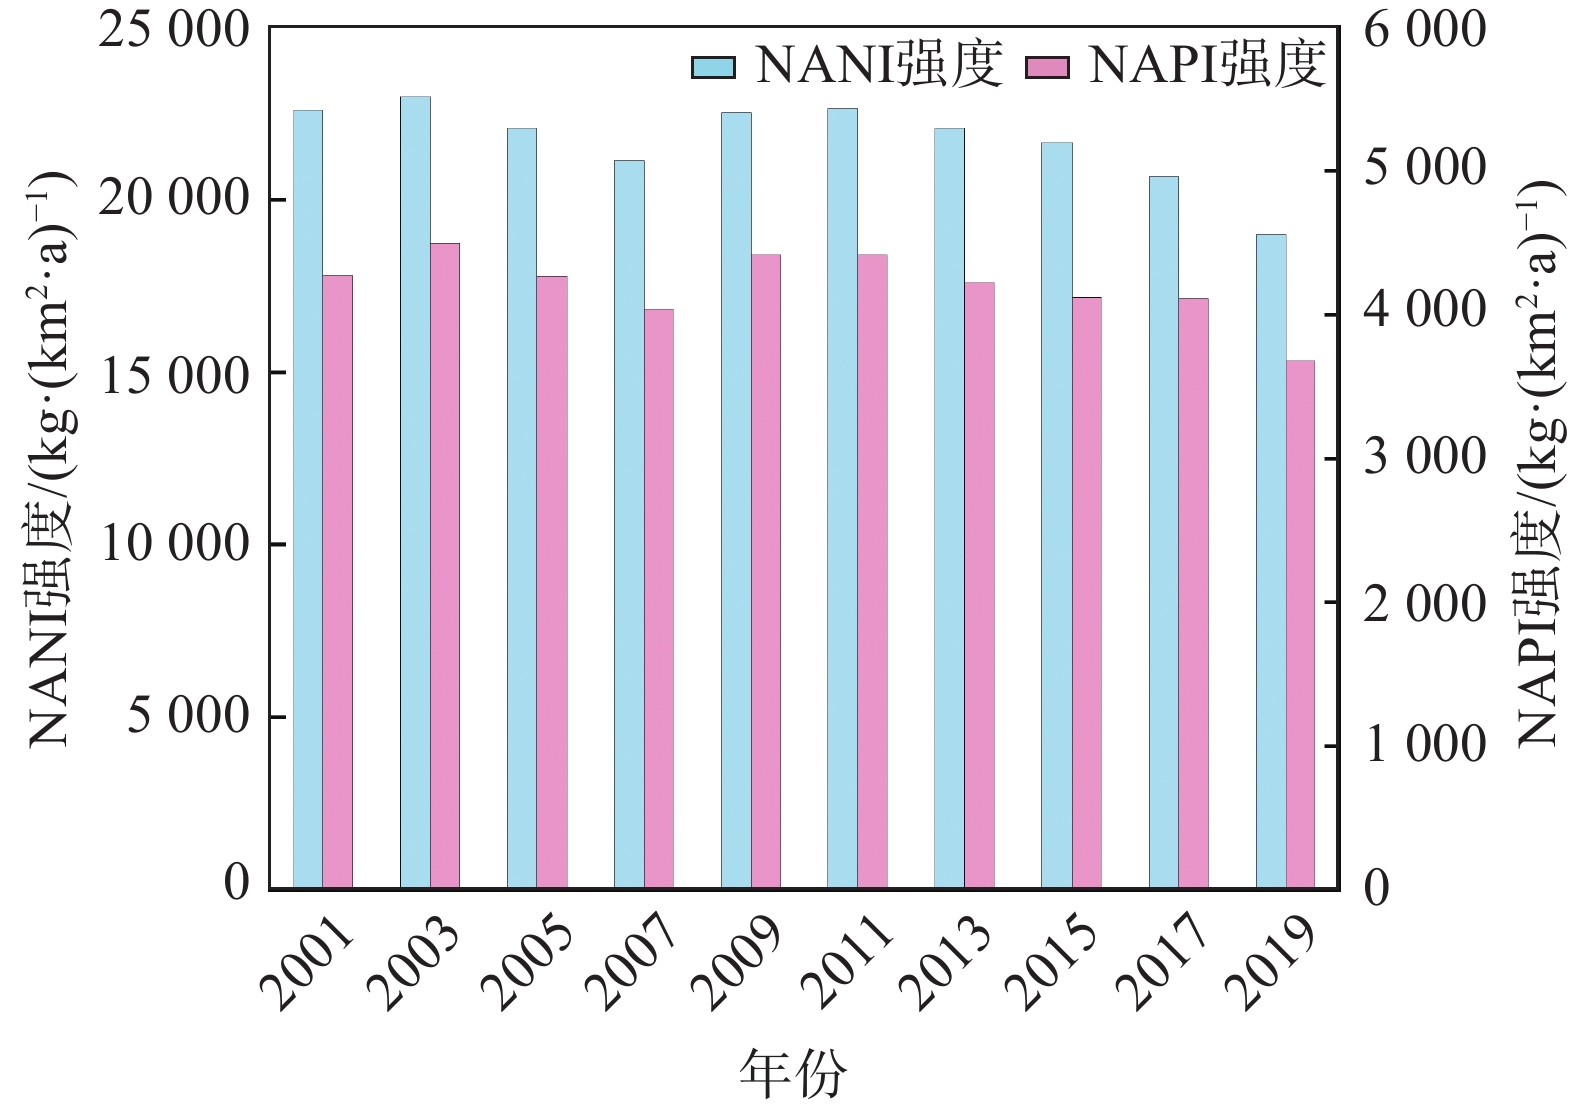
图 3 珠三角地区NANI、NAPI强度的年际变化
Figure 3. Interannual variation of NANI and NAPI intensity in the Pearl River Delta
-
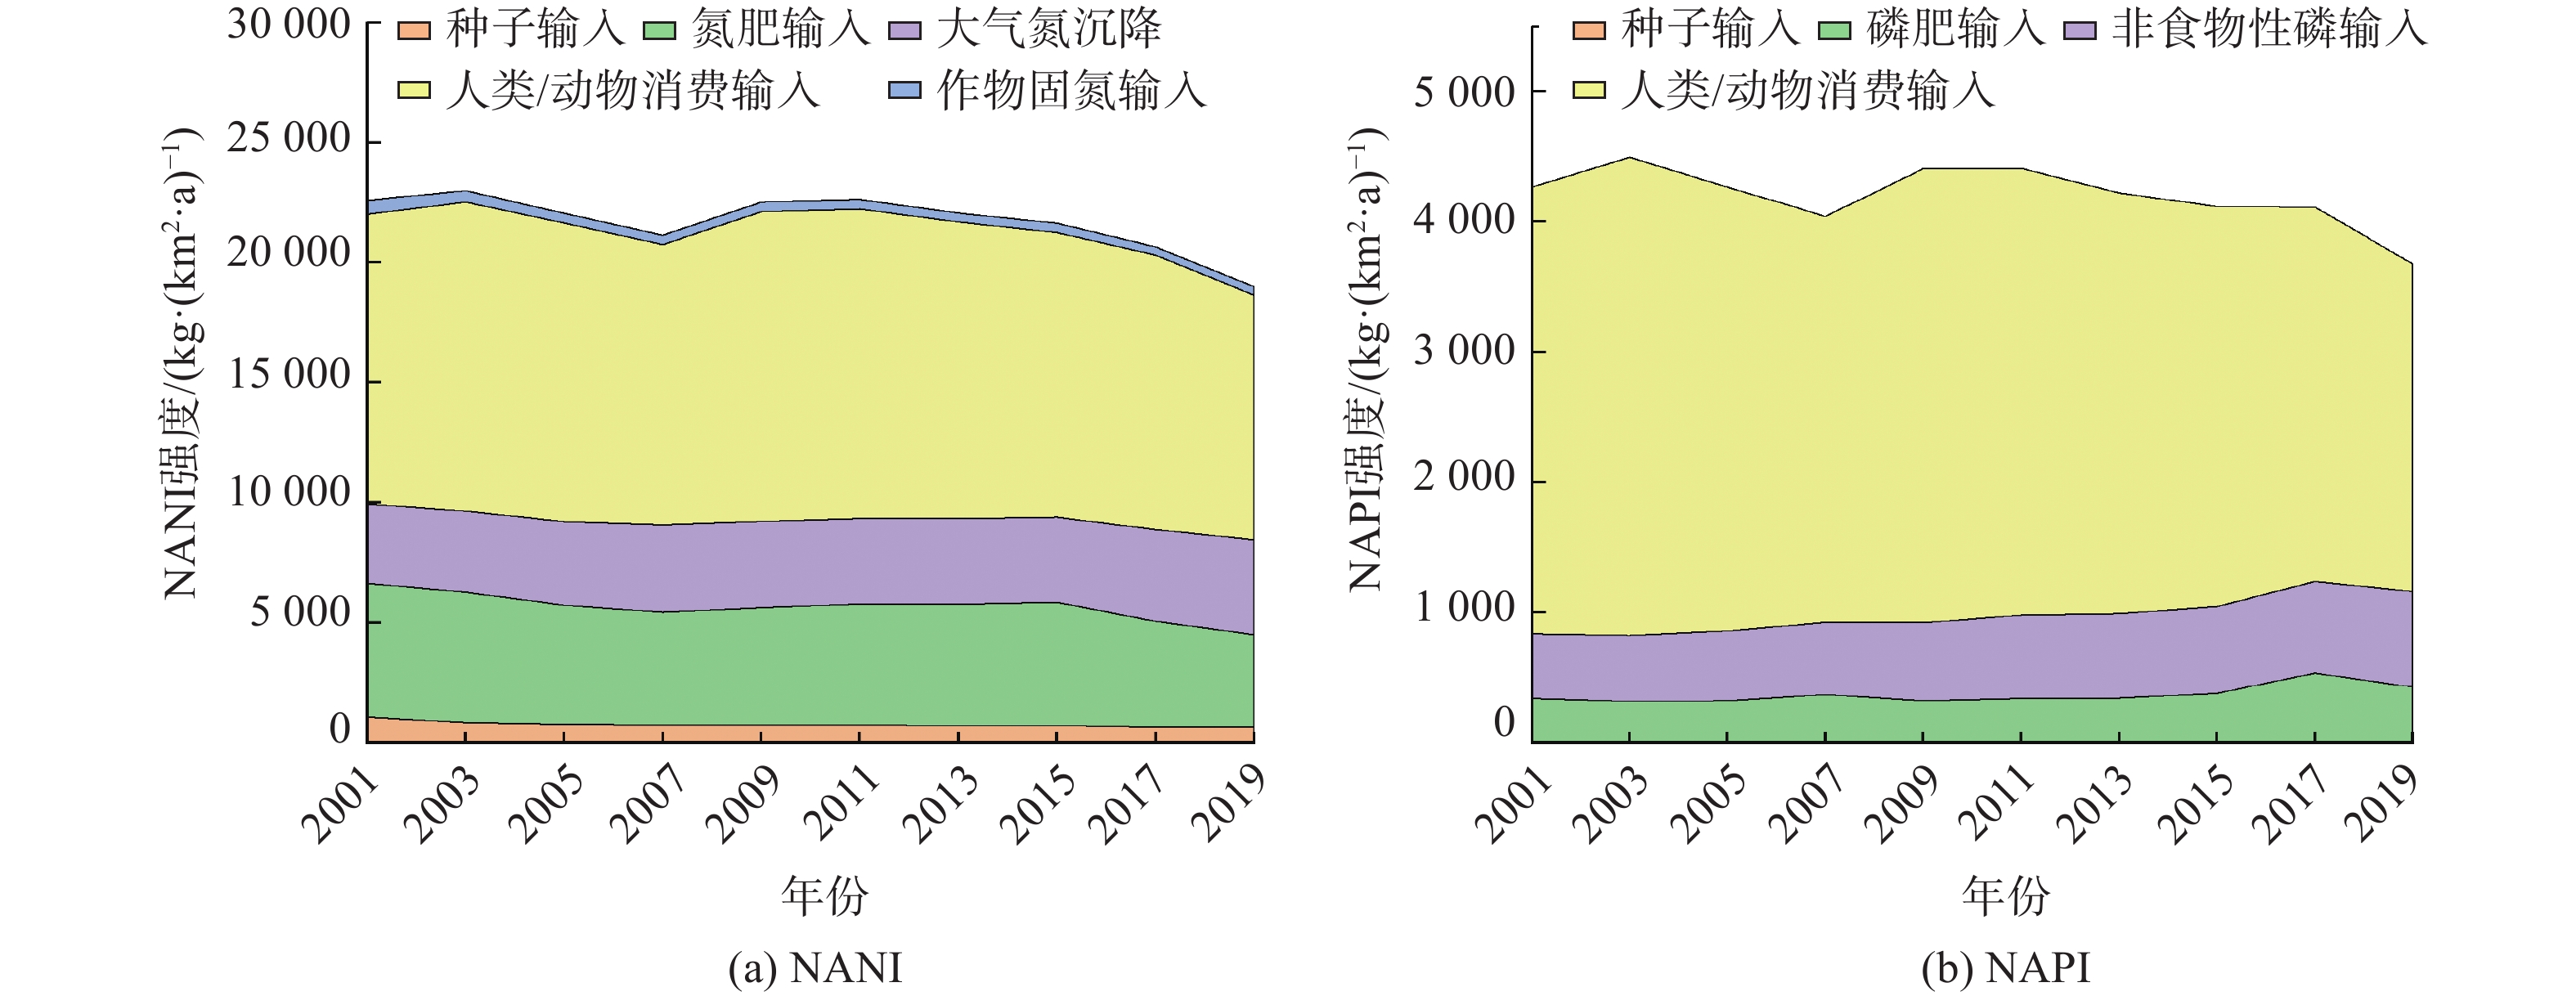
图 4 各来源人类活动氮磷输入量的时间变化
Figure 4. Temporal variation nitrogen and phosphorus input from human activities from various sources
-
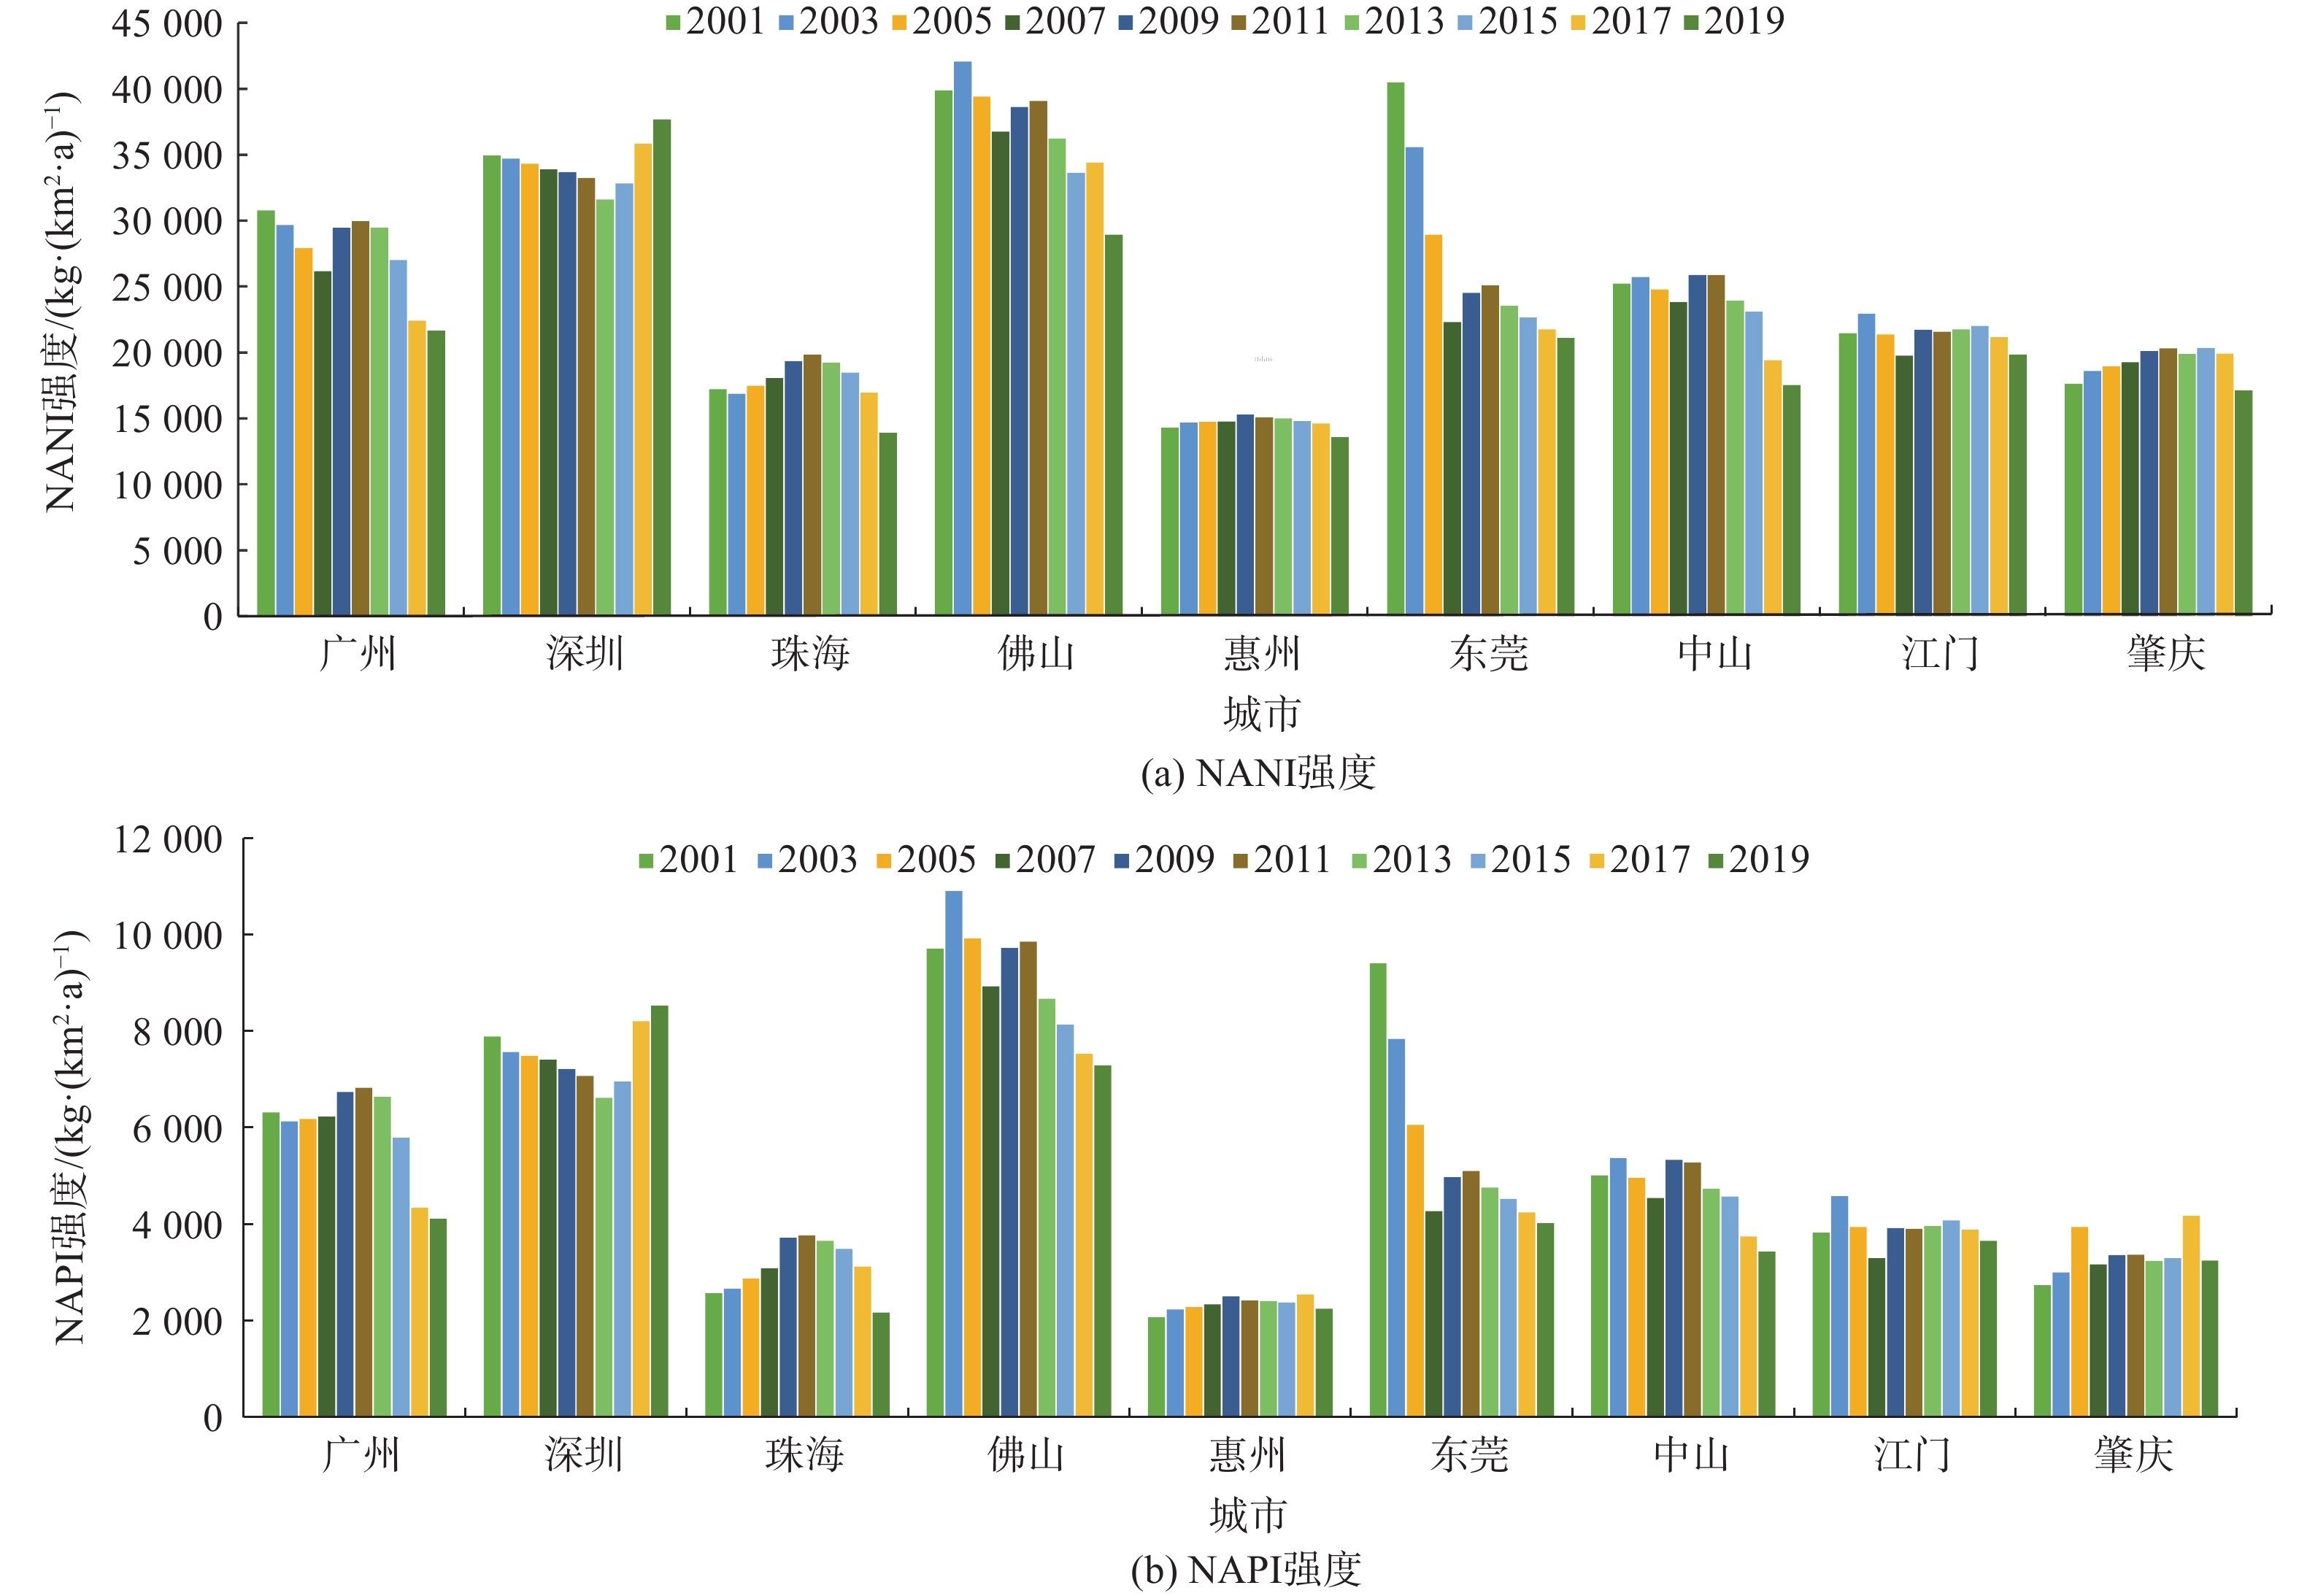
图 5 珠三角9市NANI、NAPI强度变化
Figure 5. Changes of NANI and NAPI intensity in 9 cities of the Pearl River Delta
-
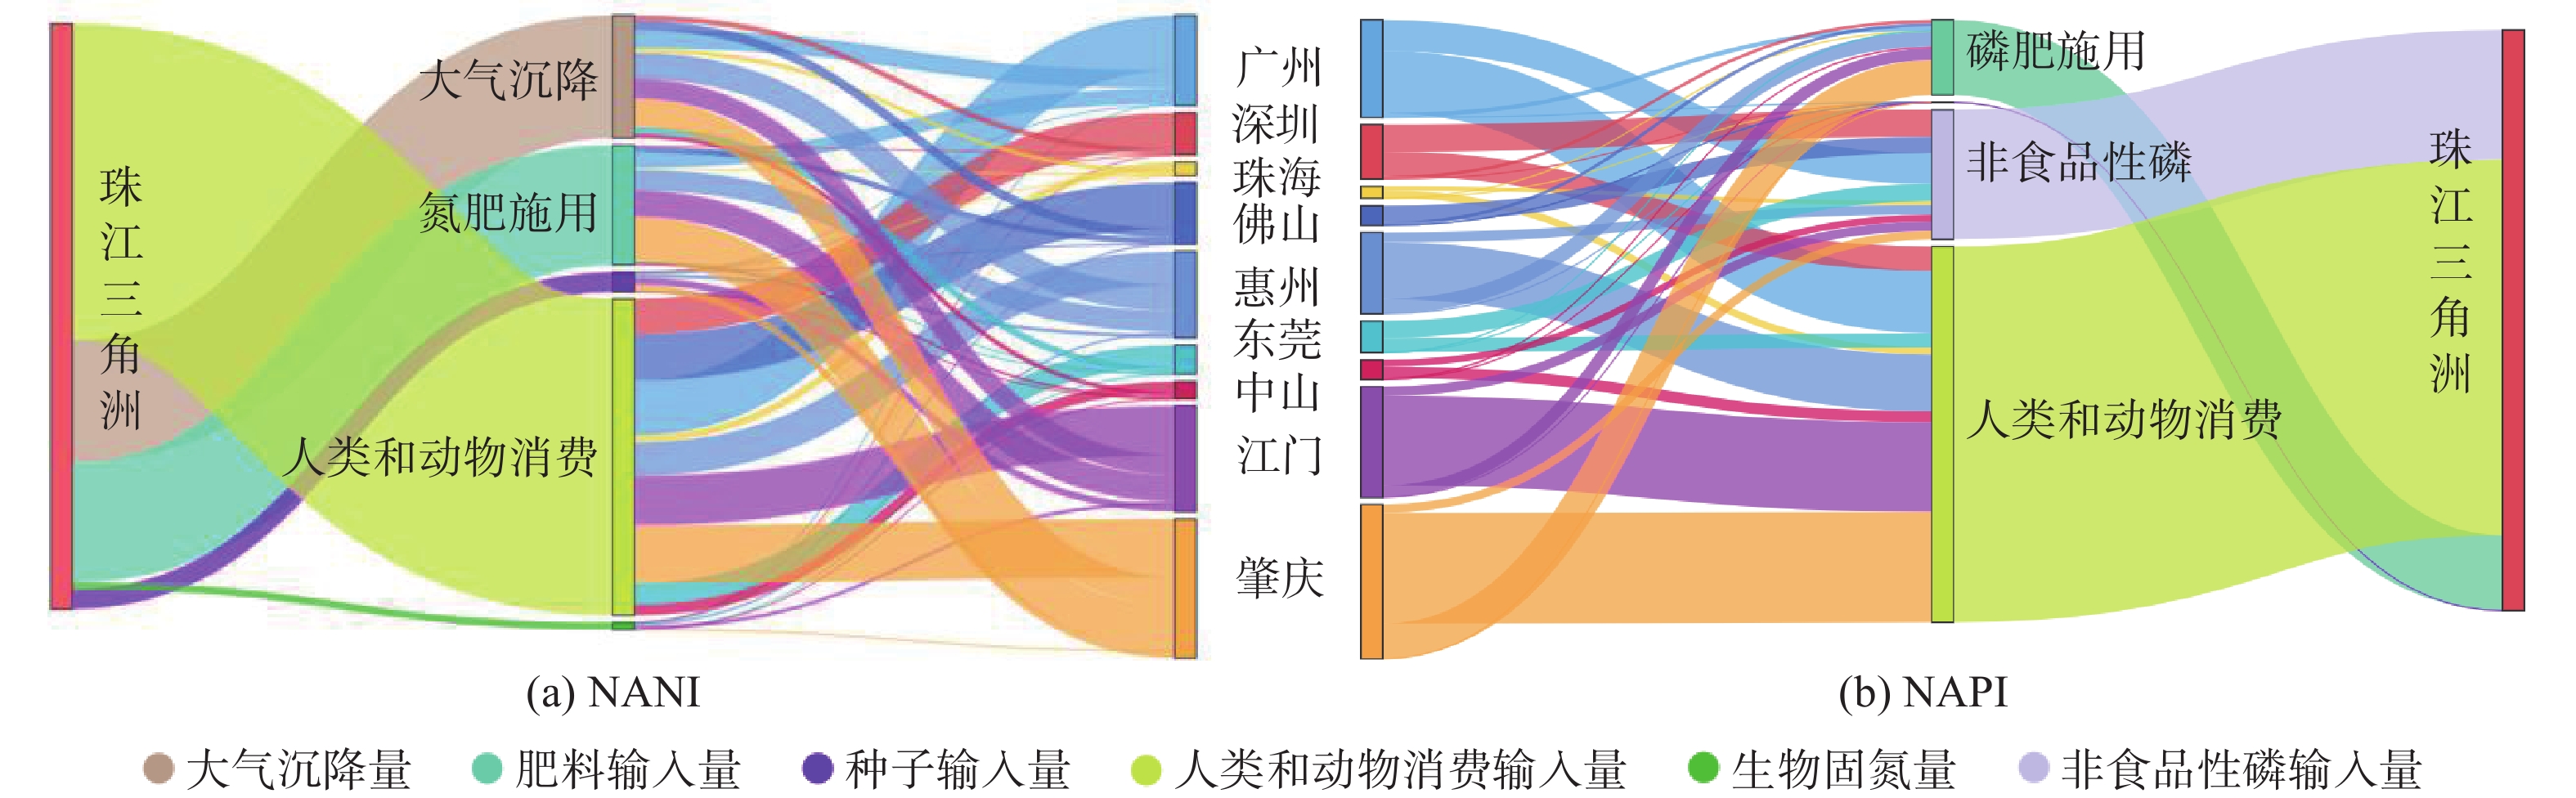
图 6 2019年珠三角地区人类活动净氮、磷输入途径
Figure 6. NANI and NAPI pathways in the Pearl River Delta in 2019
Figure
6 ,Table
4 个